")
Back to Journals » OncoTargets and Therapy » Volume 13
PKMYT1 Promotes Gastric Cancer Cell Proliferation and Apoptosis Resistance
Authors Zhang QY, Chen XQ, Liu XC, Wu DM
Received 27 March 2020
Accepted for publication 15 July 2020
Published 4 August 2020 Volume 2020:13 Pages 7747—7757
DOI https://doi.org/10.2147/OTT.S255746
Checked for plagiarism Yes
Review by Single anonymous peer review
Peer reviewer comments 2
Editor who approved publication: Dr Sanjeev K. Srivastava
Qi-Yong Zhang,* Xiao-Qin Chen,* Xiong-Chang Liu, De-Ming Wu
Department of Gastroenterology, The First People’s Hospital of Lanzhou, Lanzhou City, Gansu 730050, People’s Republic of China
*These authors contributed equally to this work
Correspondence: Xiao-Qin Chen Department of Gastroenterology
The First People’s Hospital of Lanzhou City, Number 1 Wu Jia Yuan West Road, Lanzhou, Gansu 730050, People’s Republic of China
Tel +86 931 233 7286
Email [email protected]
Background: Abnormal expression of protein kinase membrane associated tyrosine/threonine 1 (PKMYT1) is closely associated with multiple types of cancers. In the present study, we examined the roles of PKMYT1 in gastric cancer (GC) progression.
Methods: We examined the expression status of PKMYT1 in GC tissues and cell lines. Meanwhile, short hairpin RNA (shRNA) was used to inhibit the endogenous expression of PKMYT1 in GC cells. Then we analyzed the effect of PKMYT1 on the malignant biological behavior of GC cells by in vitro and in vivo experiments.
Results: The findings showed high PKMYT1 expressions in GC tissues as well as a positive correlation between PKMYT1 expression and prognosis of patients with GC. Additional findings also revealed that PKMYT1 silencing significantly enhanced apoptosis and inhibited GC cell proliferation. In vivo, the silence of PKMYT1 inhibits tumor growth. Further analysis showed that the increase in PKMYT1 expressions led to malignant biological behavior through activation of the MAPK signaling pathway.
Conclusion: Our data suggested that PKMYT1 promotes cell proliferation and apoptosis resistance in GC cells by activating the MAPK signaling pathway, making it a potential therapeutic target for GC.
Keywords: gastric cancer, PKMYT1, prognosis, proliferation, apoptosis, MAPK pathway
Introduction
Gastric cancer (GC) is the most common digestive cancer and has the third-highest mortality rate among all malignancies. According to the statistics, there were more than 1,000,000 new cases of GC and approximately 780,000 deaths from this disease in 2018.1 The incidence of GC is high in East Asia, including China. Although surgery-based therapeutic approaches can improve the long-term survival of patients with early-stage GC, the 5-year survival rate of patients with advanced-stage GC is low because of the lack of effective treatments.2 Therefore, studies aimed at understanding the molecular mechanism regulating GC and identifying novel and suitable therapeutic targets for the treatment of this disease are urgently needed.
The protein kinase membrane associated tyrosine/threonine 1 (PKMYT1) gene, located on 16p13.3 of human chromosome 16, encodes an important protein belonging to the Wee kinase family. PKMYT1 is a membrane-associated bispecific protein kinase that can regulate cell cycle by phosphorylating Thr14 and Tyr15.3–5 In mammalian somatic cells, PKMYT1 affects the assembly of the Golgi apparatus and endoplasmic reticulum during telophase of mitosis by inhibiting cyclin activities.6,7 Abnormal expression of PKMYT1 is closely associated with multiple types of cancers. However, the role and mechanism of PKMYT1 in GC progression remain unclear. A recent study showed that microglobulin 1 (MCRS1) interacts with PKMYT1 in GC.8 MCRS1 has low expression in GC and exerts inhibitory effect on PKMYT1, promoting the proliferation, invasion, migration, and epithelial-mesenchymal transition (EMT) of GC cells. Thus, PKMYT1 may play a tumor-promoting role in the progression of GC. In the present study, we examined the roles of PKMYT1 in GC progression and clarified the effects of PKMYT1 on the malignant biological behaviors of GC cells.
Materials and Methods
Bioinformatics Analysis
The expression of PKMYT1 in common digestive cancers and GC was predicted using a gene expression profiling and interactive analyses tool (GEPIA; http://gepia.cancer-pku.cn/).9 GEPIA is a web-based tool that provides information on differential gene expression in tumors and normal tissues, correlation analysis, and patient survival analysis based on extensive RNA sequencing data. In addition, the Kaplan–Meier Plotter (http://kmplot.com/analysis/) containing 54,675 genes and 10,461 cancer samples, including 1065 GC samples, was used to assess the effects of PKMYT1 on the survival rate of patients with GC.10
Tissue Samples and Cell Culture
A total of 103 paraffin-embedded GC samples (including cancer tissues and matched adjacent tissues (>3 cm away from cancer tissue)) were collected from patients with GC who underwent treatment at The First People’s Hospital of Lanzhou City between January 2010 and December 2013. All patients were pathologically diagnosed and their complete clinicopathological data and follow-up information were available. Of the 103 patients with GC, there were 56 males and 47 females aged 35–78 years, with a mean age of 56.8 ± 12.3 years. In addition, another 10 pairs of fresh GC tissue and adjacent tissue samples were collected and frozen at −80°C. No patients had been administered chemotherapy, radiotherapy, or targeted therapy. This study was strictly conducted according to the Declaration of Helsinki and was approved by the Ethics Committee of The First People’s Hospital of Lanzhou City. Written informed consent was obtained from all patients with GC involved in this study for the collection of tissue samples.
The normal gastric mucosal epithelial cell line GES-1 and the GC cell lines AGS, HGC27, MKN45, and BGC-823 were purchased from the American Type Culture Collection (Manassas, VA, USA). The cells were maintained in Dulbecco’s modified Eagle medium supplemented with 10% fetal bovine serum, 1 × 10⁵ U/L penicillin, and 100 mg/L streptomycin at 37°C in an incubator with 5% CO2. The culture medium was changed every other day. Cell passaging was performed when the cells reached 80–90% confluency. PKMYT1 expression in the cell lines was detected by Western blotting. The cell line showing the highest PKMYT1 protein expression was selected for subsequent functional assays.
Immunohistochemistry (IHC)
The paraffin-embedded GC tissues and adjacent tissues were subjected to IHC. Briefly, the tissue block was cut into 4-μm-thick sections, dewaxed, and hydrated at 70°C in an oven. Next, 3% H2O2 was added to the sections to block endogenous peroxidase activity. The sections were placed in citrate buffer (pH 6) at 95°C for antigen retrieval and were then incubated with primary anti-PKMYT1 antibody (1: 100; Cell Signaling Technology, Danvers, MA, USA) at 4°C overnight. On the next day, the sections were reacted with secondary antibodies and stained with diaminobenzidine (Vector Laboratories, Burlingame, CA, USA). After counterstaining with hematoxylin, the slides were mounted.
The immunoreaction score for PKMYT1 was determined as the staining intensity of tumor cells multiplied by the positive staining degree. The staining intensity of tumor cells was scored as follows: 0 (negative), 1 (weak), 2 (moderate), and 3 (strong). The positive staining scores were as follows: 0 (0%), 1 (1–25%), 2 (26–50%), 3 (51–75%), and 4 (76–100%). According to the immunoreaction score, a score of ≥4 was defined as high expression of PKMYT1, whereas a score of <4 was defined as low expression of PKMYT1.
Inhibition of PKMYT1 Expression by shRNA
A short hairpin RNA (shRNA) lentiviral vector was constructed to inhibit the expression of endogenous PKMYT1 in GC cells. The sequence of shRNA targeting PKMYT1 was as follows – shPKMYT1 #1: CCGGTGTCAAGCCTGCCAACATC TTCTCGAGAAGATGTTGGCAGGCTTGACATTTTTG; shPKMYT1 # 2: CCGGG AACCTGGATTCTCCCTCAAGCTCGAGCTTGAGGGAGAATCCAGGTTCTTTTTG. The shRNA sequence of the negative control (shNC) was GGCCTTGGACTCG GACTCCCTACATCCGGTATGCATCGATTCCGCAGGTCGTACCTAG. The above plasmids were transfected into pGLVU6/Puro vector (GenePharma Corporation, Shanghai, China). Lipofectamine 3000 transfection reagent (Thermo Fisher Scientific, Waltham, MA) was used for transfection according to the manufacturer’s instructions. Puromycin was subsequently used to select stable cell lines with suppressed expression of PKMYT1. The rate of suppression of PKMYT1 expression was determined by Western blotting.
Western Blotting
Tissue samples were fully ground and lysed by adding an appropriate amount of liquid nitrogen, followed by protein extraction using a total protein extraction kit (Sigma-Aldrich, Inc., Dorset, UK). For cell samples, a total protein extraction kit (Sigma-Aldrich) was directly used to extract proteins. After protein denaturation and measurement of protein concentration, the protein samples were electrophoresed on sodium dodecyl sulfate-polyacrylamide gel and then transferred onto nitrocellulose membranes, which were incubated with appropriate primary antibodies at 4°C overnight. After washing three times (15 min each time) with TBST, the membranes were reacted with secondary antibody at room temperature for 1 h and then washed again as described above. A chemiluminescence kit (EZ-ECL, Biological Industries, Cromwell, CT, USA) was used according to the manufacturer’s instructions to visualize the results. Finally, a ChemiDoc XRS system (Bio-Rad Laboratories, Hercules, CA, USA) was used to detect the expression of the target protein. GAPDH (Bioworld Technology, Minneapolis, MN, USA) was used as the loading control. The antibodies used for Western blotting were as follows: anti-PKMYT1 antibody (1: 1000), anti-ERK1/2 antibody (1: 1500), anti-Phospho-ERK1/2 antibody (1: 1000), anti-p38 antibody (1: 1000), anti-Phospho-p38 antibody (1: 1200), and anti-Cyclin D1 antibody (1:800). The above antibodies were purchased from Cell Signaling Technology.
Cell Cycle Analysis
The cell cycle of GC cells was analyzed by flow cytometry. Briefly, the cells were digested with trypsin and fixed with 70% ethanol, followed by centrifugation and repeated washing. The cell suspension was added to 50 μg of propidium iodide (PI) (Fermentas) containing RNase. Finally, the samples were subjected to flow cytometry (Beckman, Brea, CA, USA).
Cell Viability Analysis
Cell Counting Kit-8 (CCK-8; Beyotime Biotechnology, Shanghai, China) was used to detect the proliferation of GC cells. Cells were inoculated into 96-well plates at a density of 3 × 10³ cells/well in 200 μL of culture medium. Next, 10 μL of CCK-8 reagent was added to each well at the indicated time points for five consecutive days. After incubation at 37°C for an additional 1–2 h, the absorbance of the cells was measured at 450 nm using a microplate reader. The assay was performed in triplicate.
Plate Colony Formation Assay
A plate clone formation assay was performed to assess the survival rate of GC cells. Briefly, the cells were uniformly seeded into 6-well plates at a density of 1000 cells/well and cultured for 2–3 weeks. When macroscopic colonies appeared, the supernatant was discarded. The cells were washed twice, fixed with 4% paraformaldehyde for 30 min, and stained with 1% crystal violet for 30 min. Finally, colony formation was assessed.
Apoptosis Assay
Apoptosis was detected using an Annexin-V/PI apoptosis detection kit (Solarbio Life Sciences, Beijing, China) according to the manufacturer’s instructions. Finally, the percentage of apoptotic cells was assessed by flow cytometry (Beckman).
In vivo Experiments
In vivo experiments were performed to investigate the effect of PKMYT1 on GC. Six-weeks-old female BALB/c nude mice were purchased from Huafukang Biotechnology (Beijing, China). The Animal Ethics Committee of The First People’s Hospital of Lanzhou City approved the use of laboratory animals. The average weight of nude mice was 18–20 g. The GC cells were grown and prepared in suspensions of 5×10⁶ cells/mL. Using a 1 mL syringe, 0.2 mL of the cell suspension was inoculated subcutaneously into the left armpit of the nude mouse. Thereafter, the size of the tumor was measured and recorded every 1 week. The tumor volume was defined as follows: volume (mm3) = (length × width2)/2. The small animal living imaging system was used for imaging (Lumina LT; PerkinElmer, Inc.). Twenty-eight days later, the mice were sacrificed via cervical dislocation and the tumors were removed and weighed. All the animal experiments were carried out in accordance with the principles and procedures of the National Institutes of Health’s Guidelines for the Care and Use of Laboratory Animals.
Statistical Analysis
Continuous data were expressed as mean ± standard deviation. Chi-square test was used to analyze categorical data while t test was used to analyze measurement data. In this study, overall survival (OS) was used as the primary endpoint for patients with GC. Kaplan–Meier survival curves were used to analyze OS. All data were analyzed by GraphPad Prism v7.0 software (GraphPad Software, Inc., La Jolla, CA, USA). A P value of <0.05 indicated statistical significance.
Results
Bioinformatics Prediction Results
We analyzed the mRNA expression of PKMYT1 in common digestive cancers and GC using the online GEPAI tool. The mRNA expression of PKMYT1 was found to be upregulated in esophageal cancer, GC, pancreatic cancer, liver cancer, colon cancer, and rectal cancer tissues compared to that in normal tissues (Figure 1A). As shown in Figure 1B, the mRNA expression of PKMYT1 was significantly higher in GC tissues than in normal gastric tissues. The online tool Kaplan–Meier Plotter was used to assess the effects of PKMYT1 on the survival of patients with GC; the results suggested that patients with GC showing high PKMYT1 expression had worse prognosis (Figure 1C).
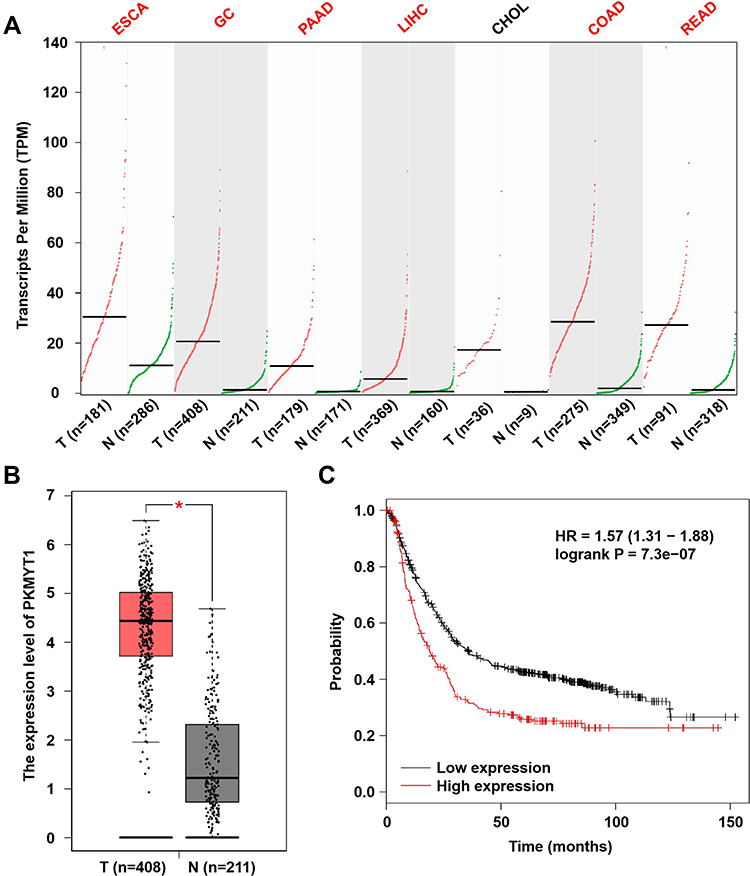 |
Figure 1 Biological analysis results. (A) GEPIA database shows PKMYT1 is up-regulated in most digestive cancers. (B) The expression level of PKMYT1 mRNA in GC samples was significantly higher than that in normal samples, which originates from the GEPIA database. (C) KM Plotter shows GC patients with high PKMYT1 expression own worse prognosis. *P <0.05. |
Expression of PKMYT1 in GC
Bioinformatics analysis revealed that the expression of PKMYT1 was upregulated in GC and was closely associated with the prognosis of patients with GC, indicating that it plays a tumor-promoting role in GC. To confirm the results of the bioinformatics analysis, we determined the expression of PKMYT1 in GC samples and cell lines. First, the expression of PKMYT1 protein was detected in GC tissues and paired adjacent tissues. As shown in Figure 2A, PKMYT1 protein was mainly localized in the cytoplasm. The expression level of PKMYT1 was significantly higher in GC tissues than in adjacent tissues (52.4% vs 31.1%, P = 0.002). Western blotting was performed to quantitatively detect the expression of PKMYT1 protein in 10 pairs of fresh GC and adjacent tissues. PKMYT1 protein expression was significantly higher in GC tissues than in adjacent tissues (Figure 2B). We also compared and analyzed the expression of PKMYT1 protein in GC cell lines. Compared with the normal gastric mucosal epithelial cell line GES-1, PKMYT1 protein expression was significantly upregulated in GC cell lines (Figure 2C), with highest expression levels observed in the MKN45 cell line. Therefore, MKN45 cell line was selected for subsequent in vitro studies. The above experimental results were consistent with the results of the bioinformatics analysis.
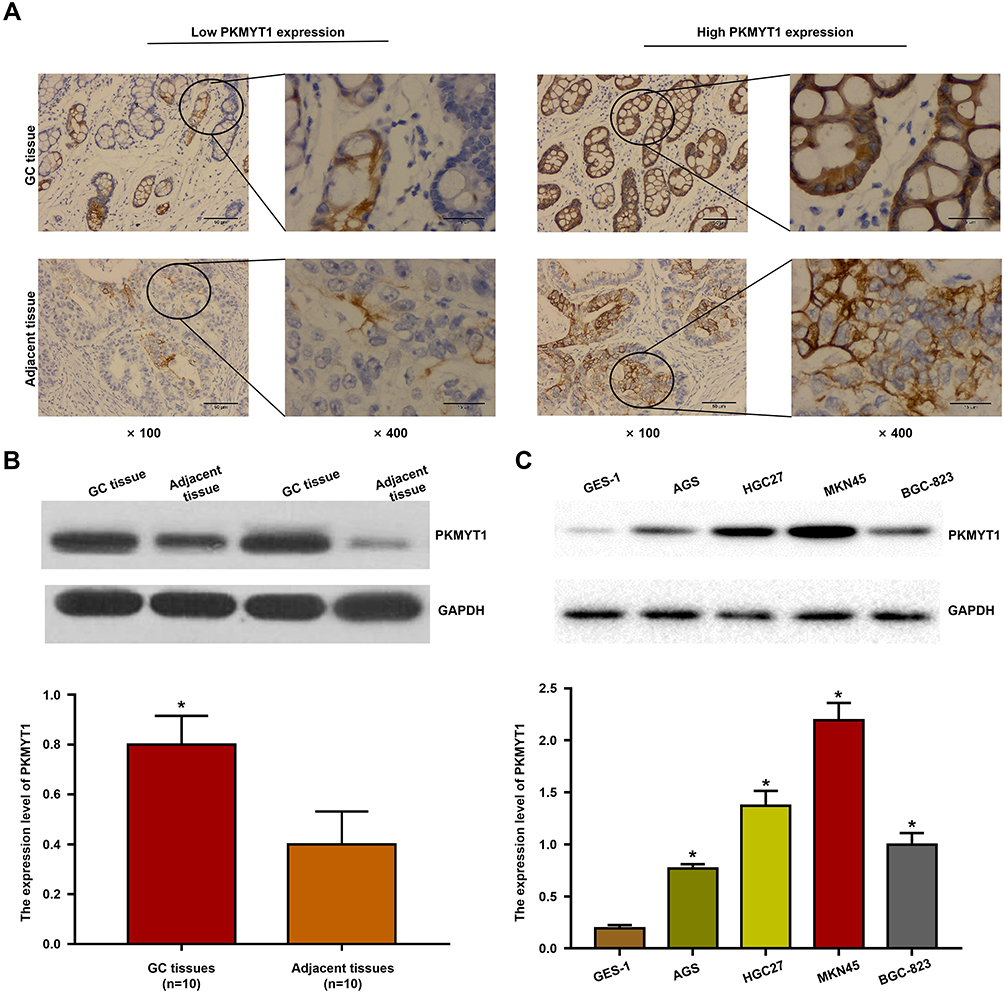 |
Figure 2 The expression of PKMYT1 in GC. (A) Confirm that PKMYT1 protein is located in the cytoplasm of GC and adjacent tissues through IHC. (B) Detection of PKMYT1 protein expression in 10 pairs GC and matched adjacent tissues by Western blotting. (C) PKMYT1 expression was detected and compared between normal gastric mucosal epithelial cell line GES-1 and all GC cell lines by Western blotting. *P <0.001. |
Correlation Between PKMYT1 Expression and Patient Prognosis
Based on the IHC scores, 103 patients with GC were divided into low PKMYT1 expression group (N = 49) and high PKMYT1 expression group (N = 54). Chi-square test revealed that high PKMYT1 expression was closely correlated with tumor infiltration and distant metastasis in patients with GC (P < 0.05, Table 1), although it was not significantly correlated with the age, gender, tumor size, tumor differentiation, or lymph node status of the patients.
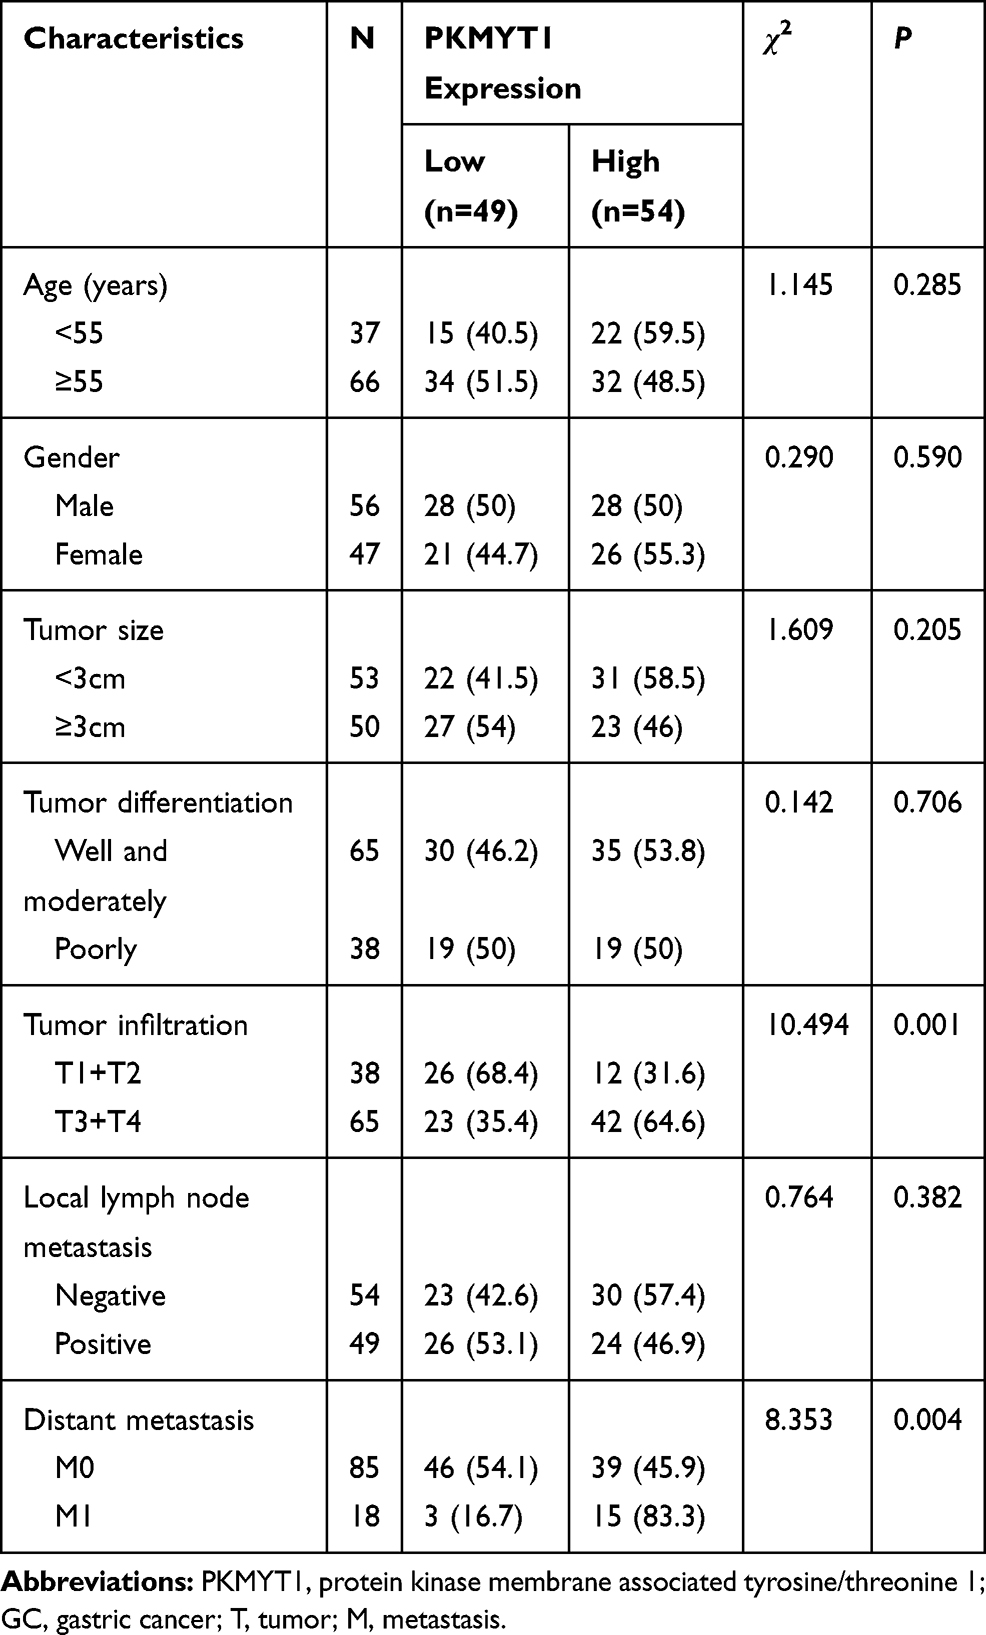 |
Table 1 Correlation Between PKMYT1 Expression and Clinicopathological Parameters of 103 GC Patients |
Based on the long-term follow-up data, Kaplan–Meier survival curves were plotted for patients with GC according to their clinicopathological characteristics; these curves showed that patients with GC exhibiting deeper tumor infiltration, positive lymph nodes, distant metastases, and high PKMYT1 expression had worse prognosis (Figure 3A–D). To further evaluate the prognostic effects of PKMYT1 in patients with GC, a Cox proportional hazard model was established. Univariate analysis showed that tumor differentiation, tumor infiltration, local lymph node metastasis, distant metastasis, and PKMYT1 expression were closely related to OS in patients with GC (P < 0.05, Table 2). Multivariate analysis revealed that high PKMYT1 expression was an independent risk factor for OS in patients with GC (P < 0.05, Table 2).
 |
Table 2 Univariate and Multivariate Analyses of OS of Patients with GC |
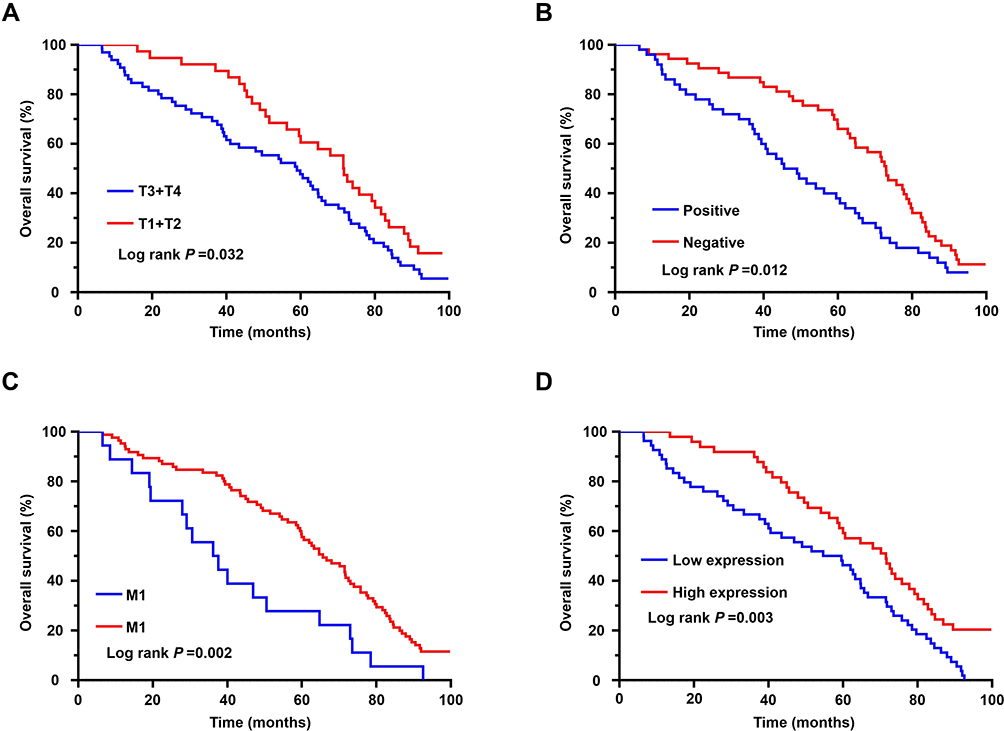 |
Figure 3 Survival analysis of patients with GC. (A) The survival rate of GC patients in the group of deep tumor infiltration was significantly lower than that of patients in the group of shallow tumor infiltration. (B) The survival rate of GC patients in the group of positive lymph nodes was significantly lower than that of patients in the group of negative lymph nodes. (C) The survival rate of GC patients in the group of distant metastases was significantly lower than that of patients in the group of negative metastases. (D) The survival rate of GC patients in the group of high PKMYT1 expression was significantly lower than that of patients in the group of low PKMYT1 expression. |
Effects of PKMYT1 on Cell Proliferation and Apoptosis in GC Cells
To investigate the effects of PKMYT1 on GC cell function, shRNA was used to downregulate the expression of PKMYT1 in the MKN45 cell line. After transfection for 48 h, the expression of PKMYT1 protein was significantly inhibited, as indicated by Western blotting (Figure 4A). First, we analyzed the effect of PKMYT1 on the GC cell cycle by flow cytometry. Compared to GC cells in the shNC group, the percentage of GC cells in the G0/G1 phase increased in the shPKMYT1 group, while the GC cells in the G2/M phase decreased. Therefore, knockdown of PKMYT1 caused G0/G1 cell cycle arrest in MKN45 cells (Figure 4B).
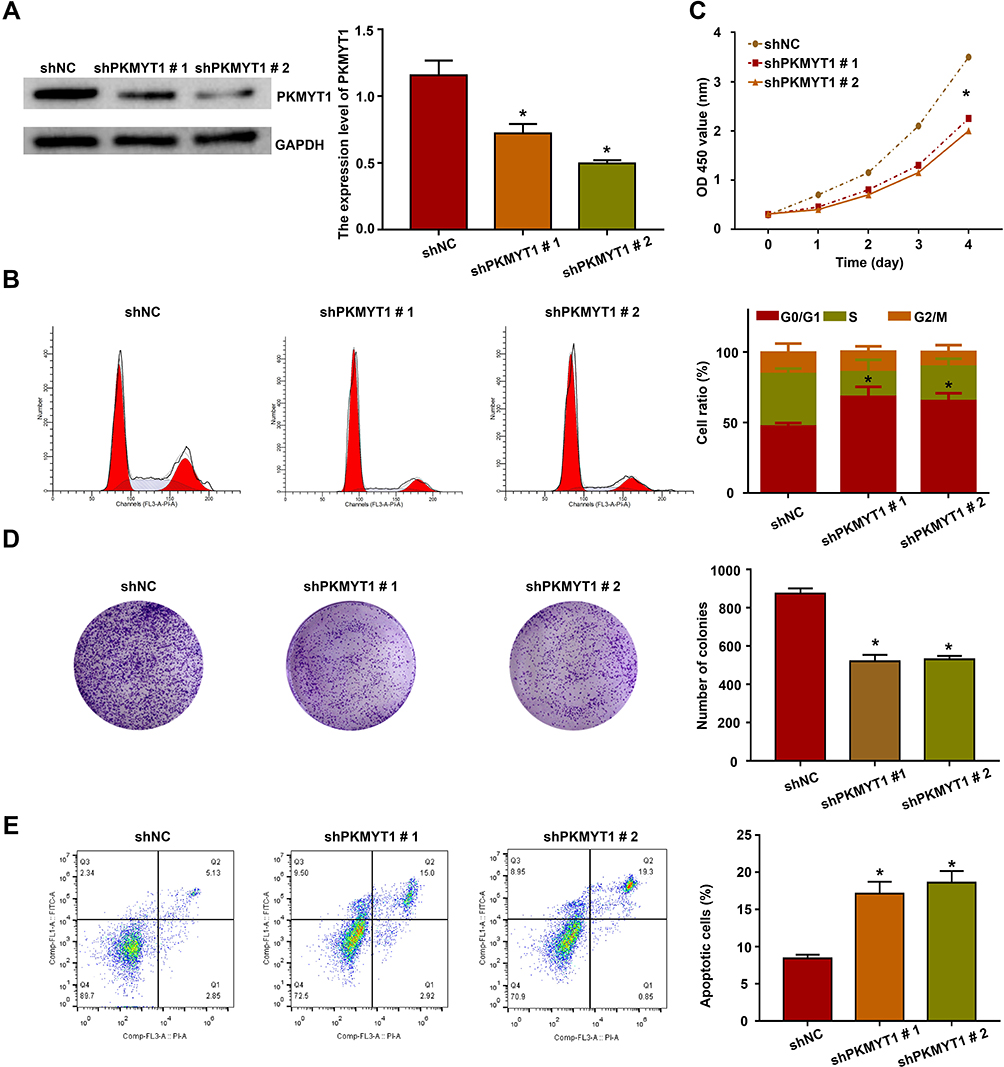 |
Figure 4 Effect of PKMYT1 on the malignant biological behavior of GC cells. (A) Identify the knockdown efficiency of PKMYT1 in GC cells by Western blotting. (B) Analysis of the effect of PKMYT1 on GC cell cycle by flow cytometry. Knockdown of PKMYT1 caused G0/G1 cell cycle arrest in MKN45 cells. (C) Detection of effect of PKMYT1 on the proliferation of GC cells was by the CCK-8 kit. Knockdown of PKMYT1 inhibited the proliferation of MKN45 cells. (D) Analysis of the effect of PKMYT1 on the survival rate of GC cells by plate clone formation. Knockdown of PKMYT1 inhibited the the colony formation ability of MKN45 cells. (E) Analysis of the effect of PKMYT1 on GC cell apoptosis by flow cytometry. Knockdown of PKMYT1 promoted apoptosis of MKN45 cells. *P <0.001. |
The proliferation activity of GC cells was detected using a CCK-8 kit. As expected, shPKMYT1 treatment significantly inhibited the proliferation activity of MKN45 cells (Figure 4C). Moreover, the survival rate of GC cells was evaluated via a plate colony assay. Compared to MKN45 cells in shNC group, the colony formation ability of GC cells was significantly reduced after PKMYT1 knockdown (Figure 4D). These data confirm that PKMYT1 promoted the proliferation ability of GC cells.
In addition, Annexin-V/PI apoptosis detection kit was used to analyze the effect of PKMYT1 knockdown on GC cell apoptosis by flow cytometry. Compared to GC cells in the shNC group, those in the shRNA-treated group had significantly increased apoptotic ratio (Figure 4E), indicating that PKMYT1 has an anti-apoptotic effect on GC cells.
In vivo Experiments
To examine the role of PKMYT1 in vivo, we established a GC xenograft model in nude mice. Every week after injection, the intensity of luciferase was evaluated using the small animal live imaging system to confirm the occurrence of subcutaneous tumors. The results showed that the knockdown of PKMYT1 suppressed tumorigenesis. After observation, a strong luciferase signal was detected in the control group earlier than in the experimental group (shPKMYT1) of nude mice (shNC). The growth curve of subcutaneous tumors in nude mice showed that the knockdown of PKMYT1 significantly inhibited the tumor growth rate. Moreover, the weights of the tumors removed from the nude mice at the end of the animal experiment were significantly lower in the shPKMYT1 group than in the control group. The results of in vivo experiments are shown in Figure 5.
 |
Figure 5 Knockdown of PKMYT1 inhibit tumor growth in mice xenograft models. (A) The bioluminescence imaging of tumors in shNC group and shPKMYT1 group. (B) Tumor volume was measured every week. Two weeks after the establishment of the xenograft model, the volume of tumors in the shPKMYT1 group was significantly smaller than that of the shNC group. (C) The weight of tumors was measured after twenty-eight days. The weight of tumors in the shPKMYT1 group was significantly lower than that of the shNC group. *P <0.001. |
PKMYT1 Activated the MAPK Signaling Pathway
Mitogen-activated protein kinase (MAPK) signaling pathways play important roles in multiple cellular processes, such as proliferation, apoptosis, and survival.11,12 Our previous data revealed that PKMYT1 is closely related to the cell proliferation and anti-apoptosis of GC cells. Therefore, we compared and analyzed the changes in the MAPK signaling pathway before and after PKMYT1 knockdown. Compared with the control group, the expression of phosphorylated ERK1/2, p38, and Cyclin D1 was suppressed in the GC cell line when PKMYT1 was effectively knocked down. However, the aggregate levels of ERK1/2, p38, and Cyclin D1 did not change (Figure 6). Consequently, overexpression of PKMYT1 activated the MAPK signaling pathway to promote GC progression.
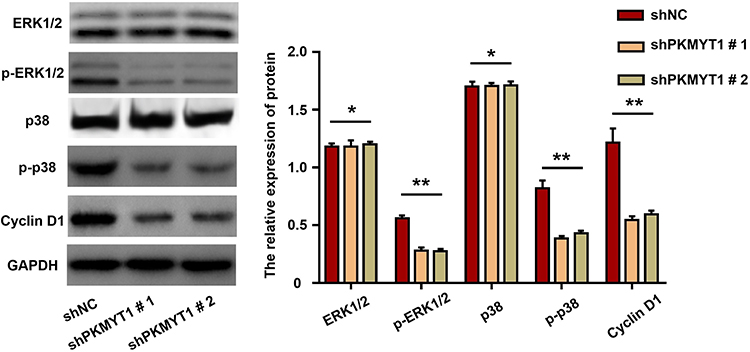 |
Figure 6 PKMYT1 activates MAPK signaling pathway. Knockdown of PKMYT1 can significantly inhibit the phosphorylation level of ERK1/2, p38, and Cyclin D1 in GC cells. *P >0.05; ** P <0.001. |
Discussion
Under physiological conditions, PKMYT1 acts as a cyclin-regulating kinase and is mainly responsible for inhibiting the phosphorylation of cyclin-dependent kinase 1 (Cdk1).13,14 PKMYT1 shows high substrate specificity, as it can phosphorylate Cdk1 but not the Cdk2 complex.14 PKMYT1 is mainly localized in the cellular Golgi apparatus and endoplasmic reticulum.15 The binding of PKMYT1 and Cdk1 complexes causes them to be retained in the cytoplasm, preventing their localization into the nucleus and cell cycle progression.14,16-18 In vitro studies revealed that PKMYT1 knockdown increases the kinetics of the G2/M transition, promotes early entry into mitosis, or leads to total checkpoint abrogation, which also increases the level of subsequent cell death.14 Abnormal expression of PKMYT1, which plays a role in tumor progression, has been reported in various solid malignancies.
In a study on metastatic renal cell carcinoma, cDNA microarray analysis revealed that PKMYT1 is associated with tumor metastasis.19 The lentivirus-mediated silencing of PKMYT1 has been shown to effectively inhibit the viability of hepatic carcinoma cells mediated by high β-catenin signaling.20 In addition, high expression of PKMYT1 has been predicted in breast cancer, regardless of the molecular subtype, through bioinformatics analysis. Additionally, high expression of PKMYT1 indicates a worse prognosis for patients with breast cancer.21 Similarly, bioinformatics analysis confirmed that PKMYT1 is upregulated in hepatocellular carcinoma and can accurately predict the poor prognosis of patients with hepatic carcinoma.22 Other studies have detected differential expression of PKMYT1 in lung, esophageal, and colorectal cancers.23–25 In this study, we first confirmed that PKMYT1 was upregulated in GC tissues and that high expression of PKMYT1 was an independent risk factor for poor prognosis in patients with GC. In terms of cell function, we found that the knockdown of PKMYT1 affected the GC cell cycle, inhibited the proliferation ability GC cells, and promoted GC cell apoptosis. In vivo data corroborated the above findings.
Tumor cell proliferation is a complex process driven by certain signaling pathways. MAPK signaling pathways play important roles in various cellular processes, such as proliferation, apoptosis, and survival.11,12 During carcinogenesis, gene mutation can dysregulate kinase activity and activate the MAPK pathway. In cellular functional studies, we confirmed that PKMYT1 was involved in the proliferation and apoptosis of GC cells. Therefore, we analyzed the correlation between PKMYT1 and the MAPK signaling pathway. In terms of potential mechanisms, overexpression of PKMYT1 promoted tumor cell proliferation and apoptosis resistance by activating the MAPK signaling pathway. According to previous results, PKMYT1 also promotes carcinogenesis through other pathways. For example, PKMYT1 mainly activates the Notch signaling pathway in the progression of non-small cell lung cancer.23 In addition, PKMYT1 can promote the growth and motility of hepatic carcinoma cells by over-activating the β-catenin/TCF pathway.26 Therefore, PKMYT1 may promote the progression of GC through multiple signaling pathways.
Conclusion
In summary, we demonstrated that PKMYT1 promotes cell proliferation and apoptosis resistance in GC cells by activating the MAPK signaling pathway, making it a potential therapeutic target for GC.
Disclosure
The authors report no conflicts of interest in this work.
References
1. Bray F, Ferlay J, Soerjomataram I, Siegel RL, Torre LA, Jemal A. Global cancer statistics 2018: GLOBOCAN estimates of incidence and mortality worldwide for 36 cancers in 185 countries. CA Cancer J Clin. 2018;68(6):394–424. doi:10.3322/caac.21492
2. Camargo MC, Figueiredo C, Machado JC. Review: gastric malignancies: basic aspects. Helicobacter. 2019;24(Suppl 1):e12642. doi:10.1111/hel.12642
3. Lee MH, Yang HY. Negative regulators of cyclin-dependent kinases and their roles in cancers. Cell Mol Life Sci. 2001;58(12–13):1907–1922. doi:10.1007/PL00000826
4. Najjar A, Platzer C, Luft A, et al. Computer-aided design, synthesis and biological characterization of novel inhibitors for PKMYT1. Eur J Med Chem. 2019;161:479–492. doi:10.1016/j.ejmech.2018.10.050
5. Martin NG, McAndrew PC, Eve PD, Garrett MD. Phosphorylation of cyclin dependent kinase 4 on tyrosine 17 is mediated by Src family kinases. FEBS J. 2008;275(12):3099–3109. doi:10.1111/j.1742-4658.2008.06463.x
6. Nakajima H, Yonemura S, Murata M, Nakamura N, Piwnica-Worms H, Nishida E. Myt1 protein kinase is essential for Golgi and ER assembly during mitotic exit. J Cell Biol. 2008;181(1):89–103. doi:10.1083/jcb.200708176
7. Zhu JY, Cuellar RA, Berndt N, et al. Structural basis of wee kinases functionality and inactivation by diverse small molecule inhibitors. J Med Chem. 2017;60(18):7863–7875. doi:10.1021/acs.jmedchem.7b00996
8. Wang XM, Li QY, Ren LL, et al. Effects of MCRS1 on proliferation, migration, invasion, and epithelial mesenchymal transition of gastric cancer cells by interacting with Pkmyt1 protein kinase. Cell Signal. 2019;59:171–181. doi:10.1016/j.cellsig.2019.04.002
9. Tang Z, Li C, Kang B, Gao G, Li C, Zhang Z. GEPIA: a web server for cancer and normal gene expression profiling and interactive analyses. Nucleic Acids Res. 2017;45(W1):W98–W102. doi:10.1093/nar/gkx247
10. Szász AM, Lánczky A, Nagy Á, et al. Cross-validation of survival associated biomarkers in gastric cancer using transcriptomic data of 1065 patients. Oncotarget. 2016;7(31):49322–49333. doi:10.18632/oncotarget.10337
11. Burotto M, Chiou VL, Lee JM, Kohn EC. The MAPK pathway across different malignancies: a new perspective. Cancer. 2014;120(22):3446–3456. doi:10.1002/cncr.28864
12. Maik-Rachline G, Hacohen-Lev-Ran A, Seger R. Nuclear ERK: mechanism of translocation, substrates, and role in cancer. Int J Mol Sci. 2019;20(5):1194. doi:10.3390/ijms20051194
13. Russell P, Nurse P. Negative regulation of mitosis by wee1+, a gene encoding a protein kinase homolog. Cell. 1987;49(4):559–567. doi:10.1016/0092-8674(87)90458-2
14. Schmidt M, Rohe A, Platzer C, Najjar A, Erdmann F, Sippl W. Regulation of G2/M transition by inhibition of WEE1 and PKMYT1 kinases. Molecules. 2017;22(12):2045.
15. Wells NJ, Watanabe N, Tokusumi T, Jiang W, Verdecia MA, Hunter T. The C-terminal domain of the Cdc2 inhibitory kinase Myt1 interacts with Cdc2 complexes and is required for inhibition of G(2)/M progression. J Cell Sci. 1999;112(Pt 19):3361–3371.
16. Platzer C, Najjar A, Rohe A, Erdmann F, Sippl W, Schmidt M. Identification of PKMYT1 inhibitors by screening the GSK published protein kinase inhibitor set I and II. Bioorg Med Chem. 2018;26(14):4014–4024. doi:10.1016/j.bmc.2018.06.027
17. Potapova TA, Sivakumar S, Flynn JN, Li R, Gorbsky GJ. Mitotic progression becomes irreversible in prometaphase and collapses when Wee1 and Cdc25 are inhibited. Mol Biol Cell. 2011;22(8):1191–1206. doi:10.1091/mbc.e10-07-0599
18. Rohe A, Erdmann F, Bäßler C, Wichapong K, Sippl W, Schmidt M. In vitro and in silico studies on substrate recognition and acceptance of human PKMYT1, a Cdk1 inhibitory kinase. Bioorg Med Chem Lett. 2012;22(2):1219–1223. doi:10.1016/j.bmcl.2011.11.064
19. Tan X, Zhai Y, Chang W, et al. Global analysis of metastasis-associated gene expression in primary cultures from clinical specimens of clear-cell renal-cell carcinoma. Int J Cancer. 2008;123(5):1080–1088. doi:10.1002/ijc.23637
20. Canal F, Anthony E, Lescure A, et al. A kinome siRNA screen identifies HGS as a potential target for liver cancers with oncogenic mutations in CTNNB1. BMC Cancer. 2015;15:1020. doi:10.1186/s12885-015-2037-8
21. Liu Y, Qi J, Dou Z, et al. Systematic expression analysis of WEE family kinases reveals the importance of PKMYT1 in breast carcinogenesis. Cell Prolif. 2019;53:e12741.
22. Agarwal R, Narayan J, Bhattacharyya A, Saraswat M, Tomar AK. Gene expression profiling, pathway analysis and subtype classification reveal molecular heterogeneity in hepatocellular carcinoma and suggest subtype specific therapeutic targets. Cancer Genet. 2017;216–217:37–51. doi:10.1016/j.cancergen.2017.06.002
23. Sun QS, Luo M, Zhao HM, Sun H. Overexpression of PKMYT1 indicates the poor prognosis and enhances proliferation and tumorigenesis in non-small cell lung cancer via activation of Notch signal pathway. Eur Rev Med Pharmacol Sci. 2019;23(10):4210–4219. doi:10.26355/eurrev_201905_17925
24. Zhang Q, Zhao X, Zhang C, et al. Overexpressed PKMYT1 promotes tumor progression and associates with poor survival in esophageal squamous cell carcinoma. Cancer Manag Res. 2019;11:7813–7824. doi:10.2147/CMAR.S214243
25. Jeong D, Kim H, Kim D, et al. Protein kinase, membrane-associated tyrosine/threonine 1 is associated with the progression of colorectal cancer. Oncol Rep. 2018;39(6):2829–2836. doi:10.3892/or.2018.6371
26. Liu L, Wu J, Wang S, et al. PKMYT1 promoted the growth and motility of hepatocellular carcinoma cells by activating beta-catenin/TCF signaling. Exp Cell Res. 2017;358(2):209–216. doi:10.1016/j.yexcr.2017.06.014
 © 2020 The Author(s). This work is published and licensed by Dove Medical Press Limited. The full terms of this license are available at https://www.dovepress.com/terms.php and incorporate the Creative Commons Attribution - Non Commercial (unported, v3.0) License.
By accessing the work you hereby accept the Terms. Non-commercial uses of the work are permitted without any further permission from Dove Medical Press Limited, provided the work is properly attributed. For permission for commercial use of this work, please see paragraphs 4.2 and 5 of our Terms.
© 2020 The Author(s). This work is published and licensed by Dove Medical Press Limited. The full terms of this license are available at https://www.dovepress.com/terms.php and incorporate the Creative Commons Attribution - Non Commercial (unported, v3.0) License.
By accessing the work you hereby accept the Terms. Non-commercial uses of the work are permitted without any further permission from Dove Medical Press Limited, provided the work is properly attributed. For permission for commercial use of this work, please see paragraphs 4.2 and 5 of our Terms.