")
Back to Journals » Medical Devices: Evidence and Research » Volume 13
Physiological Vibration Acceleration (Phybrata) Sensor Assessment of Multi-System Physiological Impairments and Sensory Reweighting Following Concussion
Authors Ralston JD , Raina A, Benson BW, Peters RM, Roper JM, Ralston AB
Received 1 September 2020
Accepted for publication 2 November 2020
Published 8 December 2020 Volume 2020:13 Pages 411—438
DOI https://doi.org/10.2147/MDER.S279521
Checked for plagiarism Yes
Review by Single anonymous peer review
Peer reviewer comments 2
Editor who approved publication: Dr Scott Fraser
John D Ralston,1 Ashutosh Raina,2,3 Brian W Benson,4,5 Ryan M Peters,6,7 Joshua M Roper,1 Andreas B Ralston1
1PROTXX, Inc., Menlo Park, CA 94025, USA; 2Center of Excellence for Pediatric Neurology, Rocklin, CA 95765, USA; 3Concussion Medical Clinic, Rocklin, CA 95765, USA; 4Benson Concussion Institute, Calgary, Alberta T3B 6B7, Canada; 5Canadian Sport Institute Calgary, Calgary, Alberta T3B 5R5, Canada; 6Faculty of Kinesiology, University of Calgary, Calgary, Alberta T2N 1N4, Canada; 7Hotchkiss Brain Institute, University of Calgary, Calgary, Alberta T2N 1N4, Canada
Correspondence: John D Ralston Tel +1 6502158418
Email [email protected]
Objective: To assess the utility of a head-mounted wearable inertial motion unit (IMU)-based physiological vibration acceleration (“phybrata”) sensor to support the clinical diagnosis of concussion, classify and quantify specific concussion-induced physiological system impairments and sensory reweighting, and track individual patient recovery trajectories.
Methods: Data were analyzed from 175 patients over a 12-month period at three clinical sites. Comprehensive clinical concussion assessments were first completed for all patients, followed by testing with the phybrata sensor. Phybrata time series data and spatial scatter plots, eyes open (Eo) and eyes closed (Ec) phybrata powers, average power (Eo+Ec)/2, Ec/Eo phybrata power ratio, time-resolved phybrata spectral density (TRPSD) distributions, and receiver operating characteristic (ROC) curves are compared for individuals with no objective impairments and those clinically diagnosed with concussions and accompanying vestibular impairment, other neurological impairment, or both vestibular and neurological impairments. Finally, pre- and post-injury phybrata case report results are presented for a participant who was diagnosed with a concussion and subsequently monitored during treatment, rehabilitation, and return-to-activity clearance.
Results: Phybrata data demonstrate distinct features and patterns for individuals with no discernable clinical impairments, diagnosed vestibular pathology, and diagnosed neurological pathology. ROC curves indicate that the average power (Eo+Ec)/2 may be utilized to support clinical diagnosis of concussion, while Eo and Ec/Eo may be utilized as independent measures to confirm accompanying neurological and vestibular impairments, respectively. All 3 measures demonstrate area under the curve (AUC), sensitivity, and specificity above 90% for their respective diagnoses. Phybrata spectral analyses demonstrate utility for quantifying the severity of concussion-induced physiological impairments, sensory reweighting, and subsequent monitoring of improvements throughout treatment and rehabilitation.
Conclusion: Phybrata testing assists with objective concussion diagnosis and provides an important adjunct to standard concussion assessment tools by objectively ascertaining neurological and vestibular impairments, guiding targeted rehabilitation strategies, monitoring recovery, and assisting with return-to-sport/work/learn decision-making.
Keywords: wearable sensor, physiological vibration acceleration, concussion, multi-system impairment, sensory reweighting
Introduction
Managing concussion injuries in civilian, athletic, industrial, and military populations is complicated by the fact that patients typically suffer from impairments to multiple interacting physiological systems:1 central nervous system (CNS; brain and spinal cord), peripheral nervous system (PNS; somatic, autonomic), sensory (visual, vestibular, somatosensory), neurovascular, and musculoskeletal. This wide range of potential impairments arises from the corresponding wide range of potential impact-induced tissue damage locations, volumes, topologies, and affected CNS, PNS, sensory, vascular, and musculoskeletal structures.2 A comprehensive objective assessment of these impairments is difficult to obtain, presenting significant challenges for concussion risk prediction, diagnosis, treatment, and rehabilitation. Although a variety of instrumented concussion assessment tools are available, there is no gold standard assessment tool and diagnosis of concussion remains a clinical decision. These challenges are not unique to concussions and chronic sub-concussive head impact exposure – they also arise due to the wide range of lesion locations, volumes, topologies, and affected neural structures that can be caused by a stroke,3 and the wide range of CNS, PNS, sensory, vascular, and musculoskeletal impairments that can result from age-related decline,4 demyelinating diseases like multiple sclerosis,5 other neurodegenerative diseases such as Parkinson’s disease6 and Alzheimer’s disease,7 and a wide range of other medical conditions and the side effects of associated prescription medications and surgical interventions.
Systems-based approaches to model and clinically assess the complex interactions of physiological impairments such as those described above have been investigated for several decades. Important examples from industrial, sports, and clinical medicine that lay the foundation for the work described in this article include the measurements and analysis of normal and pathological body sway motion8 and, more broadly, body vibrational spectra, both naturally occurring and externally induced. Monitoring and analysis of vibrational acceleration spectra in turn have their origins in industrial systems applications9 such as machine design, failure detection, remote asset management, predictive maintenance, and, bridging industrial and human applications, the design of robots that can mimic human bipedal motion.10–12 Vibrational analysis is a key component of digital twin models used to monitor the health of complex industrial systems,13 and this concept has recently been extended to the development of human digital twin models that can monitor patient health,14 for example by determining stroke severity from head vibration.15 Important related industrial medicine applications include reducing risks of physiological impairments due to human/machine interactions,9 riding in motor vehicles16 or industrial equipment,17 and determining causes of motion sickness.18 In sports medicine, head-mounted and body-worn accelerometers have been used to compare measured and simulated responses of the human body to external mechanical excitations such as simulated sub-concussive head impacts19 and to investigate the transmissibility of vibrations from the skis to lower back and head in alpine skiing.20 Localized vibration of the calf muscles has been used to study the effects of fatigue on human postural stability.21,22 The incorporation of whole-body vibration into fitness and injury treatment programs has also received significant interest,23,24 although evidence regarding the corresponding physiological changes and therapeutic benefits remains unclear.25 Head acceleration spectra from instrumented mouthguards have been used to identify features that can be utilized by machine learning algorithms to classify head motion in football players as impacts vs. non-impacts and impacts as concussions vs. non-concussive.26 In clinical medicine, head-mounted accelerometers have been used to compare normal and pathological passive head acceleration spectra for healthy individuals and those with essential tremor,27 to compare head and eye tremors for the assessment of vestibulo-ocular impairments,28 to detect changes in intercranial pulsatility29 associated with diffuse brain tissue atrophy and white matter degeneration following stroke, and to measure the mechanocardiographic motion of the body30 resulting from cardiovascular blood flow. Acceleration spectral analysis of body center of mass data has also been utilized to study differences in the complex multi-system postural control process between young children and adults,31 and physiological vibration has been shown to be inherent to human postural and motor control,32,33 including components described as tremor,32,34 rambling, and trembling.33
The above studies reveal the rich set of physiological vibration acceleration phenomena that have been studied in the human body. In this article these phenomena are referred to collectively as “phybrata”, and the application of phybrata sensing is explored as an extension of traditional clinical measurements of postural stability, balance, neuromotor control, and neuro/cardiovascular dynamics for the assessment of complex medical conditions in which multiple physiological systems are impaired. We have previously reported the utilization of a head-mounted wearable inertial motion unit (IMU)-based sensor and three quantitative, physiologically intuitive measures of postural sway to detect outliers in populations at risk of balance impairments.35 Normative reference ranges and well-defined 95% confidence intervals (CIs) have been established for all three postural sway measures across heterogenous populations and sampling environments.35 Session-to-session variability and changes due to routine physical activity and potential confounding variables remain well within the 95% CIs for all three sway measures.35 We have also shown that the device enables on-field detection of abnormal sway to support concussion diagnoses and remove-from-activity/return-to-activity decisions for athletes at risk of impact-induced balance impairments, even in the absence of individual baseline measurements.35 In the case of concussions and sub-concussive head impact exposure, head-mounted devices can also provide the dual functions of continuously monitoring the intensity and frequency of head impacts during athletic activity36 and quantifying resulting changes in postural stability and balance performance.35
The aims of the present study are to investigate applications of the above device as a phybrata sensor, expand our previous investigations to include larger cohorts of clinical concussion patients, and investigate the utility of the device for diagnosing concussions and classifying neurological versus vestibular impairments in patients with diagnosed concussions. We show that the device is able to detect normal and pathological features and patterns in phybrata signals that are inherent to human balance stabilization and arise from cerebellar and cortical integration and processing of multiple afferent feedback inputs (visual, vestibular, somatosensory), efferent feedforward motor signals, and musculoskeletal responses. The tiny mass, high sensitivity, and head-mounted design near the vestibular balance organs allow the device to detect spatial, time-domain, and frequency-domain features and patterns with a level of detail not previously reported. We further show that phybrata time series data and spatial scatter plots, eyes open (Eo) and eyes closed (Ec) phybrata powers, receiver operating characteristic (ROC) curves, phybrata spectral density (PSD) distributions, and time-resolved phybrata spectral density (TRPSD) analyses enable the derivation of simple and clinically intuitive quantitative metrics to classify, quantify, and track the time evolution of vestibular and neurological impairments resulting from concussion injuries. The present direct measurements and time-resolved spectral analyses of phybrata signals using a mastoid-mounted device address key limitations of alternative measurement tools used to assess physiological impairments and sensory reweighting following concussions, including computerized dynamic posturography (CDP),37 video motion capture systems,38 body-worn sensors,39 robotic assessments,40 electrodiagnostic testing such as quantitative electroencephalography (qEEG),41 motor evoked potentials (MEP),42 electromyography (EMG),43 electrical vestibular stimulation (EVS)44 and electrovestibulography,45 functional MRI (fMRI),46 and functional near-infrared spectroscopy (fNIRS).47
Clinical Assessments of Multi-System Physiological Impairments and Sensory Reweighting
Clinical measurements of postural stability, balance, and mobility are important non-invasive tools in the assessment of neurological, sensory, musculoskeletal, and PNS disorders resulting from a wide range of neurological medical conditions, including head trauma due to concussions,48–51 sub-concussive head impact exposure,44,52–54 industrial accidents,55 and combat blast.56,57 Severe impairments of balance can be identified by qualitative postural stability tests that have been developed for a variety of clinical applications, including Romberg testing,58 the Bass Balance Test,59 the Berg Balance Scale (BBS),60 the balance error scoring system (BESS),61 and the Balance Evaluation Systems Test (BEST).62 However, instrumented measurements have been shown to provide enhanced sensitivity, reproducibility, and reliability for detecting more subtle neuromotor, vestibular, and musculoskeletal abnormalities resulting from injuries such as concussions,39,63 diseases such as Parkinson’s disease64 and diabetes,65 age-related disorders such as postural dyscontrol,66 frailty,67 and stroke,68 and a wide range of other complex medical conditions and associated pharmaceutical treatments69–71 and surgical interventions.72
Force plates are widely deployed for instrumented balance assessment in clinical environments, and foot center-of-pressure (COP) displacement trajectories or body center-of-mass (COM) displacement trajectories measured using these devices have been used to derive many different postural sway metrics.73–75 However, there is still no consensus in the literature as to the accuracy and physiological interpretation of many of these metrics,76–79 due in part to significant variations in testing procedures such as postural stance, visual condition, balance condition, sampling rate and test duration,75,77,80–82 and data processing techniques.83 COP and COM displacement trajectories measured using force plates also obscure clinically important higher frequency postural sway components corresponding to both complex multi-joint motion and motion of the head, as discussed further below.
Comparisons of theoretical and experimental COP displacement frequency spectra reveal both lower frequency components (<1 Hz) corresponding to single-joint motion about the ankles, and higher-frequency (1–5Hz or higher) components corresponding to more complex in-phase and out-of-phase multi-joint motions involving knees, hips, torso, head, shoulders, and neck.84–86 Theoretical and experimental studies have revealed a combination of active, passive, intermittent, and continuous control of human balance11,12,87 to minimize energy consumption while maximizing stability. The corresponding postural sway in quiet stance exhibits motion with frequencies in the range 0–20Hz (the physiologically relevant range of joint oscillations)12 and amplitudes on the order of mm to cm, reflecting both natural and pathological involuntary motion caused by delays, gains, nonlinearities, and stochastic behavior inherent to biological feedback and control systems. Spectral analyses of data from accelerometers and EMG reveal physiological tremor features out to 20 Hz,34 with contributions from many different body parts and a wide range of central and peripheral motor control impairments. Studies combining EVS, EMG monitoring of lower limb muscle responses, and force plate measurements of resulting changes in standing balance have revealed a biphasic vestibular-muscular response conveyed by two distinct physiological processes: an early response with 12–20 Hz frequency components and a late response with 2–10 Hz frequency components.88
Multiple studies based on spectral analyses of postural sway time series data indicate that distinct frequency bands may correspond to specific mechanisms of postural control,31,89–95 for example: >1Hz (spinal reflexive loops, proprioception, multi-joint and muscle activity); 0.5–1 Hz (CNS participation, both cerebellar and cortical); 0.1–0.5 Hz (vestibular regulation); 0.02–0.1 Hz (visual regulation). Unique spectral features observed in postural sway power spectrum measured with a force plate, together with somatosensory evoked potential (SEPs) and EMG testing, have been utilized to distinguish between cerebellar and sensory ataxia in patients with Miller Fisher syndrome.96 Frequency-derived measures from a body-worn accelerometer have been used to provide automated at-home assessments of mobility for patients with Parkinson disease.97 The integration of the multiple sensory inputs utilized for postural control is dynamically regulated to adapt to changes in environmental conditions and available sensory information in order to reduce dependence upon affected elements of the postural control system, a process referred to as sensory reweighting.89–91,95,98–105 Sensory reweighting resulting from experimental perturbations,90,98–100 aging,99,101 and impairments caused by a wide range of neurological conditions89,91–94,102–105 has been observed in postural sway displacement frequency spectra. CDP is an advanced clinical system that has been used to assess functional balance development with age, sensory reweighting, and the relative contributions of visual, proprioceptive, and vestibular sensory cues,106,107 including changes following concussion.37 CDP testing requires patients to stand on a moveable platform with integrated force plates or wearing accelerometers, facing a visual surround screen, and wearing a safety harness. The most commonly implemented CDP testing subset is the sensory organization test (SOT), requiring the patient to maintain balance under six progressively more difficult conditions with conflicting visual and/or proprioceptive cues.37,106 Robotic assessments of normal and altered reaching movements have been used to evaluate motor, sensory, and cognitive functional impairments following sport-related concussions.40 Sensory reweighting caused by aging and exposure to simulated microgravity have been studied by combining fMRI with force plate and video motion capture measurements.108,109 Higher frequency and lower amplitude postural control adjustments are indicative of more complex musculoskeletal strategies utilized by healthy individuals, and reductions in these components is a key feature in the sensory reweighting observed in recently concussed athletes51 and patients with a variety of other neurological conditions.89,93,95,103 Analogous behavior is also observed in humanoid robots, where impairments to visual (camera) and vestibular (gyroscope) inputs trigger sensory reweighting of the postural control system that results in higher amplitude, lower frequency balance responses and increased fall risks.110
Contributions of head motion to postural sway have been studied in less detail but have been shown to be significant even in healthy individuals.27,111–114 The head serves as an egocentric reference for balance, walking, and most other voluntary motor activities,115 and centralizes the integrated sensing of physiological signals. Published data indicate that during quiet stance upper body motion increases in order of pelvis, trunk, head, and that quiet stance includes control of separate trunk-on-pelvis and head-on-trunk links, dominated by head resonance.112 Not yet well understood are the head motion magnitudes and frequency ranges during quiet stance from vestibular-ocular stabilization of gaze116 and vestibular-cervical stabilization of head position.117 Spectral analysis of force plate COP trajectory data has, for example, revealed visually evoked postural responses from individuals in virtual reality environments.118 Vestibular reflex contributions to balance control have been shown to exhibit frequency components up to 25 Hz in the lower limbs and even higher in the head neck system.119 This higher frequency response of vestibular reflexes is governed by the mechanical systems under their control, with the neck system exhibiting a broader bandwidth than the appendicular muscles.119 Eye and head movements are closely tied and well-synchronized, relying on common neural correlates to ensure steady fixation of targets in the visual field. Abnormalities can be classified120 as: 1) eye movements as the primary abnormality with the seemingly abnormal head movements actually being compensatory; 2) head movements as the primary disorder with seemingly abnormal eye oscillations being compensatory; 3) abnormal eye and head oscillations due to a shared pathophysiology; and 4) eye and head oscillations occurring independently. Pathological head and eye motion can result from malfunction in any of the related physiological system components.
Complex multi-joint postural sway components can be extracted from force plate data by modeling the body as an inverted simple or articulated pendulum and deriving the body’s COM trajectory from the COP trajectory.73,84,85,114 However, such a derivation requires multiple biophysical assumptions74,84,121,122 which in turn produce a distorted estimate of the true postural sway. Furthermore, two key factors obscure much of the above clinically important higher frequency postural sway and sensory reweighting components beyond 2Hz in the power spectral density of force plate COP or COM displacements.77,84,98,103 The first factor is lower body attenuation and damping of the higher-frequency head and upper body components.123,124 The second factor is the relationship between displacement, velocity, and acceleration power spectral densities. Mathematically, displacement (d), velocity (v), and acceleration (a) all share the same spectral structure but with frequency-dependent scaling125 d(f) = v(f)/2πif = a(f)/(2πif)2. As a result, COP displacement spectra show significantly higher 1/f noise at lower frequencies and much steeper roll-off at higher frequencies than the corresponding velocity85,126 and acceleration31 spectra. The displacement signal can be integrated mathematically once to generate velocity or twice to generate acceleration, but this method is limited in the case of postural sway by lack of knowledge of the (typically non-zero) initial position and velocity of the body for the integrations. Analysis of COM acceleration has nonetheless been shown to be useful for the assessment of the postural control strategy at the whole-body level,31,127,128 by revealing the presence of higher frequency sway components due to multi-joint coordination and providing insights into underlying neuromotor control mechanisms.
Video motion capture systems have been used to study the above higher frequency and multi-joint motions in detail,129,130 but this is a complex solution that requires dedicated research facilities. A much easier solution, applicable to wide range of clinical or even self-testing environments, is to measure acceleration directly using inertial measurement unit (IMU)-based sensors worn on the body. These devices typically incorporate micro-electromechanical systems (MEMS)-based linear accelerometers and/or angular velocity sensors (gyroscopes) for precision motion tracking, although it has been shown that, in comparison to camera- and force-plate-based systems using multi-segment body models to assess the dynamics of standing balance, accelerometer-only inertial sensors can deliver highly accurate estimates of body segment orientations, ground reaction forces, COP position, and joint moments.131 Such devices have been shown to provide valid and sensitive metrics of postural sway132–135 that correlate well with force plates,65,106,136 and the typical computational measures derived from CoP signals can be applied directly to accelerometry signals with results that are as good or better. Body-worn accelerometers have also demonstrated better sensitivity and discriminatory performance for various physiological conditions and different age groups compared with force platforms, with results demonstrating the importance of higher frequencies when evaluating postural steadiness.137 Body-worn sensors have also enabled detailed measurement of higher frequency upper body vibrational resonances during seated postural control studies138 and have been used to assess changes in central sensory integration following concussion.139 Balance measurements using accelerometers in smart glasses have been shown to be highly correlated with those using a waist-mounted accelerometer140 and have also been proposed as a concussion assessment tool.141
Head-mounted IMUs have the potential to capture a richer set of features over a wider frequency range than either force plates or body-worn devices. Studies using head-mounted accelerometers to compare head motion acceleration spectral densities (ASD) for healthy individuals and those with essential tremor,27 as well as to compare head and eye tremors,28 both reveal a variety of distinct ASD spectral features extending out to 25Hz. ASD is the standard engineering analysis tool for quantifying random vibrations in many different complex physical systems,9 including the human body.10–12,15–26 In addition to revealing significant details related to sensory reweighting, time-resolved ASD analyses also address the fact that postural sway signals are non-stationary, by capturing the significant time varying spectral changes100,142 that result from intermittent balance control processes that utilize multiple physiological system inputs and outputs. Ensemble-average ASD analyses have been utilized to identify statistically significant spectral features that can distinguish patients vs. control groups.100 The present study integrates and extends many of the above concepts into head-mounted accelerometer assessments of phybrata signals features and patterns observed in the spatial, time, and frequency domains.
Methods
Participants
Data were collected from a total of 218 patients over a 12-month period during regularly scheduled visits at three clinical sites: Center of Excellence for Pediatric Neurology (CEPN) in Rocklin, CA; Concussion Medical Clinic (CMC) in Rocklin, California; and the Benson Concussion Institute (BCI) in Calgary, Alberta. CEPN patient visits included both healthy patient assessments and assessments for a variety of neurological conditions. CMC concussion patients presented with a wide range of injury causes, including automotive accidents, home and workplace falls, and sports-related injuries. BCI injuries were limited to baseline assessments of healthy athletes and assessment for sport-related concussions in Canadian National high-performance athletes or elite athletes from the Calgary community. Data included in the analysis below are from a total of 175 participants (94 female, 81 male, ages 18.1 ± 10.9 yrs, min 7 yrs, max 66 yrs), including 92 patients diagnosed with concussion within 30 days of injury (51 female, 41 male, ages 18.8 ± 13.2 yrs, min 7 yrs, max 74 yrs) and 83 healthy participants (43 female, 40 male, ages 17.2 ± 7.7 yrs, min 8 yrs, max 74 yrs). Of the 92 patients diagnosed with concussion, 26 were diagnosed with vestibular impairments via clinical assessment, 40 with other neurological impairments, and 26 with both vestibular and other neurological impairments. Patients with diagnoses other than concussion were excluded from the analysis.
Ethical Considerations
Phybrata testing was included in regularly scheduled clinical patient assessments, the study was conducted in accordance with the Declaration of Helsinki under Western IRB Study Number 1,188,786, and informed consent was obtained for all participants in the study.
Measurements
Concussion diagnoses of patients at CEPN, CMC, and BCI utilized Sport Concussion Assessment Tool (SCAT5) assessments, computerized neuropsychological testing, vestibular/ocular motor screening (VOMS), and comprehensive neurological clinical exams, including mental/psychiatric status, cranial nerves, and motor, sensory, reflexes, coordination, balance, and gait testing. BCI patients also underwent autonomic nervous system assessment and assessment of sensory, motor, and cognitive function, visual gaze, and postural stability using robotic assessments of normal and altered reaching movements40 with the Kinarm End-Point Robotic Device.143 CEPN and CMC assessments were completed with concussion patients at initial presentation and to trend recovery throughout rehabilitation. BCI assessments were completed with athletes at baseline, acutely post-concussion for diagnostic utility, and at follow-up to ascertain clinical and physiological recovery to aid with return-to sport decision-making. Patients diagnosed with concussion based on the above physical examination and specific symptom assessments were further divided into those presenting with vestibular impairments, other neurological impairments, or both vestibular and other neurological impairments, in order to develop the most appropriate plan of care.144
Patients were tested using the previously reported PROTXX sensor attached to the patient’s mastoid using a disposable medical adhesive, as shown in Figure 1, while patients stand still for 20 sec with Eo and then again for 20 sec with Ec.35 During testing, participants were instructed to stand upright in a relaxed position with their feet together and their arms at their side while maintaining their gaze in a straight-ahead direction. No talking or arm movements were allowed during the trial. The test administrator always stood by the subjects: 1) to monitor subjects’ postural sway throughout the trial; and 2) so that the subjects had no fear of falling during Ec testing. Test data was excluded from the analysis if anomalous patient movement was observed during phybrata testing.145 A smartphone app connects to the phybrata sensor via a bluetooth low-energy (BLE) wireless link to configure and run tests, collect data, and interface with cloud-based data storage, analytics, and reporting services. The phybrata IMU includes a 3-axis accelerometer to record x (anterior-posterior [AP], or front-back), y (vertical), and z (medial-lateral [ML], or left-right) acceleration time series data in units of g. During each 20 sec test, data is recorded at a sampling rate of 100 Hz, generating a total of 2000 samples for each of the 3 axes (x,y,z). The accelerometer signals are filtered to remove drift, as in our previous studies with the same device.35 Figure 2 shows sample Eo and Ec x,y,x phybrata time series signals and AP/ML phybrata spatial scatter plots for an age/gender-matched healthy baseline participant (Figure 2A) and a patient with diagnosed concussion (Figure 2B).
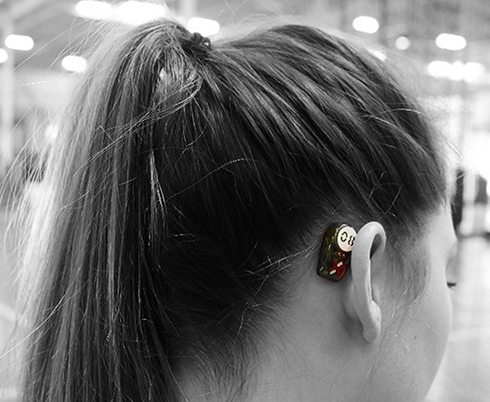 |
Figure 1 Phybrata sensor attached to the mastoid using an adhesive patch. |
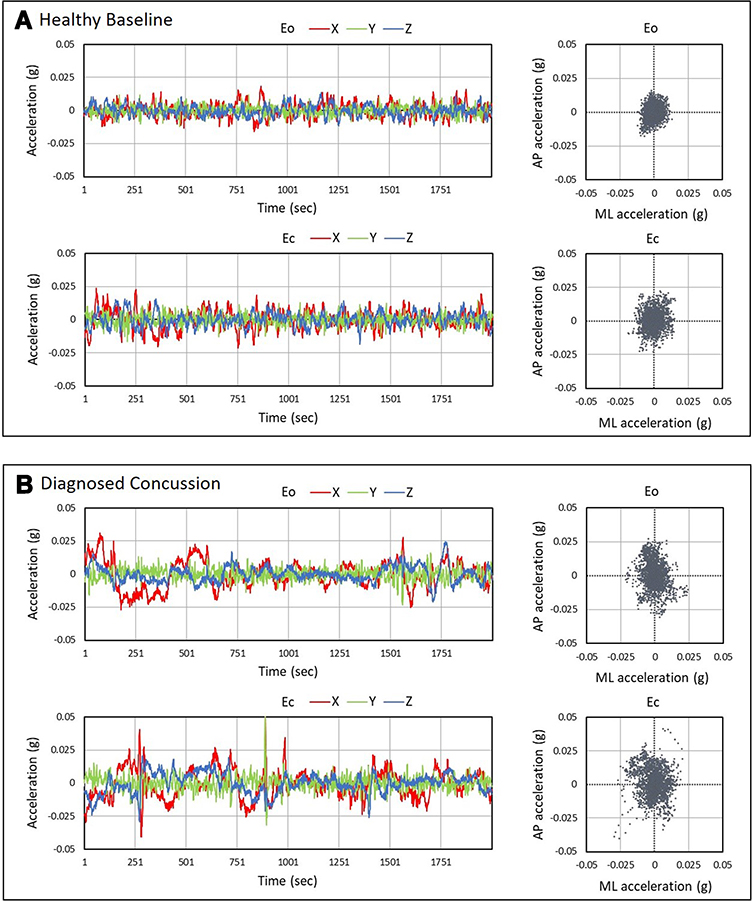 |
Figure 2 Sample eyes open (Eo) and eyes closed (Ec) x(anterior-posterior, AP), y(vertical), z(medial-lateral, ML) acceleration time series data and AP/ML acceleration spatial scatter plots for age/gender-matched (A) healthy baseline participant (B) patient with diagnosed concussion. |
Data Analysis
For each pair of tests (20 sec Eo followed by 20 sec Ec), four phybrata metrics were calculated from the time series data as previously described:35 Eo and Ec powers (in watts), (Eo+Ec)/2 average power, and Ec/Eo power ratio. Data analyses and plotting were carried out using the commercially licensed statistical analysis software packages NCSS (NCSS LLC, Kaysville, UT, USA) and SigView (SignalLab e.K., Germany). Data analysis included descriptive statistics, analysis of variance (ANOVA, MANOVA), and ROC curves for the 4 phybrata metrics and sub-populations of interest (female vs. male, Eo vs. Ec, no concussion vs. concussion, vestibular impairment vs. neurological impairment). Eo and Ec distributions generally failed 2 or more of 3 normality tests (Shapiro–Wilk, skewness, kurtosis) and were log transformed prior to ANOVA/MANOVA. Means and 95% CIs were calculated using the bootstrap method. PSD and TRPSD analyses of phybrata time series data were carried out for individual patients and for ensembles of patients sharing common characteristics (e.g., no concussion vs. concussion, vestibular impairment vs. neurological impairment). Additional benefits of the direct measurement of acceleration and the use of power-based and frequency-based metrics in the present study include greater sensitivity to differences in Eo vs. Ec performance and less sensitivity to sampling duration,73,75–77,80,81 enabling the 20 sec test times utilized in the present work.
Results
Figure 3 presents cumulative probability distributions (CPDs) for Eo, Ec, and Ec/Eo plotted as a function of gender for the 83 healthy baseline patients (HB) and the 92 patients with diagnosed concussions (CN). Means, 95% CIs, and ANOVA results for these two groups and all 4 phybrata metrics are summarized in Tables 1 and 2, respectively. As we have previously reported,35 the increase in Ec vs. Eo for the healthy population (Figure 3A) is statistically significant for both females: F(1,84)=19.45, p<0.0001 and males: F(1,78)=28.05, p<0.0001, while the Ec/Eo ratio (Figure 3B) does not differ significantly as a function of gender: F(1,81)=0.63, p=0.43. Unlike our previous study,35 however, the present data do not show a statistically significant difference between females and males for either Eo: F(1,81)=1.48, p=0.23 or Ec: F(1,81)=0.41, p=0.53. As discussed further below, this latter result is attributed to any gender difference being masked by larger variations resulting from the significantly wider age range of patients in the present study. Although the CPDs span much wider ranges for the patients with diagnosed concussions, the above trends are maintained in the concussed population: the increase in Ec vs. Eo (Figure 3C) is statistically significant for both females: F(1100)=18.65, p<0.0001 and males: F(1,80) = 17.42, p<0.0001; the Ec/Eo ratio (Figure 3D) shows no significant difference as a function of gender: F(1,90)=0.38, p=0.54; and no statistically significant difference is observed between females and males for either Eo: F(1,90)=0.34, p=0.56 or Ec: F(1,90)=1.03, p=0.31. Figure 4 presents box plots comparing differences between the four phybrata metrics for the 83 HB patients and the 92 concussion patients. Means, 95% CIs, and MANOVA results are presented in Table 3. All 4 phybrata metrics show significant statistical correlations (p<0.0001) with the diagnosis of concussion. The average power metric (Eo+Ec)/2 shows the strongest correlation: F(1171)= 164.4, p<0.0001, and may serve as a rapid, simple, and clinically intuitive phybrata-based metric or biomarker to support concussion diagnoses.
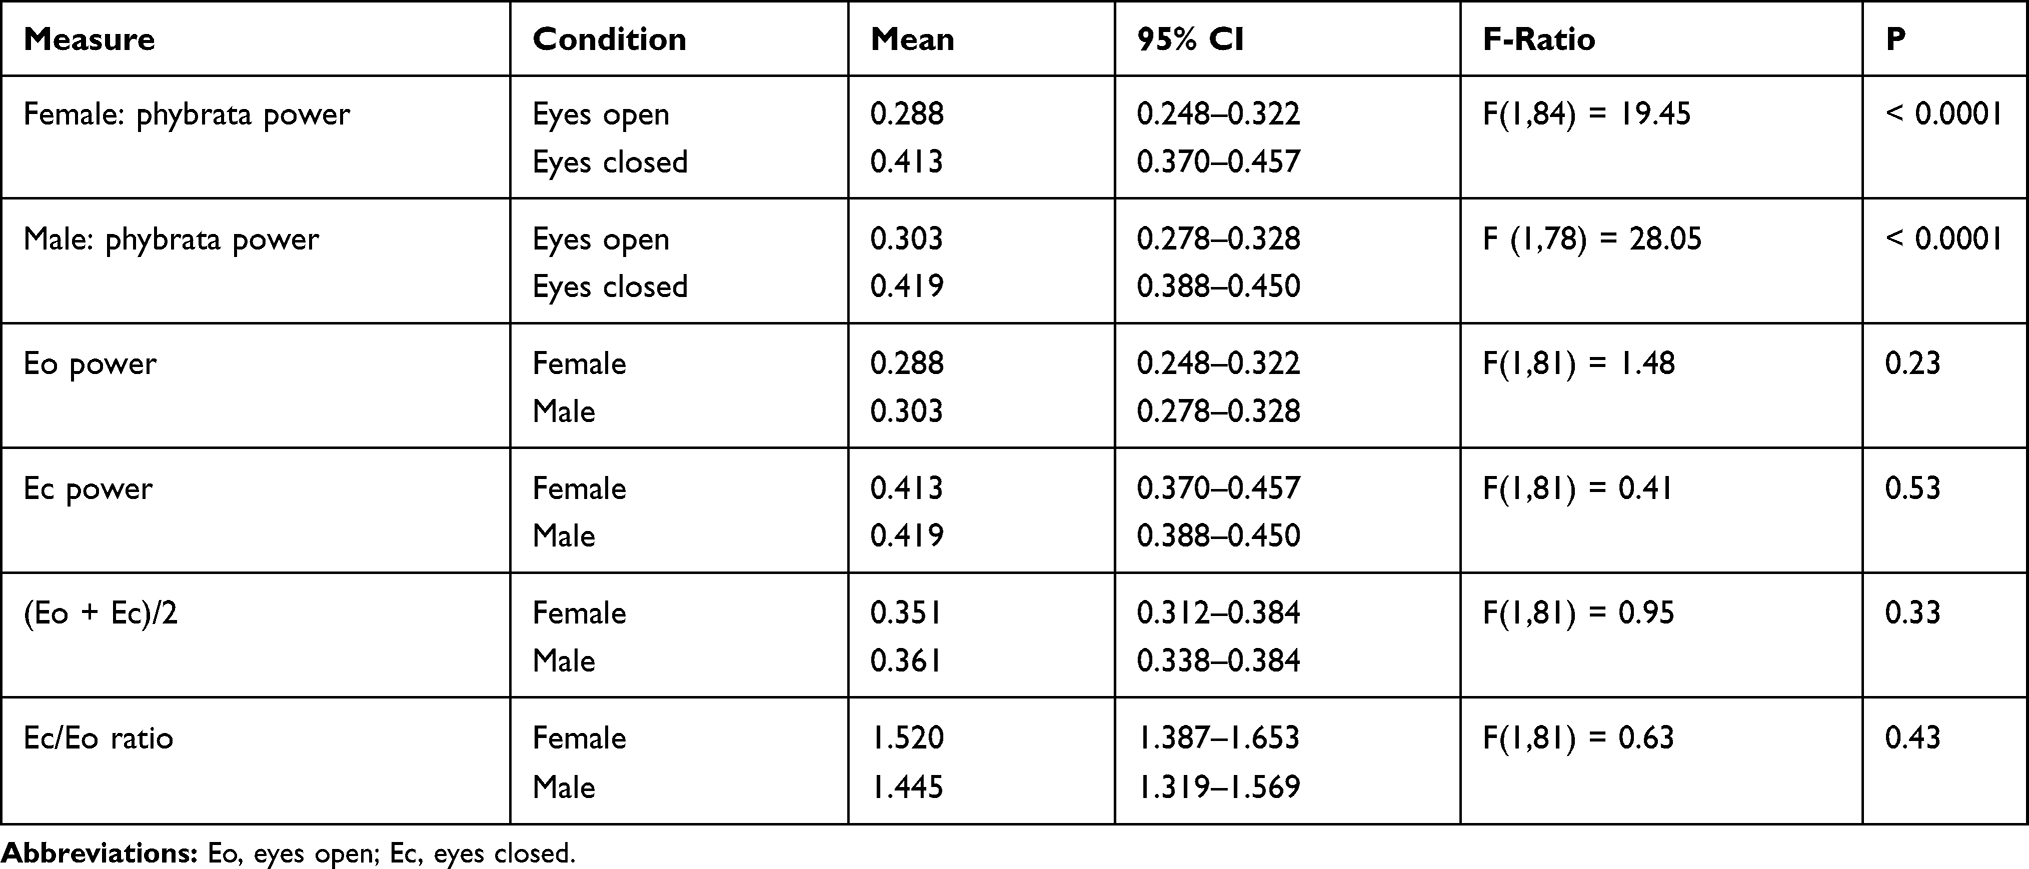 |
Table 1 ANOVA Summary of Phybrata Measurements vs. Eye State and Gender for 83 Healthy Baseline Patients (43F, 40M). |
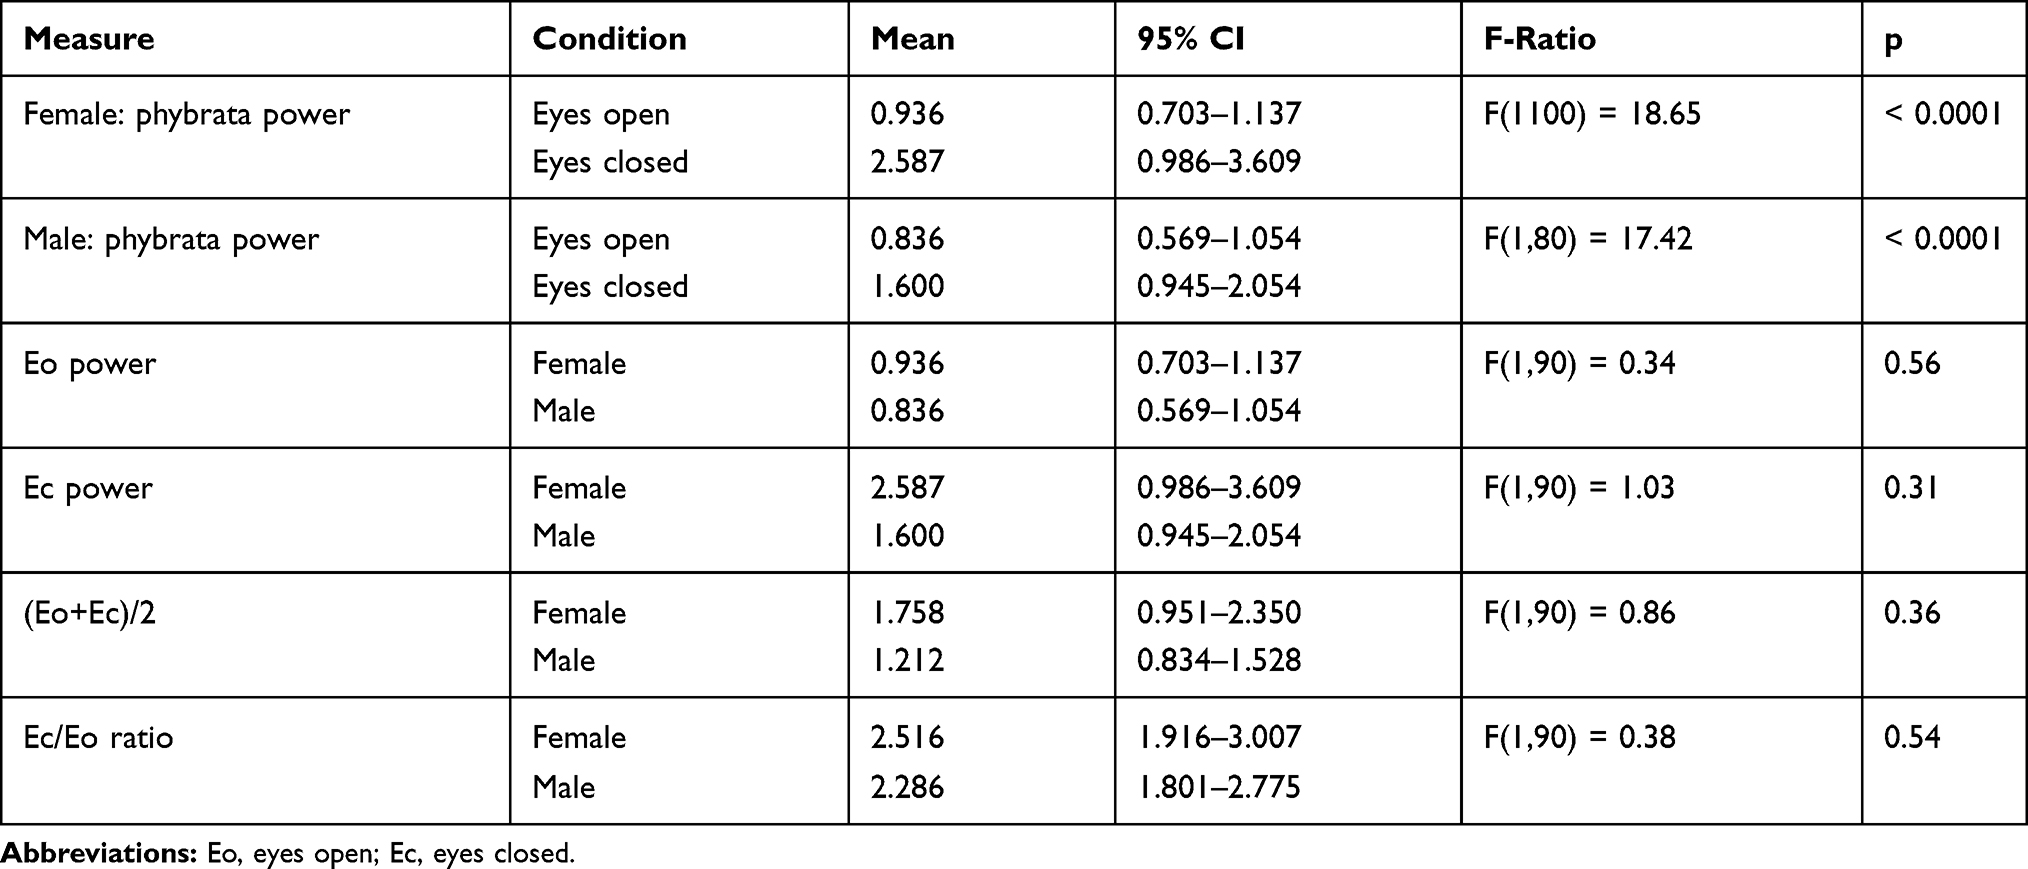 |
Table 2 ANOVA Summary of Phybrata Measurements vs. Eye State and Gender for 92 Patients (51F, 41M) with Diagnosed Concussions. |
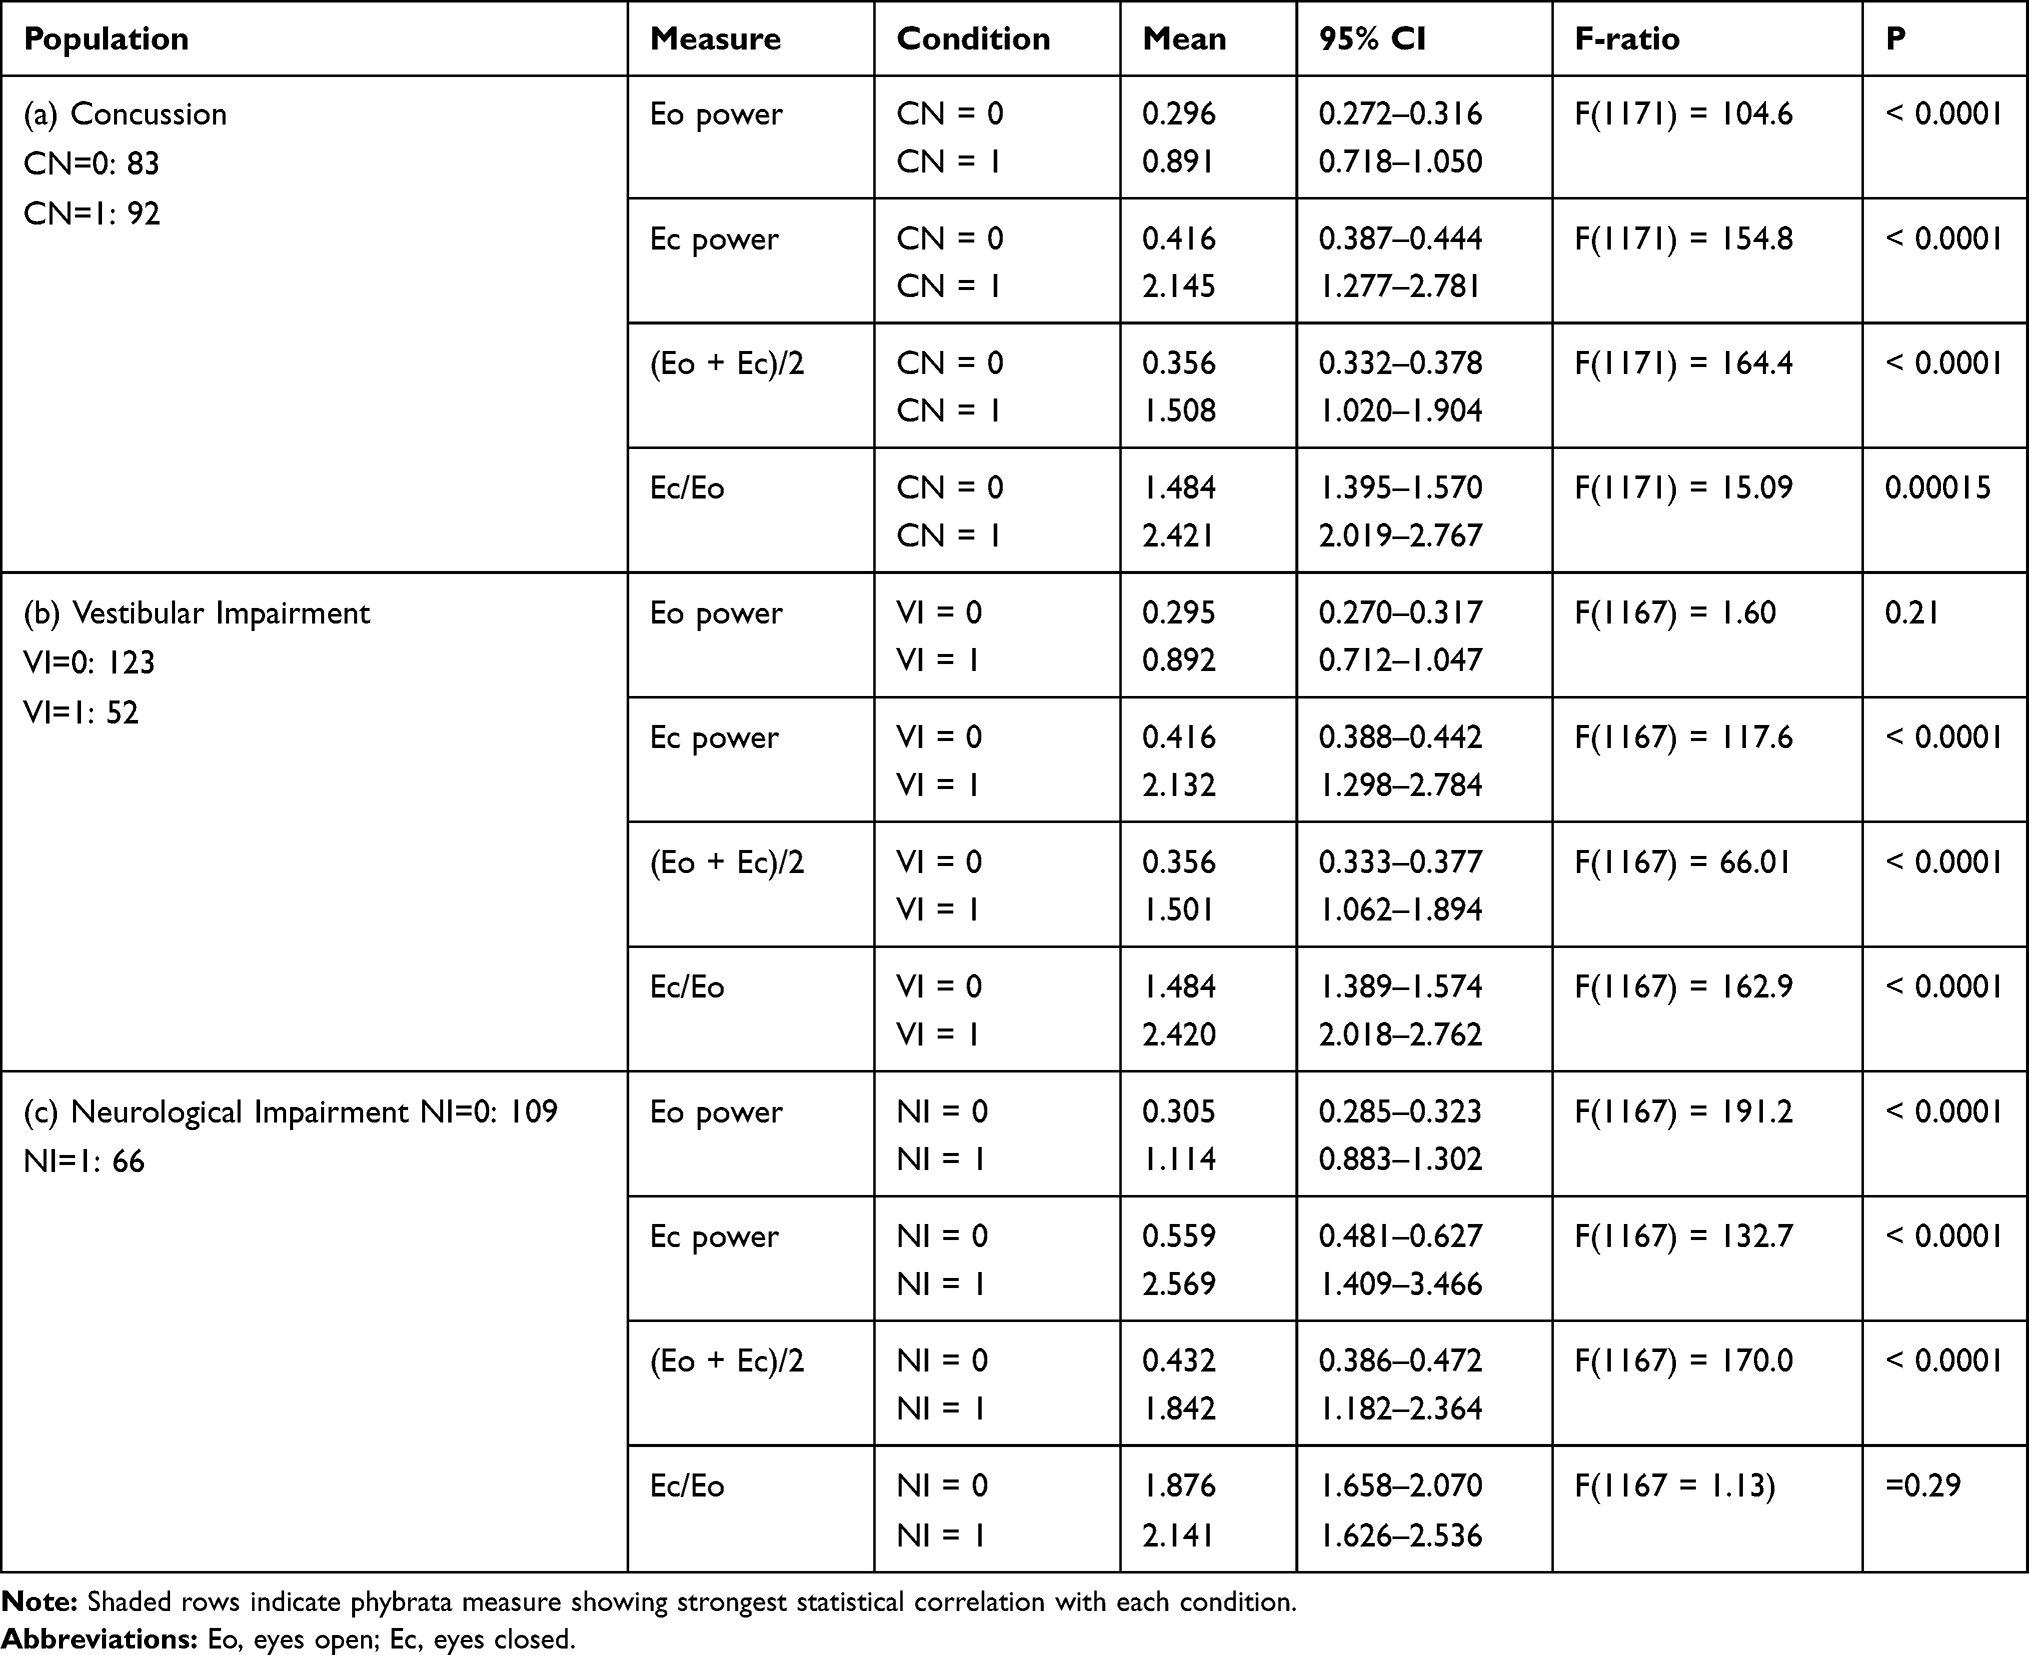 |
Table 3 MANOVA Summary of 4 Phybrata Metrics for Patient Sub-Populations with and without (a) Concussion (CN); (b) Vestibular Impairment (VI); (c) Neurological Impairment (NI). |
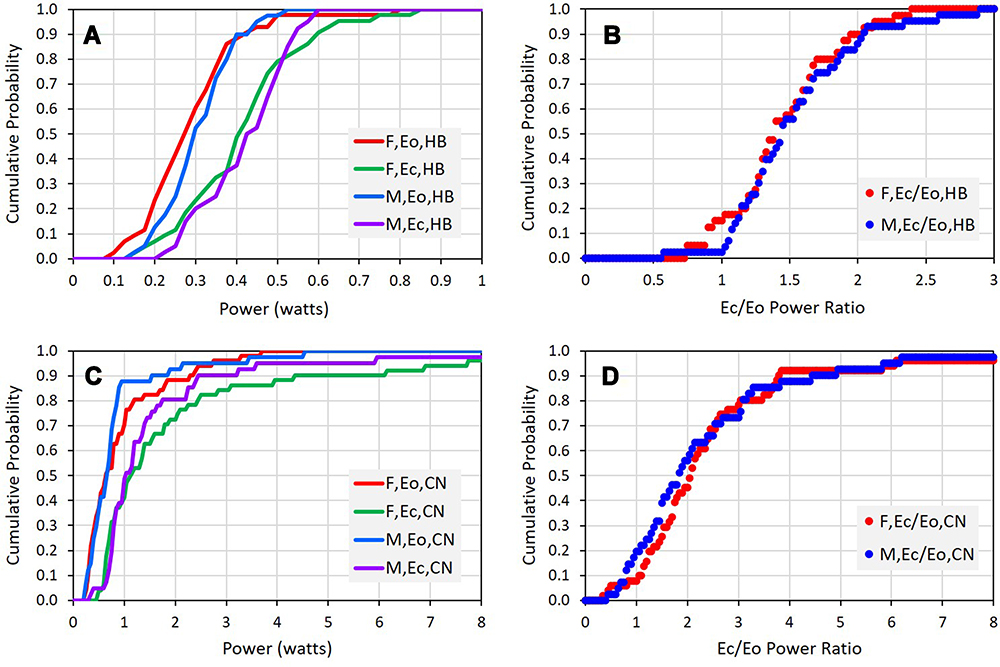 |
Figure 3 Cumulative probability distributions vs. gender and eye state for phybrata metrics for: (A and B), 83 healthy baseline patients (HB); (C and D), 92 patients with diagnosed concussions (CN). Abbreviations: F, female; M, male; Eo, eyes open; Ec, eyes closed. |
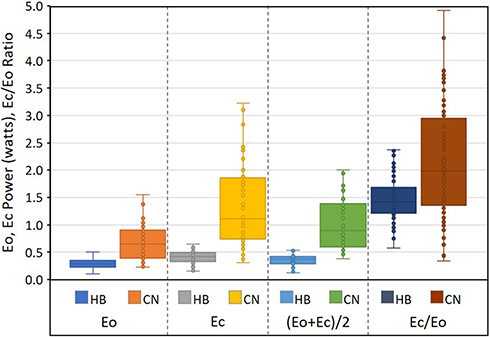 |
Figure 4 Box plots showing distributions of 4 phybrata metrics for 83 healthy baseline patients (HB) and 92 patients with diagnosed concussions (CN). Abbreviations: Eo, eyes open; Ec, eyes closed. |
Figure 5 shows sample Eo and Ec phybrata power histograms and AP/ML acceleration spatial scatter plots for 15 athletes (ages 17–23): 5 healthy athletes during baseline testing (Figure 5A); 5 following a concussion with only vestibular impairments observed during physical examination (Figure 5B); and 5 following a concussion with other neurological impairments observed during physical examination (Figure 5C). Patients with vestibular impairment only consistently showed Eo phybrata powers that remained below the 95% CI for healthy subjects, but Ec phybrata powers elevated above the 95% CI for healthy subjects (Figure 5B). Patients diagnosed with neurological impairment, on the other hand, typically showed both Eo and Ec phybrata powers significantly elevated above the respective 95% CIs for healthy subjects (Figure 5C). This observation is consistent with vestibular impairments presenting more severely in the absence of visual input, while neurological impairments lead to less efficient integration and/or processing of multiple sensory inputs and degraded postural stabilization regardless of which combination of sensory inputs are available.
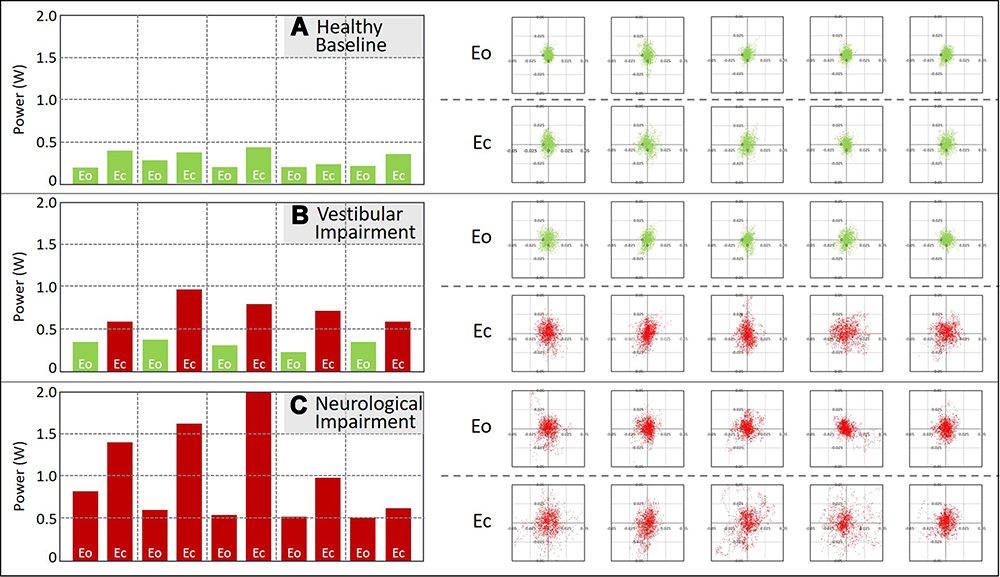 |
Figure 5 Eyes open (Eo) and eyes closed (Ec) phybrata power histograms (left) and anterior-posterior/medial-lateral (AP/ML) acceleration spatial scatter plots (right) for (A) baseline testing of 5 healthy athletes; (B) post-concussion testing of 5 athletes with vestibular impairments; (C) post-concussion testing of 5 athletes with neurological impairments. |
Figure 6 presents box plots and graphs comparing the means of the 4 phybrata metrics for all 175 study participants as a function of the 4 sub-populations: 1) healthy baseline (HB); 2) vestibular impairments only (VI); 3) neurological impairments only (NI); and 4) vestibular and neurological impairments (VNI). Corresponding means, 95% CIs, and MANOVA results are presented in Table 3. Ec/Eo shows both the strongest correlation with vestibular impairment: F(1167)= 162.9, p<0.0001, and no statistically significant correlation with neurological impairment: F(1167)=1.13, p=0.29. Conversely, Eo shows both the strongest correlation with neurological impairment: F(1167)=191.2, p<0.0001, and no statistically significant correlation with vestibular impairment: F(1167)= 1.60, p=0.21. This behavior is strikingly evident in the variations of the means of Eo (Figure 6A) and Ec/Eo (Figure 6B) for the 4 sub-populations, and indicates that Eo and Ec/Eo may be utilized as independent measures to support classification of neurological and vestibular impairments, respectively, in patients with diagnosed concussions. The 2 remaining phybrata metrics, Ec (Figure 6C) and (Eo+Ec)/2 (Figure 6D) show significant correlations to both neurological and vestibular impairments, and thus do not have the same utility as independent measures for impairment classification.
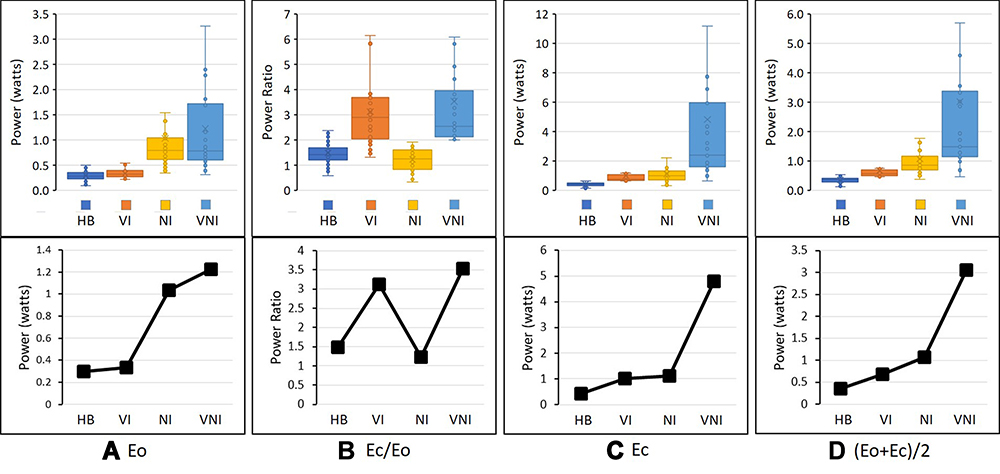 |
Figure 6 Box plots and graphs comparing means of 4 phybrata metrics (A) Eo (B) Ec/Eo (C) Ec (D) (Eo+Ec)/2 for 83 healthy baseline patients (HB); 26 concussion patients with vestibular impairments (VI) only; 40 concussion patients with neurological impairments (NI) only; 26 concussion patients with both vestibular and neurological impairments (VNI). Abbreviations: Eo, eyes open; Ec, eyes closed. |
Figure 7 presents scatter plots of Ec/Eo power ratio vs. Eo power for all 175 study participants, revealing well-defined data clusters for each of the four subpopulations: HB, VI, NI, and VNI. These results further highlight the ability of simple and clinically intuitive metrics/biomarkers derived from phybrata test data to distinguish between patients with/without concussion ((Eo+Ec)/2), and to further independently classify accompanying neurological impairments (Eo) and vestibular impairments (Ec/Eo). Figure 7 also reveals that the data for VNI is split into two sub-clusters in close proximity to the VI-only and NI-only clusters, which may indicate the presence of “predominantly vestibular” vs. “predominantly other neurological” impairments in these patients. Further assessments of larger patient cohorts will be required to better understand this observed behavior.0
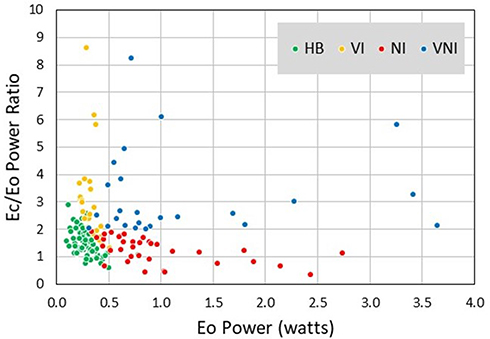 |
Figure 7 Scatter plots of Ec/Eo power ratio vs. Eo power for healthy baseline patients (HB) and concussion patients with vestibular impairments (VI), neurological impairments (NI), and both vestibular and neurological impairments (VNI). Abbreviations: Eo, eyes open; Ec, eyes closed. |
Figure 8 shows ROC curves derived for the four clinical diagnostic criteria (a) CN=0,1; (b) VI=0,1; (c) NI=0,1; and (d) VNI=0,1, and for all possible cutoff values of the 4 phybrata metrics. Key ROC results are summarized in Table 4. As a metric for clinical diagnosis of concussion (Figure 8A), (Eo+Ec)/2 achieves area under the curve (AUC)=0.981 (95% CI = 0.956–0.992), and for a cutoff value of (Eo+Ec)/2=0.49 watts, the corresponding sensitivity and specificity are 0.935 and 0.940, respectively. As a metric for clinical confirmation of the presence of vestibular impairment in patients with diagnosed concussions (Figure 8B), Ec/Eo achieves AUC=0.951 (95% CI=0.904–0.976), and for a cutoff value of Ec/Eo=1.95, the corresponding sensitivity and specificity are 0.904 and 0.902, respectively. As a metric for clinical confirmation of the presence of other neurological impairment in patients with diagnosed concussions (Figure 8C), Eo achieves AUC=0.975 (95% CI = 0.944–0.989), and for a cutoff value of Eo=0.45 watts, the corresponding sensitivity and specificity are 0.924 and 0.936, respectively. Figure 8D indicates that none of the 4 phybrata metrics independently classify the presence of both vestibular and neurological impairments. The above cutoff values for Eo (0.45 watts), (Eo+Ec)/2 (0.49 watts), and Ec/Eo (1.95) agree well with the corresponding 95% CPD values in Figure 3 and the box plot distributions in Figure 4, highlighting the utility of these simple and physiologically intuitive phybrata metrics for rapid diagnostic testing. The ROC results further illustrate the utility of the phybrata metrics Eo and Ec/Eo as independent measures; Eo achieves AUC of only 0.63 as a metric to confirm the presence of vestibular impairment (Figure 8B), while Ec/Eo achieves AUC of only 0.52 as a metric to confirm the presence of neurological impairment (Figure 8C). As discussed further below, these ROC results compare favorably with more complex, time consuming, and expensive approaches that combine data from various balance, eye tracking, neurocognitive, and other tests to generate multimodal concussion biomarkers.
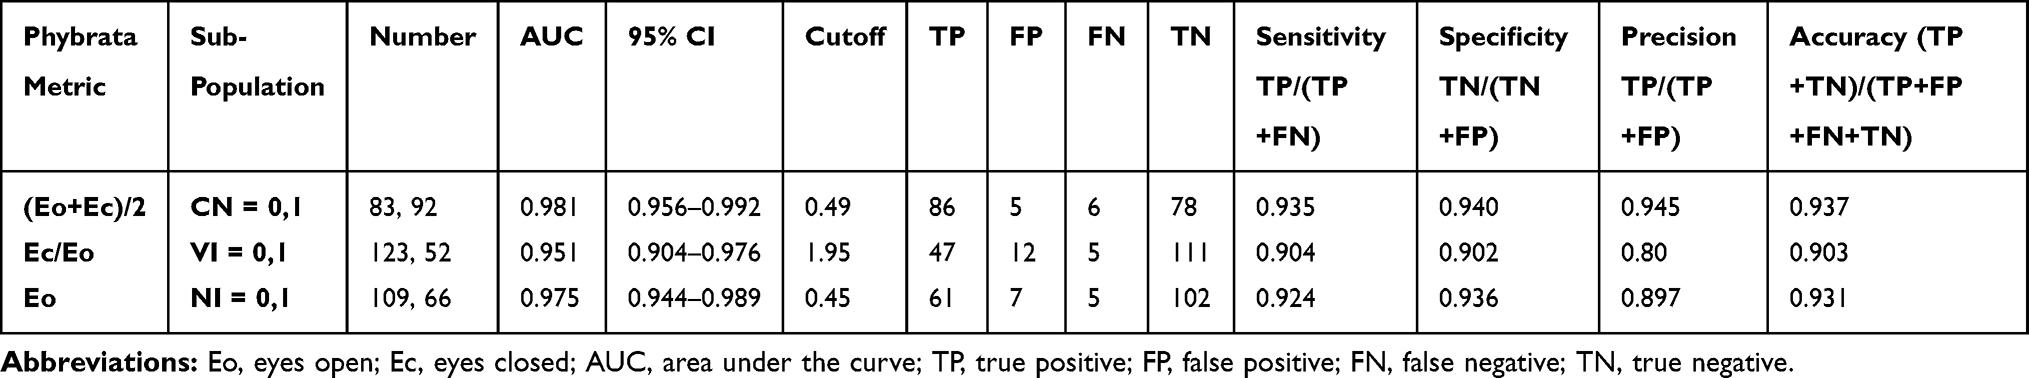 |
Table 4 Summary of Receiver Operating Characteristic (ROC) Curves for (Eo+Ec)/2 as a Diagnostic Measure for Concussion (CN), Ec/Eo as a Diagnostic Metrics for Vestibular Impairment (VI), and Eo as a Diagnostic Measure for Neurological Impairment (NI). |
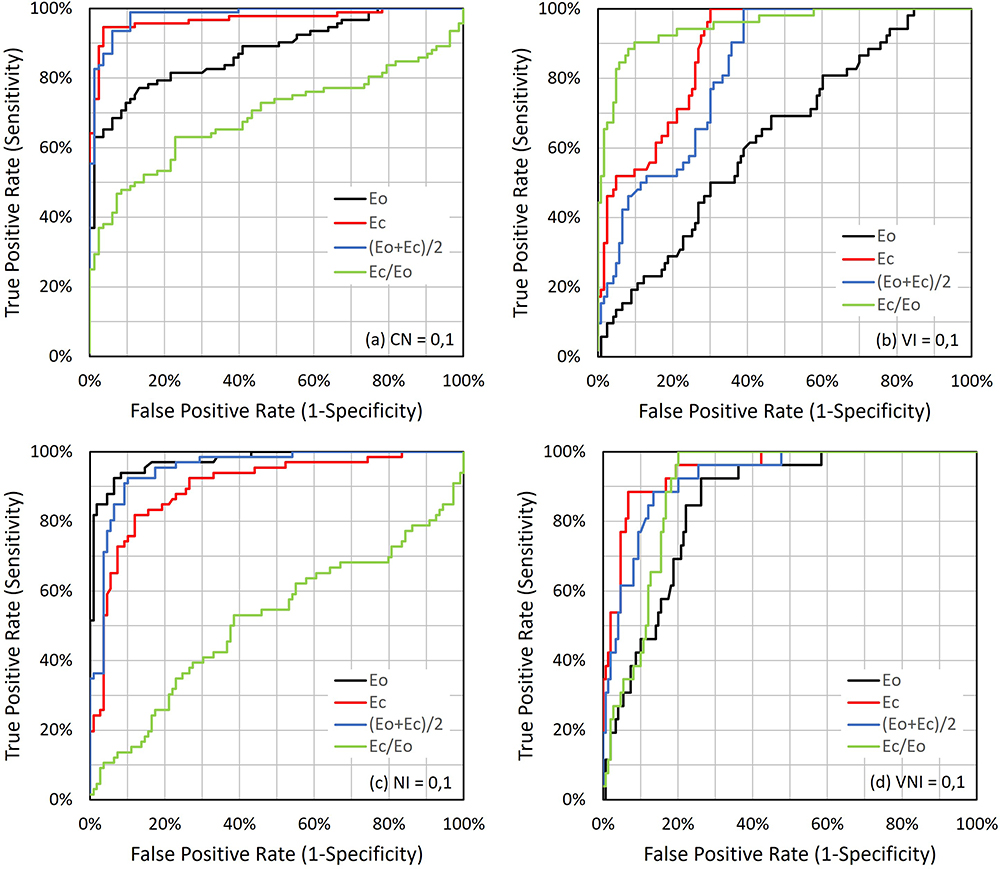 |
Figure 8 Receiver operating characteristic (ROC) curves for 4 clinical diagnostic criteria: (A) concussion (CN=0,1); (B) vestibular impairment (VI=0,1); (C) neurological impairment (NI=0,1); and (D) both vestibular and neurological impairments (VNI), for all possible cutoff values of the 4 phybrata metrics Eo, Ec, (Eo+Ec)/2, Ec/Eo. Abbreviations: Eo, eyes open; Ec, eyes closed. |
To investigate sensory reweighting, Figures 9–12 present normalized ensemble TRPSD plots and spectrograms for the same 15 patients and 3 sub-populations for whom data is presented in Figure 5. Figure 9 presents Eo/AP results, and includes normalized ensemble TRPSD plots (left) for 5 HB patients (Figure 9A), post-concussion testing of 5 patients with vestibular impairment (Figure 9C), and post-concussion testing of 5 patients with neurological impairment (Figure 9E), along with spectrograms (right) for the same 3 sub-populations (Figure 9B, D and F, respectively). Figure 10 presents Ec/AP results, and includes normalized ensemble TRPSD plots (left) for 5 HB patients (Figure 10A), post-concussion testing of 5 patients with vestibular impairment (Figure 10C), and post-concussion testing of 5 patients with neurological impairment (Figure 10E), along with spectrograms (right) for the same 3 sub-populations (Figure 10B, D and F, respectively). Figure 11 presents Eo/ML results, and includes normalized ensemble TRPSD plots (left) for 5 HB patients (Figure 11A), post-concussion testing of 5 patients with vestibular impairment (Figure 11C), and post-concussion testing of 5 patients with neurological impairment (Figure 11E), along with spectrograms (right) for the same 3 sub-populations (Figure 11B, D and F, respectively). Figure 12 presents Ec/ML results, and includes normalized ensemble TRPSD plots (left) for 5 HB patients (Figure 12A), post-concussion testing of 5 patients with vestibular impairment (Figure 12C), and post-concussion testing of 5 patients with neurological impairment (Figure 12E), along with spectrograms (right) for the same 3 sub-populations (Figure 12B, D and F, respectively). For all 3 sub-populations, a wider range of frequency content is observed for AP motion than for ML motion, consistent with previous studies of healthy young populations,74,134,135 and this relationship is preserved following both vestibular and neurological impairments. For both AP and ML motion and all 3 sub-populations, overall Ec powers are higher than Eo powers, but the normalized high-frequency Ec spectral content is reduced compared to Eo. This relative shift to higher overall postural sway power with lower frequency content has previously been reported and attributed to a shift to a more conservative postural control strategy in the absence of visual input: higher frequency motion resulting from passive, open-loop, continuous, and more complex muscle and joint motion strategies is reduced while lower frequency motion resulting from active, closed-loop, intermittent, and lower complexity activation of musculoskeletal structures increases.31,99,142 This same overall behavior is observed even more dramatically in Figures 9–12 in the sequential differences in both AP and ML TRPSD results proceeding from no impairment to vestibular impairment to neurological impairment, consistent with published results using alternative measurement tools to assess physiological impairments following concussion.37–47
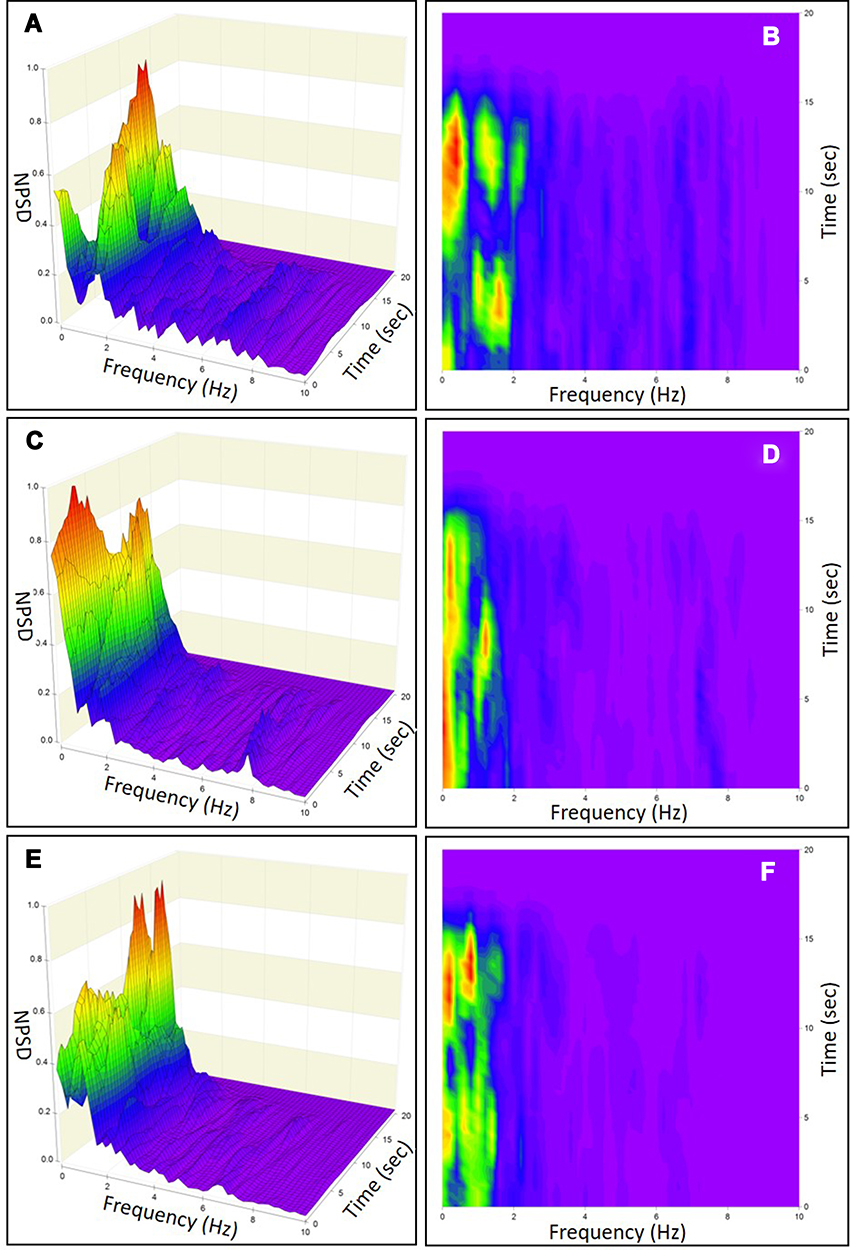 |
Figure 9 Normalized ensemble eyes-open (Eo) anterior-posterior (AP) time-resolved phybrata power spectral density (NPSD) plots (left) and spectrograms (right) for (A and B) baseline testing of 5 healthy patients; (C and D) post-concussion testing of 5 patients with vestibular impairment; (E and F) post-concussion testing of 5 patients with neurological impairment. |
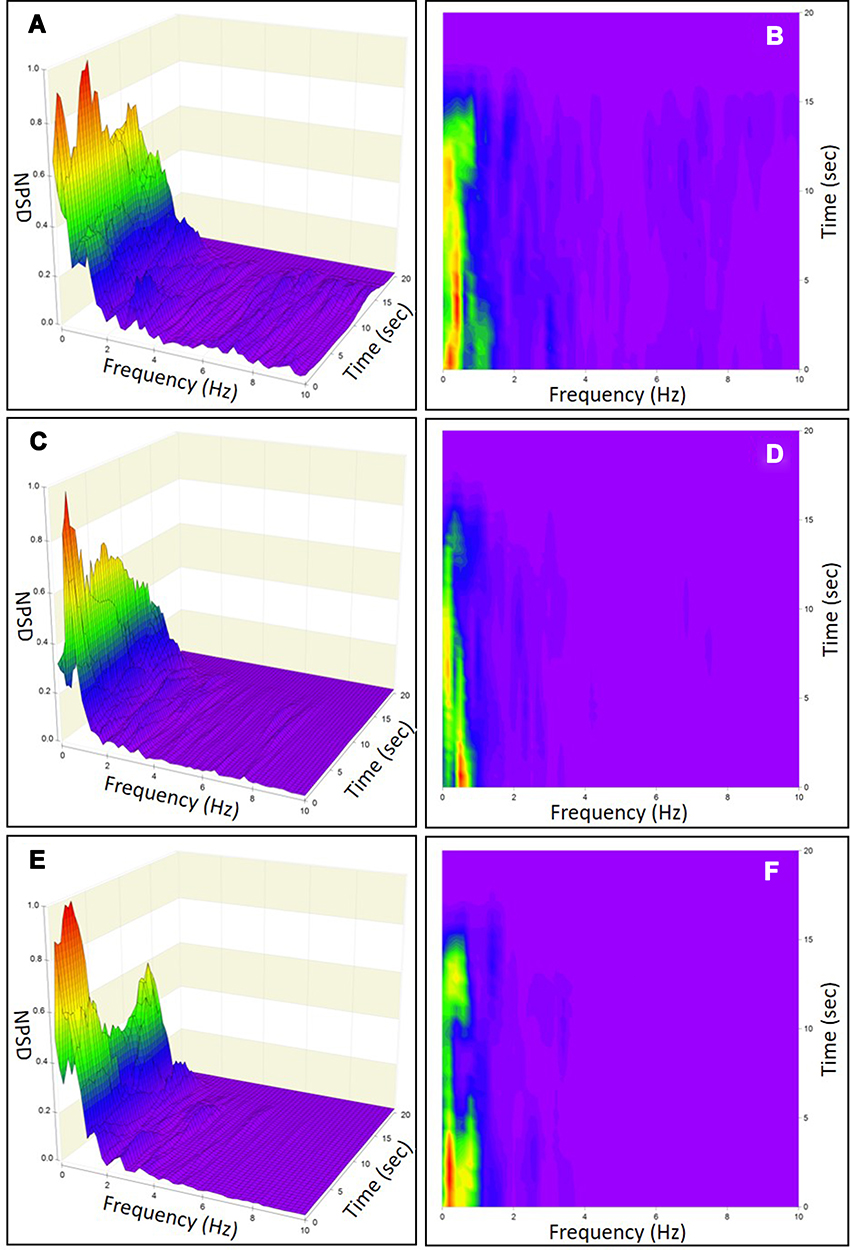 |
Figure 10 Normalized ensemble eyes-closed (Ec) anterior-posterior (AP) time-resolved phybrata power spectral density (NPSD) plots (left) and spectrograms (right) for (A and B) baseline testing of 5 healthy patients; (C and D) post-concussion testing of 5 patients with vestibular impairment; (E and F) post-concussion testing of 5 patients with neurological impairment. |
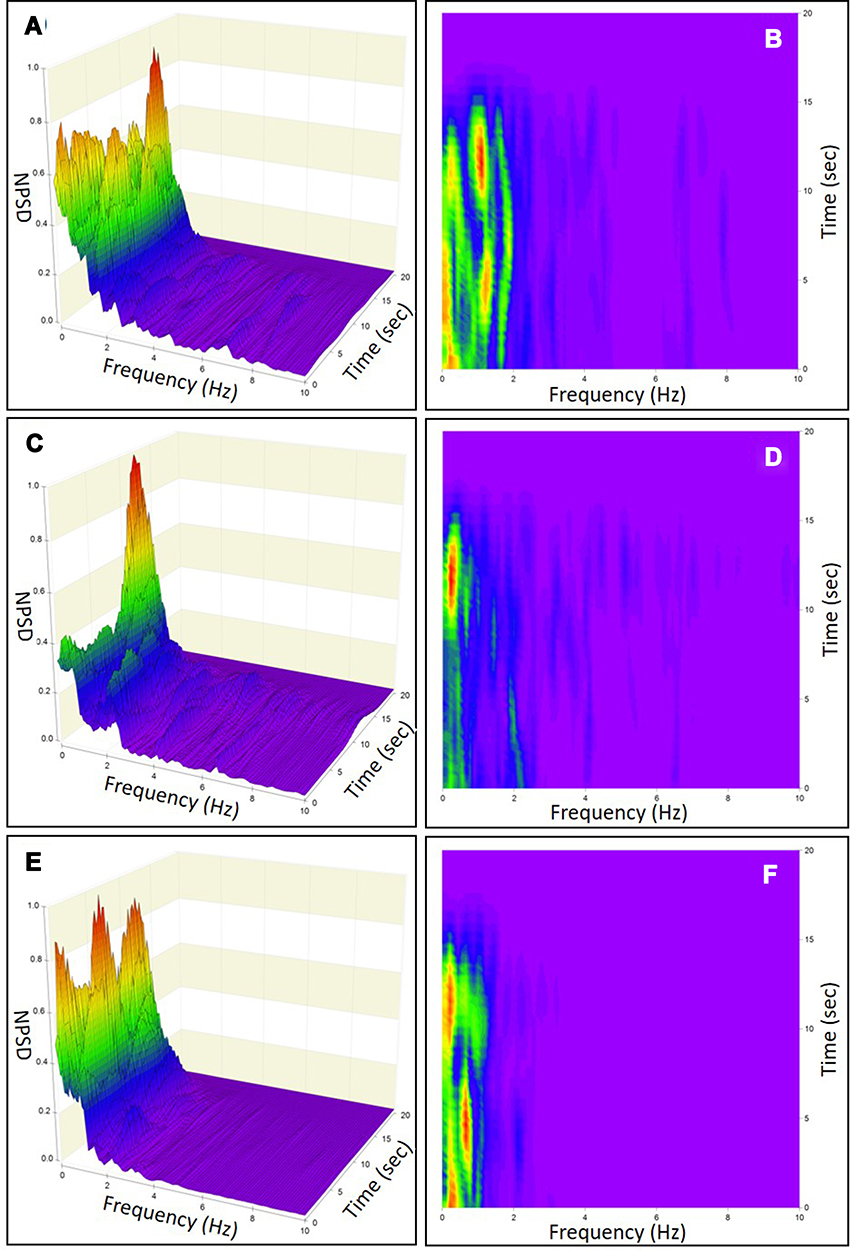 |
Figure 11 Normalized ensemble eyes-open (Eo) medial-lateral (ML) time-resolved phybrata power spectral density (NPSD) plots (left) and spectrograms (right) for (A and B) baseline testing of 5 healthy patients; (C and D) post-concussion testing of 5 patients with vestibular impairment; (E and F) post-concussion testing of 5 patients with neurological impairment. |
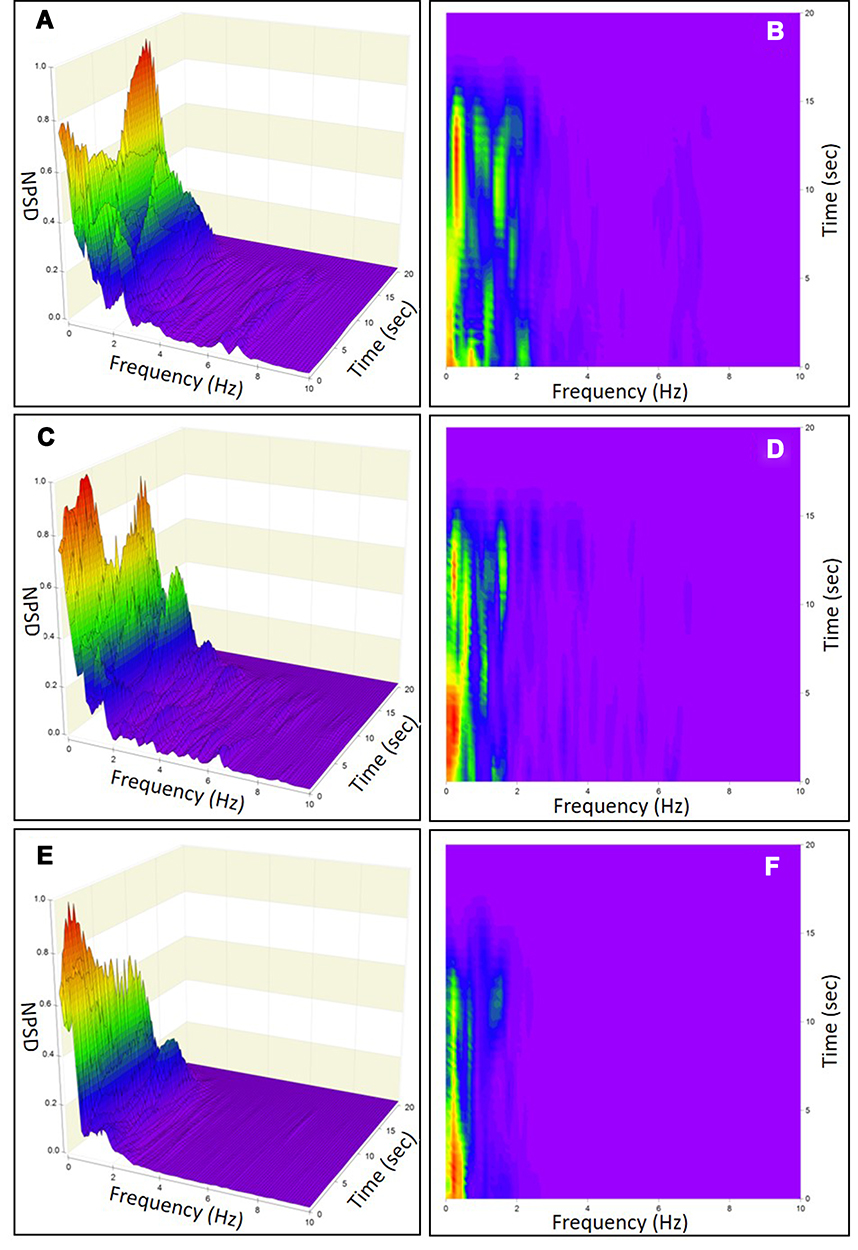 |
Figure 12 Normalized ensemble eyes-closed (Ec) medial lateral (ML) time-resolved phybrata power spectral density (NPSD) plots (left) and spectrograms (right) for (A and B) baseline testing of 5 healthy patients; (C and D) post-concussion testing of 5 patients with vestibular impairment; (E and F) post-concussion testing of 5 patients with neurological impairment. |
Sensory reweighting as a function of specific mechanisms of postural control was investigated by calculating relative changes within 4 frequency bands31,89,91 in the above normalized TRPSD spectra: 1–10Hz (spinal reflexive loops, proprioception, multi-joint and muscle activity); 0.5–1 Hz (CNS participation, both cerebellar and cortical); 0.1–0.5 Hz (vestibular regulation); 0.02–0.1 Hz (visual regulation). Figure 13 plots the change in normalized PSD between Eo and Ec calculated by integrating over time and frequency in each of the 4 frequency bands for the 5 individuals with no diagnosed impairment. For each frequency band, the PSD changes for AP and ML ensembles are averaged. As in Figures 9–12, overall Ec powers are higher than Eo powers, but Figure 13 reveals the changes in relative redistribution of the normalized power between the 4 spectral bands for Ec vs. Eo. Removing the visual input leads to a small decrease in normalized power in the lowest frequency band, corresponding to the loss of visual regulation, and a large relative decrease in proprioceptive activity (highest frequency band) that is offset by a large relative increase in the vestibular band and a smaller relative increase in the CNS band. This observation is consistent with sensory reweighting to a more conservative postural control strategy in the absence of visual input. Figure 14 plots the changes in normalized PSD, over the same 4 frequency bands, between the 5 individuals with no diagnosed impairment (HB) and: 1) those with diagnosed vestibular impairment only (VI); and 2) those with diagnosed neurological impairment only (NI). For each frequency band, the normalized PSD changes for Eo/AP, Ec/AP, Eo/ML, and Ec/ML ensembles are averaged. Both vestibular and neurological impairments lead to a large relative decrease in higher frequency proprioceptive activity that is offset primarily by relative increases in both the vestibular and CNS bands. However, vestibular impairment is accompanied by a larger increase in normalized PSD in the vestibular band, while neurological impairment is accompanied by a larger increase in normalized PSD in the CNS band. This observation is consistent with lower efficiencies and higher overall energy dissipations in the postural stabilization contributions from individual physiological systems suffering from impairments.89
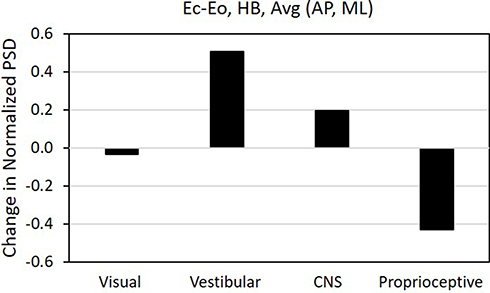 |
Figure 13 Change in normalized ensemble power spectral density (PSD) between eyes-open (Eo) and eyes-closed (Ec) for 5 healthy baseline patients (HB). Ensemble average {AP, ML} PSD changes are summed over phybrata frequency bands corresponding to visual, vestibular, central nervous system (CNS), and proprioceptive control. Abbreviations: AP, anterior-posterior; ML, medial-lateral. |
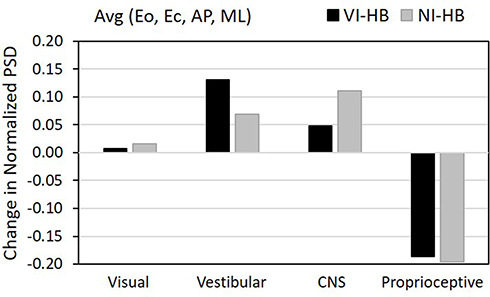 |
Figure 14 Change in normalized ensemble power spectral density (PSD) between 5 healthy baseline patients (HB) and: 1) 5 concussion patients with vestibular impairment (VI); and 2) 5 concussion patients with neurological impairment (NI). For each group, ensemble average {Eo, Ec, AP, ML} PSD changes are summed over phybrata frequency bands corresponding to visual, vestibular, central nervous system (CNS), and proprioceptive control. Abbreviations: Eo, eyes open; Ec, eyes closed; AP, anterior-posterior; ML, medial-lateral. |
In order to investigate post-concussion injury recovery, Figure 15 presents a series of normalized TRPSD plots and spectrograms, along with AP/ML acceleration spatial scatter plots and bar graphs of phybrata power for an athlete measured at 4 different times: pre-season testing with no diagnosed impairment (Figure 15A); clinical diagnosis 6 days post-concussion with neurological impairment (Figure 15B); testing during concussion rehab 14 days post-injury (Figure 15C); and testing during concussion rehab 21 days post-injury (Figure 15D). The relative shift to higher overall phybrata power with lower frequency content following concussion is evident between baseline and 6 days post-concussion. Progressive recovery is observed at 14 days and 21 days by decreasing phybrata power and recovery of more complex higher frequency proprioceptive and musculoskeletal activity. These results demonstrate the utility of phybrata testing to deliver a comprehensive picture of each patient’s unique impairment signature at the time of injury and changes during subsequent treatment and rehab.
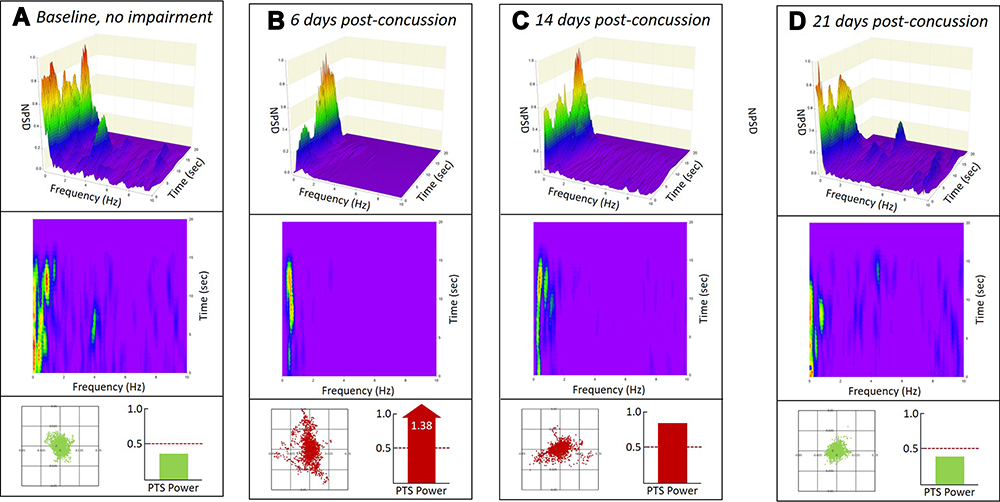 |
Figure 15 Normalized eyes-closed (Ec) anterior-posterior (AP) time-resolved phybrata power spectral density (NPSD) plots (top) and spectrograms (middle), along with phybrata spatial scatter plots (bottom, left), and phybrata power bar graphs (bottom, right) for an athlete tested (A) healthy/baseline; (B) 6 days post-concussion with neurological impairment; (C) 14 days post-concussion; and (D) 21 days post-concussion. |
Discussion
The results presented above demonstrate the ability of data from a phybrata sensor worn on the mastoid to confirm clinical diagnosis of concussion, provide independent measures that confirm the presence of accompanying neurological and vestibular impairments, and quantify the progression of multi-system physiological impairments and sensory reweighting following concussion. ROC results have been previously reported for a variety of concussion diagnostics tools and biomarkers, including symptoms inventories,146,147 neurocognitive testing,148–154 analyses of head impact kinematics,155–158 postural stability assessments,39,159,160 gait analysis,161 eye movement tracking,162–166 vestibular and oculomotor screening,167,168 visually evoked potentials,169 electrovestibulography,45 robotic assessment of neuromotor performance,170 blood-based biomarkers,171–174 salivary biomarkers,175 EEG,176 and MRI assessments of alterations in cerebral blood flow.177 Many components of traditional neurocognitive testing have been shown to have limited predictive value,151 and the use of reduced variable subsets (including balance and eye tracking) has recently been recommended.153 Results matching the ROC diagnostic performance of the present phybrata approach have generally required multivariate composite models that combine data from various balance, eye tracking, neurocognitive, and other tests to generate more complex multimodal concussion biomarkers.178–182
It is expected that the above ROC diagnostic performance of the phybrata sensor may be further enhanced by segmenting patients according to age. CDP-based studies of the age-dependent maturation of sensory systems have revealed that generalized postural stability increases with age but does not reach adult levels until the age of 16 years or later.107 Somatosensory function has been found to develop earliest, becoming comparable with adult levels by the age of 3–4 years, followed by visual function, which reaches adult levels by the age of 15. The vestibular function requires the longest development period and may not reach adult levels until the age of 16 or older. ANOVA results using 16 years of age as a cutoff to divide the 83 HB individuals in the current study into two groups (40 individuals aged 8–15 years and 43 individuals aged 16–74 years) yielded a statistically significant difference between (Eo+Ec)/2 for the two age groups at the p<0.05 level: F(1,81)=3.97, p=0.0498. Further age-based segmentation can be incorporated to take account of the degraded postural stability observed in healthy older populations.66,99,101
Additional opportunities to further enhance the ROC diagnostic performance of the phybrata sensor include leveraging additional features and patterns that can be extracted from the sensor data, and training machine learning models to automate impairment classification. The results presented in Figures 9–15 indicate that there are many additional unique spatial, time-domain, and frequency-domain features that can be extracted from phybrata time series data, spatial scatter plots, and frequency-domain analyses that have the potential to further enhance ROC performance by identifying and eliminating false positives and false negatives. Finally, the distinct data clustering observed in Figure 7 for healthy and impaired individuals is consistent with the unique structure of phybrata data allowing machine learning models with high levels of classification performance to be trained with relatively small clinical data sets.145 This promising behavior is being investigated in further detail for a variety of traditional machine learning and deep learning models, with the goal of reducing the computational complexity sufficiently to incorporate machine learning classification directly into the phybrata sensor. Such a wearable device, capable of cloud-independent classification and quantification of multiple physiological impairments would greatly enhance remote patient monitoring and management of many chronic medical conditions.
To our knowledge, ROC results providing independent classification of neurological and vestibular impairments from a single test using a non-invasive wearable device have not previously been reported. The distinction between vestibular organ and brain injury is vital since the appropriate course of treatment and rehabilitation will typically be quite different. However, many concussion patients are still managed uniformly, despite the nature of their injuries, in the hopes that the pertinent physiological impairments will be addressed. Treatment efficiency and patient outcomes can be significantly improved using a tool such as phybrata testing to identify, quantify, and track changes in impairments to specific physiological impairments.
One important limitation of the current work is that the terms “vestibular impairment” and “neurological impairment” remain broad and include a wide range of potential underlying pathologies. Future studies will investigate the degree to which phybrata assessments can provide more detailed classification and tracking of concussion-induced impairments to the CNS (e.g., cortical183 vs. cerebellar184), PNS (e.g., somatic185 vs. autonomic186), vestibular system (e.g., peripheral vs. central,187 and musculoskeletal system (e.g., impairments to specific muscles and joints38), as well as utilizing these additional details as biomarkers to identify different concussion phenotypes188,189 and to develop quantitative clinical endpoints to support return-to-activity decisions. Data currently being collected from clinical cohorts with a variety of other neurogenerative medical conditions will be utilized to assess the degree to which the wide range of spatial, time-domain, and frequency-domain features and patterns in phybrata data can used to develop biomarkers with sufficient sensitivity and specificity to diagnose specific medical conditions in addition to their underlying physiological impairments, as well as to support corresponding phenotyping and the development of clinical endpoints for treatment, rehabilitation planning, and pharmaceutical development and clinical trials.
Phybrata data may also be important for the development, refinement, and testing of biomechanical postural sway models that include the full range of active vs. passive, open-loop vs. closed-loop, intermittent vs. continuous, and high-complexity vs. low-complexity control behaviors that have been proposed to account for normal and impaired postural stability and sensory reweighting.11,12,21,31,67,99,100,121,142 For example, in Figures 9–12 and Figure 15, higher frequency spinal reflexive loops, proprioception, and more complex multi-joint and muscle activity contributions > 4Hz appear to continuously regulate postural sway, corresponding to open-loop, automatic, “learned” balance strategies, as opposed to lower frequency CNS, vestibular, and visual contributions that clearly reflect the intermittent feedback control arising from CNS integration and processing of multiple sensory afferent and efferent signals. In the case of concussion injuries, the observed loss of higher frequency coordination, whether due to musculoskeletal/proprioceptive impairment or a shift to a more conservative closed-loop control and ankles-only strategy, may contribute to increased risk of subsequent musculoskeletal injury if not fully rehabilitated before returned to play.38 Even relatively simple inverted pendulum and feedback control models of the human postural control system can generate COP/COM spatial and time-series traces whose gross features closely resemble physiologically measured postural sway data. Variations in the values of parameters such as joint stiffness, damping, feedback time delays, and noise levels are sufficient, for example, to account for typical differences between measured data for healthy elderly vs. young subjects.121 However, models that can replicate the detailed spatial, time-domain, and frequency-domain multi-impairment and sensory reweighting behaviors observed for concussions and many other complex neurodegenerative medical conditions have not yet been developed, but models with this level of sophistication will be required to provide effective digital twin monitoring in clinical and remote health care environments. The phybrata data analysis presented in the present work also offers a clinically intuitive alternative to more complex postural sway data analysis approaches such as approximate entropy,37,82 stabilogram diffusion analysis,67,190 and wavelet analysis.94,191
The present observation that concussed individuals categorized as having a vestibular-specific impairment presented with a dissociable pattern of abnormal balance performance, compared to those categorized as having a more general neurological impairment, highlights the importance of testing vestibular-specific balance control mechanisms.144 EVS is an effective method for isolating vestibular balance function without stimulating other sensory systems contributing to balance and motor control (vision, proprioception).192–194 Vestibular evoked myogenic potentials (VEMPs), short latency, vestibular-dependent reflexes that are evoked by short bursts of sound delivered through headphones or vibration applied to the skull, have been shown to preferentially activate the otolith organs rather than the semicircular canals and are used clinically to measure otolith function.193,195 EVS involves applying electrical current through electrodes placed over the mastoid processes of the skull, which is the same anatomical location as the phybrata devices used in the present study, making the integration of EVS functionality into the next-generation of phybrata devices a logical and important next step. With EVS, electrical current is used to directly stimulate (i.e., alter the cellular membrane potential) of both the vestibular hair cell receptors within the otoliths and semicircular canals and the vestibular afferent neurons that innervate them, with a greater effect on the irregularly firing than the regularly firing afferent nerve fibers.193,194 EVS can be applied with many different types of stimulus waveforms to probe vestibular-specific balance control mechanisms88 and impairments44 or, in conjunction with eye-tracking, to probe vestibulo-ocular reflex function196,197 similar to the clinical VOMS testing used in the present study. In addition to assessing vestibular balance control, EVS can also be utilized to evoke compensatory whole-body balance responses, both tilt and rotation. This capability presents the opportunity to integrate EVS functionality with the phybrata sensor’s precision motion detection as the basis of a vestibular prosthesis198–201 that can monitor an individual’s postural stability and provide real-time feedback for calculating corrective or offsetting electrical vestibular stimuli to significantly reduce or counteract degraded sway in arbitrary directions, reduce or eliminate pathological motion such as head tremors, or reduce fall risks in elderly and other balance-impaired populations. The many demonstrated applications of EVS, together with the results of the present study revealing a vestibular-specific signature in the postural control of a sub-group of concussed patients, indicate significant utility for a future EVS-enabled phybrata wearable device to assess, monitor, and enhance balance performance both in clinical settings and remotely, and for many different clinical, athletic, industrial, and military populations suffering from concussions and other injury, disease, or age-related disorders.
Conclusions
The phybrata sensor presented in the present study provides a simple, wearable, non-invasive, and clinically intuitive alternative to more complex approaches currently used for objective identification and quantification of impairments and sensory reweighting affecting multiple physiological systems following concussion injuries. Phybrata testing contributes to a more comprehensive picture of each patient’s unique impairment signature and helps guide targeted rehabilitation strategies and track recovery trajectories, both in the clinic and via remote patient monitoring. The results present a consistent and cohesive pattern that integrates complimentary results from current research and practice in industrial, athletic, and clinical medicine, and highlight significant opportunities to improve clinical assessments, recovery management, and return-to-activity decision-making for concussion patients. Future work will focus on further enhancing the ROC diagnostic performance of the phybrata sensor for concussion patients, expanding applications to other medical conditions, leveraging machine learning to automate phybrata-based diagnoses, integrating EVS-based diagnostic and therapeutic capabilities into the phybrata device, and developing biomechanical phybrata models that can serve as digital twins in advanced digital health care applications.
Abbreviations
IMU, inertial motion unit; Eo, eyes open; Ec, eyes closed; CNS, central nervous system; PNS, peripheral nervous system; CI, confidence interval; ROC, receiver operating characteristic; AUC, area under the curve; TP, true positive; FP, false positive; FN, false negative; TN, true negative; PSD, phybrata spectral density; TRPSD, time-resolved phybrata spectral density; CDP, computerized dynamic posturography; qEEG, quantitative electroencephalography; MEP, motor evoked potentials; EMG, electromyography; EVS, electrical vestibular stimulation; VEMP, vestibular evoked myogenic potential; fMRI, functional magnetic resonance imaging; fNIRS, functional near-infrared spectroscopy; BBS, Berg balance scale; BESS, balance error scoring system; BEST, balance evaluation systems test; COP, center-of-pressure; COM, center-of-mass; SEP, somatosensory evoked potential; SOT, sensory organization test; MEMS, micro-electromechanical system; ASD, acceleration spectral density; SCAT, sport concussion assessment tool; VOMS, vestibular ocular motor screening; ANOVA, analysis of variance; MANOVA, multiple analysis of variance; BLE, bluetooth low-energy; AP, anterior-posterior; ML, medial-lateral; CPD, cumulative probability density; HB, healthy baseline; CN, diagnosed concussion; VI, vestibular impairment; NI, neurological impairment; VNI, vestibular and neurological impairments; AUC, areas under the curve.
Acknowledgments
The authors wish to thank Andreas Hauenstein for support in developing and maintaining the mobile app and cloud data platform used in this study, and Madeline Cosh for supporting clinical data collection at the Benson Concussion Institute in Calgary. PROTXX, Inc. provided the sensors, mobile app, and cloud data platform used in this study.
Disclosure
John Ralston is the founder and CEO of PROTXX, Inc. and has a financial interest in the company and reports a US provisional patent pending. Ashutosh Raina reports previously serving as a consultant to Protxx and as the company's Chief Medical Officer – Neurology. Joshua M Roper and Andreas B Ralston are employees of PROTXX, Inc. The authors report no other potential conflicts of interest in this work.
References
1. Galea OA, Cottrell MA, Treleaven JM, O’Leary SP. Sensorimotor and physiological indicators of impairment in mild traumatic brain injury: a meta-analysis. Neurorehabil Neural Repair. 2018;32(2):115–128. doi:10.1177/1545968318760728
2. Memar MH, Seidi M, Margulies S. Head rotational kinematics, tissue deformations, and their relationships to the acute traumatic axonal injury. J Biomech Eng. 2020;142(3):031006. doi:10.1115/1.4046393
3. Cheng B, Knaack C, Forkert ND, Schnabel R, Gerloff C, Thomalla G. Stroke subtype classification by geometrical descriptors of lesion shape. PLoS One. 2017;12(12):e0185063. doi:10.1371/journal.pone.0185063
4. Khezrian M, Myint PK, McNeil C, Murray AD. A review of frailty syndrome and its physical, cognitive and emotional domains in the elderly. Geriatrics (Basel). 2017;2(4):36. doi:10.3390/geriatrics2040036
5. Vellinga MM, Geurts JJ, Rostrup E, et al. Clinical correlations of brain lesion distribution in multiple sclerosis. J Magn Reson Imaging. 2009;29(4):768–773. doi:10.1002/jmri.21679
6. Kouli A, Torsney KM, Kuan WL. Parkinson’s disease: etiology, neuropathology, and pathogenesis. In: Stoker TB, Greenland JC editors. Parkinson’s Disease: Pathogenesis and Clinical Aspects. Codon Publications;2018. doi:10.15586/codonpublications.parkinsonsdisease.2018.ch1
7. Lam B, Masellis M, Freedman M, Stuss DT, Black SE. Clinical, imaging, and pathological heterogeneity of the Alzheimer’s disease syndrome. Alzheimers Res Ther. 2013;5(1):1. doi:10.1186/alzrt155
8. Nashner LM. A model describing vestibular detection of body sway motion. Acta Otolaryngol. 1971;72(1–6):429–436. doi:10.3109/00016487109122504
9. Broch JT. Mechanical vibration and shock measurements. Available from: https://www.bksv.com/media/doc/bn1330.pdf.
10. Mergner T, Schweigart G, Fennell L. Vestibular humanoid postural control. J Physiol Paris. 2009;103(3–5):178–194. doi:10.1016/j.jphysparis.2009.08.002
11. Mergner T, Lippi V. Posture control—human-inspired approaches for humanoid robot benchmarking: conceptualizing tests, protocols, and analyses. Front Neurorobot. 2018;12:21. doi:10.3389/fnbot.2018.00021
12. Tanabe H, Fujii K, Suzuki Y, Kouzaki M. Effect of intermittent feedback control on robustness of humanlike postural control system. Sci Rep. 2017;6(1):22446. doi:10.1038/srep22446
13. Wang J, Ye L, Gao RX, Li C, Zhang L. Digital twin for rotating machinery fault diagnosis in smart manufacturing. Int J Prod Res. 2019;57(12):3920–3934. doi:10.1080/00207543.2018.1552032
14. Rivera LF, Jiménez MA, Angara P, Villegas NM, Tamura G, Müller HA. Towards continuous monitoring in personalized healthcare through digital twins.
15. Chakshu NK, Carson J, Sazonov I, Nithiarasu P. A semi-active human digital twin model for detecting severity of carotid stenoses from head vibration—a coupled computational mechanics and computer vision method. Int J Numer Method Biomed Eng. 2019;35(5):e3180. doi:10.1002/cnm.3180
16. Taskin Y, Hacioglu Y, Ortes F, Karabulut D, Arslan YZ. Experimental investigation of biodynamic human body models subjected to whole-body vibration during a vehicle ride. Int J Occup Saf Ergon. 2019;25(4):530–544. doi:10.1080/10803548.2017.1418487
17. Mayton AG, Jobes CC, Gallagher S. Assessment of whole-body vibration exposures and influencing factors for quarry haul truck drivers and loader operators. Int J Heavy Veh Syst. 2014;21(3):241–261. doi:10.1504/IJHVS.2014.066080
18. Cheung B, Nakashima A. A review on the effects of frequency of oscillation on motion sickness. Defence R&D Canada Technical Report TR 2006-229. October 2006. Available from: https://apps.dtic.mil/dtic/tr/fulltext/u2/a472991.pdf.
19. Nazarahari M, Arthur J, Rouhani H. A novel testing device to assess the effect of neck strength on risk of concussion. Ann Biomed Eng. 2020;48(9):2310–2322. doi:10.1007/s10439-020-02504-1
20. Supej M, Ogrin J. Transmissibility of whole-body vibrations and injury risk in alpine skiing. J Sci Med Sport. 2019;22:S71–S77. doi:10.1016/j.jsams.2019.02.005
21. Hlavacka F, Krizkova M, Horak FB. Modification of human postural response to leg muscle vibration by electrical vestibular stimulation. Neurosci Lett. 1995;189(1):9–12. doi:10.1016/0304-3940(95)11436-Z
22. Vuillerme N, Danion F, Forestier N, Nougier V. Postural sway under muscle vibration and muscle fatigue in humans. Neurosci Lett. 2002;333(2):131–135. doi:10.1016/S0304-3940(02)00999-0
23. Cloak R, Nevill AM, Clarke F, Day S, Wyon MA. Vibration training improves balance in unstable ankles. Int J Sports Med. 2010;31(12):894–900. doi:10.1055/s-0030-1265151
24. Gojanovic B, Henchoz Y. Whole-body vibration training: metabolic cost of synchronous, side-alternating or no vibrations. J Sports Sci. 2012;30(13):1397–1403. doi:10.1080/02640414.2012.710756
25. Games KE, Sefton JM, Wilson AE. Whole-body vibration and blood flow and muscle oxygenation: a meta-analysis. J Athl Train. 2015;50(5):542–549. doi:10.4085/1062-6050-50.2.09
26. Wu LC, Kuo C, Loza J, et al. Detection of American football head impacts using biomechanical features and support vector machine classification. Sci Rep. 2017;8(1):855. doi:10.1038/s41598-017-17864-3
27. MacDonald MC. Simultaneous Recordings of Head and Hand Tremor in Subjects with Essential Tremor: An Investigation of Coherence [Thesis]. Kingston, Ontario, Canada: Centre for Neuroscience Studies, Queen’s University; Oct 2008. Available from: http://hdl.handle.net/1974/6168.
28. Spauschus A, Marsden J, Halliday DM, Rosenberg JR, Brown P. The origin of ocular microtremor in man. Exp Brain Res. 1999;126(4):556–562. doi:10.1007/s002210050764
29. Wagshul ME, Eide PK, Madsen JR. The pulsating brain: a review of experimental and clinical studies of intracranial pulsatility. Fluids Barriers CNS. 2011;8(1):5. doi:10.1186/2045-8118-8-5
30. He DD, Winokur ES, Sodini CG. An ear-worn vital signs monitor. IEEE Trans Biomed Eng. 2015;62(11):2547–2552. doi:10.1109/TBME.2015.2459061
31. Oba N, Sasagawa S, Yamamoto A, Nakazawa K. Difference in postural control during quiet standing between young children and adults: assessment with center of mass acceleration. PLoS One. 2015;10(10):e0140235. doi:10.1371/journal.pone.0140235
32. Kouzaki M, Masani K. Postural sway during quiet standing is related to physiological tremor and muscle volume in young and elderly adults. Gait Posture. 2011;35(1):11–17. doi:10.1016/j.gaitpost.2011.03.028
33. Zatsiorsky VM, Duarte M. Rambling and trembling in quiet standing. Motor Control. 2000;4/2(2):185–200. doi:10.1123/mcj.4.2.185
34. Vial F, Kassavetis P, Merchant S, Haubenberger D, Hallett M. How to do an electrophysiological study of tremor. Clin Neurophysiol Pract. 2019;4:134–142. doi:10.1016/j.cnp.2019.06.002
35. Grafton ST, Ralston AB, Ralston JD. Monitoring of postural sway with a head-mounted wearable device: effects of gender, participant state, and concussion. Med Devices. 2019;12:151–164. doi:10.2147/MDER.S205357
36. Le Flao E, Hume P, King D. Head impact monitoring: what new methodologies could do for concussion biomechanics. ISBS Proc Arch. 2018;36(Article):257.
37. Cavanaugh JT, Guskiewicz KM, Giuliani C, Marshall S, Mercer V, Stergiou N. Detecting altered postural control after cerebral concussion in athletes with normal postural stability. Br J Sports Med. 2005;39:805–811. doi:10.1136/bjsm.2004.015909
38. Dubose DF, Herman DC, Jones DL, et al. Lower extremity stiffness changes after concussion in collegiate football players. Med Sci Sports Exerc. 2017;49(1):167–172. doi:10.1249/MSS.0000000000001067
39. King LA, Mancini M, Fino PC, et al. Sensor-based balance measures outperform modified balance error scoring system in identifying acute concussion. Ann Biomed Eng. 2017;45(9):2135–2145. doi:10.1007/s10439-017-1856-y
40. Mang CS, Whitten TA, Cosh MS, et al. Robotic assessment of motor, sensory, and cognitive function in acute sport-related concussion and recovery. J Neurotrauma. 2018;36(2). doi:10.1089/neu.2017.5587
41. Rapp PE, Keyser DO, Albano A, et al. Traumatic brain injury detection using electrophysiological methods. Front Hum Neurosci. 2015;9:11. doi:10.3389/fnhum.2015.00011
42. Livingston SC, Saliba EN, Goodkin HP, Barth JT, Hertel JN, Ingersoll CD. A preliminary investigation of motor evoked potential abnormalities following sport-related concussion. Brain Inj. 2010;24(6):904–913. doi:10.3109/02699051003789245
43. Bose P, Hou J, Thompson FJ. Traumatic brain injury (TBI)-induced spasticity: neurobiology, treatment, and rehabilitation. In: Brain Neurotrauma: Molecular, Neuropsychological, and Rehabilitation Aspects. Boca Raton (FL): CRC Press/Taylor & Francis; 2015.
44. Hwang S, Ma L, Kawata K, Tierney R, Jeka JJ. Vestibular dysfunction after subconcussive head impact. J Neurotrauma. 2017;34(1):8–15. doi:10.1089/neu.2015.4238
45. Suleiman A, Lithgow B, Dastgheib Z, Mansouri B, Moussavi Z. Quantitative measurement of post-concussion syndrome using electrovestibulography. Sci Rep. 2017;7(1):16371. doi:10.1038/s41598-017-15487-2
46. Zhu DC, Covassin T, Nogle S, et al. A potential biomarker in sports-related concussion: brain functional connectivity alteration of the default-mode network measured with longitudinal resting-state fMRI over thirty days. J Neurotrauma. 2015;32(5):327–341. doi:10.1089/neu.2014.3413
47. Urban KJ, Barlow KM, Jimenez JJ, Goodyear BG, Dunn JF. Functional near-infrared spectroscopy reveals reduced interhemispheric cortical communication after pediatric concussion. J Neurotrauma. 2015;32(11):833–840. doi:10.1089/neu.2014.3577
48. Gurley JM, Hujsak BD, Kelly JL, Greenwald BD, Gurley JM. Vestibular rehabilitation following mild traumatic brain injury. NeuroRehabilitation. 2013;32(3):519–528. doi:10.3233/NRE-130874
49. Chorney SR, Suryadevara AC, Nicholas BD. Audiovestibular symptoms as predictors of prolonged sports-related concussion among NCAA athletes. Laryngoscope. 2017;127(12):2850–2853. doi:10.1002/lary.26564
50. Guskiewicz KM, Ross SE, Marshall SW. Postural stability and neuropsychological deficits after concussion in collegiate athletes. J Athl Train. 2001;36:263–273.
51. Fino PC, Nussbaum MA, Brolinson PG. Decreased high-frequency center-of-pressure complexity in recently concussed asymptomatic athletes. Gait Posture. 2016;50:69–74. doi:10.1016/j.gaitpost.2016.08.026
52. Caccese JB, Buckley TA, Tierney RT, Rose WC, Glutting JJ, Kaminski TW. Postural control deficits after repetitive soccer heading. Clin J Sport Med. 2018. doi:10.1097/JSM.0000000000000709
53. Heick JD, Bay C, Dompier TP, McLeod TC. Relationships among common vision and vestibular tests in healthy recreational athletes. Int J Sports Phys Ther. 2017;12:581–591.
54. Miyashita TL, Diakogeorgiou E, Marrie K. The role of subconcussive impacts on sway velocities in division I men’s lacrosse players. Sports Biomech. 2018;36:1–9.
55. Kincl LD, Bhattacharya A, Succop PA, Clark CS. Postural sway measurements: a potential safety monitoring technique for workers wearing personal protective equipment. Appl Occup Environ Hyg. 2002;17:256–266.
56. Akin FW, Murnane OD, Hall CD, Riska KM. Vestibular consequences of mild traumatic brain injury and blast exposure: a review. Brain Inj. 2017;31:1188–1194.
57. Pan T, Liao K, Roenigk K, Daly JJ, Walker MF. Static and dynamic postural stability in veterans with combat-related mild traumatic brain injury. Gait Posture. 2015;42(4):550–557. doi:10.1016/j.gaitpost.2015.08.012
58. Lanska DJ, Goetz CG. Romberg’s sign: development, adoption, and adaptation in the 19th century. Neurology. 2000;55(8):1201–1206. doi:10.1212/WNL.55.8.1201
59. Bass RI, An analysis of the components of tests of semicircular canal function and of static and dynamic balance. Res Q Am Assoc Health Phys Educ. 1939;10(2):33–52. doi:10.1080/10671188.1939.10625750
60. Berg K, Wood-Dauphinee S, Williams JI. The balance scale: reliability assessment with elderly residents and patients with an acute stroke. Scand J Rehabil Med. 1995;27:27–36.
61. Bell DR, Guskiewicz KM, Clark MA, Padua DA. Systematic review of the balance error scoring system. Sports Health. 2011;3(3):287–295. doi:10.1177/1941738111403122
62. Mancini M, Horak FB. The relevance of clinical balance assessment tools to differentiate balance deficits. Eur J Phys Rehabil Med. 2010;46(2):239–248.
63. Brown HJ, Siegmund GP, Guskiewicz KM, Van Den Doel K, Cretu E, Blouin J-S. Development and validation of an objective balance error scoring system. Med Sci Sports Exerc. 2014;46/8(8):1610–1616. doi:10.1249/MSS.0000000000000263
64. Mancini M, Horak FB, Zampieri C, Carlson-Kuhta P, Nutt JG, Chiari L. Trunk accelerometry reveals postural instability in untreated Parkinson’s disease. Parkinsonism Relat Disord. 2011;17/7(7):557–562. doi:10.1016/j.parkreldis.2011.05.010
65. Najafi B, Horn D, Marclay S, Crews RT, Wu S, Wrobel JS. Assessing postural control and postural control strategy in diabetes patients using innovative and wearable technology. J Diabetes Sci Technol. 2010;4(4):780–791. doi:10.1177/193229681000400403
66. Horak FB, Shupert CL, Mirka A. Components of postural dyscontrol in the elderly: a review. Neurobiol Aging. 1989;10(6):727–738. doi:10.1016/0197-4580(89)90010-9
67. Toosizadeh N, Mohler J, Wendel C, Najafi B. Influences of frailty syndrome on open-loop and closed-loop postural control strategy. Gerontology. 2015;61:51–60.
68. Sawacha Z, Carraro E, Contessa P, Guiotto A, Masiero S, Cobelli C. Relationship between clinical and instrumental balance assessments in chronic post-stroke hemiparesis subjects. J Neuroeng Rehabil. 2013;10(1):95. doi:10.1186/1743-0003-10-95
69. Agostini JV, Han L, Tinetti ME. The relationship between number of medications and weight loss or impaired balance in older adults. J Am Geriatr Soc. 2004;52/10(10):1719–1723. doi:10.1111/j.1532-5415.2004.52467.x
70. Boyle J, Danjou P, Alexander R, et al. Tolerability, pharmacokinetics and night‐time effects on postural sway and critical flicker fusion of gaboxadol and zolpidem in elderly subjects. Br J Clin Pharmacol. 2008;67(2):180–190. doi:10.1111/j.1365-2125.2008.03331.x
71. Petrova D, Angelov I, Stambolieva K. Postural stability of patients with distal symmetric diabetic polyneuropathy after combined pharmacotherapy with alpha-lipoic acid and benfotiamin, pyridoxine and cyancobalamine. Neurochem Neuropharm. 2017;2(Suppl). doi:10.4172/2469-9780-C1-006
72. Gauchard GC, Parietti-Winkler C, Lion A, Simon C, Perrin PP. Impact of pre-operative regular physical activity on balance control compensation after vestibular schwannoma surgery. Gait Posture. 2013;37(1):82–87. doi:10.1016/j.gaitpost.2012.06.011
73. Paillard T, Noé F. Techniques and methods for testing the postural function in healthy and pathological subjects. Biomed Res Int. 2015;15. doi:10.1155/2015/891390
74. Yamamoto T, Smith CE, Suzuki Y, et al. Universal and individual characteristics of postural sway during quiet standing in healthy young adults. Physiol Rep. 2015;3(3):e12329. doi:10.14814/phy2.12329
75. Caron O, Gélat T, Rougier P, Blanchi J-P. A comparative analysis of the center of gravity and center of pressure trajectory path lengths in standing posture: an estimation of active stiffness. J Appl Biomech. 2000;16(3):234–247. doi:10.1123/jab.16.3.234
76. Palmieri RM, Ingersoll CD, Stone MB, Krause BA. Center-of-pressure parameters used in the assessment of postural control. J Sport Rehabil. 2002;11(1):51–66. doi:10.1123/jsr.11.1.51
77. Duarte M, De Freitas SM. Revision of posturography based on force plate for balance evaluation. Rev Bras Fisioter. 2010;14/3(3):183–192. doi:10.1590/S1413-35552010000300003
78. Granat MH, Kirkwood CA, Andrews BJ. Problem with the use of total distance travelled and average speed as measures of postural sway. Med Biol Eng Comput. 1990;28(6):601–602. doi:10.1007/BF02442615
79. Cavanaugh JT, Guskiewicz KM, Stergiou N. A nonlinear dynamic approach for evaluating postural control: new directions for the management of sport-related cerebral concussion. Sports Med. 2005;35(11):935–950. doi:10.2165/00007256-200535110-00002
80. van der Kooij H, Campbell AD, Carpenter MG. Sampling duration effects on centre of pressure descriptive measures. Gait Posture. 2011;34(1):19–24. doi:10.1016/j.gaitpost.2011.02.025
81. Carpenter MG, Frank JS, Winter DA, Peysar GW. Sampling duration effects on centre of pressure summary measures. Gait Posture. 2001;13/1(1):35–40. doi:10.1016/S0966-6362(00)00093-X
82. Scoppa F, Capra R, Gallamini M, Shiffer R. Clinical stabilometry standardization: basic definitions–acquisition interval–sampling frequency. Gait Posture. 2012;37(2):290–292. doi:10.1016/j.gaitpost.2012.07.009
83. Rhea CK, Kiefer AW, Wright WG, Raisbeck LD, Haran FJ. Interpretation of postural control may change due to data processing techniques. Gait Posture. 2015;41/2(2):731–735. doi:10.1016/j.gaitpost.2015.01.008
84. Suzuki Y, Nomura T, Casadio M, Morasso P. Intermittent control with ankle, hip, and mixed strategies during quiet standing: a theoretical proposal based on a double inverted pendulum model. J Theor Biol. 2012;310:55–79. doi:10.1016/j.jtbi.2012.06.019
85. Suzuki Y, Morimoto H, Kiyono K, Morasso PG, Nomura T. Dynamic determinants of the uncontrolled manifold during human quiet stance. Front Hum Neurosci. 2016;10:618. doi:10.3389/fnhum.2016.00618
86. Day BL, Steiger MJ, Thompson PD, Marsden CD. Effect of vision and stance width on human body motion when standing: implications for afferent control of lateral sway. J Physiol. 1993;469(1):479–499. doi:10.1113/jphysiol.1993.sp019824
87. Asai Y, Tasaka Y, Nomura K, Nomura T, Casadio M, Morasso P. A model of postural control in quiet standing: robust compensation of delay-induced instability using intermittent activation of feedback control. PLoS One. 2009;4(7):e6169. doi:10.1371/journal.pone.0006169
88. Dakin CJ, Son GM, Inglis JT, Blouin JS. Frequency response of human vestibular reflexes characterized by stochastic stimuli. J Physiol. 2007;583(Pt 3):
89. Lin I, Lai D, Ding J, et al. Reweighting of the sensory inputs for postural control in patients with cervical spondylotic myelopathy after surgery. J Neuroeng Rehabil. 2019;16(1):96. doi:10.1186/s12984-019-0564-2
90. Assländer L, Peterka RJ. Sensory reweighting dynamics in human postural control. J Neurophysiol. 2014;111(9):1852–1864. doi:10.1152/jn.00669.2013
91. Diener HC, Dichgans J, Bacher M, Gompf B. Quantification of postural sway in normals and patients with cerebellar diseases. Electroencephalogr Clin Neurophysiol. 1984;57(2):134–142. doi:10.1016/0013-4694(84)90172-X
92. Kanekar N, Lee Y-J, Aruin AS. Frequency analysis approach to study balance control in individuals with multiple sclerosis. J Neurosci Methods. 2014;222:91–96. doi:10.1016/j.jneumeth.2013.10.020
93. Sim T, Yoo H, Lee D. Analysis of sensory system aspects of postural stability during quiet standing in adolescent idiopathic scoliosis patients. J Neuroeng Rehabil. 2018;15(1):54. doi:10.1186/s12984-018-0395-6
94. Chagdes JR, Rietdyk S, Haddad JM, et al. Multiple timescales in postural dynamics associated with vision and a secondary task are revealed by wavelet analysis. Exp Brain Res. 2009;197(3):297–310. doi:10.1007/s00221-009-1915-1
95. Quek J, Brauer SG, Clark R, Treleaven J. New insights into neck-pain-related postural control using measures of signal frequency and complexity in older adults. Gait Posture. 2014;39(4):1069–1073. doi:10.1016/j.gaitpost.2014.01.009
96. Kuwabara S, Asahina M, Nakajima M, et al. Special sensory ataxia in miller fisher syndrome detected by postural body sway analysis. Ann Neurol. 1999;45(4):533–536. doi:10.1002/1531-8249(199904)45:4<533::AID-ANA19>3.0.CO;2-H
97. Weiss A, Sharifi S, Plotnik M, van Vugt JP, Giladi N, Hausdorff JM. Toward automated, at-home assessment of mobility among patients with Parkinson disease, using a body-worn accelerometer. Neurorehabil Neural Repair. 2011;25(9):810–818. doi:10.1177/1545968311424869
98. Mahboobin A, Loughlin P, Atkeson C, Redfern M. A mechanism for sensory re-weighting in postural control. Med Biol Eng Comput. 2009;47(9):921–929. doi:10.1007/s11517-009-0477-5
99. Singh NB, Taylor WR, Madigan ML, Nussbaum MA. The spectral content of postural sway during quiet stance: influences of age, vision and somatosensory inputs. J Electromyogr Kinesiol. 2012;22(1):131–136. doi:10.1016/j.jelekin.2011.10.007
100. El-Jaroudi A, Redfern MS, Chaparro LF, Furman JM. The application of time-frequency methods to the analysis of postural sway. Proc IEEE. 1996;84(9):1312–1318. doi:10.1109/5.535249
101. Williams HG, McClenaghan BA, Dickerson J. Spectral characteristics of postural control in elderly individuals. Arch Phys Med Rehabil. 1997;78(7):737–744. doi:10.1016/S0003-9993(97)90082-4
102. Manor B, Hu K, Zhao P, et al. Altered control of postural sway following cerebral infarction: a cross-sectional analysis. Neurology. 2010;9(74):458–464. doi:10.1212/WNL.0b013e3181cef647
103. Fujimoto C, Kamogashira T, Kinoshita M, et al. Power spectral analysis of postural sway during foam posturography in patients with peripheral vestibular dysfunction. Otol Neurotol. 2014;35(10):e317–e323. doi:10.1097/MAO.0000000000000554
104. Baloh RW, Jacobson KM, Beykirch K, Honrubia V. Static and dynamic posturography in patients with vestibular and cerebellar lesions. Arch Neurol. 1998;55(5):649–654. doi:10.1001/archneur.55.5.649
105. Bensoussan L, Viton J-M, Schieppati M, Collado H. Changes in postural control in hemiplegic patients after stroke performing a dual task. Arch Phys Med Rehabil. 2007;88(8):1009–1015. doi:10.1016/j.apmr.2007.05.009
106. Whitney SL, Roche JL, Marchetti GF, et al. A comparison of accelerometry and center of pressure measures during computerized dynamic posturography: a measure of balance. Gait Posture. 2011;33/4(4):594–599. doi:10.1016/j.gaitpost.2011.01.015
107. Hirabayashi S, Iwasaki Y. Developmental perspective of sensory organization on postural control. Brain Dev. 1995;17(2):111–113. doi:10.1016/0387-7604(95)00009-Z
108. Noohi F, Kinnaird C, De Dios Y, et al. Deactivation of somatosensory and visual cortices during vestibular stimulation is associated with older age and poorer balance. PLoS One. 2019;14(9):e0221954. doi:10.1371/journal.pone.0221954
109. Yuan P, Koppelmans V, Reuter-Lorenz P, et al. Vestibular brain changes within 70 days of head down bed rest. Hum Brain Mapp. 2018;39(7):2753–2763. doi:10.1002/hbm.24037
110. Maalouf N, Elhajj IH, Shammas E, Asmar D. Humanoid push recovery using sensory reweighting. Rob Auton Syst. 2017;94:208–218. doi:10.1016/j.robot.2017.04.009
111. Nashner LM, Shupert CL, Horak FB. Head-trunk movement coordination in the standing posture. Prog Brain Res. 1988;76:243–251.
112. Honegger F. Head and Trunk Movement Strategies in Quiet Stance [Thesis]. Medizinischen Fakultät der Universität Basel; Oct 2013. doi:10.5451/unibas-006225247
113. Flatters I, Culmer P, Holt RJ, Wilkie RM, Mon-Williams M. A new tool for assessing head movements and postural sway in children. Behav Res Methods. 2014;46(4):950–959. doi:10.3758/s13428-013-0419-x
114. Nicholas SC, Doxey-Gasway DD, Paloski WH. A link-segment model of upright human posture for analysis of head-trunk coordination. J Vestib Res. 1998;8(3):187–200. doi:10.3233/VES-1998-8301
115. Amblard B, Assaiante C, Fabre J-C, Mouchnino L, Massion J. Voluntary head stabilization in space during oscillatory trunk movements in the frontal plane performed in weightlessness. Exp Brain Res. 1997;114(2):214–225. doi:10.1007/PL00005630
116. Stahl J. Amplitude of human head movements associated with horizontal saccades. Exp Brain Res. 1999;126(1):41–54. doi:10.1007/s002210050715
117. Peterson BW, Goldberg J. Role of vestibular and neck reflexes in controlling eye and head position. In: Roucoux A, Crommelinck M, editors. Physiological and Pathological Aspects of Eye Movements. Documenta Ophthalmologica Proceedings Series. Vol. 34. 1982:351–364.
118. Engel D, Schütz A, Krala M, Schwenk JCB, Morris AP, Bremmer F. Inter-trial phase coherence of visually evoked postural responses in virtual reality. Exp Brain Res. 2020;238(5):1177–1189. doi:10.1007/s00221-020-05782-2
119. Forbes PA, Siegmund GP, Schouten AC, Blouin J-S. Task, muscle, and frequency dependent vestibular control of posture. Front Integr Neurosci. 2015;8:94. doi:10.3389/fnint.2014.00094
120. Shaikh AG. Abnormal head oscillations in neuro-ophthalmology and neuro-otology. Curr Opin Neurol. 2016;29(1):94–103. doi:10.1097/WCO.0000000000000277
121. Maurer C, Peterka RJ. A new interpretation of spontaneous sway measures based on a simple model of human postural control. J Neurophysiol. 2005;93(1):189–200. doi:10.1152/jn.00221.2004
122. Nashner LM, Shupert CL, Horak FB, Black FO. Organization of posture controls: an analysis of sensory and mechanical constraints. Prog Brain Res. 1989;80:411–418.
123. Castillo ER, Lieberman DE. Shock attenuation in the human lumbar spine during walking and running. J Exp Biol. 2018;221(9):jeb177949. doi:10.1242/jeb.177949
124. Winter DA. Human balance and posture control during standing and walking. Gait Posture. 1995;3(4):193–214. doi:10.1016/0966-6362(96)82849-9
125. Mercer C. Acceleration, velocity, and displacement spectra. Prosig Signal Processing Tutorials; 2006. Available from: http://prosig.com/wp-content/uploads/pdf/blogArticles/OmegaArithmetic.pdf.
126. Delignie`res D, Torre K, Bernard P-L. Transition from persistent to anti-persistent correlations in postural sway indicates velocity-based control. PLoS Comput Biol. 2011;7(2):e1001089. doi:10.1371/journal.pcbi.1001089
127. Masani K, Vette AH, Abe MO, Nakazawa K. Center of pressure velocity reflects body acceleration rather than body velocity during quiet standing. Gait Posture. 2014;39/3(3):946–952. doi:10.1016/j.gaitpost.2013.12.008
128. Yu E, Abe M, Masani K, et al. Evaluation of postural control in quiet standing using center of mass acceleration: comparison among the young, the elderly, and people with stroke. Arch Phys Med Rehabil. 2008;89(6):1133–1139. doi:10.1016/j.apmr.2007.10.047
129. Goffredo M, Schmid M, Conforto S, D’Alessio T. A markerless sub-pixel motion estimation technique to reconstruct kinematics and estimate the centre of mass in posturography. Med Eng Phys. 2006;28/7(7):719–726. doi:10.1016/j.medengphy.2005.10.007
130. Günther M, Grimmer S, Siebert T, Blickhan R. All leg joints contribute to quiet human stance: a mechanical analysis. J Biomech. 2009;42/16(16):2739–2746. doi:10.1016/j.jbiomech.2009.08.014
131. Noamani A, Nazarahari M, Lewicke J, Vette AH, Rouhani H. Validity of using wearable inertial sensors for assessing the dynamics of standing balance. Med Eng Phys. 2020;77:53–59. doi:10.1016/j.medengphy.2019.10.018
132. Neville C, Ludlow C, Rieger B. Measuring postural stability with an inertial sensor: validity and sensitivity. Med Devices (Auckl). 2015;8:447–455. doi:10.2147/MDER.S91719
133. Seimetz C, Tan D, Katayama R, Lockhart T. A comparison between methods of measuring postrual stability: force plates versus accelerometers. Biomed Sci Instrum. 2012;48:386–392.
134. Reynard F, Christe D, Terrier P. Postural control in healthy adults. Determinants of trunk sway assessed with a chest-worn accelerometer in 12 quiet standing tasks. PLoS One. 2019;14(1):e0211051. doi:10.1371/journal.pone.0211051
135. Błaszczyk JW, Beck M, Sadowska D. Assessment of postural stability in young healthy subjects based on directional features of posturographic data: vision and gender effects. Acta Neurobiol Exp. 2014;74:433–442.
136. Sankarpandi SK, Baldwin AJ, Ray J, Mazza C. Reliability of inertial sensors in the assessment of patients with vestibular disorders: a feasibility study. BMC Ear Nose Throat Disord. 2017;17(1):1. doi:10.1186/s12901-017-0034-z
137. Martinez-Mendez R, Sekine M, Tamura T. Postural sway parameters using a triaxial accelerometer: comparing elderly and young healthy adults. Comput Methods Biomech Biomed Engin. 2011;1–12. doi:10.1080/10255842.2011.565753
138. Kitazaki S, Griffin MJ. Resonance behaviour of the seated human body and effects of posture. J Biomech. 1998;31(2):143–149. doi:10.1016/S0021-9290(97)00126-7
139. Gera G, Chesnutt J, Mancini M, Horak FB, King LA. Inertial sensor-based assessment of central sensory integration for balance after mild traumatic brain injury. Mil Med. 2018;183(3/4):327–332. doi:10.1093/milmed/usx162
140. Salisbury JP, Keshav NU, Sossong AD, Sahin NT. Standing balance assessment using a head-mounted wearable device. bioRxiv. 2017. doi:10.1101/149831
141. Salisbury JP, Keshav NU, Sossong AD, Sahin NT. Concussion assessment with smartglasses: validation study of balance measurement toward a lightweight, multimodal, field-ready platform. JMIR Mhealth Uhealth. 2018;23/6(1):e15. doi:10.2196/mhealth.8478
142. Ferdjallah M, Harris GF, Wertsch JJ. Instantaneous spectral characteristics of postural stability using time-frequency analysis.
143. Subbian V, Ratcliff J, Meunier JM, Beyette FR, Shaw GJ. Integration of New Technology for Research in the Emergency Department: Feasibility of Deploying a Robotic Assessment Tool for Mild Traumatic Brain Injury Evaluation. IEEE J Transl Eng Health Med. 2015;3:3200109. doi:10.1109/JTEHM.2015.2424224
144. Wallace B, Lifshitz J. Traumatic brain injury and vestibulo-ocular function: current challenges and future prospects. Eye Brain. 2016;8:153–164. doi:10.2147/EB.S82670
145. Hauenstein A, Roper JM, Ralston AB, Ralston JD. Signal classification of wearable inertial motion sensor data using a convolutional neural network.
146. Randolph C, Millis S, Barr WB, et al. Concussion symptom inventory: an empirically derived scale for monitoring resolution of symptoms following sport-related concussion. Arch Clin Neuropsychol. 2009;24(3):219–229. doi:10.1093/arclin/acp025
147. Merritt VC, Rabinowitz AR, Arnett PA. Injury-related predictors of symptom severity following sports-related concussion. J Clin Exp Neuropsychol. 2015;37(3):265–275. doi:10.1080/13803395.2015.1004303
148. Barr WB, McCrea MA. Sensitivity and specificity of standardized neurocognitive testing immediately following sports concussion. J Int Neuropsychol Soc. 2001;7(6):693–702. doi:10.1017/S1355617701766052
149. Coldren RL, Kelly MP, Parish RV, Dretsch M, Russell ML. Evaluation of the military acute concussion evaluation for use in combat operations more than 12 hours after injury. Mil Med. 2010;175(7):477–481. doi:10.7205/MILMED-D-09-00258
150. Chin EY, Nelson LD, Barr WB, McCrory P, McCrea MA. Reliability and validity of the sport concussion assessment tool-3 (SCAT3) in high school and collegiate athletes. Am J Sports Med. 2016;44(9):2276–2285. doi:10.1177/0363546516648141
151. Babl FE, Dionisio D, Davenport L, et al. Accuracy of components of SCAT to identify children with concussion. Pediatrics. 2017;140(2):e20163258. doi:10.1542/peds.2016-3258
152. Ye S, Ko B, Phi H, et al. Detection of mTBI in pediatric populations using BrainCheck, a tablet-based cognitive testing software. medRxiv. 2020. doi:10.1101/2020.04.29.20085274
153. Garcia -G-GP, Yang J, Lavieri MS, McAllister TW, McCrea MA, Broglio SP. Optimizing components of the sport concussion assessment tool for acute concussion assessment. Neurosurgery. 2020;nyaa150. doi:10.1093/neuros/nyaa150
154. Erdodi L, Korcsog K, Considine C, Casey J, Scoboria A, Abeare C. Introducing the ImPACT-5: an empirically derived multivariate validity composite. J Head Trauma Rehabil. 2020. doi:10.1097/HTR.0000000000000576
155. Greenwald RM, Gwin JT, Chu JJ, Crisco JJ. Head impact severity measures for evaluating mild traumatic brain injury risk exposure. Neurosurgery. 2008;62(4):789–798. doi:10.1227/01.neu.0000318162.67472.ad
156. Rowson S, Duma SM. Brain injury prediction: assessing the combined probability of concussion using linear and rotational head acceleration. Ann Biomed Eng. 2013;41(5):873–882. doi:10.1007/s10439-012-0731-0
157. Beckwith JG, Greenwald RM, Chu JJ, et al. Head impact exposure sustained by football players on days of diagnosed concussion. Med Sci Sports Exerc. 2013;45(4):737–746. doi:10.1249/MSS.0b013e3182792ed7
158. Campolettano ET, Gellner RA, Smith EP, et al. Development of a concussion risk function for a youth population using head linear and rotational acceleration. Ann Biomed Eng. 2020;48(1):92–103. doi:10.1007/s10439-019-02382-2
159. Furman GR, Lin -C-C, Bellanca JL, Marchetti GF, Collins MW, Whitney SL. Comparison of the balance accelerometer measure and balance error scoring system in adolescent concussions in sports. Am J Sports Med. 2013;41(6):1404–1410. doi:10.1177/0363546513484446
160. Teel EF, Gay MR, Arnett PA, Slobounov SM. Differential sensitivity between a virtual reality balance module and clinically used concussion balance modalities. Clin J Sport Med. 2016;26(2):162–166. doi:10.1097/JSM.0000000000000210
161. Howell D, Osternig L, Chou L-S. Monitoring recovery of gait balance control following concussion using an accelerometer. J Biomech. 2015;48(12):3364–3368. doi:10.1016/j.jbiomech.2015.06.014
162. Maruta J, Heaton KJ, Maule AL, Ghajar J. Predictive visual tracking: specificity in mild traumatic brain injury and sleep deprivation. Mil Med. 2014;179(6):619–625. doi:10.7205/MILMED-D-13-00420
163. Samadani U, Li M, Qian M, et al. Sensitivity and specificity of an eye movement tracking-based biomarker for concussion. Concussion. 2015;1(1):CNC3.
164. Galetta KM, Liu M, Leong DF, Ventura RE, Galetta SL, Balcer LJ. The King-Devick test of rapid number naming for concussion detection: meta-analysis and systematic review of the literature. Concussion. 2015;CNC8.
165. Galetta KM, Morganroth J, Moehringer N, et al. Adding vision to concussion testing: a prospective study of sideline testing in youth and collegiate athletes. J Neuroophthalmol. 2015;35(3):235–241. doi:10.1097/WNO.0000000000000226
166. Kelly KM, Kiderman A, Akhavan S, et al. Oculomotor, vestibular, and reaction time effects of sports-related concussion: video-oculography in assessing sports-related concussion. J Head Trauma Rehabil. 2018;34(3):176–188. doi:10.1097/HTR.0000000000000437
167. Mucha A, Collins MW, Elbin RJ, et al. A brief vestibular/ocular motor screening (VOMS) assessment to evaluate concussions. Am J Sports Med. 2014;42(10):2479–2486. doi:10.1177/0363546514543775
168. McDevitt J, Appiah-Kubi KO, Tierney R, Wright WG. Vestibular and oculomotor assessments may increase accuracy of subacute concussion assessment. Int J Sports Med. 2016;37(9). doi:10.1055/s-0042-100470
169. Poltavski D, Lederer P, Cox LK. Visually evoked potential markers of concussion history in patients with convergence insufficiency. Optom Vis Sci. 2017;94(7):742–750. doi:10.1097/OPX.0000000000001094
170. Subbian V, Ratcliff JJ, Korfhagen JJ, et al. A novel tool for evaluation of mild traumatic brain injury patients in the emergency department: does robotic assessment of neuromotor performance following injury predict the presence of postconcussion symptoms at follow-up? Acad Emerg Med. 2016;23(4):382–392. doi:10.1111/acem.12906
171. Dambinova SA, Shikuev AV, Weissman JD, Mullins JD. AMPAR peptide values in blood of nonathletes and club sport athletes with concussions. Mil Med. 2013;178(3):285–290. doi:10.7205/MILMED-D-12-00368
172. Shahim P, Tegner Y, Wilson DH, et al. Blood biomarkers for brain injury in concussed professional ice hockey players. JAMA Neurol. 2014;71(6):684–692. doi:10.1001/jamaneurol.2014.367
173. Daley M, Dekaban G, Bartha R, et al. Metabolomics profiling of concussion in adolescent male hockey players: a novel diagnostic method. Metabolomics. 2016;185. doi:10.1007/s11306-016-1131-5
174. Kawataa K, Liu CY, Merkeld SF, Ramirez SH, Tierney RT, Langford D. Blood biomarkers for brain injury: what are we measuring? Neurosci Biobehav Rev. 2016;68:460–473. doi:10.1016/j.neubiorev.2016.05.009
175. Di Pietro V, Porto E, Ragusa M, et al. Salivary MicroRNAs: diagnostic markers of mild traumatic brain injury in contact-sport. Front Mol Neurosci. 2018;11:290. doi:10.3389/fnmol.2018.00290
176. O’Neil B, Prichep LS, Naunheim R, Chabot R. Quantitative brain electrical activity in the initial screening of mild traumatic brain injuries. West J Emerg Med. 2012;8(5):394–400.
177. Mutch WAC, Ellis MJ, Ryner LN, et al. Patient-specific alterations in CO2 cerebrovascular responsiveness in acute and sub-acute sports-related concussion. Front Neurol. 2018;9:23. doi:10.3389/fneur.2018.00023
178. Baruch M, Barth JT, Cifu D, Leibman M. Utility of a multimodal neurophysiological assessment tool in distinguishing between individuals with and without a history of mild traumatic brain injury. J Rehabil Res Dev. 2016;53(6):959–972. doi:10.1682/JRRD.2015.06.0120
179. Resch JE, Brown CN, Schmidt J, et al. The sensitivity and specificity of clinical measures of sport concussion: three tests are better than one. BMJ Open Sport Exerc Med. 2016;2(1):e000012. doi:10.1136/bmjsem-2015-000012
180. Balaban C, Hoffer ME, Szczupak M, et al. Oculomotor, vestibular, and reaction time tests in mild traumatic brain injury. PLoS One. 2016;11(9):e0162168. doi:10.1371/journal.pone.0162168
181. Jacquin A, Kanakia S, Oberly D, Prichep LS. A multimodal biomarker for concussion identification, prognosis, and management. Comput Biol Med. 2018;102:95–103. doi:10.1016/j.compbiomed.2018.09.011
182. McNerney MW, Hobday T, Cole B, et al. Objective classification of mTBI using machine learning on a combination of frontopolar electroencephalography measurements and self-reported symptoms. Sports Med. 2019;5:14. doi:10.1186/s40798-019-0187-y
183. Tremblay S, de Beaumont L, Lassonde M, Théoret H. Evidence for the specificity of intracortical inhibitory dysfunction in asymptomatic concussed athletes. J Neurotrauma. 2010;28(4). doi:10.1089/neu.2010.1615
184. Colnaghi S, Honeine JL, Sozzi S, Schieppati M. Body sway increases after functional inactivation of the cerebellar vermis by cTBS. Cerebellum. 2017;16(1):1–14. doi:10.1007/s12311-015-0758-5
185. Howell DR, O’Brien MJ, Beasley MA, Mannix RC, Meehan WP. Initial somatic symptoms are associated with prolonged symptom duration following concussion in adolescents. Acta Paediatr. 2016;105(9):e426–e432. doi:10.1111/apa.13486
186. Pertab JL, Merkley TL, Cramond AJ, Cramond K, Paxton H, Wu T. Concussion and the autonomic nervous system: an introduction to the field and the results of a systematic review. NeuroRehabilitation. 2018;42:397–427. doi:10.3233/NRE-172298
187. Thompson TL, Amedee R. Vertigo: a review of common peripheral and central vestibular disorders. Ochsner J. 2009;9:20–26.
188. Maruta J, Lumba-Brown A, Ghajar J. Concussion subtype identification with the rivermead post-concussion symptoms questionnaire. Front Neurol. 2018;9:1034. doi:10.3389/fneur.2018.01034
189. Hanas JS, Hocker JRS, Lerner MR, Couch JR. Distinguishing and phenotype monitoring of traumatic brain injury and postconcussion syndrome including chronic migraine in serum of Iraq and Afghanistan war veterans. PLoS One. 2019;14(4):e0215762. doi:10.1371/journal.pone.0215762
190. Collins JJ, De Luca CJ. Open-loop and closed-loop control of posture: a random-walk analysis of center-of-pressure trajectories. Exp Brain Res. 1993;95(2):308–318. doi:10.1007/BF00229788
191. Perera T, Tan JL, Cole MH, et al. Balance control systems in Parkinson’s disease and the impact of pedunculopontine area stimulation. Brain. 2018;141(10):3009–3022. doi:10.1093/brain/awy216
192. Day BL. Galvanic vestibular stimulation: new uses for an old tool. J Physiol. 1999;517(Pt 3):631. doi:10.1111/j.1469-7793.1999.0631s.x
193. Curthoys IS. A critical review of the neurophysiological evidence underlying clinical vestibular testing using sound, vibration, and galvanic stimuli. Clin Neurophysiol. 2010;121(2):132–144. doi:10.1016/j.clinph.2009.09.027
194. Dlugaiczyk J, Gensberger KD, Straka H. Galvanic vestibular stimulation: from basic concepts to clinical applications. J Neurophysiol. 2019;121(6):
195. Rosengren SM, Colebatch JG, Young AS, Govender S, Welgampola MS. Vestibular evoked myogenic potentials in practice: methods, pitfalls, and clinical applications. Clin Neurophysiol Pract. 2019;4:47–68. doi:10.1016/j.cnp.2019.01.005
196. Peterka RJ, Black FO, Schoenhoff MB. Age-related changes in human vestibulo-ocular reflexes: sinusoidal rotation and caloric tests. J Vestib Res. 1990;1:49–59.
197. Jahn K, Naessl A, Schneider E, Strupp M, Brandt T, Dieterich M. Inverse U-shaped curve for age dependency of torsional eye movement responses to galvanic vestibular stimulation. Brain. 2003;126(7):1579–1589. doi:10.1093/brain/awg163
198. Scinicariello AP, Eaton K, Inglis JT, Collins JJ. Enhancing human balance control with galvanic electrical stimulation. Bio Cybern. 2001;84(6):475–480. doi:10.1007/PL00007991
199. Dakin CJ, Luu BL, van den Doel K, Inglis JT, Blouin JS. Frequency-specific modulation of vestibular-evoked sway responses in humans. J Neurophysiol. 2010;103(2):
200. Dakin CJ, Inglis JT, Blouin JS. Short and medium latency muscle responses evoked by electrical vestibular stimulation are a composite of all stimulus frequencies. Exp Brain Res. 2011;209(3):
201. Peters RM, Rasman BG, Inglis JT, Blouin JS. Gain and phase of perceived virtual rotation evoked by electrical vestibular stimuli. J Neurophysiol. 2015;114(1):264–273. doi:10.1152/jn.00114.2015
 © 2020 The Author(s). This work is published and licensed by Dove Medical Press Limited. The full terms of this license are available at https://www.dovepress.com/terms.php and incorporate the Creative Commons Attribution - Non Commercial (unported, v3.0) License.
By accessing the work you hereby accept the Terms. Non-commercial uses of the work are permitted without any further permission from Dove Medical Press Limited, provided the work is properly attributed. For permission for commercial use of this work, please see paragraphs 4.2 and 5 of our Terms.
© 2020 The Author(s). This work is published and licensed by Dove Medical Press Limited. The full terms of this license are available at https://www.dovepress.com/terms.php and incorporate the Creative Commons Attribution - Non Commercial (unported, v3.0) License.
By accessing the work you hereby accept the Terms. Non-commercial uses of the work are permitted without any further permission from Dove Medical Press Limited, provided the work is properly attributed. For permission for commercial use of this work, please see paragraphs 4.2 and 5 of our Terms.