Back to Journals » Journal of Inflammation Research » Volume 14
Phenotypic Variations of Mild-to-Moderate Obstructive Pulmonary Diseases According to Airway Inflammation and Clinical Features
Authors Proboszcz M ![]() , Goryca K, Nejman-Gryz P
, Goryca K, Nejman-Gryz P ![]() , Przybyłowski T, Górska K, Krenke R
, Przybyłowski T, Górska K, Krenke R ![]() , Paplińska-Goryca M
, Paplińska-Goryca M ![]()
Received 6 March 2021
Accepted for publication 20 May 2021
Published 28 June 2021 Volume 2021:14 Pages 2793—2806
DOI https://doi.org/10.2147/JIR.S309844
Checked for plagiarism Yes
Review by Single anonymous peer review
Peer reviewer comments 3
Editor who approved publication: Professor Ning Quan
Małgorzata Proboszcz,1 Krzysztof Goryca,2 Patrycja Nejman-Gryz,1 Tadeusz Przybyłowski,1 Katarzyna Górska,1 Rafał Krenke,1 Magdalena Paplińska-Goryca1
1Department of Internal Medicine, Pulmonary Diseases and Allergy, Medical University of Warsaw, Warsaw, Poland; 2Genomics Core Facility, Centre of New Technologies, University of Warsaw, Warsaw, Poland
Correspondence: Małgorzata Proboszcz
Department of Internal Medicine, Pulmonary Diseases and Allergy, Medical University of Warsaw, Banacha 1a, Warsaw, 02-097, Poland
Tel +48225991241
Fax +48225991561
Email [email protected]
Purpose: Asthma and chronic obstructive pulmonary disease (COPD) are complex and heterogeneous inflammatory diseases. We sought to investigate distinct disease profiles based on clinical, cellular and molecular data from patients with mild-to-moderate obstructive pulmonary diseases.
Patients and Methods: Patients with mild-to-moderate allergic asthma (n=30) and COPD (n=30) were prospectively recruited. Clinical characteristics and induced sputum were collected. In total, 35 mediators were assessed in induced sputum. Logistic regression analysis was conducted to identify the optimal factors that were able to discriminate between asthma and COPD. Further, the data were explored using hierarchical clustering in order to discover and compare clusters of combined samples of asthma and COPD patients. Clinical parameters, cellular composition, and sputum mediators of asthma and COPD were assessed between and within obtained clusters.
Results: We found five clinical and biochemical variables, namely IL-6, IL-8, CCL4, FEV1/VC ratio pre-bronchodilator (%), and sputum neutrophils (%) that differentiated asthma and COPD and were suitable for discrimination purposes. A combination of those variables yielded high sensitivity and specificity in the differentiation between asthma and COPD, although only FEV1/VC ratio pre-bronchodilator (%) proven significant in the combined model. In cluster analysis, two main clusters were identified: cluster 1, asthma predominant with evidence of eosinophilic airway inflammation and low level of Th1 and Th2 cytokines; and cluster 2, COPD predominant with elevated levels of Th1 and Th2 mediators.
Conclusion: The inflammatory profile of sputum samples from patients with stable mild-to-moderate asthma and COPD is not disease specific, varies within the disease and might be similar between these diseases. This study highlights the need for phenotyping the mild-to-moderate stages according to their clinical and molecular features.
Keywords: asthma, COPD, cytokines, airway inflammation
Introduction
Asthma and chronic obstructive pulmonary disease (COPD) are complex and heterogeneous diseases that include different phenotypes and endotypes. Classically, asthma is considered to be an allergic disease mediated by CD4+ lymphocytes, eosinophils, and mast cells, with eosinophil predominating airway inflammation driven by the Th2 cytokines IL-4, IL-5 and IL-13.1,2 In COPD CD8+ T cells, neutrophils, and macrophages are the main effector cells and IL-1β, IL-6, IL-8, tumor necrosis factor-α (TNF α) and matrix metalloproteinases (MMPs) are the inflammatory mediators involved in the orchestrating of the airway inflammation.3–5 Although the above mechanisms of asthma and COPD differ significantly, both diseases can also share some common features. This particularly refers to mild stages of asthma and COPD and certain disease phenotypes, eg, non-allergic neutrophilic asthma in the elderly, which might have very similar characteristics to COPD.6,7 Likewise, airway eosinophilia, a typical hallmark of asthma, has recently been recognized as a distinct inflammatory pattern in some COPD patients.8 Thus, asthma and COPD are currently construed as umbrella terms that include patients with diverse characteristics which can be further subclassified based on various clinical and pathophysiological features. Importantly, some patients with asthma and COPD can show overlapping features between these two disorders.
Currently, the diagnosis of asthma and COPD is based on symptoms, medical history, and lung function tests. However, the specificity of some features that were previously considered to be typical for asthma or COPD was found to be relatively low.9,10 Hence, as the differentiation between different obstructive airway diseases exclusively on the basis of clinical features is largely uncertain, there has been a shift towards a more individual approach to treatment of obstructive lung diseases with the identification of treatable traits which reflect clinical and biological complexity. Yet, the complexity of asthma and COPD means that some of their components have nonlinear dynamic interactions.11 It refers in particular to inflammatory mediators that are essential players in the initiation and propagation of inflammation. As a number of different cytokines contribute to both diseases,12 the relevance of a single biomarker might not be particularly useful and might be prone to the influence of internal and external “noise”.
In recent years, attempts to subtyping of obstructive pulmonary diseases have been shifted to more data-driven methods.13,14 A system of classification of obstructive lung diseases that integrate the multidimensionality of asthma and COPD on clinical, cellular and molecular levels may be a tool for identifying numerous distinct phenotypes, with specific pathobiological components that respond to particular therapy. Phenotyping of obstructive pulmonary diseases has usually been studied in severe stage of the diseases. In the current study, we investigated the statistical modeling to define distinct disease profiles based on clinical, cellular and molecular data from patients with mild-to-moderate obstructive pulmonary disease.
Patients and Methods
Study Design and Procedures
This was a prospective study which involved 30 patients with allergic asthma, 30 patients with COPD, and 20 healthy control subjects. The patients were recruited from the pulmonary outpatient department of the tertiary teaching hospital of the Medical University of Warsaw. The diagnosis of asthma and COPD was established according to physician assessment consistent with the Global Initiative for Asthma15 or the Global Initiative for Chronic Obstructive Lung Disease16 guidance, respectively. There were two study visits within 1 week. At the first visit, spirometry (Lungtest 1000, MES, Cracow, Poland), methacholine bronchial challenge, an allergen skin prick test, and blood sampling were performed. At the second visit, fractional exhaled nitric oxide (FeNO) was measured (FeNO+, Medisoft, Sorinnes, Belgium), bronchodilator responsiveness testing and sputum induction were performed (ULTRA-NEB TM 2000, DeVilbiss, Port Washington, NY, USA).
Exclusion criteria for all asthma and COPD patients were as follows: acute respiratory tract infection, inhaled or systemic steroid treatment or disease exacerbation in the previous 2 months and co-morbidities such as cancer, diabetes, and autoimmune diseases. Additional exclusion criterion for patients with asthma was current smoking. Asthma patients with cigarette smoke exposure less than 5 years and individuals who had smoked in the past but denied smoking in 1 year before the study onset were considered as ex-smokers.
The control group comprised healthy smoking and non-smoking subjects with no history of lung disease and without any symptoms of respiratory tract infection in the previous 2 months. Normal spirometry was a mandatory inclusion criterion in this group. All procedures performed in this study were in accordance with the ethical standards of the institutional and/or national research committee and with the 1964 Helsinki declaration and its later amendments or comparable ethical standards. The study protocol was approved by the Ethics Committee of the Medical University of Warsaw (KB/82/2014) and informed written consent was obtained from all the participants.
Measurements
Spirometry and bronchodilator responsiveness testing were performed according to American Thoracic Society/European Respiratory Society guidelines.17 Airway hyperresponsiveness was tested using methacholine challenge test (PC20).18 Atopy was determined by skin prick tests using 15 common inhalant allergens and defined as the presence of at least one positive skin prick test to allergens, with a diameter of 3 mm or greater than the negative control. Blood samples were collected, and the serum total immunoglobulin E (IgE) was determined by a commercial assay Elecsys IgE II Immunoassay (Roche Diagnostics GmbH, Germany). The recommended threshold value of IgE concentrations for healthy, nonatopic adults was 100 IU/mL.
Sputum Sampling and Processing
Detailed description of sputum sampling and processing is presented in Supplementary file (S1). Briefly, the patients and controls inhaled hypertonic saline (NaCl) at increasing concentrations (3%, 4% and 5% solutions). Sputum was selected from saliva and dispersed in 0.1% dithiothreitol (DTT, Sigma-Aldrich, St. Louis, MO, USA). The differential cell count was determined in May-Grünwald–Giemsa-stained smears based on the morphology of 300 cells from various fields. Sputum eosinophilia was classified as ≥3% of all non-epithelial cells, and sputum neutrophilia was defined as ≥60% of all non-epithelial cells.19
Cytokine Assay
Cytokines, MMPs and protease levels were measured in sputum supernatants using Bio-Plex Pro™ Human Cytokine 27-plex Assay (Bio-Rad Laboratories, Hercules, CA, USA) or ELISA kits (Biotechne, R&D Systems, Minneapolis, MN, USA; Demeditec Diagnostics GmbH, Kiel, Germany; Biomedica Medizinprodukte GmbH, Vienna, Austria). In total, 35 mediators were measured. The measured cytokines were as follows: IL-1β, IL-1RA, IL-2, IL-3, IL-4, IL-5, IL-6, IL-7, IL-8, IL-9, IL-10, IL-12, IL-13, IL-15, IL-17, IL-33, FGF2, G-CSF, GM-CSF, IFNγ, CXCL10 (IP10), CCL2 (MCP-1), CCL3 (MIP-1α), CCL4 (MIP-1β), CCL11 (eotaxin-1), CCL24 (eotaxin-2), CCL26 (eotaxin-3), PDGF-BB, CCL5 (RANTES), TNFα, VEGF, NE, TSLP, periostin, MMP-9. All assessed cytokines and their lower limit of detection are listed in the supplementary file (Table E1).
Statistical Method
As a first step, a univariate analysis comparing baseline characteristics and cytokine levels in asthma, COPD and controls was performed. Continuous variables are presented as medians and interquartile ranges, and categorical variables are expressed as frequencies and proportions. Differences between groups were tested using χ2 test or Fisher's exact test (for categorical variables), Mann–Whitney U-test (for comparisons between two independent groups), and Kruskal–Wallis test (for multiple comparisons between groups) followed by post hoc testing using Mann–Whitney U-tests. Variables with a p-value <0.05 in the Mann–Whitney U-test and no outliers were used to construct multivariate logistic regression model with asthma as a baseline. Outliers were defined as measurements that were more distant from median than 10 interquartile ranges. Odds ratios (ORs) and 95% confidence intervals (95% CI) were calculated. Model performance was validated using additional data for 10 COPD patients. Receiver operator characteristic (ROC) analysis was conducted to evaluate the ability of the model to discriminate between asthma and COPD. In the final step, we explored data used for building logistic regression model using hierarchical clustering in order to discover and compare clusters of samples. Hierarchical clustering was performed for combined samples of asthma and COPD patients, on standardised data using Euclidean distance and Complete-linkage. Statistical analyses were performed in Statistica 13.3 software package (StatSoft Inc., Tulsa, OK, USA) and R software (version 3.6.1; R Foundation for Statistical Computing, Vienna, Austria). Missing data was inputted using “mice” package.
Results
Patient Characteristics
Eighty subjects were enrolled, including 30 asthma patients, 30 COPD patients, 10 healthy non-smoking and 10 healthy smoking subjects. Comparative characteristics of asthma, COPD and controls are presented in Table 1. Baseline characteristic showed a significant difference in age, smoking, lung function, atopic status, sputum eosinophilia and neutrophilia between asthma and COPD patients (Table 1). COPD patients were older, had greater exposure to cigarette smoke and reduced lung function compared to asthma and control groups. Asthma patients had significantly higher sputum eosinophil percentage compared to COPD group (3% vs 1%, respectively), whereas sputum neutrophil percentage was significantly higher in COPD compared to asthma patients (51.5% vs 44%, respectively) (Table 2).
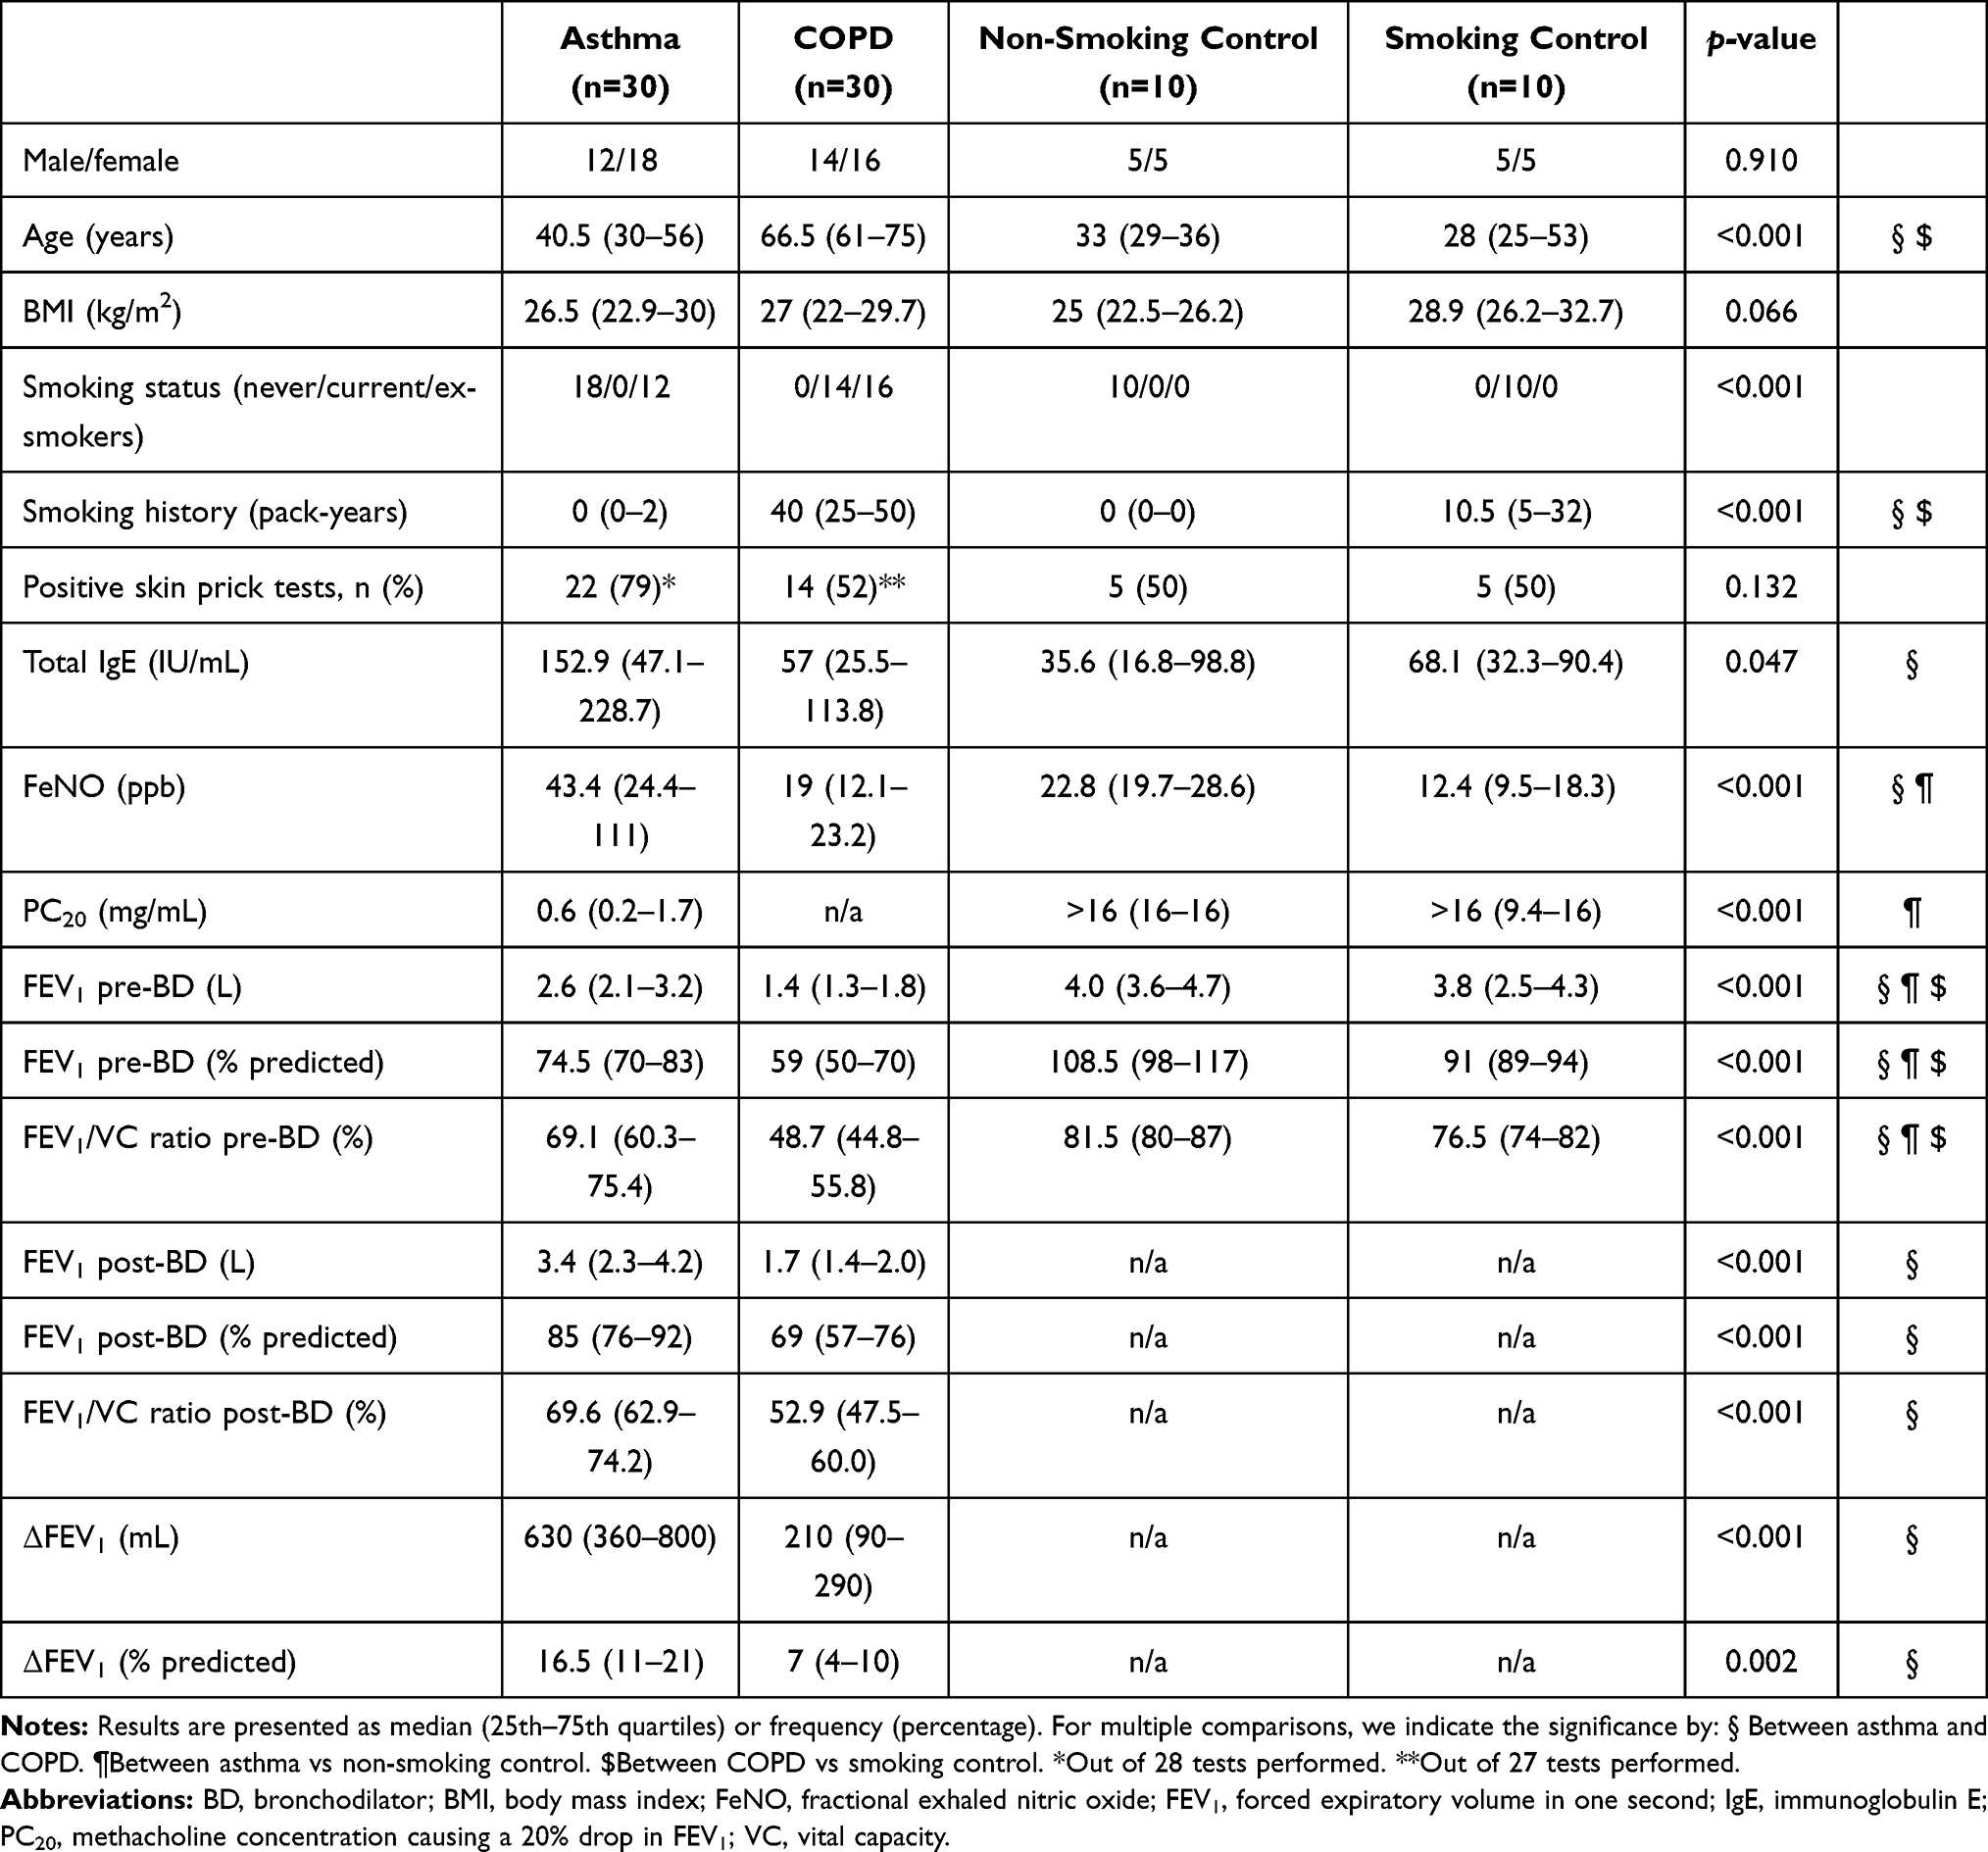 |
Table 1 Clinical Characteristics of Patients with Asthma, COPD and Control Group |
Data on cytokines concentration in induced sputum supernatant are given in Table 2. Sputum levels of IL-8 and CCL4 were significantly higher in COPD compared with both asthma and smoking controls. We found more pronounced differences in cytokine levels between COPD patients and healthy smoking subjects than between asthma and healthy non-smoking controls. The levels of CCL11, periostin, IL-2, IL-4, IL-5, IL-9, IL-10, IL-12, IL-13, IL-15, IL-17, GM-CSF, IFN-γ, CCL3, PDGF-BB, CCL5, VEGF were undetectable for more than 60% of the patients and not analysed further. Correlations between clinical and biochemical features evaluated in asthma and COPD groups are shown in the supplementary file (Table E2).
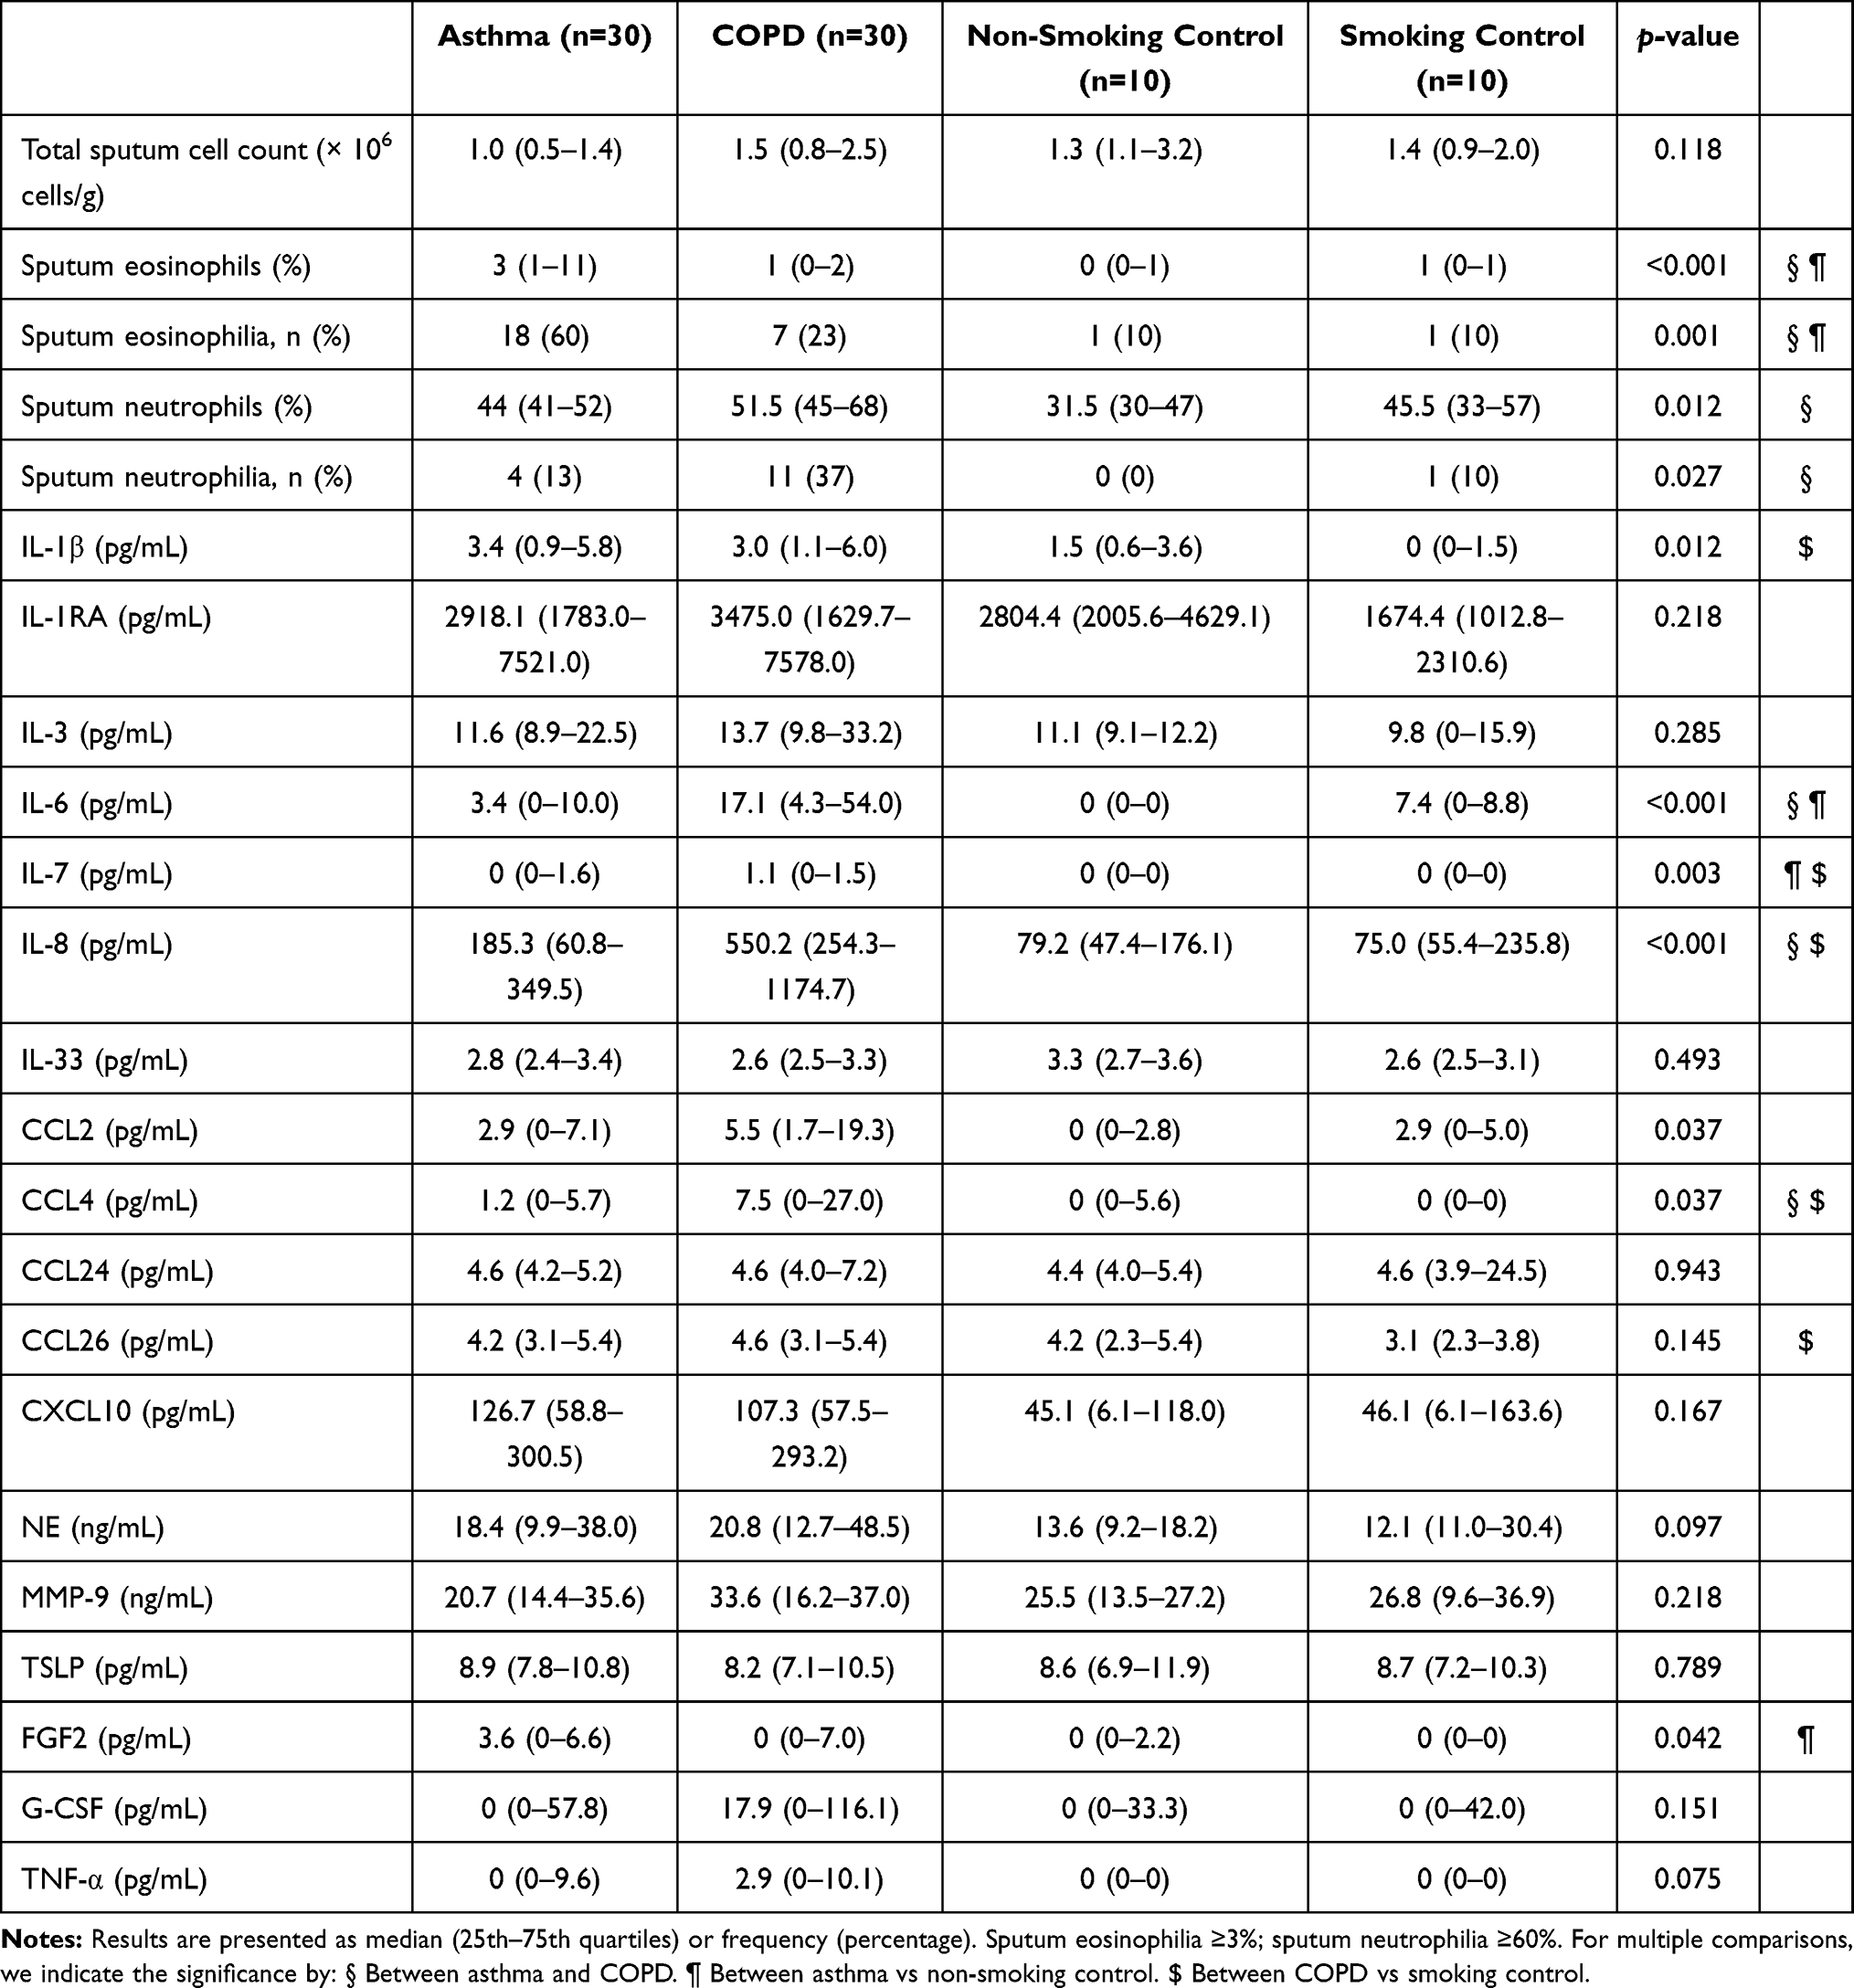 |
Table 2 Characteristics and Mediators of Sputum in Asthma, COPD and Control Group |
Logistic Regression and ROC Analysis of the Discriminative Value of Clinical and Biochemical Features in the Differentiation Between Asthma and COPD
Logistic regression analysis was conducted to identify the optimal factors that were able to discriminate between asthma and COPD (Table 3). Clinical parameters and inflammatory markers showed moderate discriminative power to distinguish asthma and COPD. The combined clinical and cytokine model improved discrimination for diseases. The identified variables were as follows: IL-6, IL-8, CCL4, FEV1/VC ratio pre-BD (%) and sputum neutrophils (%), although only FEV1/VC ratio pre-BD (%) proven significant in the combined model. The model was validated on independent group of COPD (n=10) (Table E3 in the supplementary file). The logistic regression model for combined features showed sensitivity of 93% and specificity of 90%. The area under the curve of the ROC analysis was 0.947 (Figure E1 in the supplementary file). For the model adjusted for age, the AUC was 0.746. Adjustment for age reduced discriminative capacity; however, it confirmed that the most differentiating feature was FEV1/VC ratio pre-BD (%).
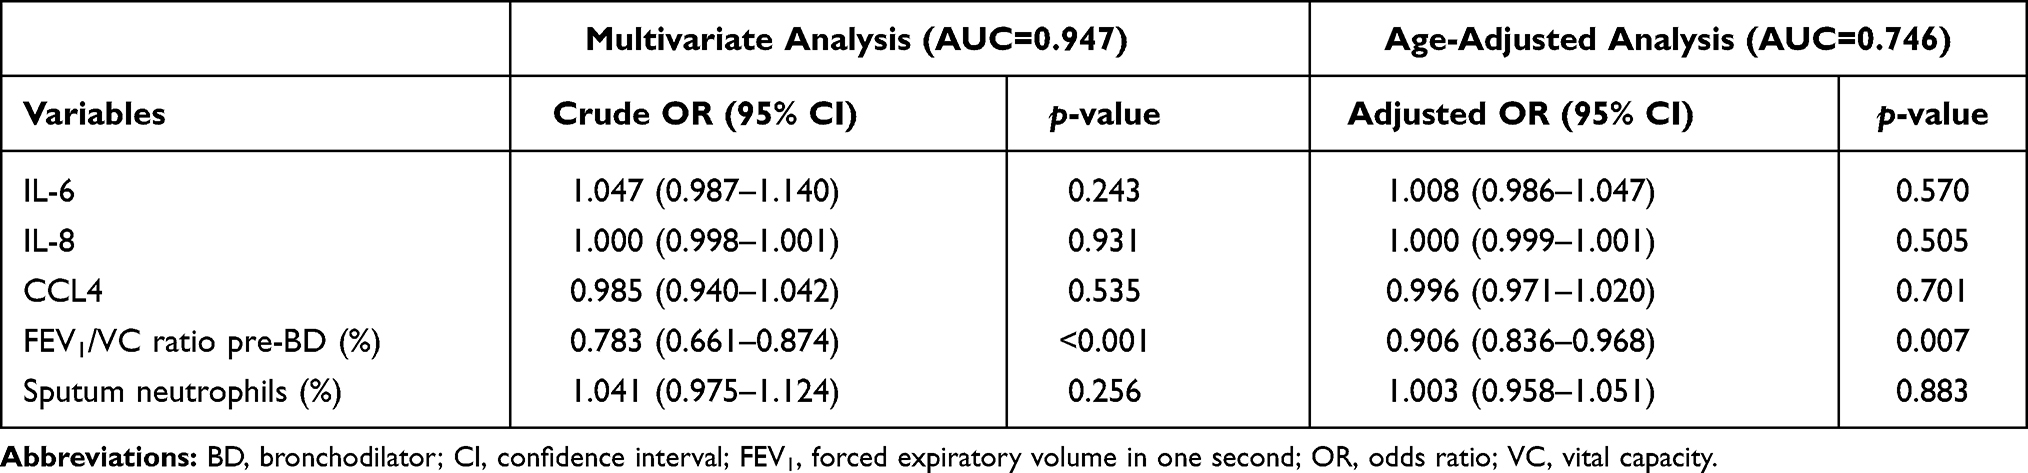 |
Table 3 Logistic Regression Model of Biochemical and Clinical Features for Discrimination of Asthma and COPD Patients |
Cluster Analysis. Clinical and Biochemical Characterisation of Asthma and COPD Patients Based on Cluster Analysis
For additional evaluation of clinical and biochemical features discriminating between asthma and COPD a cluster analysis was performed using the assumptions that were included in the logistic regression (Figure 1). Clinical characteristics of two main clusters are shown in Table 4. Cluster 1 mainly included patients with asthma (79% of asthma patients), with a larger female proportion. The level of FeNO was significantly higher in cluster 1. Cluster 2 (77% of COPD patients) was characterised by worse lung function and a greater smoking pack-year history. This cluster also had significantly higher proportion of sputum neutrophils. All detectable cytokines had higher levels in cluster 2 compared to cluster 1 (Table 5). The differences for IL-33, CCL4, CCL24, CXCL10, and MMP-9 remained significant after adjustment for age.
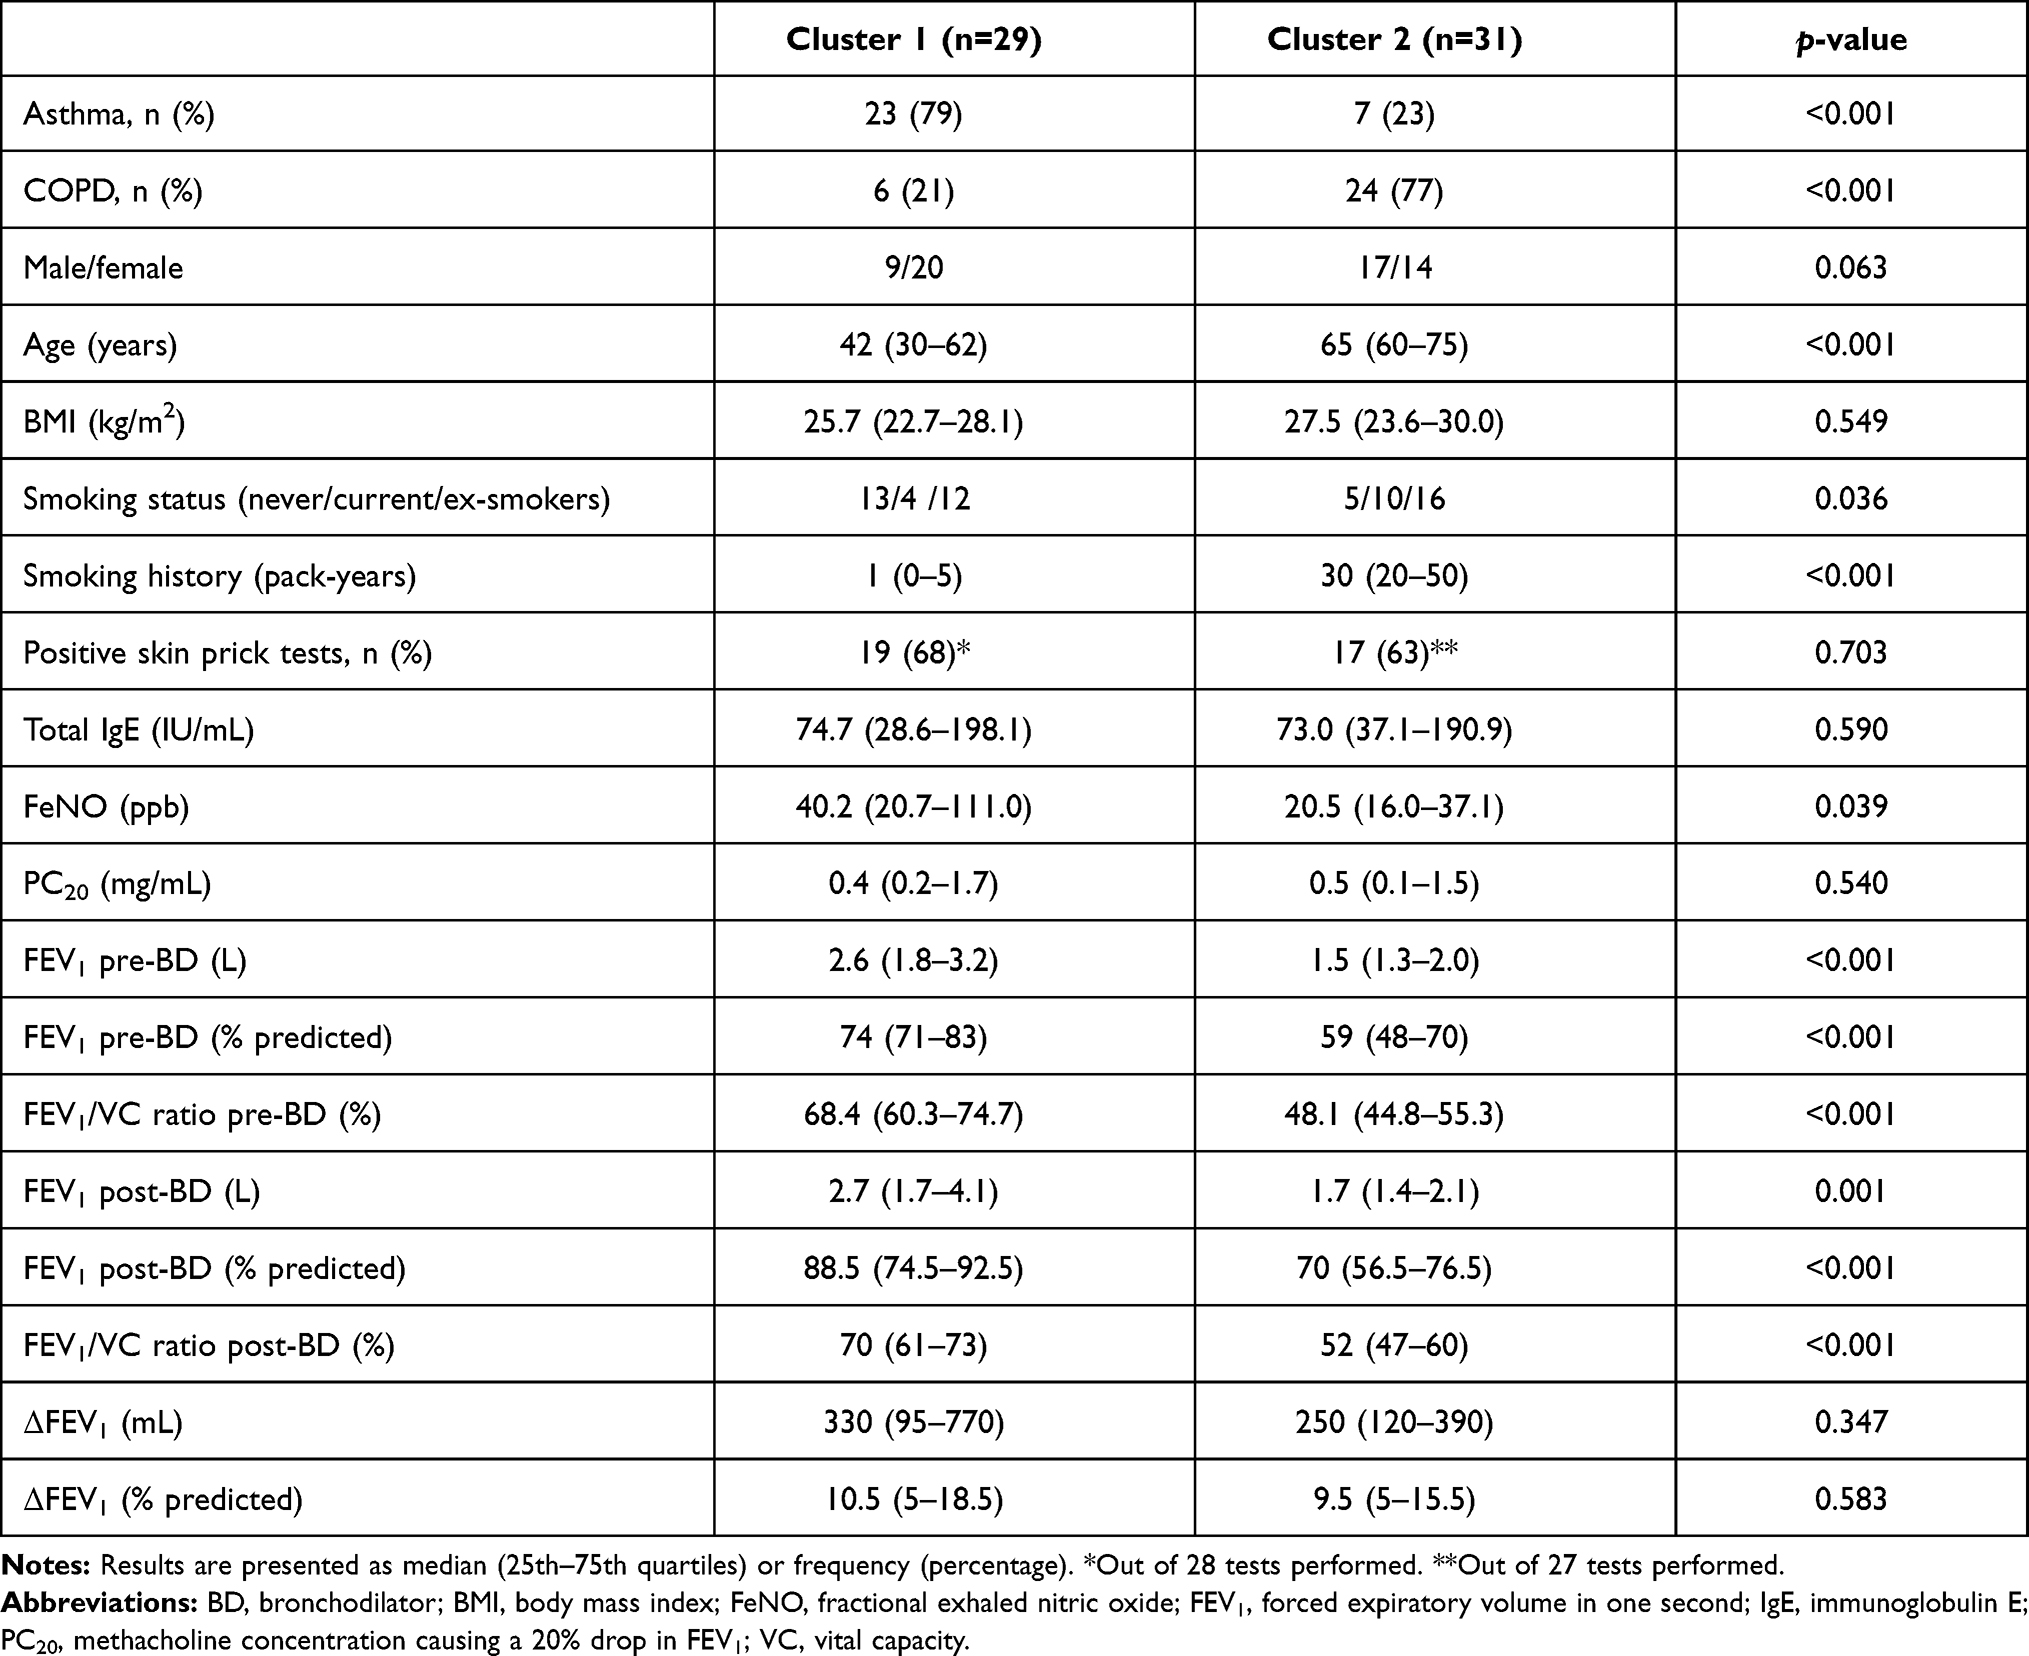 |
Table 4 Clinical Characteristics of Patients in Two Identified Clusters |
 |
Table 5 Characteristics and Mediators of Sputum in Two Main Identified Clusters |
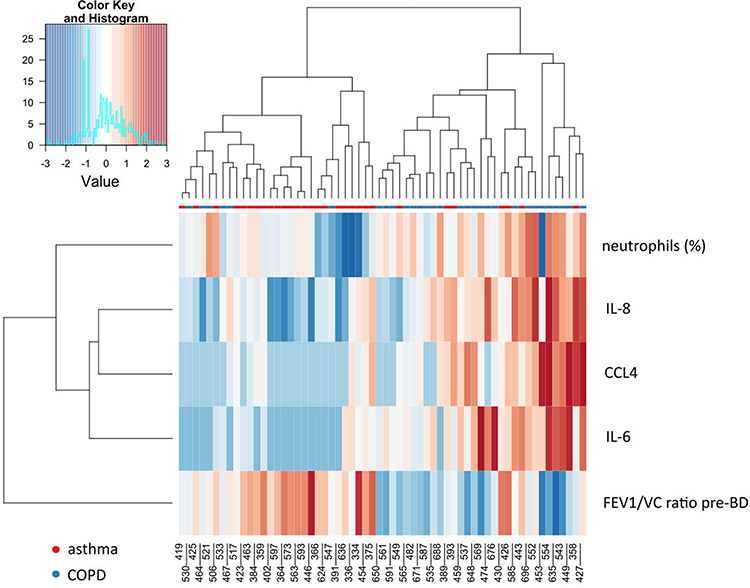 |
Figure 1 Hierarchical clustering heatmap of asthma and COPD patients based on clinical, sputum cytokine and cellular features. The rows and columns are ordered based on the results of hierarchical clustering with dendrograms for the patients shown on the horizontal axis and clinical and laboratory data shown on the vertical axis. The colour scale codes normalized value of a variable with red corresponding to the highest value. |
In the next step of the analysis, we assessed the differences in the clinical and biochemical profiles between patients with asthma and COPD within the cluster (1 or 2) and between patients with asthma or COPD from cluster 1 and 2. Asthma patients from cluster 2 were older, had worse spirometry test results (decreased baseline FEV1 (L) and post-BD FEV1/VC ratio) and increased sputum neutrophil number compared to asthma patients from cluster 1 (Table 6 and 7). There were no differences in frequency of positive skin tests, total serum IgE and FeNO level between these subgroups. Sputum mediator profiling showed significantly higher level of IL-1RA, IL-6, IL-7, IL-8, IL-33, CCL2, CCL4, CCL24, CXCL10, NE, MMP-9, G-CSF and TNF-α in asthma patients from cluster 2 compared to asthma patients from cluster 1 (Table 7).
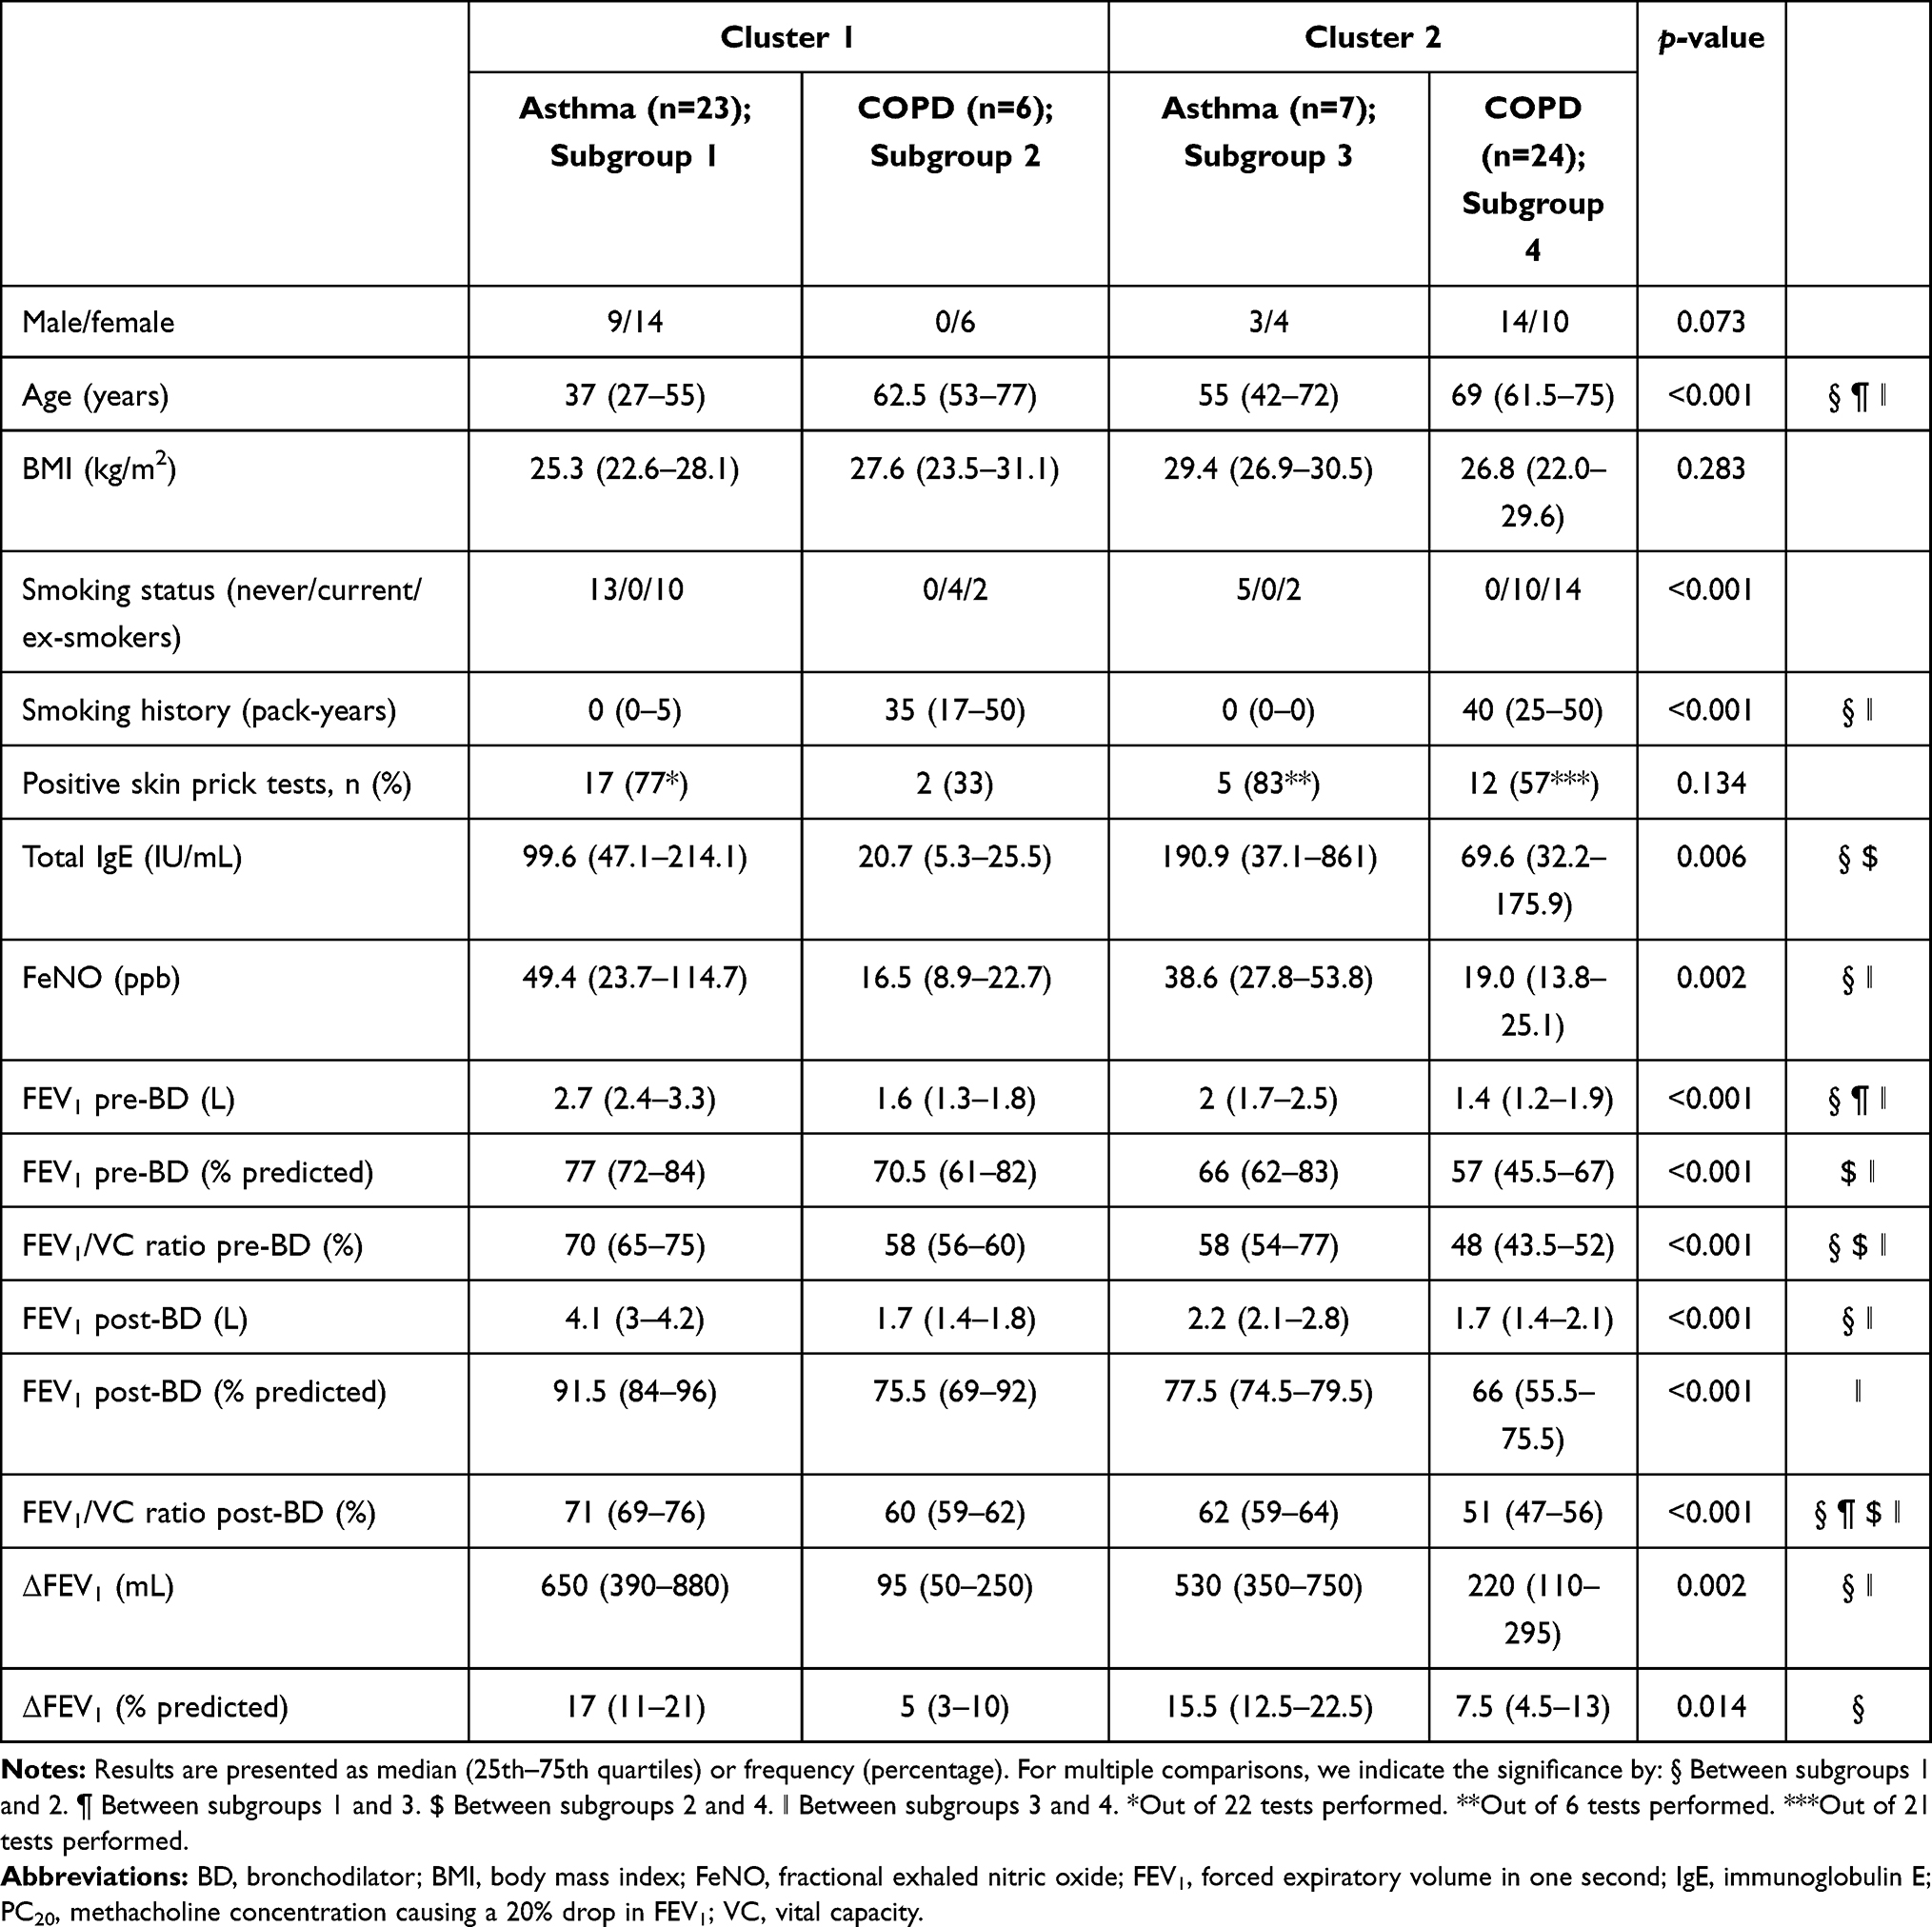 |
Table 6 Clinical Characteristics of Patients from the Main Two Clusters Divided According to Asthma or COPD Diagnosis |
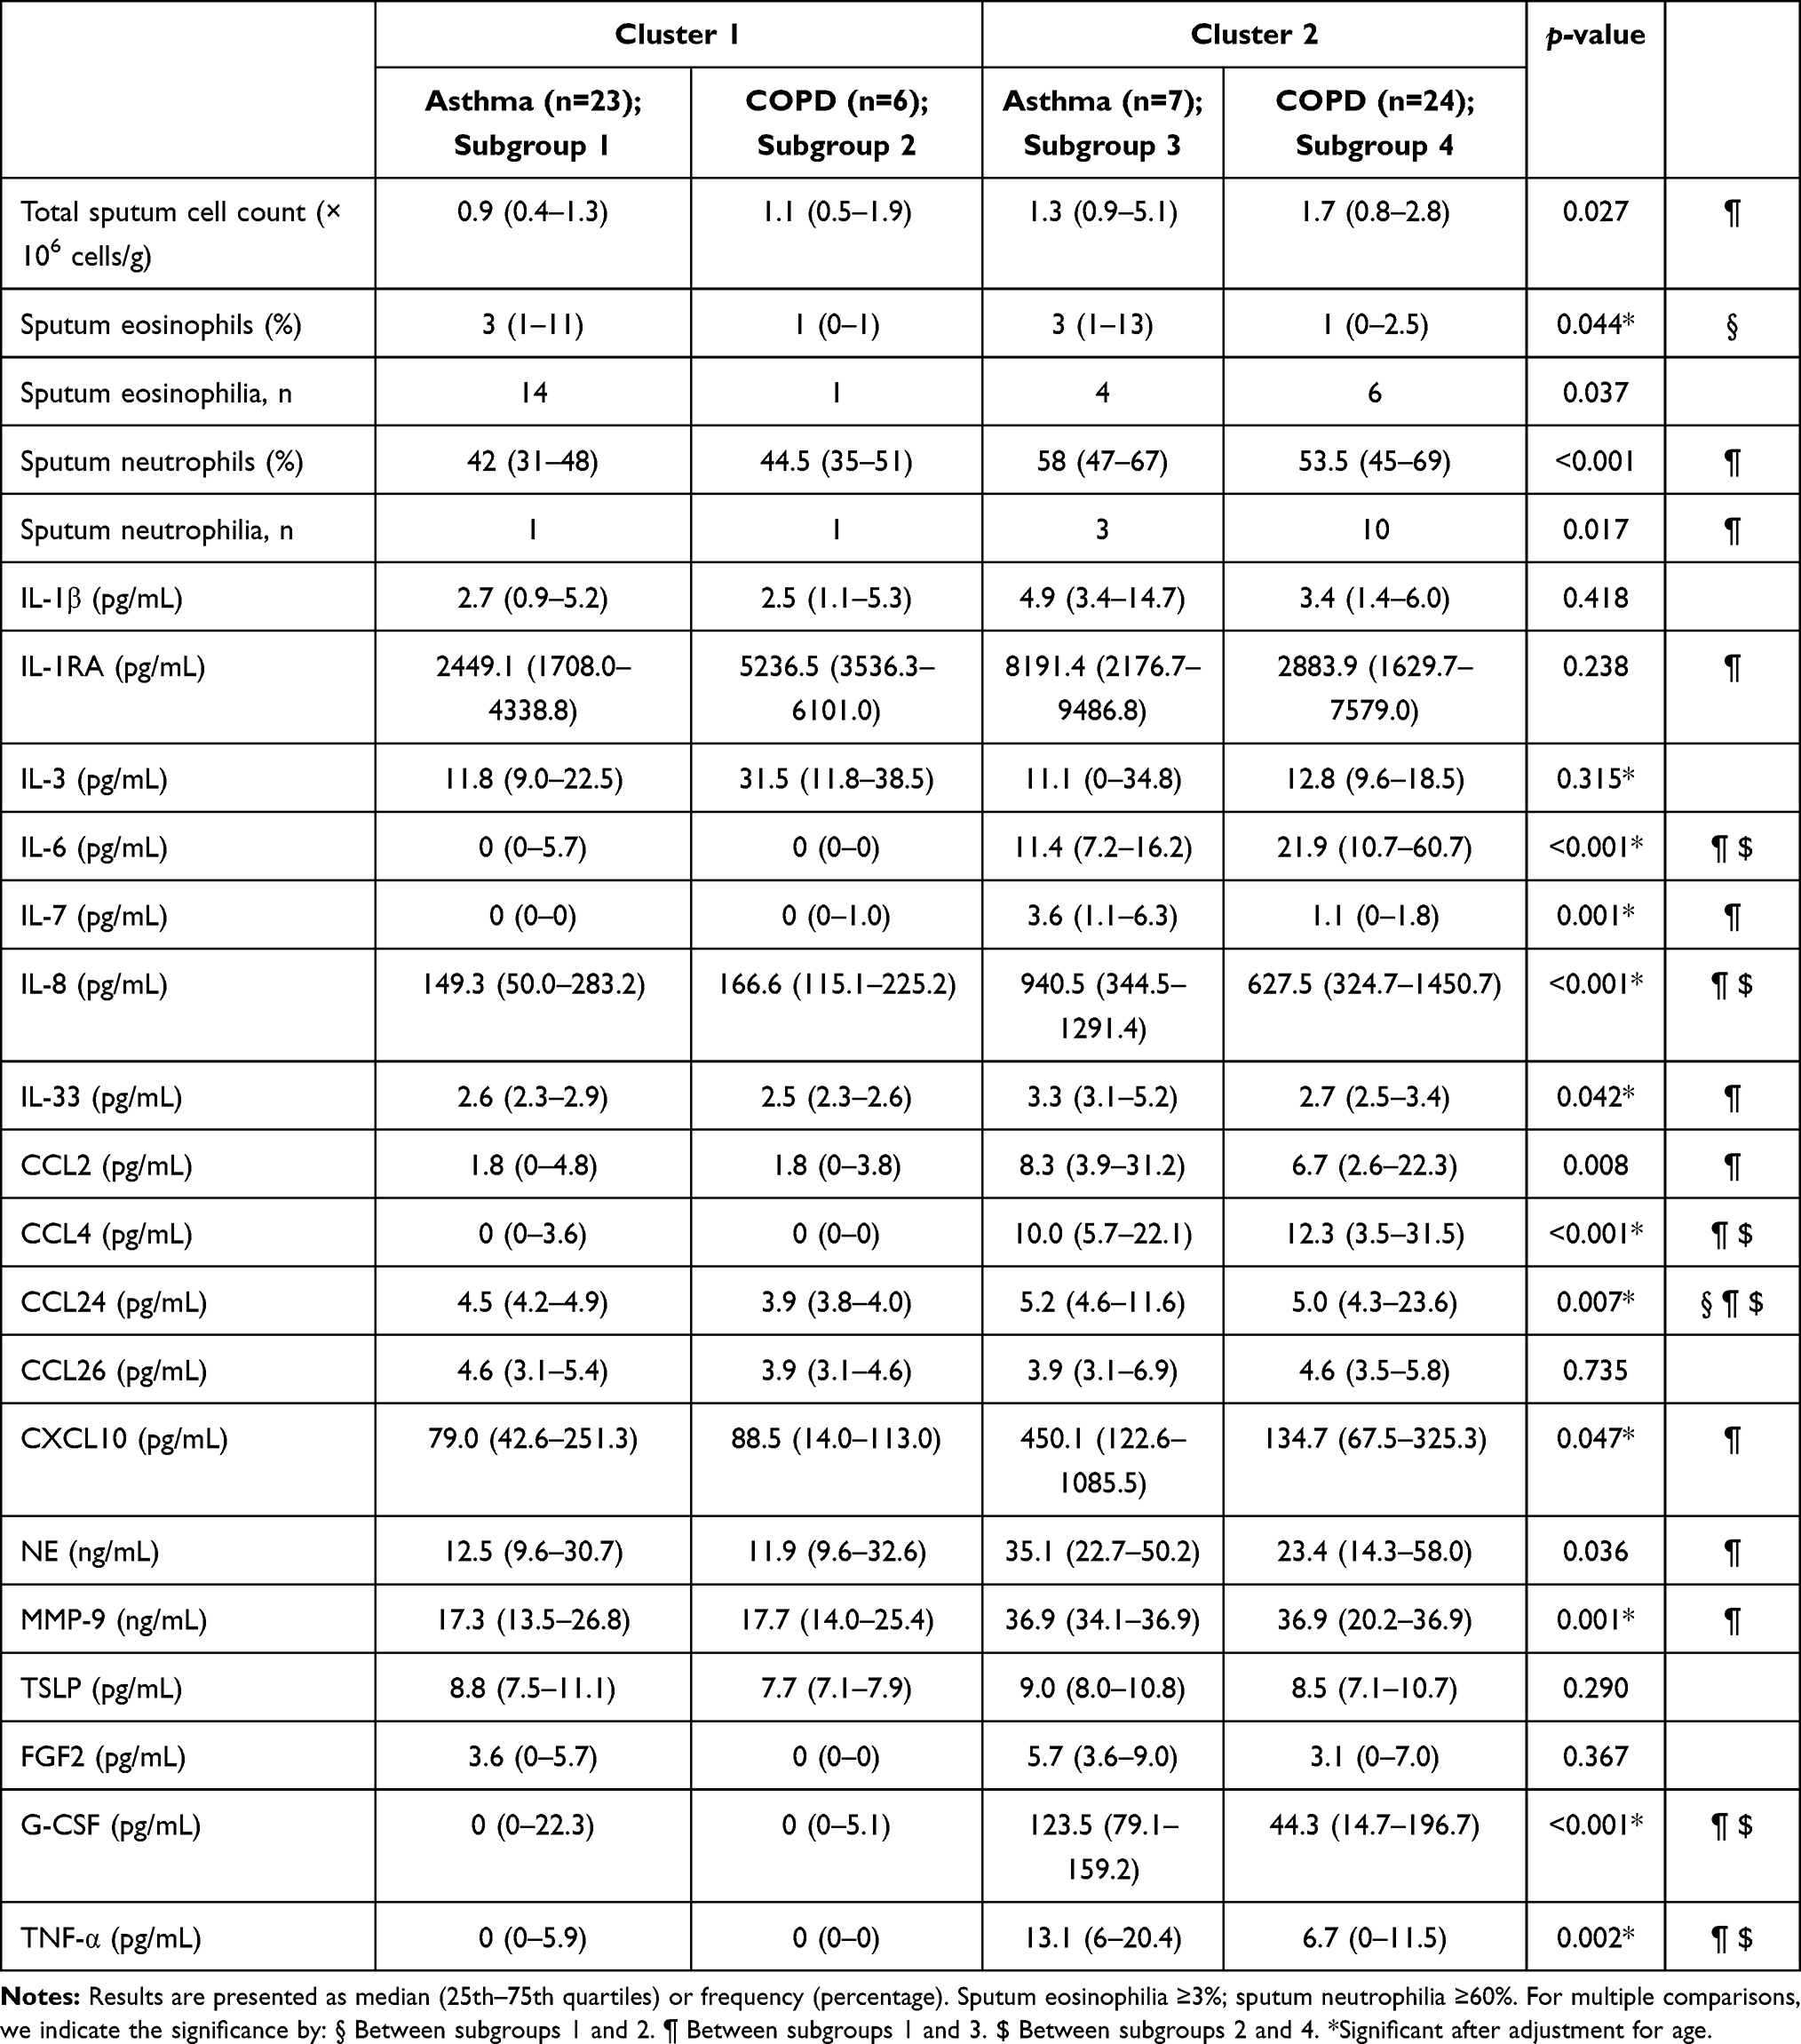 |
Table 7 Characteristics and Mediators of Sputum in Patients from the Main Two Clusters Divided According to Asthma or COPD Diagnosis |
COPD patients from cluster 1 differed from those in cluster 2 in terms of gender distribution. Cluster 1 comprised females only, whereas cluster 2 was a heterogeneous group (Table 6). Patients with COPD from cluster 2 had higher level of total serum IgE and reduced lung function (decreased baseline FEV1% predicted, pre- and post-BD FEV1/VC ratio) compared to COPD patients in cluster 1. No differences were found in sputum eosinophil and neutrophil count or frequency of eosinophilia or neutrophilia between COPD subgroups. COPD patients from cluster 2 were characterised by a more pronounced inflammatory airway background: sputum IL-6, IL-8, CCL4, CCL24, G-CSF and TNF-α levels were elevated in this subgroup compared to COPD patients from cluster 1 (Table 7).
Comparing patients with asthma and COPD in the same cluster showed multiple differences in clinical features, but these subgroups were similar in terms of sputum cytokine levels with one exception which was CCL24 in cluster 1 (Tables 6 and 7).
Discussion
In this study, a multivariate logistic regression in combination with cluster analysis was applied to explore profiles of stable mild-to-moderate asthma and COPD patients according to clinical, cellular and molecular data. We found that a combination of clinical and biochemical variables distinguished asthma from COPD patients with high sensitivity and specificity. The detailed statistical analysis revealed that inflammatory profiles of asthma and COPD was not disease specific, varied within the disease and were similar between these diseases. To our knowledge, our study is one of the few studies on phenotyping of obstructive airway diseases in steroid-naïve patients with milder stage of diseases. Thus, we believe our paper may add some new data to the existing literature on the topic.
A progression of obstructive lung diseases severity from mild to severe is poorly understood. One of the reasons is that patients with mild lung dysfunction are underdiagnosed. Only 5% of mild COPD patients have clinician-based diagnosis.20 However, patients with milder stage of disease might be characterized by modifiable inflammatory process that could be a target for pharmacological intervention aimed at amelioration of disease progression. In this study, we included patients with mild-to-moderate asthma and COPD who were well-characterised on the basis of clinical and routine laboratory parameters. Although the comparative analysis of clinical features differentiated asthma and COPD very well, the comparison of cytokine profiles poorly distinguished these two disorders, yet these profiles were markedly different from those in the control group. Only a combination of five variables, namely IL-6, IL-8, CCL4, FEV1/VC ratio pre-BD (%) and sputum neutrophils (%), yielded high sensitivity and specificity in the differentiation between asthma and COPD.
In the next step, profiles of asthma and COPD were characterised by cluster analysis. We identified two main clusters: cluster 1 and cluster 2, with asthma and COPD predominance, respectively. Cluster 1 was shared between asthma and COPD patients with evidence of eosinophilic airway inflammation. This cluster was characterised by a low level of Th1 and, surprisingly, Th2 mediators despite the increased eosinophil proportion in sputum. Although asthma is typically considered as type 2 inflammation-related disease, it is estimated that even half of asthma patients may not exhibit this type of inflammatory process.21 As these patients do not express an increased level of Th2 cytokines, treatment directed against type 2 inflammation may not be beneficial.22,23 On the other hand, the low level of Th2 cytokines observed in subgroup 1 might be associated with milder stage of the disease when airway inflammation is less intense than in more severe stages. Th1 and Th2 mediator levels as well as neutrophilic inflammation were enhanced in cluster 2.
In further analysis, we categorized patients within the main clusters according to clinical diagnosis of asthma or COPD in order to investigate why some asthma patients were clustered together with COPD and vice versa. Interestingly, asthma and COPD patients within cluster 1 differed in terms of their clinical characteristics and sputum eosinophil count, but except for CCL24 no other differentiating inflammatory mediators were found. Similar to cluster 1, in cluster 2 the differences between clinical characteristics of asthma and COPD patients were not accompanied by different cytokine profile. We found subgroups with a different severity of inflammation among asthma and COPD patients. Subgroup 3 is a cluster of asthma patients with more severe airway inflammation than asthmatics in subgroup 1. Likewise, subgroup 4 is a group of COPD patients with more intense inflammation than COPD patients in subgroup 2.
The inflammatory profile of asthmatics from subgroup 3 was associated with type 2 as well as type 1 immunity. Highly elevated level of CXCL10, a well-studied chemoattractant for Th1 cells, was found in subgroup 3.24 Gauthier showed that IFN-γ induced expression of CXCL10 in severe asthmatics correlated with markers of poor disease control and was related to corticosteroid resistance.25 Moreover, we found an increased level of TNF-α in subgroup 3 compared to asthmatics from subgroup 1. It was reported that elevated lung levels of TNF-α was linked to severe and/or steroid-resistant asthma.26,27 Also, this subgroup had an increased sputum neutrophil count. In stable asthma, airway neutrophilia is uncommon; however, it may occur.28 Neutrophilic inflammation in subgroup 3 might be explained by a high level of IL-8 which is one of the most potent neutrophil chemoattractant.29 Additionally, other mediators of neutrophilic inflammation were increased in subgroup 3. These include G-CSF which is related to asthma progression,30 IL-6 which correlates with an impaired lung function in asthmatics,31 MMP-9 which is an important marker of neutrophilic activation,32,33 NE plays a role in the development of allergic airway inflammation and airway hyperreactivity in animal model,34 and IL-1RA produced by neutrophils.35
Our combined analysis showed that among asthma patients with mild-to-moderate disease there is a distinct subgroup of patients who shared similar clinical features with other asthma patients, but had considerably different inflammatory pattern in sputum samples, likewise in COPD patients. This supports the concept of “treatable traits“ in obstructive lung diseases, which highlights the need to use lung function parameters in combination with biomarkers that reflect underlying pathophysiologic mechanism. Therefore, an appropriate classification of obstructive lung diseases that incorporates clinical and molecular features is needed to facilitate personalised treatment. Precision medicine shows benefits in well-characterised severe patients36,37 but is not applied to mild asthma and COPD patients attended in primary care. Corticosteroids are the mainstay of asthma therapy; however, non-type 2-driven inflammation is often steroid insensitive, and steroids might contribute to increased airway neutrophilia.38 In order to avoid a potential relative predominance of Th1 immune mediators associated with corticosteroid therapy which suppresses Th2 adaptive inflammation, only patients with mild and moderate disease who did not receive either inhaled or systemic corticosteroids were included to this study. Hence, we believe that the imbalance between Th1/Th2 response toward Th1 dominance in one subgroup of asthma is related to the natural course of disease in these patients, is not a bias caused by the treatment.
Several studies have attempted to identify homogeneous clusters of obstructive lung diseases in a combined cohort of asthma and COPD patients irrespective to clinical diagnosis. However, there has been a significant heterogeneity in terms of data included in cluster analyses. Ghebre et al analysed clinical parameters, sputum mediators, and microbiome communities at exacerbation in clusters identified by factor scores derived from inflammatory mediators.39 Górska et al incorporated clinical, physiological, and inflammatory mediator characteristics.40 Diver et al performed clustering using microbiome sequencing data.41 Weatherall et al selected clinical data and pulmonary function tests.42 The comparison of clusters identified in these studies is challenging due to discrepancies in methodology, population, and data selection. Additionally, most studies were conducted in cohorts of severe stage of diseases or during exacerbations. Nevertheless, there was some resemblance between the results of our study and clusters previously reported. Cluster 2 in our study shares common features with Cluster 3 found by Ghebre et al and included older and overweighted (BMI >27 kg/m2) patients with similar sputum cellular composition, and increased Th1 mediators.39 It should be noted, however, that the study by Ghebre et al included asthma and COPD patients during exacerbation. Regardless of statistical methods used studies on phenotyping of obstructive pulmonary diseases clearly show that asthma and COPD are heterogeneous and overlapping diseases. Our results also confirmed this observation. We were able to identify different phenotypes which were not “average” asthma or COPD.
Our study has some limitations. The sample size was relatively small for cluster analysis. However, the number of patients was limited by a broad panel of cytokines measured. Another limitation is that we included only two stages of disease severity and did not analyse the patients according to the severity of the disease. Also, we are aware that our model has limited usefulness in the daily clinical practice. Much effort has been focused on establishing biomarkers in easily accessible and non-invasive samples such as blood. However, due to blood’s systemic nature, induced sputum along with bronchoalveolar lavage fluid and tissue samples remain the most relevant samples for studying phenotypes and endotypes in lung diseases.
Conclusions
In summary, we found that the inflammatory profile of sputum samples from patients with stable mild-to-moderate asthma and COPD is not disease specific, varies within the disease and might be similar between these diseases. Our findings are in line with ‘treatable traits’ concept and label-free approaches and highlight the importance of identification of different phenotypes also in milder stages of obstructive airway diseases.
Abbreviations
AUC, area under the curve; BD, bronchodilator; BMI, body mass index; CCL2, C-C motif chemokine ligand 2; CI, confidence interval; COPD, chronic obstructive pulmonary disease; CXCL10, C-X-C motif chemokine ligand 10; ERS, European Respiratory Society; FeNO, fractional exhaled nitric oxide; FEV1, forced expiratory volume in one second; FGF2, basic fibroblast growth factor; FVC, forced vital capacity; G-CSF, granulocyte colony-stimulating factor; GM-CSF, granulocyte-macrophage colony-stimulating factor; ICS, inhaled corticosteroids; IL, interleukin; IFNγ, interferon gamma; IgE, immunoglobulin E; IP10, interferon gamma-induced protein 10; MCP-1, monocyte chemoattractant protein 1; MIP-1α, macrophage inflammatory protein 1 alpha; MMP-9, matrix metallopeptidase 9; OR, odds ratio; PC20, methacholine concentration causing a 20% drop in FEV1; PDGF-BB, platelet-derived growth factor; RANTES, regulated on activation, normal T cell expressed and secreted; ROC, receiver operating characteristic; Th, T-helper; TNFα, tumor necrosis factor alpha; TSLP, thymic stromal lymphopoietin; VC, vital capacity; VEGF, vascular endothelial growth factor; NE, neutrophil elastase.
Acknowledgment
This work was supported by the Fundacja im. Jakuba hr. Potockiego (grant number 1WU/DAR3/17); and Medical University of Warsaw (grant number 1WU/PM1/17/17).
Disclosure
R. Krenke and K. Górska received fees for lectures and/or travel expenses from Boehringer Ingelheim, AstraZeneca, Roche, Chiesi Farmaceutici and Polpharma. The authors report no other conflicts of interest in this work.
References
1. Welte T, Groneberg DA. Asthma and COPD. Exp Toxicol Pathol. 2006;57(Suppl 2):35–40. doi:10.1016/j.etp.2006.02.004
2. Wenzel SE. Emergence of biomolecular pathways to define novel asthma phenotypes. Type-2 Immunity and Beyond. Am J Respir Cell Mol Biol. 2016;55:1–4. doi:10.1165/rcmb.2016-0141PS
3. Keatings VM, Collins PD, Scott DM, Barnes PJ. Differences in interleukin-8 and tumor necrosis factor-alpha in induced sputum from patients with chronic obstructive pulmonary disease or asthma. Am J Respir Crit Care Med. 1996;153:530–534. doi:10.1164/ajrccm.153.2.8564092
4. Lim S, Roche N, Oliver BG, Mattos W, Barnes PJ, Chung KF. Balance of matrix metalloprotease-9 and tissue inhibitor of metalloprotease-1 from alveolar macrophages in cigarette smokers. Regulation by interleukin-10. Am J Respir Crit Care Med. 2000;162:1355–1360. doi:10.1164/ajrccm.162.4.9910097
5. Bhowmik A, Seemungal TA, Sapsford RJ, Wedzicha JA. Relation of sputum inflammatory markers to symptoms and lung function changes in COPD exacerbations. Thorax. 2000;55:114–120. doi:10.1136/thorax.55.2.114
6. Dunn RM, Busse PJ, Wechsler ME. Asthma in the elderly and late-onset adult asthma. Allergy. 2018;73:284–294. doi:10.1111/all.13258
7. Nyenhuis SM, Schwantes EA, Evans MD, Mathur SK. Airway neutrophil inflammatory phenotype in older subjects with asthma. J Allergy Clin Immunol. 2010;125:1163–1165. doi:10.1016/j.jaci.2010.02.015
8. Ho J, He W, Chan MTV, et al. Eosinophilia and clinical outcome of chronic obstructive pulmonary disease: a meta-analysis. Sci Rep. 2017;7:13451. doi:10.1038/s41598-017-13745-x
9. Hospers JJ, Postma DS, Rijcken B, Weiss ST, Schouten JP. Histamine airway hyper-responsiveness and mortality from chronic obstructive pulmonary disease: a cohort study. Lancet. 2000;356:1313–1317. doi:10.1016/S0140-6736(00)02815-4
10. Gibson PG, Simpson JL. The overlap syndrome of asthma and COPD: what are its features and how important is it? Thorax. 2009;64:728–735. doi:10.1136/thx.2008.108027
11. Agusti A, Bel E, Thomas M, et al. Treatable traits: toward precision medicine of chronic airway diseases. Eur Respir J. 2016;47:410–419. doi:10.1183/13993003.01359-2015
12. Garth J, Barnes JW, Krick S. Targeting cytokines as evolving treatment strategies in chronic inflammatory airway diseases. Int J Mol Sci. 2018;19:19. doi:10.3390/ijms19113402
13. Howard R, Rattray M, Prosperi M, Custovic A. Distinguishing asthma phenotypes using machine learning approaches. Curr Allergy Asthma Rep. 2015;15:38. doi:10.1007/s11882-015-0542-0
14. Nikolaou V, Massaro S, Fakhimi M, Stergioulas L, Price D. COPD phenotypes and machine learning cluster analysis: a systematic review and future research agenda. Respir Med. 2020;171:106093. doi:10.1016/j.rmed.2020.106093
15. Global initiative for asthma. Global strategy for asthma management and prevention; 2015. Available from: www.ginasthma.org.
16. Global Initiative for Chronic Obstructive Lung Disease. Global strategy for the diagnosis, management, and prevention of chronic obstructive pulmonary disease; (updated 2015). Available from: www.goldcopd.org.
17. Brusasco V, Crapo R, Viegi G; American Thoracic Society, European Respiratory Society. Coming together: the ATS/ERS consensus on clinical pulmonary function testing. Eur Respir J. 2005;26:1–2. doi:10.1183/09031936.05.00034205
18. Crapo RO, Casaburi R, Coates AL, et al. Guidelines for methacholine and exercise challenge testing—1999. Am J Respir Crit Care Med. 2000;161:309–329. doi:10.1164/ajrccm.161.1.ats11-99
19. Belda J, Leigh R, Parameswaran K, O’Byrne PM, Sears MR, Hargreave FE. Induced sputum cell counts in healthy adults. Am J Respir Crit Care Med. 2000;161:475–478. doi:10.1164/ajrccm.161.2.9903097
20. Lindberg A, Bjerg A, Bjerg-Bäcklund A, Rönmark E, Larsson L-G, Lundbäck B. Prevalence and underdiagnosis of COPD by disease severity and the attributable fraction of smoking report from the obstructive lung disease in northern Sweden studies. Respir Med. 2006;100:264–272. doi:10.1016/j.rmed.2005.04.029
21. Fahy JV. Type 2 inflammation in asthma — present in most, absent in many. Nat Rev Immunol. 2015;15:57–65. doi:10.1038/nri3786
22. Woodruff PG, Modrek B, Choy DF, et al. T-helper type 2-driven inflammation defines major subphenotypes of asthma. Am J Respir Crit Care Med. 2009;180:388–395. doi:10.1164/rccm.200903-0392OC
23. Corren J, Lemanske RF, Hanania NA, et al. Lebrikizumab treatment in adults with asthma. N Engl J Med. 2011;365:1088–1098. doi:10.1056/NEJMoa1106469
24. Sallusto F, Lenig D, Mackay CR, Lanzavecchia A. Flexible programs of chemokine receptor expression on human polarized T helper 1 and 2 lymphocytes. J Exp Med. 1998;187:875–883. doi:10.1084/jem.187.6.875
25. Gauthier M, Chakraborty K, Oriss TB, et al. Severe asthma in humans and mouse model suggests a CXCL10 signature underlies corticosteroid-resistant Th1 bias. JCI Insight. 2017;2(13):e94580. doi:10.1172/jci.insight.94580
26. Howarth P, Babu K, Arshad H, et al. Tumour necrosis factor (TNFα) as a novel therapeutic target in symptomatic corticosteroid dependent asthma. Thorax. 2005;60:1012–1018. doi:10.1136/thx.2005.045260
27. Berry MA, Hargadon B, Shelley M, et al. Evidence of a role of tumor necrosis factor alpha in refractory asthma. N Engl J Med. 2006;354:697–708. doi:10.1056/NEJMoa050580
28. Ray A, Kolls JK. Neutrophilic inflammation in asthma and association with disease severity. Trends Immunol. 2017;38:942–954. doi:10.1016/j.it.2017.07.003
29. Kunkel SL, Standiford T, Kasahara K, Strieter RM. Interleukin-8 (IL-8): the major neutrophil chemotactic factor in the lung. Exp Lung Res. 1991;17:17–23. doi:10.3109/01902149109063278
30. Kim Y-M, Kim H, Lee S. et al. Airway G-CSF identifies neutrophilic inflammation and contributes to asthma progression. Eur Respir J.2020;55(2):1900827. doi:10.1183/13993003.00827-2019
31. Rincon M, Irvin CG. Role of IL-6 in asthma and other inflammatory pulmonary diseases. Int J Biol Sci. 2012;8:1281–1290. doi:10.7150/ijbs.4874
32. Mattos W, Lim S, Russell R, Jatakanon A, Chung KF, Barnes PJ. Matrix metalloproteinase-9 expression in asthma: effect of asthma severity, allergen challenge, and inhaled corticosteroids. Chest. 2002;122:1543–1552. doi:10.1378/chest.122.5.1543
33. Barbaro MPF, Spanevello A, Palladino GP, Salerno FG, Lacedonia D, Carpagnano GE. Exhaled matrix metalloproteinase-9 (MMP-9) in different biological phenotypes of asthma. Eur J Intern Med. 2014;25:92–96. doi:10.1016/j.ejim.2013.08.705
34. Koga H, Miyahara N, Fuchimoto Y, et al. Inhibition of neutrophil elastase attenuates airway hyperresponsiveness and inflammation in a mouse model of secondary allergen challenge: neutrophil elastase inhibition attenuates allergic airway responses. Respir Res. 2013;14:8. doi:10.1186/1465-9921-14-8
35. Malyak M, Smith MF, Abel AA, Hance KR, Arend WP. The differential production of three forms of IL-1 receptor antagonist by human neutrophils and monocytes. J Immunol. 1998;161:2004–2010.
36. McDonald VM, Clark VL, Cordova-Rivera L, Wark PAB, Baines KJ, Gibson PG. Targeting treatable traits in severe asthma: a randomised controlled trial. Eur Respir J. 2020;55(3):1901509. doi:10.1183/13993003.01509-2019
37. Hiles SA, Gibson PG, Agusti A, McDonald VM. Treatable traits that predict health status and treatment response in airway disease. J Allergy Clin Immunol Pract. 2020;9:1255–1264.e2. doi:10.1016/j.jaip.2020.09.046
38. Cowan DC, Cowan JO, Palmay R, Williamson A, Taylor DR. Effects of steroid therapy on inflammatory cell subtypes in asthma. Thorax. 2010;65:384–390. doi:10.1136/thx.2009.126722
39. Ghebre MA, Pang PH, Diver S, et al. Biological exacerbation clusters demonstrate asthma and chronic obstructive pulmonary disease overlap with distinct mediator and microbiome profiles. J Allergy Clin Immunol. 2018;141:2027–2036.e12. doi:10.1016/j.jaci.2018.04.013
40. Górska K, Paplińska-Goryca M, Nejman-Gryz P, Goryca K, Krenke R. Eosinophilic and neutrophilic airway inflammation in the phenotyping of mild-to-moderate asthma and chronic obstructive pulmonary disease. COPD. 2017;14:181–189. doi:10.1080/15412555.2016.1260539
41. Diver S, Richardson M, Haldar K, et al. Sputum microbiomic clustering in asthma and chronic obstructive pulmonary disease reveals a Haemophilus-predominant subgroup. Allergy. 2020;75:808–817. doi:10.1111/all.14058
42. Weatherall M, Travers J, Shirtcliffe PM, et al. Distinct clinical phenotypes of airways disease defined by cluster analysis. Eur Respir J. 2009;34:812–818. doi:10.1183/09031936.00174408
 © 2021 The Author(s). This work is published and licensed by Dove Medical Press Limited. The
full terms of this license are available at https://www.dovepress.com/terms
and incorporate the Creative Commons Attribution
- Non Commercial (unported, 3.0) License.
By accessing the work you hereby accept the Terms. Non-commercial uses of the work are permitted
without any further permission from Dove Medical Press Limited, provided the work is properly
attributed. For permission for commercial use of this work, please see paragraphs 4.2 and 5 of our Terms.
© 2021 The Author(s). This work is published and licensed by Dove Medical Press Limited. The
full terms of this license are available at https://www.dovepress.com/terms
and incorporate the Creative Commons Attribution
- Non Commercial (unported, 3.0) License.
By accessing the work you hereby accept the Terms. Non-commercial uses of the work are permitted
without any further permission from Dove Medical Press Limited, provided the work is properly
attributed. For permission for commercial use of this work, please see paragraphs 4.2 and 5 of our Terms.