Back to Journals » Nature and Science of Sleep » Volume 15
Phenotypic Interindividual Differences in the Dynamic Structure of Sleep in Healthy Young Adults
Authors Kishi A ![]() , Van Dongen HPA
, Van Dongen HPA ![]()
Received 2 October 2022
Accepted for publication 29 May 2023
Published 24 June 2023 Volume 2023:15 Pages 465—476
DOI https://doi.org/10.2147/NSS.S392038
Checked for plagiarism Yes
Review by Single anonymous peer review
Peer reviewer comments 4
Editor who approved publication: Prof. Dr. Ahmed BaHammam
Akifumi Kishi,1– 3 Hans PA Van Dongen4,5
1Graduate School of Education, The University of Tokyo, Tokyo, Japan; 2Graduate School of Medicine, The University of Tokyo, Tokyo, Japan; 3Japan Science and Technology Agency, PRESTO, Saitama, Japan; 4Sleep and Performance Research Center, Washington State University, Spokane, WA, USA; 5Department of Translational Medicine and Physiology, Washington State University, Spokane, WA, USA
Correspondence: Akifumi Kishi, Graduate School of Medicine, The University of Tokyo, 7-3-1 Hongo, Bunkyo-ku, Tokyo, 113-0033, Japan, Tel +81-3-5841-3415, Fax +81-3-5841-3418, Email [email protected]
Introduction: Evaluating the dynamic structure of sleep may yield new insights into the mechanisms underlying human sleep physiology.
Methods: We analyzed data from a 12-day, 11-night, strictly controlled laboratory study with an adaptation night, 3 iterations of a baseline night followed by a recovery night after 36 h of total sleep deprivation, and a final recovery night. All sleep opportunities were 12 h in duration (22:00– 10:00) and recorded with polysomnography (PSG). The PSG records were scored for the sleep stages: rapid eye movement (REM) sleep; non-REM (NREM) stage 1 sleep (S1), stage 2 sleep (S2), and slow wave sleep (SWS); and wake (W). Phenotypic interindividual differences were assessed using indices of dynamic sleep structure – specifically sleep stage transitions and sleep cycle characteristics – and intraclass correlation coefficients across nights.
Results: NREM/REM sleep cycles and sleep stage transitions exhibited substantial and stable interindividual differences that were robust across baseline and recovery nights, suggesting that mechanisms underlying the dynamic structure of sleep are phenotypic. In addition, the dynamics of sleep stage transitions were found to be associated with sleep cycle characteristics, with a significant relationship between the length of sleep cycles and the degree to which S2-to-W/S1 and S2-to-SWS transitions were in equilibrium.
Discussion: Our findings are consistent with a model for the underlying mechanisms that involves three subsystems – characterized by S2-to-W/S1, S2-to-SWS, and S2-to-REM transitions – with S2 playing a hub-like role. Furthermore, the balance between the two subsystems within NREM sleep (S2-to-W/S1 and S2-to-SWS) may serve as a basis for the dynamic regulation of sleep structure and may represent a novel target for interventions aiming to improve sleep.
Keywords: polysomnography, sleep stage transitions, NREM/REM sleep cycles, ultradian rhythm, sleep phenotype
Introduction
Sleep is a dynamic process,1 with the brain cycling through different sleep stages in a structured manner. Healthy human sleep displays systematic alternations between episodes of non-rapid eye movement (NREM) sleep and rapid eye movement (REM) sleep.2 The duration of this sleep cycle, or ultradian rhythm, is 90 to 100 min on average.3 Within each NREM sleep episode, there is usually a progression from lighter sleep (stage 1 [S1] and stage 2 [S2]) to deeper sleep (stage 3 and stage 4, or slow wave sleep [SWS]) and then back to lighter sleep.4 Moreover, the distribution of sleep stages within the sleep cycle changes across the night.5,6 SWS is most prominent during the first two or three sleep cycles of the night,7 whereas REM sleep is most prominent during the later sleep cycles of nighttime sleep.8 In healthy young adults, approximately 50% of sleep time presents as S2 sleep, which is distinct from SWS and REM sleep in terms of polysomnographic appearance,2,9 EEG synchronization (auto-correlation),10,11 and temporal regulation.12,13
These dynamics interact with the homeostatic and circadian processes of sleep/wake regulation, with NREM sleep controlled primarily by the homeostatic process7 and REM sleep under circadian and homeostatic control.14–16 Furthermore, there is homeostatic regulation between NREM and REM sleep within and across sleep cycles,17,18 which has been described in terms of reciprocal interaction.19 Further complexity in dynamic sleep structure has been revealed by analyses of the first sleep cycle20,21 and comparisons among chronotypes22 and age groups.23
Over the last two decades, detailed analyses of the transitions between sleep stages revealed dynamic mathematical and statistical patterns and yielded new insight into the mechanisms underlying human sleep physiology and pathophysiology.24–29 One recent study on sleep stage transitions found that three distinct “subsystems” may underlie the regulation of dynamic sleep structure,30 with S2 playing a hub-like role.25,26,30 These three subsystems are represented specifically by transitions from S2 to wake [W] or S1 (“S2-to-W/S1”), from S2 to SWS (“S2-to-SWS”), and from S2 to REM (“S2-to-REM”). They appear to be implicated in the regulation of sleep cycles,27,30 but additional research examining relationships among the different sleep stage transitions within and between individuals is needed to elucidate this further. Of particular interest is how the S2-to-W/S1 and S2-to-SWS subsystems for NREM sleep, and the balance between them, may influence the transition to REM (S2-to-REM).
A growing body of literature has documented profound differences between individuals in many aspects of sleep, which are commonly found to be highly phenotypic. This includes trait interindividual differences in sleep variables assessed with polysomnography (PSG)25,31–33 and systematic interindividual differences in sleep regulatory mechanisms.25,34–37 Phenotypic interindividual differences represent an additional source of information beyond what can be inferred from group means, which can be unlocked by dissociating between-subjects from within-subjects variance in the data. In the present study, we assessed phenotypic interindividual differences in sleep stage transitions and sleep cycles to help further elucidate the mechanisms underlying the dynamic regulation of sleep structure.
Methods
Subjects
Complete data were available from 17 healthy young adults (aged 28.6 ± 5.7 years; range: 22–40 years; 8 males, 9 females), of which 10 were studied at the University of Pennsylvania, and 7 at Washington State University using the same study design and protocol and the same inclusion and exclusion criteria. Sleep analyses from the 10 subjects studied at the University of Pennsylvania were published previously,33 but (with the exception of total sleep time) the data reported here are new.
Subjects were physically and psychologically healthy as assessed by physical examination, history, blood chemistry and urinalysis. They were deemed to be free of sleep disorders, as assessed with the Sleep Disorders Questionnaire,38 Pittsburgh Sleep Quality Index,39 Epworth Sleepiness Scale,40 Multivariate Apnea Risk Index,41 and review of baseline polysomnography. Subjects reported being good sleepers, neither extreme morning- nor extreme evening-type, and habitually sleeping between 7 h and 9 h per night and getting up between 06:30 and 08:30. Habitual sleep/wake pattern was verified by means of wrist actigraphy and sleep diary in the 7 days preceding the laboratory experiment. Subjects had no history of alcohol or drug abuse. They refrained from using drugs, alcohol, tobacco, and caffeine 7 days prior to and during the experiment and were not allowed to take any naps during this period. The study was conducted in accordance with the Declaration of Helsinki. The Institutional Review Boards of the University of Pennsylvania and Washington State University approved the study, and all subjects gave written informed consent.
Experimental Procedures
The laboratory experimental protocol is illustrated in Figure 1. Subjects spent 12 days, 11 nights consecutively in a strictly controlled laboratory setting. On the first day, subjects entered the laboratory in the afternoon and went to bed at 22:00 for a 12 h adaptation sleep period. At 10:00 the next morning, they were awakened and began a 12 h scheduled waking period. They went to bed again at 22:00 for a 12 h baseline sleep period. At 10:00 the next morning, subjects were awakened and began a 36 h period of total sleep deprivation. At 22:00, at the end of the 36 h sleep deprivation period, subjects went to bed for a 12 h recovery sleep opportunity. The sequence of 12 h wakefulness, 12 h baseline sleep, 36 h of total sleep deprivation, and 12 h recovery sleep was repeated three times. At 10:00 after the third recovery night, another 12 h period of scheduled wakefulness began. Subjects went to bed again at 22:00 for a final, 12 h predeparture sleep period. At 10:00, subjects were awakened and went home later that day.
 |
Figure 1 Schematic of the 12-day, 11-night, laboratory study protocol. After an adaptation night (A), subjects underwent 3 iterations (numbered dotted boxes) of a 12 h waking period (W), a baseline night (B), a 36 h period of total sleep deprivation (SD), and a recovery night (R), which was followed by a final 12 h waking period and a final predeparture recovery night (P). All eight sleep opportunities (gray) were PSG-recorded and involved 12 h time in bed (22:00–10:00). Tick marks are at 12 h intervals; extended tick marks indicate midnight. Figure adapted from Tucker et al (2007). |
Throughout the experiment, the conditions in the laboratory were carefully controlled in terms of environmental circumstances and scheduled activities.28 Ambient temperature was maintained at 21 ± 1 °C. Light exposure was fixed at <50 lux during scheduled wakefulness, and <1 lux (darkness) during scheduled sleep periods. Subjects were behaviorally monitored by trained staff members continuously. Cognitive performance was tested every 2 hours of scheduled wakefulness by means of a moderate workload (0.5 h) or high workload (1.0 h) version of a standardized neurobehavioral test battery;42 the high workload version was only administered during one of the three iterations of sleep deprivation (randomly assigned). Between test bouts, subjects were allowed only non-vigorous activities, such as watching movies, playing games, reading, and listening to music. They had no interactions with people outside the laboratory, including Internet, live television, phone calls, and visitors. Standardized meals were provided at 11:00, 15:00, and 19:00 each day, and also at 23:00, 03:00, and 07:00 during sleep deprivation. Food was controlled in terms of the recommended caloric intake and proportion of macronutrients (proteins, fats, and carbohydrates) for the person’s height, weight, age, and activity level (which was predominantly sedentary inside the laboratory). The amount of food subjects received during the 36 h sleep deprivation periods matched their normal 2-day caloric requirement. Caffeine intake was prohibited.
Polysomnography and Sleep Variables
The nocturnal PSG recordings were performed with digital equipment (University of Pennsylvania: Vitaport 3, TEMEC Instruments, Kerkrade, The Netherlands; Washington State University: Nihon Kohden, Foothill Ranch, CA, USA). Time in bed (TIB) was fixed at 12 h, starting at 22:00, for each of the eight nights recorded per subject. The following channels were recorded simultaneously at a sampling frequency of 128 Hz (University of Pennsylvania) or 200 Hz (Washington State University): four electroencephalogram (EEG) derivations, C3-Ax, C4-Ax, Fz-Ax and Oz-Ax (where Ax stands for bridged mastoids); two electrooculogram (EOG) derivations, LOC-Ax and ROC-Ax; chin electromyogram (EMG), submentalis; and electrocardiogram (ECG), modified lead II. After re-referencing to average reference, sleep stages were scored manually in 30s epochs by trained PSG technologists according to the original standard criteria for the investigation of sleep,2 and total sleep time (TST) was determined. Sleep stage transitions were tallied; movement time was lumped with wake for this purpose.43
To characterize sleep stage dynamics, for each PSG record the number of transitions from and to each of the stages W, REM, S1, S2, and SWS was determined, and the total number of transitions (#Transitions) was calculated. (Note that if a sleep stage was continued from one 30s epoch to the next, this was not counted as a transition and not further considered.) In addition, a sleep stage transition index (SSTI) was calculated as the average number of sleep stage transitions (of any kind) per hour of sleep (TST). To characterize sleep cycle dynamics, for each PSG record the number of completed NREM/REM sleep cycles (#Cycles) was determined according to the criteria of Feinberg and Floyd,6 where NREM sleep cycles were measured from any stage of NREM sleep onset. The mean and within-night standard deviation (SD) of the intervals between the onsets of consecutive REM episodes (REM-onset intervals) were assessed (M-ROI and SD-ROI, respectively).23 In line with previous work,43 intermittent wakefulness was not counted toward the REM-onset intervals.
Statistical Analyses
For investigations of interindividual differences, we used variance components analysis to separate between-subjects variance (systematic interindividual variability) from within-subjects variance (intraindividual variability or error variance). This analysis was implemented as a restricted maximum likelihood, mixed-effects analysis of variance (ANOVA) with night type (adaptation, baseline, recovery, and predeparture) and study location (Pennsylvania and Washington) as covariates, and a random effect over subjects on the intercept. Phenotypic interindividual variability was quantified with the intraclass correlation coefficient (ICC),44 calculated as the ratio of between-subjects variance over between- plus within-subjects variance, across all 8 nights. The 95% confidence interval (CI) for the ICC was calculated using exact method.45
The between-subjects standard deviation (SDbs) was calculated as the square root of the between-subjects variance. A 95% reference interval (RI) for systematic interindividual variability was estimated by multiplying the SDbs with 3.92 (representing 1.96 times the SD on both sides of the mean to capture the 95% range between the 2.5th and 97.5th percentiles). The variance components analysis was repeated with age and gender as additional covariates to examine the effect of these demographics on interindividual variability. In addition, the same analysis was repeated with covariates controlling for sleep deprivation iteration (see Figure 1) and for the recovery night that followed cognitive testing on the high workload neurobehavioral test battery.
We used paired t-tests to compare descriptive statistics for sleep stage transitions and sleep cycle characteristics between baseline and recovery nights. Only transitions that occurred on average at least 3 times per night (see Table 1) were included in this analysis and in follow-on analyses such as ICC assessment.
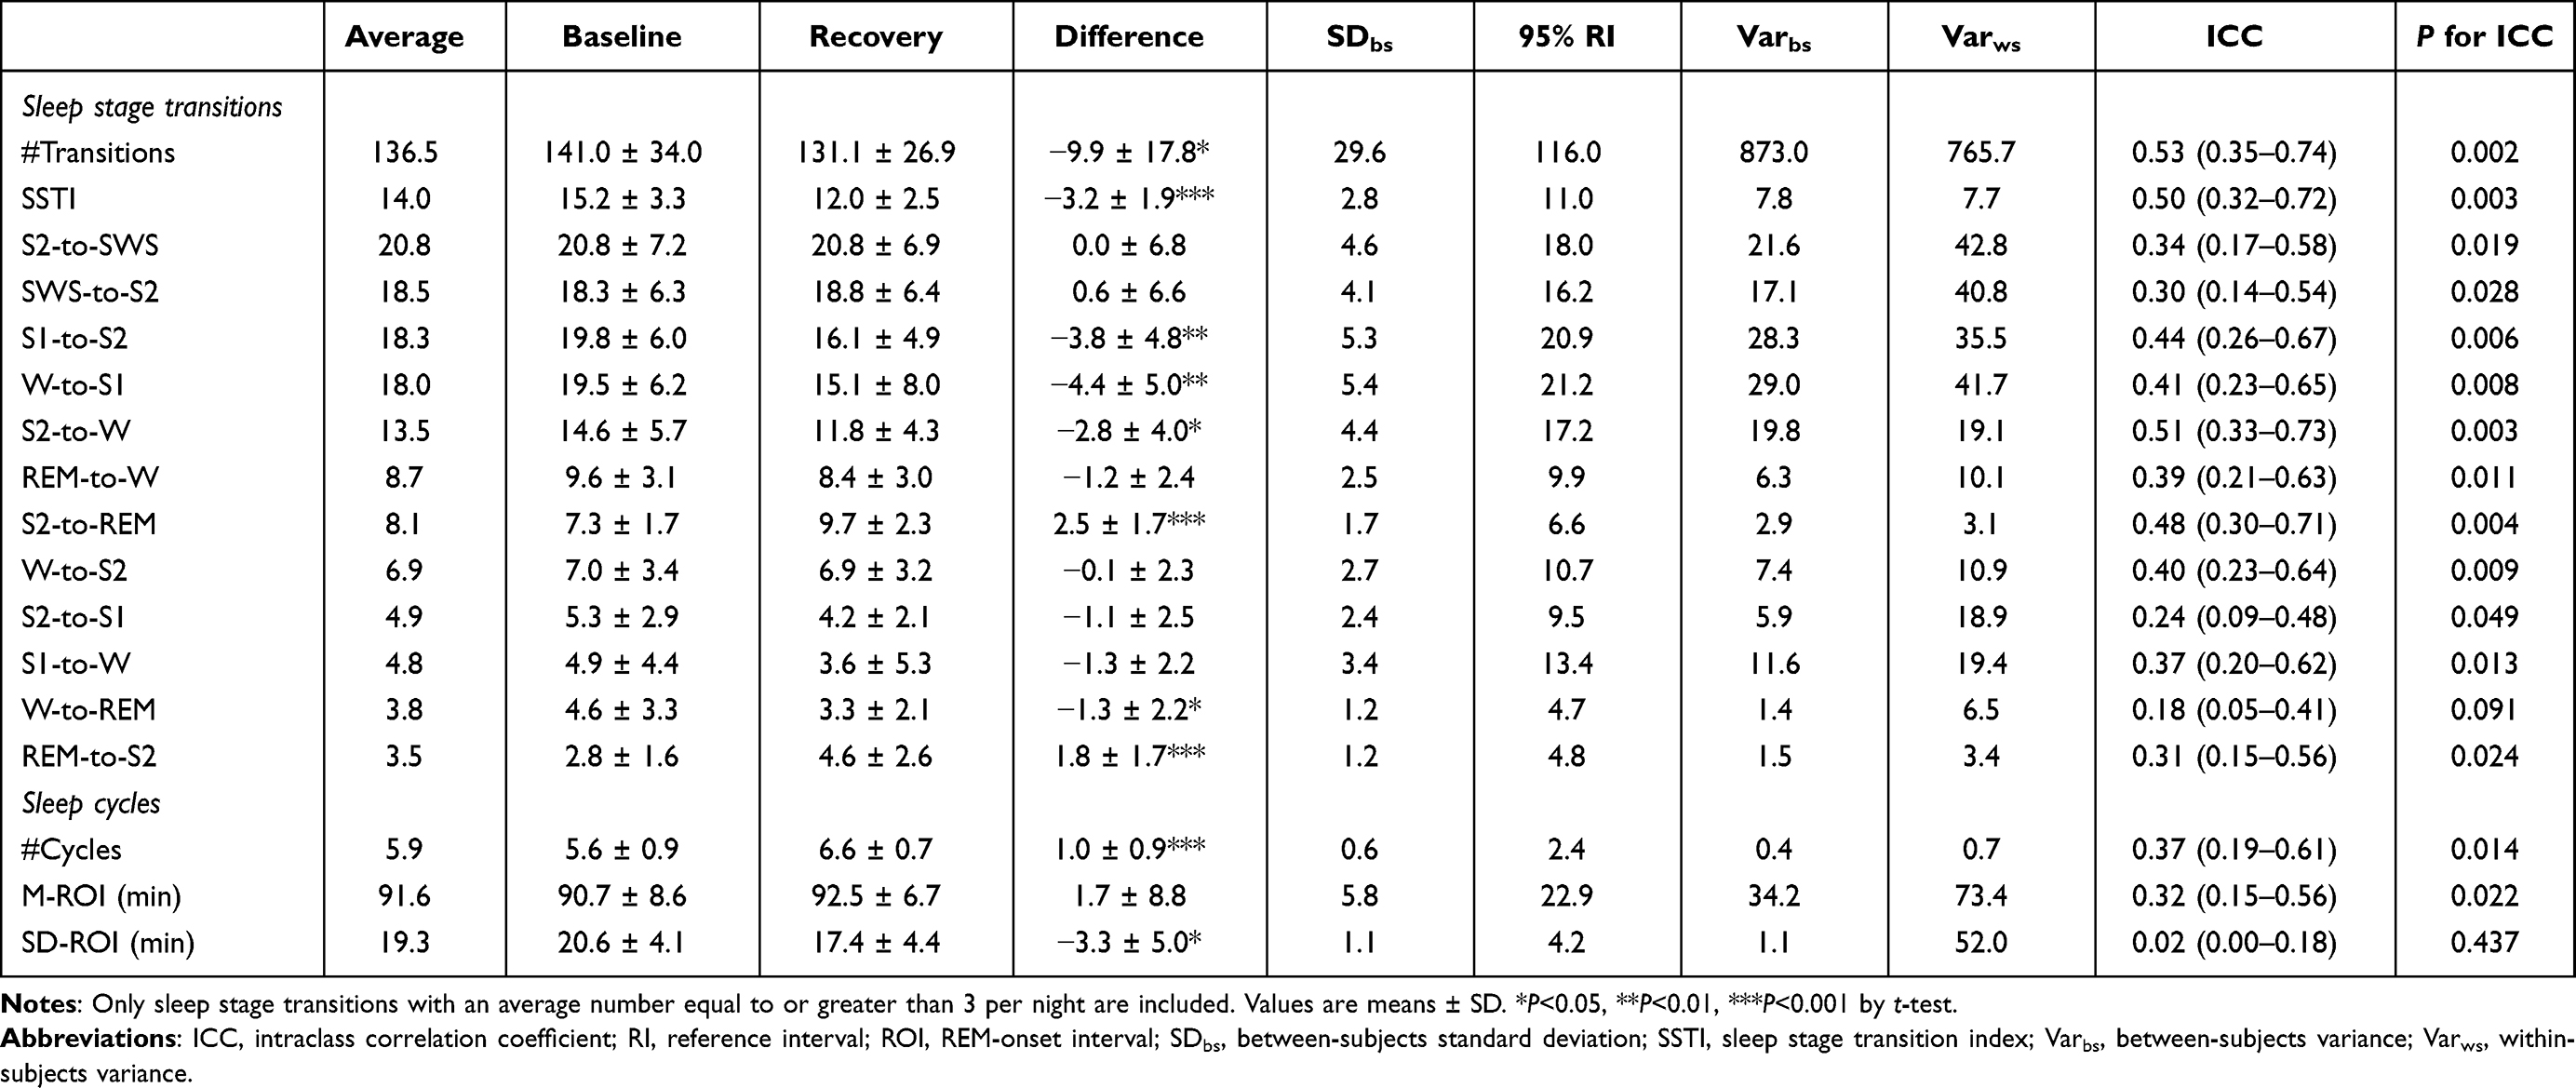 |
Table 1 Sleep Stage Transitions and Sleep Cycle Characteristics at Baseline and During Recovery Sleep After 36 h of Total Sleep Deprivation, Interindividual Variabilities, Between- and Within-Subjects Variance Components, and Intraclass Correlation Coefficients, for 17 Healthy Young Adults |
To investigate associations between sleep stage transitions and sleep cycles, an NREM transition balance index for S2-to-W/S1 versus S2-to-SWS transitions was calculated for each PSG record as:
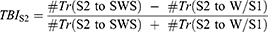
where #Tr indicates number of transitions, and W/S1 denotes W or S1. A positive value of TBIS2 indicates a greater tendency to transition from S2 to SWS than to W or S1; a negative value indicates the opposite; and a value of zero indicates balance between these transitions. The absolute magnitude of TBIS2, |TBIS2|, was used as a measure of the degree of deviation from balance. A Kolmogorov–Smirnov test for normality was used to test for deviation of the TBIS2 values from a normal distribution with a mean of zero across all PSG records.
The within-subjects correlation coefficient rws, controlling for subjects in a partial correlation analysis, was used to investigate within-subjects relationships between M-ROI and TBIS2 or |TBIS2|. The between-subjects correlation coefficient rbs, controlling for age and gender, was used to investigate between-subjects relationships between M-ROI and TBIS2 or |TBIS2|, each averaged across the 8 nights within each subject.
Results
Total Sleep Time
TST in the 12 h baseline nights was 555.8 ± 59.7 min (mean ± SD), which increased significantly in the 12 h recovery nights (t16 = 11.66, P < 0.001) to 658.7 ± 35.8 min. TST in the adaptation and predeparture nights were 599.3 ± 66.1 min and 504.0 ± 98.4 min, respectively. The ICC for TST was 0.44 (95% CI: 0.26–0.67) and statistically significant (P = 0.007). These results are nearly identical to the earlier findings of Tucker et al.28
Sleep Stage Transitions
Descriptive statistics and interindividual differences results for sleep stage transitions are shown in Table 1. ICCs for sleep stage transitions were generally fair to moderate and statistically significant (P < 0.05). The ICC for the W-to-REM transition stood out as poor (< 0.2) and not statistically significant (P = 0.091); however, this is an unusual transition frequently seen in patients with narcolepsy (and rarely seen in healthy young adults).46
A significant effect of 36 h of total sleep deprivation was observed for #Transitions, SSTI, and nearly half of the sleep stage transitions analyzed (Table 1). Specifically, in the recovery night after sleep deprivation, as compared to baseline, the frequencies of transitions S1-to-S2, W-to-S1, S2-to-W, W-to-REM as well as #Transitions and SSTI were significantly decreased, while transitions S2-to-REM and REM-to-S2 were significantly increased (P < 0.05). However, the magnitude of the phenotypic interindividual differences consistently exceeded the group-average magnitude of the effect of 36 h of total sleep deprivation on the number of sleep stage transitions (Table 1 and Figure 2).
 |
Figure 2 Magnitude of the phenotypic interindividual differences versus that of the response to 36 h of total sleep deprivation for sleep stage transition and sleep cycles variables with significant sleep deprivation effects. The gray bars indicate the group-average effect of sleep deprivation (ie, the absolute difference between recovery sleep and baseline sleep). The black bars indicate the span of systematic interindividual differences across the eight nights (ie, 95% reference interval of between-subjects variability). Error bars represent standard errors. |
Repeating the analyses with age and gender as covariates, neither was found to contribute significantly to interindividual differences in sleep stage transitions, except for transitions from S2-to-REM, where gender was found to contribute significantly to interindividual differences. Controlling for night type, study location, and age, women on average displayed 2.45 ± 0.75 (mean ± standard error) more S2-to-REM transitions than men (t13 = 3.26, P = 0.006).
Repeating the analyses controlling for sleep deprivation iteration yielded significant order effects for #Transitions, SSTI, and transitions from W-to-S1, W-to-S2, S1-to-W, S1-to-S2, S2-to-W, but controlling for these order effects yielded no substantive changes to the ICC results. No significant effects of high workload during neurobehavioral testing on subsequent sleep outcomes were observed.
Sleep Cycles
Descriptive statistics and interindividual differences results for sleep cycle variables, #Cycles, M-ROI, and SD-ROI, are shown in Table 1. ICCs for #Cycles and M-ROI were fair (0.37 and 0.32, respectively) and statistically significant (P = 0.014 and P = 0.022, respectively). The ICC for SD-ROI was poor (0.02) and not statistically significant (P = 0.256).
There was a significant effect of 36 h of total sleep deprivation for #Cycles and SD-ROI, but not for M-ROI. In the recovery night after 36 h of sleep deprivation, #Cycles was significantly increased compared to baseline nights (t16 = 4.41, P < 0.001), while SD-ROI was significantly decreased (t16 = 2.67, P = 0.017). The magnitude of the phenotypic interindividual differences consistently exceeded the magnitude of the group-average effect of 36 h of total sleep deprivation (Table 1 and Figure 2).
Repeating the analyses with age and gender as covariates, neither was found to contribute significantly to interindividual differences in the sleep cycle indices. In addition, when repeating the analyses controlling for sleep deprivation iteration, significant order effects were observed for #Cycles, but controlling for the order effects did not materially affect the main results. No significant effects of high workload during neurobehavioral testing on sleep cycle variables were observed.
Associations Between Sleep Stage Transitions and Sleep Cycles
The distribution of TBIS2 is shown in Figure 3. The mean (± SD) of TBIS2 was 0.074 (± 0.26). The distribution of TBIS2 was not significantly different from a normal distribution with a mean of zero (D = 0.038, P = 0.98), indicating that on the whole, the two transition subsystems (S2-to-W/S1 and S2-to-SWS) were in balance.
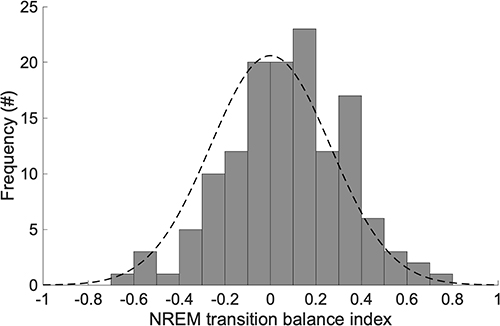 |
Figure 3 Distribution of NREM transition balance index, TBIS2. Frequencies are shown for pooled dataset (8 recorded nights for 17 subjects each = 136 records). Positive values indicate greater tendency to transition from S2 to SWS than to W or S1; negative values indicate the opposite; and a value of zero indicates balance between these transitions. The black dashed line denotes a normal distribution with mean of zero. |
Within subjects, there was a significant positive correlation between |TBIS2| and M-ROI (rws = 0.22, P = 0.017), whereas there was no significant correlation between TBIS2 and M-ROI (rws = –0.02, P = 0.81). Between subjects, controlling for age and gender, there were no significant correlations between M-ROI and TBIS2 (rbs = −0.35, P = 0.21) or |TBIS2| (rbs = −0.42, P = 0.12). These results indicate a within-subjects relationship of deviation from balance between S2-to-W/S1 and S2-to-SWS transitions versus the duration of the sleep cycle. This relationship cannot be attributed to an associated change in the overall number of NREM-based transitions from S2, as the within-subjects correlation between |TBIS2| and the sum of the S2-to-W/S1 and S2-to-SWS transitions was not significant (rws = 0.04, P = 0.67).
Discussion
In this paper, we made use of a unique data set from a carefully controlled laboratory study specifically designed to investigate phenotypic sleep differences, with multiple sleep recordings under baseline conditions and after exposure to 36 h of total sleep deprivation (Figure 1) allowing us to assess whether interindividual differences in sleep characteristics are substantial, stable, and robust. We found that sleep stage transitions and sleep cycles exhibited significantly stable and robust interindividual differences across baseline and recovery nights, suggesting that mechanisms underlying the dynamic structure of sleep are considerably phenotypic. We also found that sleep stage transition dynamics were associated with sleep cycle characteristics; specifically, the degree of deviation from balance between S2-to-W/S1 and S2-to-SWS transitions (|TBIS2|) was significantly associated with the length of REM-onset intervals within individuals across nights. These results provide novel insights into the mechanisms underlying the dynamic regulation of sleep structure.
Phenotypic Interindividual Differences in Dynamic Sleep Structure
Our findings of phenotypic interindividual differences in sleep stage transitions and sleep cycles (Table 1) extend our earlier findings of trait interindividual differences in the static characteristics of sleep architecture33 to aspects of the dynamic structure of sleep. Although the static and dynamic aspects of sleep are of course related, they are distinct and may have dissociable regulatory underpinnings, as illustrated for example by the reduced number of sleep stage transitions after sleep deprivation (see Table 1) despite increased recovery sleep duration. Our results indicate that dynamic sleep structure does indeed have its own regulatory mechanisms. The processes involved may be mediated by previously documented, structural differences in the brain47 and could be, at least in part, genetically determined.48
Our results pertaining to phenotypic interindividual differences in sleep cycles (ie, length of REM-onset intervals) are consistent with earlier reports of variability in this ultradian sleep rhythm.5,6,23,33,49 In particular, while the length of the sleep cycle has been anecdotally described as “90 minutes”, in reality it varies widely within and between individuals from 70 min to 150 min.6,23 It is noteworthy that the ICC for SD-ROI – that is, the systematic between-subjects variability in the within-night variation of the REM-onset interval – was low and not significant, even though the ICC for M-ROI – that is, the systematic between-subjects variability in the within-night mean of the REM-onset interval – was significant. These findings indicate that variability between individuals in the basal length of sleep cycles is phenotypic, while the degree of night-to-night variability is not or to a much lesser extent.
It is an intriguing observation that the magnitude of the phenotypic interindividual differences in dynamic sleep structure was consistently much larger than the group-average magnitude of the effect of 36 h of total sleep deprivation, as has been reported for other aspects of sleep architecture including sleep duration, sleep stages, and delta power in the NREM sleep EEG.33 Phenotypic interindividual differences thus dominated the attributable variance in this study, which raises important questions about their functional significance that have yet to be addressed.
Effects of Total Sleep Deprivation on the Dynamic Sleep Structure
Despite the expected increase in sleep duration after total sleep deprivation compared to baseline, the number of sleep stage transitions was reduced, suggesting that recovery sleep was more dynamically stable than baseline sleep. The increased sleep pressure produced by total sleep deprivation specifically reduced transitions between wake and light sleep stages (eg, W-to-S1, S1-to-S2, and S2-to-W), while transitions concerning deep sleep (eg, S2-to-SWS) were not significantly altered, similar to previous observations.50 The 36 h period of total sleep deprivation also caused an increase in transitions between S2 and REM, which appears to be a by-product of the lengthening of total sleep duration and the concomitant increase in the propensity for REM sleep.
While sleep deprivation did not significantly alter the mean of the REM-onset interval (M-ROI) within individuals, the variability (SD-ROI) was decreased in the recovery nights. The latter result could be parsimoniously explained by the fact that there is greater robustness in NREM sleep expression by increased homeostatic sleep pressure after sleep deprivation.7 However, with M-ROI unchanged, we should consider the possibility that prior sleep deprivation also has a stabilizing effect on the timing of REM sleep. This idea is consistent with a previous result from this data set, namely that REM latency was not significantly affected by sleep deprivation.33 The stability of M-ROI in response to acute total sleep deprivation may reflect an increase in REM sleep homeostatic drive balancing the increased NREM homeostatic drive and keeping the sleep cycle regulated. Whereas results of acute total sleep deprivation experiments have suggested that NREM sleep regulation has (short-term) primacy over REM sleep regulation,7 it appears that there is also a physiological imperative to regulate the sleep cycle as a whole.17,20,27
The Relationship Between NREM Sleep Stage Transitions and the Sleep Cycle
In light of the seemingly high degree of complexity in the regulation of sleep stages and REM sleep in particular,1,17,18,51 we and others have posited that three distinct subsystems, characterized by S2-to-W/S1, S2-to-SWS, and S2-to-REM transitions, may underlie the regulation of dynamic sleep structure and the emergence of sleep cycles.25–27,30 A summary diagram illustrating the three underlying subsystems and the transition dynamics, with information about transition frequencies and their degree of interindividual variability, is presented in Figure 4. Setting aside back-and-forth transitions between REM and W, which are mostly contained within REM episodes30 and probably associated with arousals,2 S2-to-REM transitions are the primary gateway into REM sleep.
 |
Figure 4 Transition diagram illustrating the three posited underlying subsystems with major patterns of transition between sleep stages. Arrows indicate the direction of transitions; the thickness of the arrows indicates their overall number, and the darkness (from light gray to black) the degree of interindividual variability (ie, the ICC). Note that transitions between wake and REM are regarded as separate from the three subsystems centered on S2 because those transitions are mostly contained within REM episodes (REM-to-W-to-REM). |
Thus, as posited previously, it appears that S2 plays a hub-like role in the dynamic regulation of sleep structure.25,26,30 Accordingly, the balance between S2-to-W/S1 and S2-to-SWS transitions should have a marked influence on transitions into REM and the timing of the ROI. We therefore introduced TBIS2 as an index of the NREM balance between S2-to-W/S1 versus S2-to-SWS transitions. The distribution of TBIS2 did not differ significantly from the normal distribution with a mean of zero (Figure 3), suggesting that on the whole, the two transition subsystems within NREM sleep (S2-to-W/S1 and S2-to-SWS) were balanced. Deviations from this equilibrium, quantified by TBIS2 or |TBIS2|, should affect REM-onset intervals. Specifically, an increase in S2-to-SWS transitions relative to S2-to-W/S1 transitions could be expected to prolong REM-onset intervals, as has been noted in previous experimental and computational studies.27,30 Given the observed phenotypic interindividual differences in sleep stage transitions and the ultradian rhythm of sleep, we examined this both within and between subjects.
Our finding of a positive correlation within subjects between |TBIS2| and M-ROI, but not between TBIS2 and M-ROI and not between |TBIS2| and the number of transitions from S2 to another NREM sleep stage overall, indicates that imbalance in either direction – that is, a relative increase in either S2-to-SWS or S2-to-W/S1 transitions (ie, greater |TBIS2|), not just a relative increase in S2-to-SWS transitions – is associated with prolongation of the REM-onset interval (ie, greater M-ROI). We found this relationship regardless of interindividual differences in the dynamic sleep structure. As such, it appears that an increase in the transitions from S2 to other stages within NREM sleep, relative to an individuals’ phenotypic basal equilibrium state, contributes to prolongation of the REM-onset interval – regardless of whether the sleep transitions made NREM sleep deeper or lighter. This is consistent with the idea that the balance between the two subsystems within NREM sleep (S2-to-W/S1 and S2-to-SWS) is at the basis of the dynamic regulation of sleep structure.
Experiments in humans with administration of cholinergic antagonists and agonists52 have shown a link between the major cholinergic and monoaminergic pathways of sleep regulation53 and sleep cycle dynamics. The neurophysiological bases for the three subsystems (Figure 4) may therefore involve mechanisms active at multiple different time scales, potentially including the neurobiology associated with the wake/sleep flip-flop switch,53 the previously established NREM–REM reciprocal interaction mechanisms,19,54 and possibly even subultradian S2–SWS oscillations.27 These have in common a presumed basis in monoaminergic transmission, which could be a critical mediator of balance among the subsystems. There is also a potential role for the lateral hypothalamus (LH), which is thought to modulate transitions to either wake or REM sleep, while monitoring multiple physiological variables including circadian time, ambient temperature, energy status, and sleep pressure.55 In the LH of mice, melanin-concentrating hormone and hypocretin neurons have been found to interact through reciprocal inhibition, which could serve as a dynamic regulator of the transition system around stage S2.56 Further studies are needed to uncover the neurobiological mechanisms that underlie the regulation of subsystem balance around S2 in humans.
Limitations
Interindividual variability in sleep has both continuous aspects, such as the depth of NREM sleep as quantifiable by means of spectral power in the EEG,33,57,58 and discrete aspects, such as the occurrence of sleep spindles.59–61 Our analyses were based on sleep scoring using conventional criteria,2 combining continuous phenomena (eg, EEG frequency dominance, amount of EMG activity) with discrete ones (eg, presence of rapid eye movements, sleep spindles) to categorize sleep in terms of discrete stages in 30s intervals (epochs). While the subsystems proposed here based on sleep stage transitions are clearly distinguishable in a discrete sense, our analyses did not consider any continuous characteristics that could be relevant, such as the depth of SWS. There is likely to be additional complexity to the dynamic regulation of sleep structure that our analyses did not uncover, including the influence of different aspects of the sleeping environment (eg, temperature, noise). Also, due to the small number of sleep stage transitions within any given sleep cycle, it was not possible to perform cycle-by-cycle analyses, leaving within-night trends in sleep structure dynamics unexplored.
Another limitation of our study is related to its experimental design, which was highly controlled and involved both rested and sleep deprived conditions, but was restricted to just one duration of total sleep deprivation (ie, 36 hours) and featured only nighttime sleep. Extending this work to daytime sleep would help to elucidate the role of circadian rhythmicity in interindividual differences in sleep cycle duration and subsystem balance. Also, since our dataset included only healthy young adults, further studies will be needed to evaluate the generalizability of our findings across the lifespan, in various populations, and in the context of sleep disorders and other medical conditions. Extension of the research to individuals with sleep disorders and/or brain damage could serve to further interrogate the underlying mechanisms.
Conclusion
In our sample of healthy young adults, the dynamic structure of sleep in terms of sleep stage transitions and sleep cycles exhibited substantial and stable interindividual differences that were robust across baseline and sleep deprived states. This indicates that the mechanisms underlying sleep stage transitions and ultradian sleep cycles may be considerably phenotypic. This variability between individuals notwithstanding, our analyses point to a dynamic model involving three subsystems, characterized by S2-to-W/S1, S2-to-SWS, and S2-to-REM transitions, with S2 serving as a transition hub (Figure 4). In this perspective, the balance between transitions from S2 to lighter NREM sleep versus from S2 to deeper NREM sleep could be seen as a basis of dynamic sleep regulation, with deviation from equilibrium potentially explaining the variability in REM sleep relative to an individual’s phenotypic basal sleep cycle. These novel findings suggest that a predominantly SWS-versus-REM focused perspective on sleep, which appears to be dominant in parts of the sleep literature such as those concerned with cognitive recuperation and memory consolidation, may overlook the potentially unique role of S2; and that adopting a holistic view may shed new light on the dynamic regulation of sleep structure in humans, the underlying neurobiology, and the associated function(s) of sleep.
The substantial, fingerprint-like interindividual differences in the dynamic sleep structure unveiled in this study may also prove to be informative regarding the neurobiology of dynamic sleep regulation and interindividual variability therein, which is only partially understood.39 They may as well be useful in practical ways, for example, to drive progress in the development of algorithms for automated sleep scoring.62 Moreover, unraveling the mechanisms of dynamic sleep regulation with a focus on underlying subsystems and interindividual differences may set the stage for novel therapeutic sleep manipulations. Current efforts aimed at improving sleep, including both pharmacological interventions and brain stimulation techniques, are focused primarily on SWS and REM sleep.63,64 Based on our conceptual model of sleep stage transitions (Figure 4), we are currently working on a subject-specific brain stimulation method to manipulate wake-to-sleep transitions through the S2-to-W/S1 transition subsystem. Success in this endeavor would expose a novel target for interventions aiming to improve sleep.
Data Sharing Statement
The data that support the findings of this study are available from the authors upon reasonable request.
Funding
This work was partly supported by JSPS KAKENHI grants 15K16416 and 18K17891 and JST PRESTO grant JPMJPR19J3 to A.K., and by NIH grant R01HL70154 and ARO MURI grant W911NF2210223 to H.P.A.V.D.
Disclosure
Professor Hans PA Van Dongen reports personal fees from Jazz Pharmaceuticals, personal fees from Eisai Inc., grants from Federal Express Corporation, and grants from Trackthatsleep, outside the submitted work. The authors report no other conflicts of interest in this work.
References
1. Olbrich E, Claussen JC, Achermann P. The multiple time scales of sleep dynamics as a challenge for modelling the sleeping brain. Phil Trans R Soc A. 2011;369:3884–3901. doi:10.1098/rsta.2011.0082
2. Rechtschaffen A, Kales A. A Manual of Standardized Terminology, Techniques and Scoring System for Sleep Stages of Human Subjects. Washington, DC: US Government Printing Office; 1968.
3. Dement W, Kleitman N. Cyclic variations in EEG during sleep and their relation to eye movements, body motility, and dreaming. Electroencephalogr Clin Neurophysiol. 1957;9:673–690. doi:10.1016/0013-4694(57)90088-3
4. Merica H, Gaillard JM. Internal structure of sleep cycles in a healthy population. Sleep. 1986;9:502–513. doi:10.1093/sleep/9.4.502
5. Březinová V. Sleep cycle content and sleep cycle duration. Electroencephalogr Clin Neurophysiol. 1974;36:275–282. doi:10.1016/0013-4694(74)90169-2
6. Feinberg I, Floyd TC. Systematic trends across the night in human sleep cycles. Psychophysiology. 1979;16:283–291. doi:10.1111/j.1469-8986.1979.tb02991.x
7. Dijk DJ. Regulation and functional correlates of slow wave sleep. J Clin Sleep Med. 2009;5:S6–S15. doi:10.5664/jcsm.5.2S.S6
8. Czeisler CA, Zimmerman JC, Ronda JM, Moore-Ede MC, Weitzman ED. Timing of REM sleep is coupled to the circadian rhythm of body temperature in man. Sleep. 1980;2:329–346. doi:10.1093/sleep/2.3.329
9. Brandenberger G, Ehrhart J, Buchheit M. Sleep stage 2: an electroencephalographic, autonomic, and hormonal duality. Sleep. 2005;28:1535–1540. doi:10.1093/sleep/28.12.1535
10. Van Dongen HPA, Kerkhof GA, Klöppel HB. Seasonal covariation of the circadian phases of rectal temperature and slow wave sleep onset. J Sleep Res. 1997;6:19–25. doi:10.1046/j.1365-2869.1997.00021.x
11. Ueda K, Nittono H, Hayashi M, Hori T. Spatiotemporal changes of slow wave activities before and after 14 Hz/12 Hz sleep spindles during stage 2 sleep. Psychiatry Clin Neurosci. 2001;55:183–184. doi:10.1046/j.1440-1819.2001.00817.x
12. Curcio G, Ferrara M, Pellicciari MC, Cristiani R, De Gennaro L. Effect of total sleep deprivation on the landmarks of stage 2 sleep. Clin Neurophysiol. 2003;114:2279–2285. doi:10.1016/S1388-2457(03)00276-1
13. Van Dongen HPA, Maislin G, Mullington JM, Dinges DF. The cumulative cost of additional wakefulness: dose-response effects on neurobehavioral functions and sleep physiology from chronic sleep restriction and total sleep deprivation. Sleep. 2003;26:117–126. doi:10.1093/sleep/26.2.117
14. Zulley J. Distribution of REM sleep in entrained 24 hour and free-running sleep-wake cycles. Sleep. 1980;2:377–389. doi:10.1093/sleep/2.4.377
15. Dijk DJ, Czeisler CA. Contribution of the circadian pacemaker and the sleep homeostat to sleep propensity, sleep structure, electroencephalographic slow waves, and sleep spindle activity in humans. J Neurosci. 1995;15:3526–3538. doi:10.1523/JNEUROSCI.15-05-03526.1995
16. Park SH, Weber F. Neural and homeostatic regulation of REM sleep. Front Psychol. 2020;11:1662. doi:10.3389/fpsyg.2020.01662
17. Benington JH, Heller HC. REM-sleep timing is controlled homeostatically by accumulation of REM-sleep propensity in non-REM sleep. Am J Physiol. 1994;266:R1992–R2000. doi:10.1152/ajpregu.1994.266.6.R1992
18. Le Bon O, Staner L, Hoffmann G, Kentos M, Pelc I, Linkowski P. Shorter REM latency associated with more sleep cycles of a shorter duration in healthy humans. Psychiat Res. 2001;104:75–83. doi:10.1016/S0165-1781(01)00295-5
19. McCarley RW, Massaquoi SG. A limit cycle mathematical model of the REM sleep oscillator system. Am J Physiol. 1986;251:R1011–R1029. doi:10.1152/ajpregu.1986.251.6.R1011
20. Gillberg M, Åkerstedt T. The dynamics of the first sleep cycle. Sleep. 1991;14:147–154.
21. Feinberg I, Maloney T, March JD. Precise conservation of NREM period 1 (NREMP1) delta across naps and nocturnal sleep: implications for REM latency and NREM/REM alternation. Sleep. 1992;15:400–403. doi:10.1093/sleep/15.5.400
22. Kerkhof GA, Lancel M. EEG slow wave activity, REM sleep, and rectal temperature during night and day sleep in morning-type and evening-type subjects. Psychophysiology. 1991;28:678–688. doi:10.1111/j.1469-8986.1991.tb01014.x
23. Feinberg I. Changes in sleep cycle patterns with age. J Psychiat Res. 1974;10:283–306. doi:10.1016/0022-3956(74)90011-9
24. Lo CC, Chou T, Penzel T, et al. Common scale-invariant patterns of sleep-wake transitions across mammalian species. Proc Natl Acad Sci U S A. 2004;101:17545–17548. doi:10.1073/pnas.0408242101
25. Merica H, Fortune RD. State transitions between wake and sleep, and within the ultradian cycle, with focus on the link to neuronal activity. Sleep Med Rev. 2004;8:473–485. doi:10.1016/j.smrv.2004.06.006
26. Kishi A, Struzik ZR, Natelson BH, Togo F, Yamamoto Y. Dynamics of sleep stage transitions in healthy humans and patients with chronic fatigue syndrome. Am J Physiol Regul Integr Comp Physiol. 2008;294:R1980–1987. doi:10.1152/ajpregu.00925.2007
27. Kishi A, Yasuda H, Matsumoto T, et al. NREM sleep stage transitions control ultradian REM sleep rhythm. Sleep. 2011;34:1423–1432. doi:10.5665/SLEEP.1292
28. Klerman EB, Wang W, Duffy JF, Dijk DJ, Czeisler CA, Kronauer RE. Survival analysis indicates that age-related decline in sleep continuity occurs exclusively during NREM sleep. Neurobiol Aging. 2013;34:309–318. doi:10.1016/j.neurobiolaging.2012.05.018
29. Kishi A, Haraki S, Toyota R, et al. Sleep stage dynamics in young patients with sleep bruxism. Sleep. 2020;43:1–12. doi:10.1093/sleep/zsz202
30. Kishi A, Yamaguchi I, Togo F, Yamamoto Y. Markov modeling of sleep stage transitions and ultradian REM sleep rhythm. Physiol Meas. 2018;39:084005. doi:10.1088/1361-6579/aad900
31. Webb WB, Campbell SS. Relationships in sleep characteristics of identical and fraternal twins. Arch Gen Psychiatry. 1983;40:1093–1095. doi:10.1001/archpsyc.1983.01790090055008
32. Linkowski P. EEG sleep patterns in twins. J Sleep Res. 1999;8:11–13. doi:10.1046/j.1365-2869.1999.00002.x
33. Tucker AM, Dinges DF, Van Dongen HPA. Trait interindividual differences in the sleep physiology of healthy young adults. J Sleep Res. 2007;16:170–180. doi:10.1111/j.1365-2869.2007.00594.x
34. Aeschbach D, Cajochen C, Landolt H, Borbély AA. Homeostatic sleep regulation in habitual short sleepers and long sleepers. Am J Physiol Regul Integr Comp Physiol. 1996;270:41–53. doi:10.1152/ajpregu.1996.270.1.R41
35. Klerman EB, Dijk DJ. Individual variation in sleep duration and its association with sleep debt in young adults. Sleep. 2005;28:1253–1259. doi:10.1093/sleep/28.10.1253
36. Kishi A, Van Dongen HPA, Natelson BH, et al. Sleep continuity is positively correlated with sleep duration in laboratory nighttime sleep recordings. PLoS One. 2017;12:1–19. doi:10.1371/journal.pone.0175504
37. Rusterholz T, Tarokh L, Van Dongen HPA, Achermann P. Interindividual differences in the dynamics of the homeostatic process are trait-like and distinct for sleep versus wakefulness. J Sleep Res. 2017;26:171–178. doi:10.1111/jsr.12483
38. Douglass AB, Bornstein R, Nino-Murcia G, et al. The sleep disorders questionnaire I: creation and multivariate structure of SDQ. Sleep. 1994;17:160–167. doi:10.1093/sleep/17.2.160
39. Buysse DJ, Reynolds CF, Monk TH, Berman SR, Kupfer DJ. The Pittsburgh Sleep Quality Index: a new instrument for psychiatric practice and research. Psychiatry Res. 1989;28:193–213. doi:10.1016/0165-1781(89)90047-4
40. Johns MW. A new method for measuring daytime sleepiness: the Epworth sleepiness scale. Sleep. 1991;14:540–545. doi:10.1093/sleep/14.6.540
41. Maislin G, Pack AI, Kribbs NB, et al. A survey screen for prediction of apnea. Sleep. 1995;18:158–166. doi:10.1093/sleep/18.3.158
42. Van Dongen HPA, Baynard MD, Maislin G, Dinges DF. Systematic interindividual differences in neurobehavioral impairment from sleep loss: evidence of trait-like differential vulnerability. Sleep. 2004;27:423–433.
43. Moses J, Lubin A, Johnson LC, Naitoh P. Rapid eye movement cycle is a sleep-dependent rhythm. Nature. 1977;265:360–361. doi:10.1038/265360a0
44. Van Dongen HPA, Maislin G, Dinges DF. Dealing with inter-individual differences in the temporal dynamics of fatigue and performance: importance and techniques. Aviat Space Environ Med. 2004;75:A147–A154.
45. Rao PS. Variance Components Estimation. Mixed Models, Methodologies and Applications. London: Chapman and Hall; 1997.
46. Sakurai T. The neural circuit of orexin (hypocretin): maintaining sleep and wakefulness. Nat Rev Neurosci. 2007;8:171–181. doi:10.1038/nrn2092
47. Piantoni G, Poil SS, Linkenkaer-Hansen K, et al. Individual differences in white matter diffusion affect sleep oscillations. J Neurosci. 2013;33:227–233. doi:10.1523/JNEUROSCI.2030-12.2013
48. De Gennaro L, Marzano C, Fratello F, et al. The electroencephalographic fingerprint of sleep is genetically determined: a twin study. Ann Neurol. 2008;64:455–460. doi:10.1002/ana.21434
49. Blaauw MSJ, Tung LT, Baynard MD, Dinges DF, Van Dongen HPA. Trait-like inter-individual differences in sleep cycle duration. Sleep-Wake Res. 2002;13:16–19.
50. Kishi A, Togo F, Cook DB, et al. The effects of exercise on dynamic sleep morphology in healthy controls and patients with chronic fatigue syndrome. Physiol Rep. 2013;1:e00152. doi:10.1002/phy2.152
51. Le Bon O. An asymmetrical hypothesis for the NREM-REM sleep alternation—What is the NREM-REM cycle? Front Neurosci. 2021;15:627193. doi:10.3389/fnins.2021.627193
52. Sitaram N, Moore AM, Gillin JC. Experimental acceleration and slowing of REM sleep ultradian rhythm by cholinergic agonist and antagonist. Nature. 1978;274:490–492. doi:10.1038/274490a0
53. Saper CB, Chou TC, Scammell TE. The sleep switch: hypothalamic control of sleep and wakefulness. Trends Neurosci. 2001;24:726–731. doi:10.1016/S0166-2236(00)02002-6
54. Lu J, Sherman D, Devor M, Saper CB. A putative flip-flop switch for control of REM sleep. Nature. 2006;441:589–594. doi:10.1038/nature04767
55. Latifi B, Adamantidis A, Bassetti C, Schmidt MH. Sleep-wake cycling and energy conservation: role of hypocretin and the lateral hypothalamus in dynamic state-dependent resource optimization. Front Neurol. 2018;9:790. doi:10.3389/fneur.2018.00790
56. Komagata N, Latifi B, Rusterholz T, Bassetti CLA, Adamantidis A, Schmidt MH. Dynamic REM sleep modulation by ambient temperature and the critical role of the melanin-concentrating hormone system. Curr Biol. 2019;29:1976–1987. doi:10.1016/j.cub.2019.05.009
57. De Gennaro L, Ferrara M, Vecchio F, Curcio G, Bertini M. An electroencephalographic fingerprint of human sleep. NeuroImage. 2005;26:114–122. doi:10.1016/j.neuroimage.2005.01.020
58. Buckelmüller J, Landolt HP, Stassen HH, Achermann P. Trait-like individual differences in the human sleep electroencephalogram. Neuroscience. 2006;138:351–356. doi:10.1016/j.neuroscience.2005.11.005
59. Silverstein LD, Levy CM. The stability of the sigma sleep spindle. Electroencephalogr Clin Neurophysiol. 1976;40:666–670. doi:10.1016/0013-4694(76)90142-5
60. Gillard JM, Blois R. Spindle density in sleep of normal subjects. Sleep. 1981;4:385–391. doi:10.1093/sleep/4.4.385
61. Azumi K, Shirakawa S. Characteristics of spindle activity and their use in evaluation of hypnotics. Sleep. 1982;5:95–105. doi:10.1093/sleep/5.1.95
62. Vallat R, Walker MP. An open-source, high-performance tool for automated sleep staging. eLife. 2021;10:e70092. doi:10.7554/eLife.70092
63. Léger D, Debellemaniere E, Rabat A, Bayon V, Benchenane K, Chennaoui M. Slow-wave sleep: from the cell to the clinic. Sleep Med Rev. 2018;41:113–132. doi:10.1016/j.smrv.2018.01.008
64. Wang YQ, Li R, Zhang MQ, Zhang Z, Qu WM, Huang ZL. The neurobiological mechanisms and treatments of REM sleep disturbances in depression. Curr Neuropharmacol. 2015;13:543–553. doi:10.2174/1570159X13666150310002540
 © 2023 The Author(s). This work is published and licensed by Dove Medical Press Limited. The
full terms of this license are available at https://www.dovepress.com/terms
and incorporate the Creative Commons Attribution
- Non Commercial (unported, 3.0) License.
By accessing the work you hereby accept the Terms. Non-commercial uses of the work are permitted
without any further permission from Dove Medical Press Limited, provided the work is properly
attributed. For permission for commercial use of this work, please see paragraphs 4.2 and 5 of our Terms.
© 2023 The Author(s). This work is published and licensed by Dove Medical Press Limited. The
full terms of this license are available at https://www.dovepress.com/terms
and incorporate the Creative Commons Attribution
- Non Commercial (unported, 3.0) License.
By accessing the work you hereby accept the Terms. Non-commercial uses of the work are permitted
without any further permission from Dove Medical Press Limited, provided the work is properly
attributed. For permission for commercial use of this work, please see paragraphs 4.2 and 5 of our Terms.