Back to Journals » Drug Design, Development and Therapy » Volume 15
Pharmacokinetics of Linezolid Dose Adjustment for Creatinine Clearance in Critically Ill Patients: A Multicenter, Prospective, Open-Label, Observational Study
Authors Wang X, Wang Y, Yao F, Chen S, Hou Y ![]() , Zheng Z, Luo J, Qiu B, Li Z, Wang Y, Wu Z, Lan J
, Zheng Z, Luo J, Qiu B, Li Z, Wang Y, Wu Z, Lan J ![]() , Chen C
, Chen C ![]()
Received 24 January 2021
Accepted for publication 13 April 2021
Published 19 May 2021 Volume 2021:15 Pages 2129—2141
DOI https://doi.org/10.2147/DDDT.S303497
Checked for plagiarism Yes
Review by Single anonymous peer review
Peer reviewer comments 2
Editor who approved publication: Prof. Dr. Tin Wui Wong
Xipei Wang,1,* Yifan Wang,2,3,* Fen Yao,2,3,* Shenglong Chen,2,* Yating Hou,4 Zhijie Zheng,1 Jinbiao Luo,5 Binghui Qiu,6 Zhanfu Li,7 Yirong Wang,2 Zheng Wu,2 Jinhua Lan,2 Chunbo Chen8,9
1Department of Medical Sciences, Guangdong Provincial People’s Hospital, Guangdong Academy of Medical Sciences, Guangdong Cardiovascular Institute, Guangzhou, 510080, People’s Republic of China; 2Department of Critical Care Medicine, Guangdong Provincial People’s Hospital, Guangdong Academy of Medical Sciences, Guangzhou, 510080, Guangdong, People’s Republic of China; 3School of Biology and Biological Engineering, South China University of Technology, Guangzhou, Guangdong, 510080, People’s Republic of China; 4Department of Oncology, Maoming People’s Hospital, Maoming, 525000, Guangdong, People’s Republic of China; 5Department of Neurosurgery, Guangzhou First People’s Hospital, School of Medicine, South China University of Technology, Guangzhou, Guangdong, 510180, People’s Republic of China; 6Department of Neurosurgery, Nanfang Hospital, Southern Medical University, Guangzhou, 510515, Guangdong, People’s Republic of China; 7Department of Intensive Care Unit, Guangdong 999 Brain Hospital, Guangzhou, 510510, Guangdong, People’s Republic of China; 8Department of Intensive Care Unit of Cardiovascular Surgery, Guangdong Cardiovascular Institute, Guangdong Provincial People’s Hospital, Guangdong Academy of Medical Sciences, Laboratory of South China Structural Heart Disease, Guangzhou, 510080, Guangdong, People’s Republic of China; 9The Second School of Clinical Medicine, Southern Medical University, Guangzhou, 510000, Guangdong, People’s Republic of China
*These authors contributed equally to this work
Correspondence: Chunbo Chen
Department of Intensive Care Unit of Cardiovascular Surgery, Guangdong Cardiovascular Institute, Guangdong Provincial People’s Hospital, Guangdong Academy of Medical Sciences, Laboratory of South China Structural Heart Disease, 96 Dongchuan Road, Guangzhou, 510080, Guangdong, People’s Republic of China
Email [email protected]
Purpose: The aim of this study is to use a population pharmacokinetic (PK) approach to evaluate the optimal dosing strategy for linezolid (LNZ) in critically ill patients.
Methods: This multicenter, prospective, open-label, observational study was conducted in 152 patients, and 117 of them were included in the PK model, whereas the rest were in the validation group. The percentage of therapeutic target attainment (PTTA) comprising two pharmacodynamic indices and one toxicity index was used to evaluate dosing regimens based on Monte Carlo simulations stratified by low, normal, and high renal clearance for MICs of 0.25– 4 mg/L.
Results: A single-compartment model with a covariate creatinine clearance (CrCL) was chosen as the final model. The PK parameter estimates were clearance of 5.60 L/h, with CrCL adjustment factor of 0.386, and a distribution volume of 43.4 L. For MIC ≤ 2 mg/L, the standard dosing regimen (600 mg q12h) for patients with severe renal impairment (CrCL, 40 mL/min) and standard dosing or 900 mg q12h for patients with normal renal functions (CrCL, 80 mL/min) could achieve PTTA ≥ 74%. The dose of 2400 mg per 24-h continuous infusion was ideal for augmented renal clearance (ARC) with MIC ≤ 1 mg/L. For MICs > 2 mg/L, rare optimal dose regimens were found regardless of renal function.
Conclusion: In critically ill patients, the standard dose of 600 mg q12h was sufficient for MIC ≤ 2 mg/L in patients without ARC. Moreover, a 2400 mg/day 24-h continuous infusion was recommended for ARC patients.
Keywords: critically ill patients, linezolid, population pharmacokinetic
Introduction
Linezolid (LNZ), an oxazolidinone antibiotic,1 is an important therapeutic choice for infections caused by methicillin-resistant Staphylococcus aureus (MRSA),2,3 and Enterococcus-induced complicated intra-abdominal infections,4,5 especially in critically ill patients. Its property of low protein binding (~27%) and wide distribution achieved high concentrations in infected organs, such as the lungs, brain, and skin.5,6 As a time-dependent antibiotic, the area under the curve of 0–24 h at steady-state divided by the minimum inhibitory concentration (AUC24/MIC) >80 and the percentage of time that the plasma concentrations surpass the MIC (%T>MIC>85%) were often used as pharmacodynamic (PD) indices7–10). The steady-state trough concentrations (Css,min) of LNZ in the range of 2–10 mg/L were also associated with clinical response and adverse effects. Furthermore, the occurrence of thrombocytopenia increased by 50% if the Css,min was greater than 10 mg/L.11 However, previous studies had revealed low target achievement and high inter-individual variability at standard dose (600 mg per 12 hours [q12h]), with 30.7–50% of critically ill patients exposed at subtherapeutic levels (Css,min < 2 mg/L).12,13
For dose optimization, the population pharmacokinetic (PK) approach was used to simulate the dosing regimens in Caucasian patients with acute respiratory distress syndrome (ARDS),14 renal impairment,15 augmented renal clearance (ARC),16 or continuous renal replacement therapy (CRRT).17 Based on a population PK model of LNZ in healthy Chinese volunteers, Yang et al simulated various dosing regimens for a variety of MICs.18 Because the MICs tested in China were approximately 1 mg/L, without taking into account the renal functions, the standard LNZ dosing regimen (600 mg q12h) achieved adequate exposure for most gram-positive bacterial infections in China. Nevertheless, with complex and severe pathophysiological conditions, critically ill patients are more likely to alter PK and PD variables.18 Previous studies using a population PK model were mainly conducted mostly on critically ill Caucasian patients. Further, improved knowledge of the PK/PD of LNZ dose adjustment for creatinine clearance (CrCL) can help to improve efficacious intervention of infections.19 However, there is a lack of evaluation of PK/PD of LNZ dose adjustment for CrCL in highly heterogeneous critically ill patients, especially in Chinese patients. In order to investigate the PK/PD of LNZ dose adjustment for various renal functions, and to clarify the appropriate dosing strategy for LNZ in critically ill patients, in particular Chinese patients with renal dysfunction, this multicenter, prospective, open-label, observational study was performed in adult intensive care units (ICUs) of four tertiary hospitals in China.
Materials and Methods
Study Design and Patients
This multicenter, prospective, open-label, observational study was conducted in ICUs of Guangdong Provincial People’s Hospital, Nanfang Hospital, Guangzhou First People’s Hospital, and Guangzhou 999 Brain Hospital (Guangdong, China). Moreover, the inclusion criteria were as follows: patients aged >18 years of age and patients who received LNZ intravenously (often 600 mg q12h). In contrast, the exclusion criteria were as follows: incomplete information and oral administration. Patients enrolled before October 30, 2018, were included in the model establishment group, and those enrolled afterward were included in the external validation group. The study protocol was planned in accordance with the SPIRIT guideline.20 All experiments were conducted in compliance with the approved protocols, guidelines, and regulations, and all patients (or suitable surrogates for patients unable to consent) provided written informed consent. This study was approved by the Ethics Committee of Guangdong Provincial People’s Hospital, Nanfang Hospital, Guangzhou First People’s Hospital, and Guangzhou 999 Brain Hospital (Guangdong, China) (GDREC2018269H(R1)) and was carried out in compliance with the Declaration of Helsinki.
The demographic data, including age, weight, height, and gender, were collected. Renal and hepatic functions, including levels of alanine aminotransferase, aspartate aminotransferase, total bilirubin, direct bilirubin and serum creatinine (sCr) were evaluated. CrCL was calculated using the Cockcroft-Gault formula.21 Other potential covariates (COV) included CRRT status, baseline sequential organ failure assessment (SOFA) scores, and acute physiology and chronic health evaluation (APACHE) II scores. The components of the SOFA and APACHE II scores were collected from historical medical records.
Sample Collection
Venous blood samples were collected in EDTA-K2 tubes at the end of the infusion (2.5 h after the start of infusion) and before the next dose in patients administered at least one dose. Moreover, plasma samples were separated by centrifuging the blood samples at 2000 g at room temperature for 10 min and stored at −80°C prior to analysis.
Analytical Procedures
All plasma samples were quantified at the Department of Medical Sciences at Guangdong Provincial People’s Hospital using a validated high-performance liquid chromatography-tandem mass spectrometry (LC-MS/MS) method. The method was fully validated in compliance with the guidelines of the US Food and Drug Administration for bioanalysis.22 As the protein binding of LNZ is <15% in critically ill patients,1 the total LNZ concentration was measured. The analytical procedure was briefly described as follows. The analyte and isotope-labeled internal standard (IS) were isolated on the Ultimate XB C18 3 μm (2.1 × 50 mm) with a flow rate of 0.3 mL/min. The mobile phase consisted of water, containing 0.5% formic acid (v/v) (A) and acetonitrile (B) (30:70, v/v) with a total run time of 2 min. A positive ion mode multiple-reaction monitoring detection mode by electrospray ionization (ESI) ion mode was used with the transitions of m/z 338.1→296.1 and m/z 341.2→297.2 for LNZ and linezolid-d3 (IS), respectively. A volume of 50 μL plasma sample was mixed with 20 μL IS working solution, and then protein was precipitated by adding 200 μL acetonitrile. Next, the sample was centrifuged at 12,000 rpm for 15 min. The final supernatant was injected and analyzed in the LC-MS/MS system. The linear range of the method was 0.05–20 mg/L. The inter-day and intra-day precisions were 1.7–5.8%, and the relative error (accuracy) was –3.3% to –1.3%. Moreover, the matrix effect and recovery were 88.4–92.5% and 89.5–91.4%, respectively.
PK Modeling
As a base model, one- or two-compartment model with first-order elimination was investigated. Further, potential covariates, including demographic characteristics, and renal and liver functions were evaluated. Covariate models were chosen based on the type of variables used. Discrete covariates (such as gender) were modeled as follows.

For continuous covariates (such as age and CrCL), an exponential model with average covariate values and an adjusting factor was chosen:
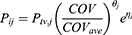
In the equations described above, Pij is the individual value. Ptv,j is the population typical value, COV is the value of the covariate, θj is an impact factor. COVgender is a binary variable (1 for male and 0 for female patients), and COVave is the average continuous covariate. Moreover, inter-individual variability was expressed as ηi, which is normally distributed with mean 0 and variance ω2. Residual variability (RV) was also modeled using additive, proportional and mixture of additive and proportional error model.
The first-order conditional estimate with interaction (FOCE-I) method was used during model building. The change in the objective function value (OFV) was asymptotically distributed as χ2. The covariate evaluation was followed by a forward stepwise univariate of at least 3.84 reduction in the OFV (α=0.05, 1 degree of freedom) and a backward elimination analysis of the covariates (α= 0.001) with an OFV increase of at least 10.82.
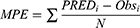
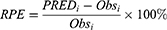
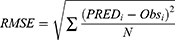
The adequacy of the final model was assessed using goodness-of-fit (GOF) plots, normalized prediction distribution error (NPDE), visual predictive checks (VPC) and external validation. One thousand times of bootstrap for the 95% confidence intervals (CIs) of the parameters were conducted on Perl-speaks-NONMEM version 4.8.0 (Uppsala University, Sweden). The GOF plots, VPC plot and NPDE statistics were conducted using R and the add-on package NPDE version 2.0.23 The mean prediction error (MPE), relative prediction error (RPE) and the root mean square error (RMSE) were determined as follows to assess the accuracy and precision of the final model:
Simulations and Target Attainment
The PK profiles of different infusion dosing regimens were obtained using Monte Carlo simulations by NONMEM: daily dose of 1200, 1800, and 2400 mg administered every 12 h, 8 h, and 6 h as a 1-h intravenous infusion and 24-h continuous infusion, respectively, ie, 600 mg q12h, 400 mg q8h and 300 mg q6h for a daily dose of 1200 mg; 900 mg q12h, 600 mg q8h and 450 mg q6h for a daily dose of 1800 mg; 1200 mg q12h, 800 mg q8h, and 600 mg q6h for a daily dose of 2400 mg; and 1200 mg, 1800 mg and 2400 mg 24-h infusion. The stratified three renal function levels (n=10,000 each level) of the virtual patients were simulated as follows: (1) patients with impaired renal function (CrCL value of 40 mL/min), in addition to the aforementioned dose regimens, 400 mg q12h was also simulated in this group; (2) patients with a normal renal function (CrCL value of 80 mL/min); and (3) virtual patients with ARC, a threefold CL value compared with that in the normal patients was set. AUC24 was calculated by dividing the daily dose by the individual CL. After continuous infusion, Css was used for steady-state concentration. The therapeutic targets were defined as simultaneously meeting two PK/PD indices (AUC24/MIC ≥80 and %T>MIC >85%) and one toxicity index (Css,min or Css<10 mg/L), for the MICs ranged from 0.25 to 4 mg/L. The therapeutic target expressed as the percentage of the therapeutic target attainment (PTTA). A priori, a dosing regimen was considered to be effective if the PTTA was higher than 90%, whereas a PTTA between 70% and 90% was considered to indicate a moderate probability of success.
Statistical Analysis
All baseline data (demographic and characteristics) were summarized with median and range and compared using R version 3.5 (Team R, 2018). Population PK analyses were performed using NONMEM (version 7.3, ICON plc, NY, USA) to introduce the first-order conditional estimation method with interaction. A Fortran compiler was used, and the runs were executed on Pirana (version 2.9.0).24
Results
Patient Characteristics
Of the 160 patients who met the inclusion criteria, seven were excluded for incomplete information and one for oral administration (Figure 1). The patients had normal to severely impaired renal function (CrCL, 7.5–222.4 mL/min); of these, five had ARC. Further, 83 male and 34 female patients (117 in total) with a median age of 62 years, and BMI 21.2 kg/m2 were included for establishing the population PK model (Table 1), with total 241 observations. With a high inter-subject variability of Css,min values, the maximum was >330-fold higher than the minimum (range, 0.1–33.6 mg/L). Only 46.2% of the patients achieved the optimal Css,min range (2–10 mg/L). In total, 32 (27.4%) Css,min values were lower than the common MIC (2 mg/L), whereas 31 (26.5%) Css,min values were higher than the reported upper alarm concentration (10 mg/L).
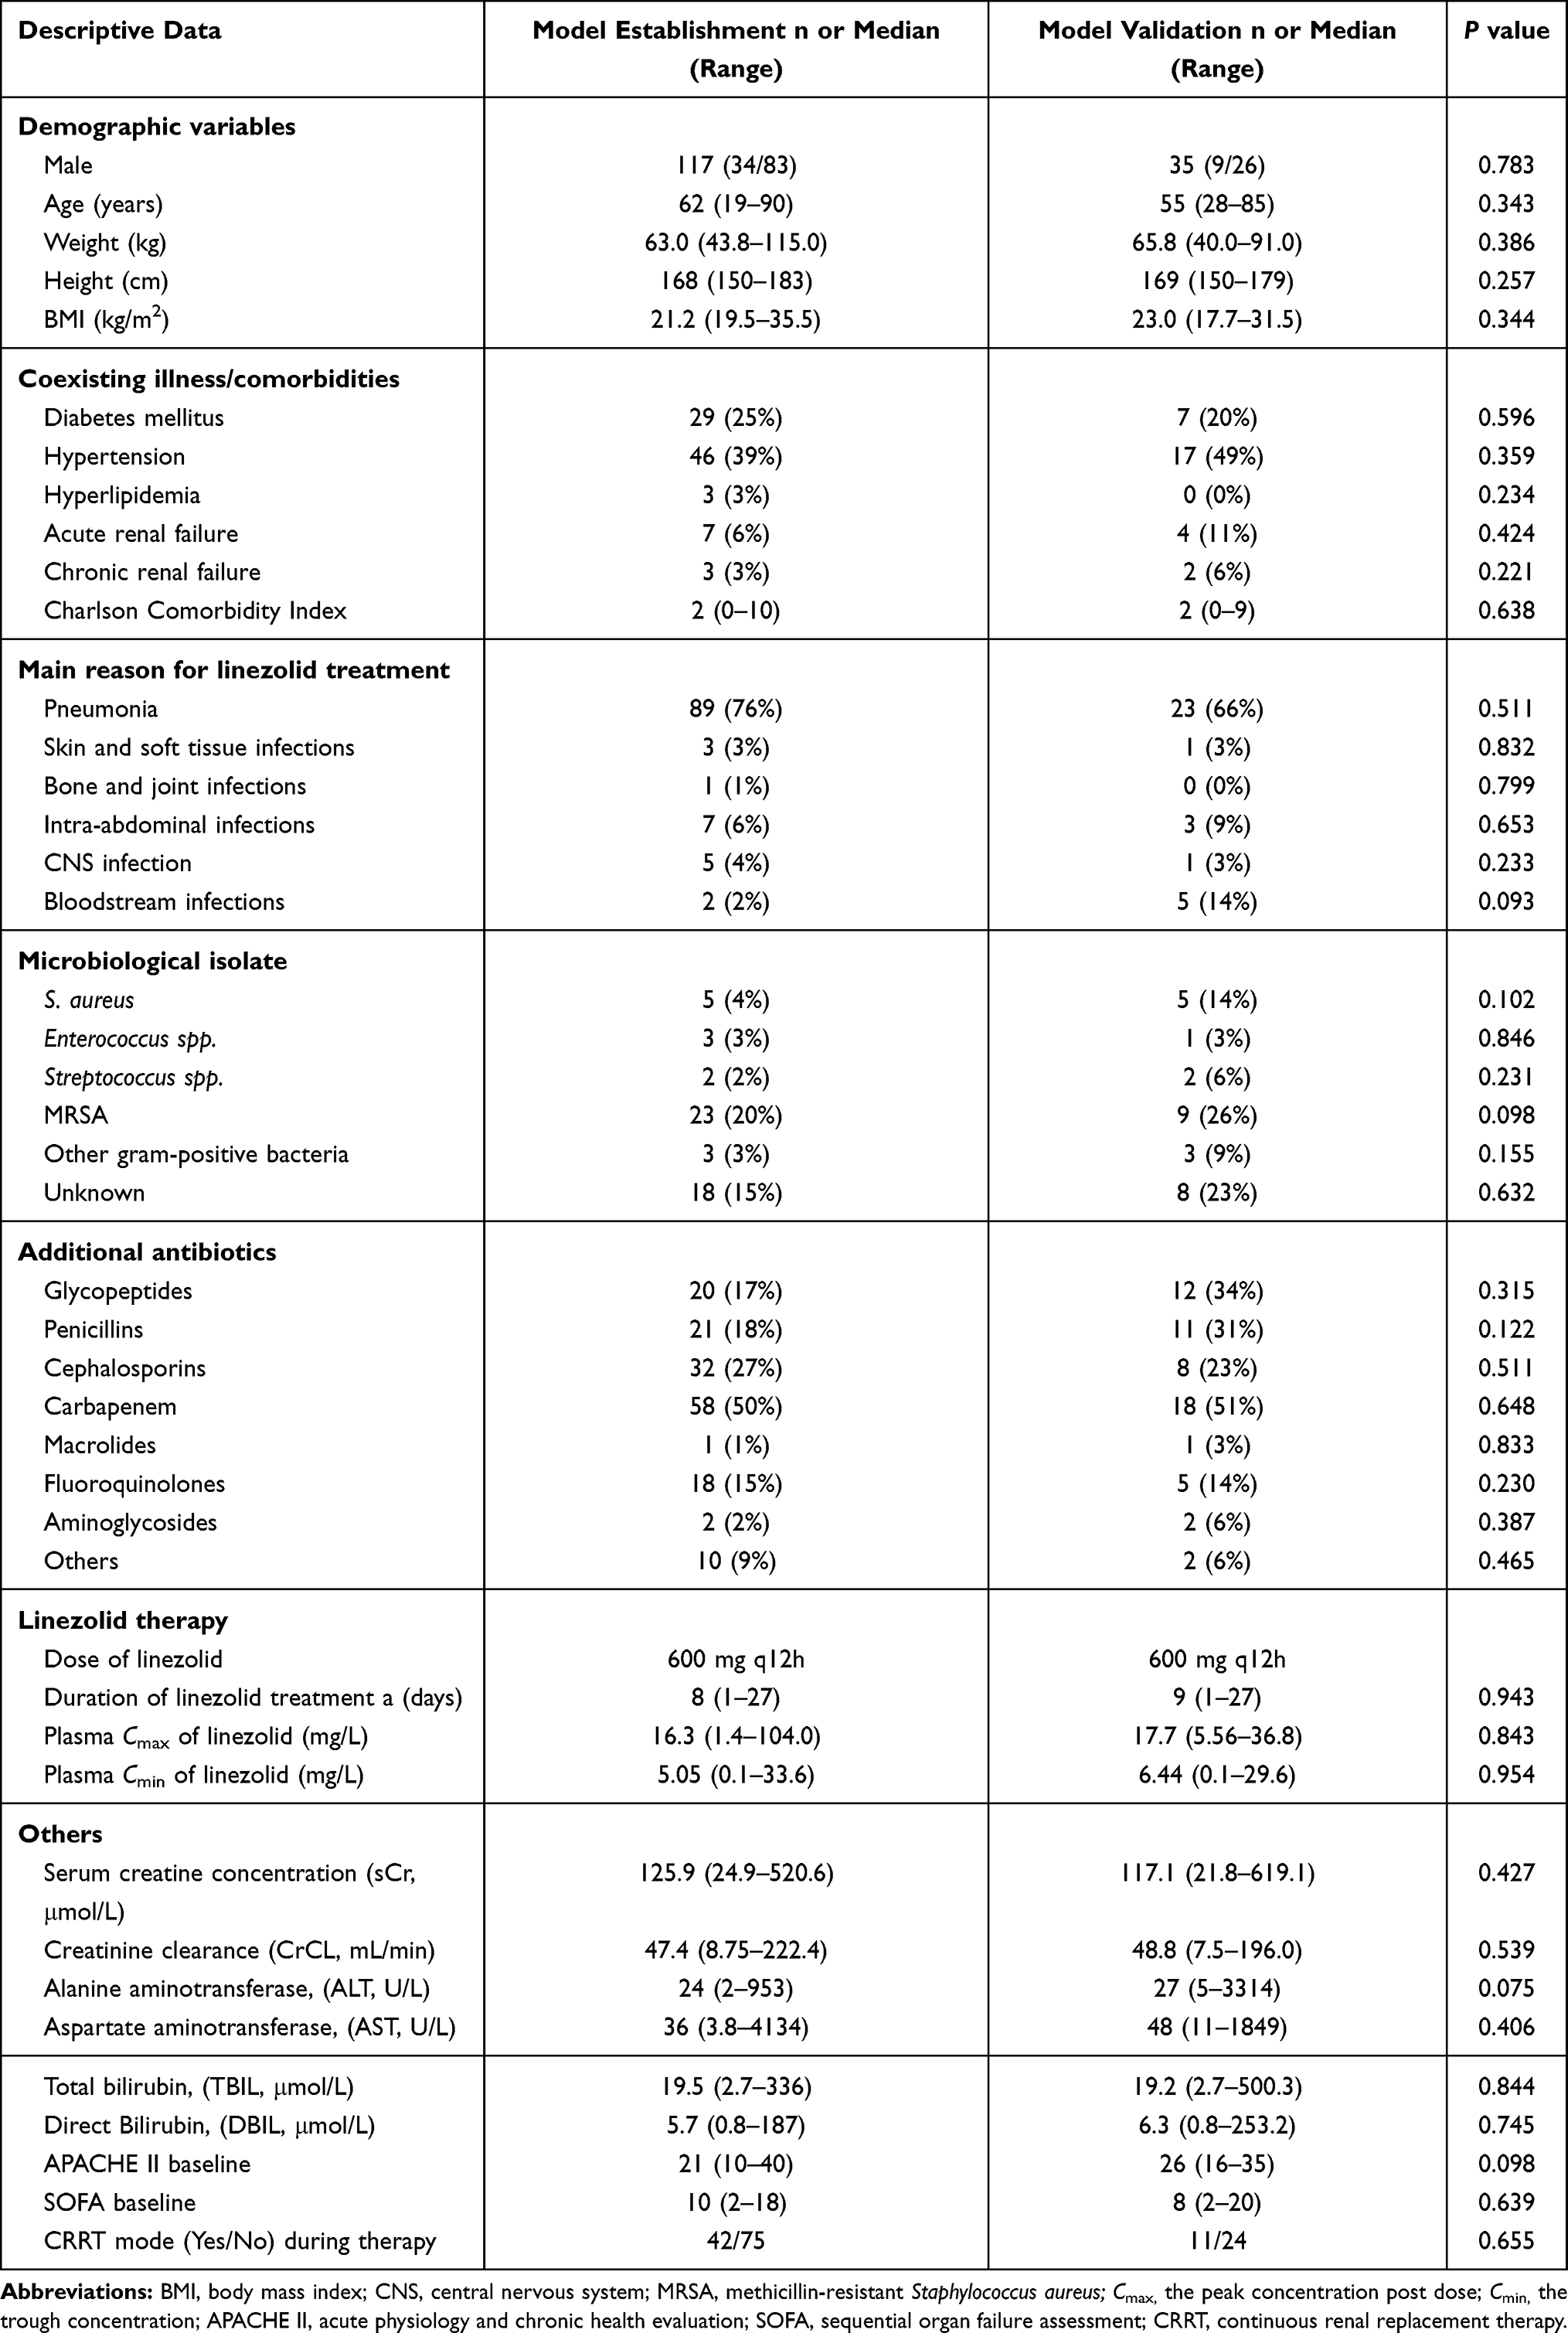 |
Table 1 Demographic Characteristics of the Critically Ill Patients |
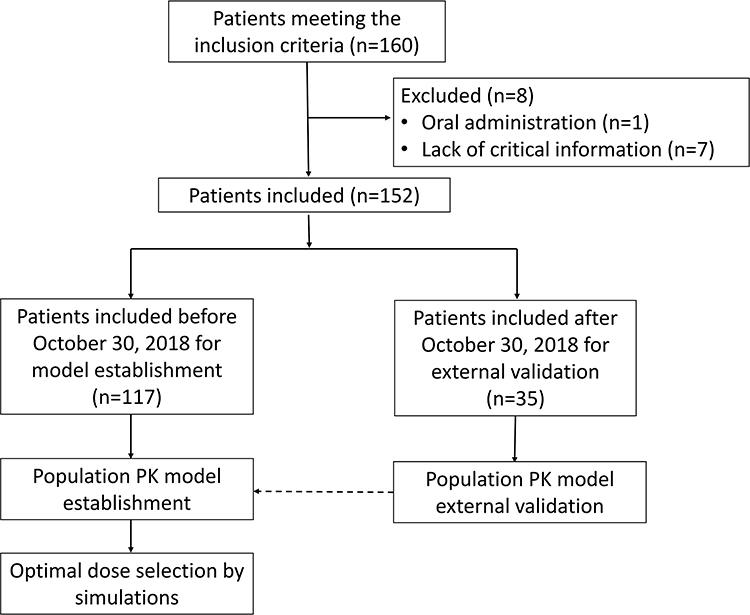 |
Figure 1 Flowchart of the study. |
Another 35 patients with 72 observations were used for external validation with demographic characteristics similar to those in the model building group (Table 1). Likewise, >31% of the patients did not meet the target Css,min range.
Population PK Model
LNZ plasma concentrations were adequately fitted using a single-compartment model with a combined error model with proportional error of 36.2% and an additive residual error of 0.055 mg/L. The population PK parameter estimates with 95% CI based on bootstraps are shown in Table 2. The estimates of elimination clearance (CL) and volume of distribution (V) were 5.60 L/h (95% CI, 4.50–6.41 L/h) and 43.4 L (95% CI, 38.4–49.1 L), respectively, with inter-subject variability of 63.9% for CL and 17.6% for V. Only CrCL had a major impact on the clearance with an adjusting factor (θCrCL-CL) of 0.386. Other potential covariates such as age, weight, liver function, and CRRT were not found to have a significant influence on PK parameters. The modeling building process was listed in a supplementary material (Table S1).
 |
Table 2 Population Pharmacokinetic Parameter Estimates of Linezolid in the Critically Ill Patients |
Model Evaluation
The GOF plots showed an adequate fitness for the LNZ observations of the final model (Figure 2). With 1000 simulations, the distribution of NPDE, with a mean of 0.0484 and a variance of 0.923, showed a normal distribution, which indicated a good prediction of the final model (Figure 3A and B). The P values of the t-test, Fisher’s variance test, Shapiro–Wilks test of normality, were 0.435, 0.406 and 0.0296, respectively. The global adjusted P value was 0.0888. No obvious patterns were seen in the distribution of prediction errors (Figure 3C and D). In the VPC plot, most observation median lines fell inside the 90% PI of the predictions (Supplementary Figure S1), which revealed adequate and precise prediction of the final population model. These results of the internal evaluation indicated good accuracy and reliability of the final PK model.
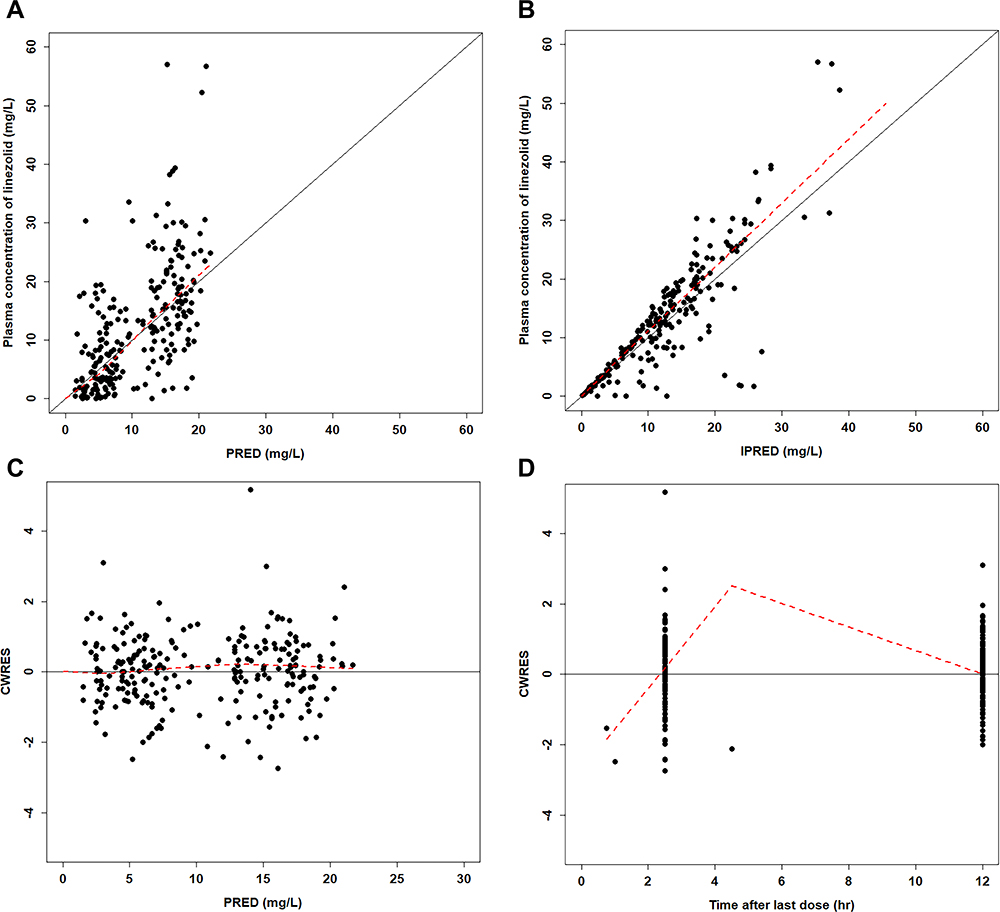 |
Figure 2 Diagnostic plots for the final PK model. Notes: (A) Observed versus population prediction (PRED). (B) Observed versus individual predicted concentrations (IPRED). (C) Conditional weight residual error (CWRES) versus population predicted concentration (PRED). (D) CWRES versus time after the last dose. |
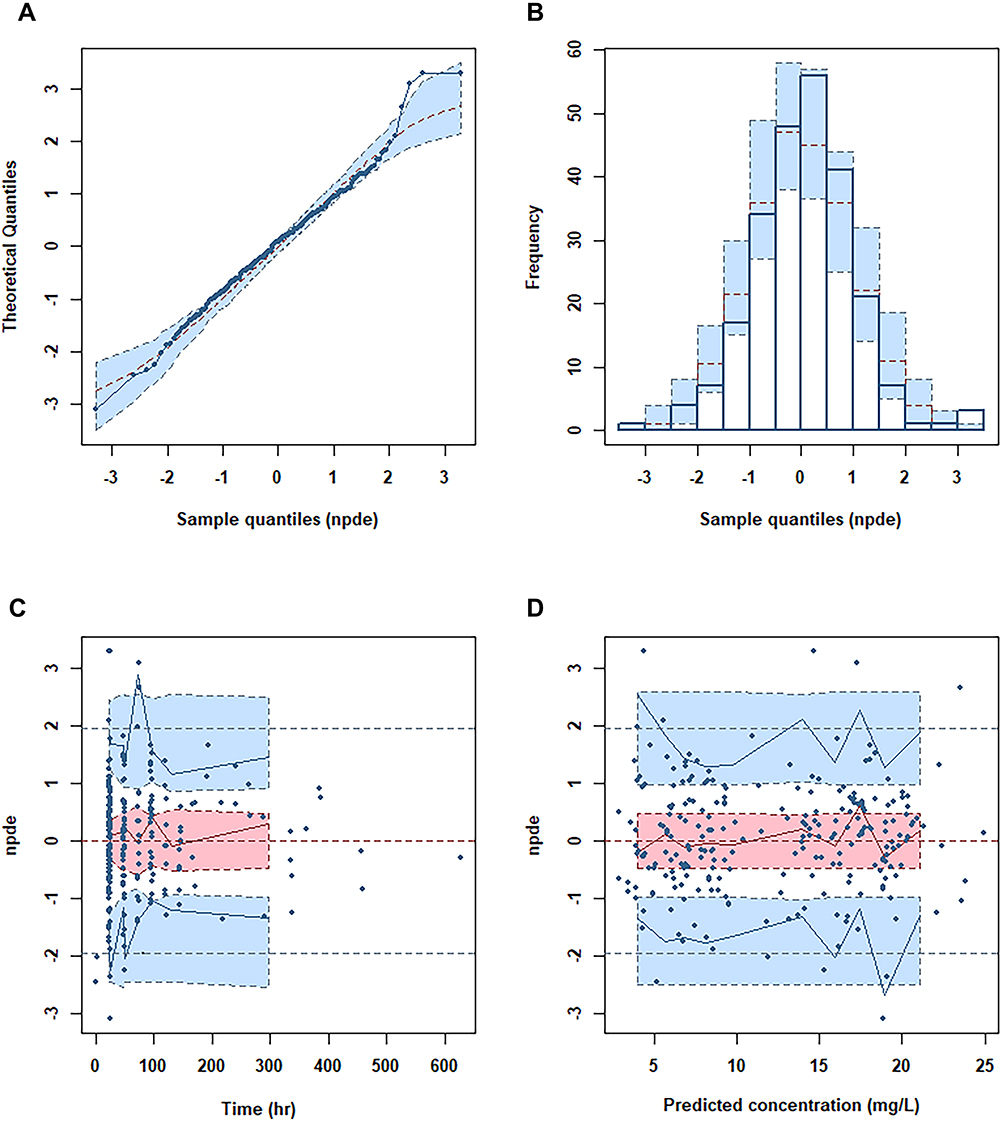 |
Figure 3 Normalized prediction distribution error (NPDE) metrics for the final PK model. Notes: (A) Quantile-quantile plot of NPDE. (B) Distribution of NPDE. (C) NPDE versus time. (D) NPDE versus predicted concentrations. The observed concentrations were shown as filled circles, and solid lines represented the 5th, 50th and 95th percentiles of observed data. Red or blue shaded areas represent the 95% prediction interval. |
The bias (MPE) was 0.866 mg/L, median RPE was 4.6% (−45.1%, 95.2%, IQR) and the RMSE was 9.93 mg/L based on external validation. For the target range of 2–10 mg/L, the prediction was found to be consistent with the observed concentrations without any significant bias.
Simulations
The main PTTA values of comparable and recommended dosing regimens for a series of MICs are shown in Figure 4. The full table of PTTA values for each dose regimen, including the percentages of the dose regimens that failed to meet the target indices, are listed as a supplementary material in Table S2. In patients with severe renal dysfunction with CrCL as low as 40 mL/min, 600 mg q12h was sufficient to achieve all target PD indices (PTTA 96%) for MIC ≤2 mg/L (Figure 4A). A decrease in daily dose (400 mg q12h) or each dose (400mg q8h or 300mg q6h) seemed unnecessary for PTTAs to be lower or closer to the normal dose. Moreover, a 24-h continuous infusion for half of the occurrence of Css >10 mg/L (56%) was not recommended. No dose regimens were recommended for MIC higher than 2 mg/L due to higher incidence of Css >10 mg/L with an increase in daily dose or each dose (Table S2).
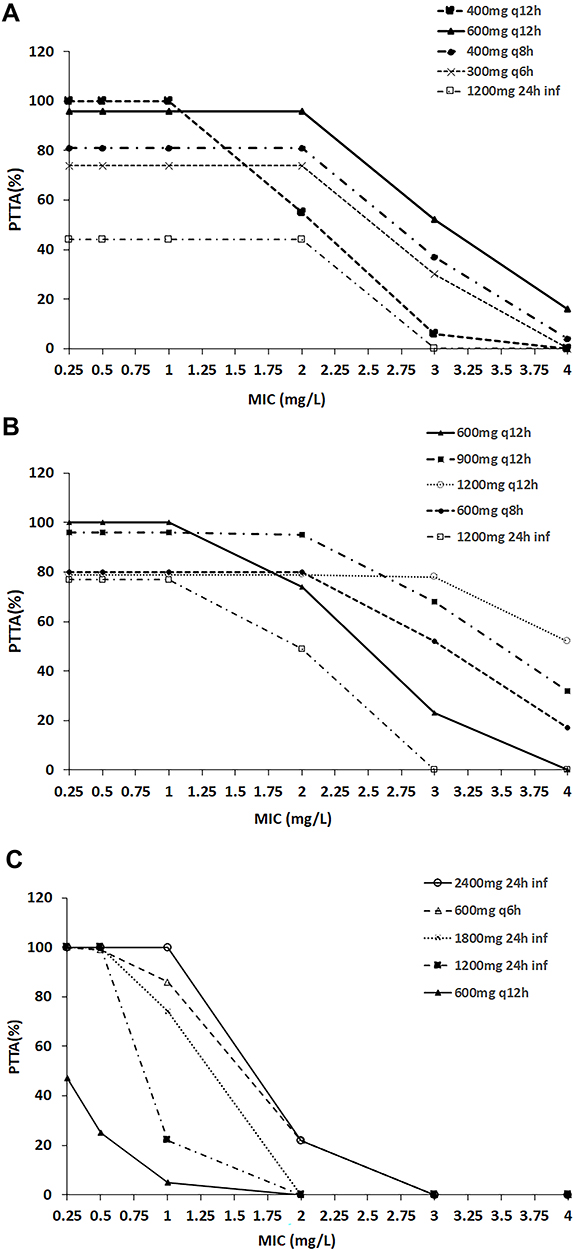 |
Figure 4 Probability of therapeutic target attainment (PTTA) with the four-dose regimens in the simulated patients with creatinine clearance (CrCL). Notes: (A) CrCL of 40 mL/min. (B) CrCL of 80 mL/min. (C) CrCL of threefold of linezolid CL in the patients with normal renal function. PTTA was defined as the area under curve from 0 to 24h at steady-state divided by the minimum inhibitory concentration (AUC24/MIC) >80, the percentage of time that plasma concentrations exceed the MIC (%T>MIC >85%) and trough steady-state concentrations (Css,min) of linezolid (LNZ) <10 mg/L. |
In patients with normal renal function, with CrCL of 80–120 mL/min, a daily dose of 1200 mg could provide sufficient exposure to MIC ≤1 mg/L. The standard dosage (600 mg q12h) and 900 mg q12h showed the PTTAs ≥95% (Figure 4B). Dosage of 24-h continuous infusion was not recommended for the increased occurrence of high Css (Table S2). For MIC=2 mg/L, 900 mg q12h still obtained adequate exposure with less risk of adverse effects (PTTA 95%). Both 600 mg q8h and 1200 mg q12h resulted in only moderate probabilities of success. Continuous infusion of 1200 mg or 1800 mg per day was not recommended for a relatively high risk of adverse effects. When MIC increased up to 3 mg/L, 1200 mg q12h was the only recommendation (Figure 4B). Optimal dose regimens for MIC above 3 mg/L were not found.
For the patients with ARC, a daily dose of 1200 mg was clearly insufficient for MIC ≥0.5 mg/L, regardless of the dose frequency (Figure 4C). A daily dose up to 2400 mg (600 mg q6h or 2400 mg 24-h infusion) could achieve a PTTA ≥ 86% for MIC ≤ 1 mg/L, of which a 24-h continuous infusion showed a PTTA value of 100% with a more stable PK profile (Table S2). However, for higher MIC, no successful dose regimens were obtained based on simulations.
Overall, optimal dosage for MICs ≤2 mg/L for patients with normal or impaired renal function could be found. For patients with ARC, dose regimens could only be recommended for MIC ≤ 1 mg/L. However, rare dose regimens for MIC>2 mg/L, were optimal regardless of renal function.
Discussion
The present study showed that the standard dosing of LNZ (600 mg q12h) was not optimal for all critically ill Chinese patients. Dose adjustment should be done based on renal function and MIC values. The high variability and outside-the-target ranges of LNZ levels in the current study were consistent with those in other studies in Caucasian patients.8,25–27 Moreover, therapeutic drug monitoring and optimal dosing based on modeling and simulation were essential for the clinical use of LNZ.25,26 The %T>MIC exceeded 85% and AUC24/MIC values >80 were often used as PD indices to evaluate various dose strategies.27 But overexposure to LNZ could also increase the risk of adverse effect. Lower CrCL (<30 mL/min) leading to higher Css,min was a significant predictor of thrombocytopenia.28 Therefore, as a difference from the previous studies, we considered both PD and toxicity levels for dosing recommendations: %T>MIC =85% and AUC24/MIC =80 were adopted as the lower limit indices of the exposure, and Css,min =10 mg/L as the upper limit index to control overexposure.
In the previous studies, a series of covariates, including body weight, CrCL, fibrinogen, antithrombin concentration, lactate concentration, SOFA score, and ARDS, were found to significantly influence the clearance and distribution volume of LNZ in patients.13,14,29,30 In the present study, only CrCL was identified as the covariate on the LNZ clearance in the final model. Although body weight was not included directly in the final model as the published ones,13,14 it was included in the calculation of CrCL. CrCL was a comprehensive index containing several variables (weight, gender, age, and sCr). The influence of CrCL on CL was also found in the previous studies,29,30 the parameter estimates were similar, which demonstrated that no obvious ethnic differences were found in critically ill patients. But we provided more detailed recommended dose regimens including the ARC patients who were not included previously. In GOF plots (Figure 2A), part of PRED values were obviously smaller than the observed ones, most of which were the peak concentrations collected at the end of infusion. It was common that the PRED values showed a relatively poor fitness of the peak concentrations. Large inter-individual variability of the peak concentrations without adequate explanation by known factors might be the main reason to this phenomenon. However, acceptable CWRES were shown through the PRED values (Figure 2C). Moreover, with inter-individual variability included, there was an improvement in the predicted values (IPRED) for these concentrations.
Other covariates were not identified as significant covariates in our study for the elimination of LNZ was through the kidney. In addition to the physiological and biochemical indicators, the effect of CRRT on the pharmacokinetics of LNZ was investigated. Although it was reported that the clearance by CRRT (CLCRRT) out of the total clearance was 18.7–48.9%,31 CRRT was still not supported as covariate in our final model. It may be attributed to the limited influence of CRRT on CL and the large variability of CLCRRT.
For the patients with renal insufficiency, for MIC≤2 mg/L, standard dosing could get adequate drug exposure. There was no need for a decreased regimen (600 mg q24h) as previously published.15 Previous studies concluded that the standard dose offered a reasonably high probability of treatment success in patients with MIC ≤1 mg/L.16,32 It was identical in our study with the exception of patients with ARC. The patients with ARC were common in the ICU and continuous infusion was essential for the treatment success. For these patients, a dose of 2400 mg 24-h continuous infusion was preferred to ensure the drug effect. A 24-h continuous infusion of a daily dose of 1800 mg LNZ was recommended in the previous study.16 However, there was only a moderate treatment success (PTTA 74%) for MIC of 1 mg/L in our study. Compared with an intermittent infusion, continuous infusion was only appropriate for patients with ARC or obese patients. Continuous infusion of a daily dose of 1200 mg could not help to reach the best target attainment for patients with normal or impaired renal function. Therefore, it only increased the risk of adverse effects.
In patients with normal renal function, the standard dose regimen and 900 mg q12h were both recommended for MIC≤1 mg/L, but 900 mg q12h could provide a higher probability of treatment success without compromising the safety up to MIC of 2 mg/L, which was similar to the previously proposed daily dose of 1800 mg (800 mg q12h or 600 mg q8h).15,32 However, for MICs >2 mg/L, the findings of this PK/PD analysis indicated that optimal dose regimens were hardly obtained for either renal impaired patients or ARC patients. The same has been reported previously the same.25 However, for the patients with normal renal function, 1200 mg q12h could be tried for its moderate treatment success (PTTA 78%), though a 24-h continuous infusion (1200 mg/day) was not recommended for patients with normal CrCL because ~23% of the simulated Css,min was higher than 10 mg/L.
An increase in the volume of distribution and metabolism interference (eg, drug–drug interactions such as P-glycoprotein [P-gp] inhibitors or inducers) are responsible for high inter-individual variability of LNZ plasma concentrations.18,30,33,34 In critically ill obese patients affected by ventilator-associated pneumonia, LNZ CL may overcome the limits of standard administration.25 However, in the present study, no P-gp inducer was co-administered with LNZ.
Moreover, there were some limitations or drawbacks to this study. The limited number of participants could not represent all relevant patient groups clearly, which, in conjunction with the high observed variability, resulted in certain statistical limitations. Therefore, all relevant cofactors probably could not be identified. In this study, CrCL was calculated using the Cockcroft-Gault equation, which may have introduced some errors in the final values especially for critically ill patients. It may affect the use of the results from this study when CrCL is calculated using other methods.
Conclusions
Standard dosing of LNZ (600 mg q12h) is often potentially insufficient in critically ill patients. In this study, CrCL was found to have significant influence on the clearance of LNZ in the single-compartment model. Based on the simulation of the final model, the standard dosing regimen was found to be adequate in patients with bacterial MICs ≤2 mg/L and CrCL ≤40 mL/min. In addition to standard dosing, 900 mg q12h was an alternative for patients with normal renal function. For patients with ARC, a 24-h continuous infusion (2400 mg/day) might help achieve sufficient efficacy for MICs ≤1 mg/L. For a higher MIC (>2 mg/L), there was almost no optimal dose strategy.
Abbreviations
AGE, age of the patient in years; ALT, alanine aminotransferase; APACHE II, acute physiology and chronic health evaluation II; ARC, augmented renal clearance; ARDS, acute respiratory distress syndrome; AST, aspartate aminotransferase; AUC, area under the receiver operating characteristic curve; BMI, body mass index; CI, confidence interval; CL, clearance of the central compartment; CLINTER VAR, the inter-individual variability of CL; Cmax, the peak concentration post dose; Cmin, the trough concentration; CNS, central nervous system; COV, covariates; COVave, average covariate values; CrCL, creatinine clearance; CRRT, continuous renal replacement therapy; DBIL, direct bilirubin; F, the bioavailability; GOF, goodness-of-fit; ICU, intensive care unit; IPRED, individual predicted concentrations; LNZ, linezolid; MIC, minimum inhibitory concentration; MPE, mean prediction error; MRSA, methicillin-resistant Staphylococcus aureus; NPDE, normalized prediction distribution error; OFV, objective function value; PD, pharmacodynamic; P-gp, P-glycoprotein; PK, pharmacokinetic; PLT, platelet count; PRED, population predicted concentration; PTTA, percentage of therapeutic target attainment; q12h, every 12 hour; RMSE, root mean square error; RV, residual variability; sCr (μM), serum creatinine concentration in μM; SOFA, sequential organ failure assessment; TBIL, total bilirubin; V, the distribution volume of the central compartment; VINTER VAR, the inter-individual variability of V; WT, weight; θCrCL-CL, the adjusting factor of the CrCL on the CL.
Data Sharing Statement
The datasets generated and/or analyzed during this study are not publicly accessible due to currently ongoing research studies, but the data are available from the corresponding author on reasonable request.
Ethics Approval and Consent to Participate
The protocol was approved by the Ethics Committee of Guangdong Provincial People’s Hospital, Nanfang Hospital, Guangzhou First People’s Hospital, and Guangzhou 999 Brain Hospital. Written informed consent was obtained from each patient or from suitable surrogates for patients who were unable to consent.
Consent for Publication
Not applicable. No individual personal data are included in the study. All patients provided the necessary consent to participate in the present study.
Acknowledgments
The authors would like to thank all the doctors, nurses, technicians, and patients involved in the ICU for their dedication to the study.
Author Contributions
All authors made substantial contributions to conception and design, acquisition of data, or analysis and interpretation of data; took part in drafting the article or revising it critically for important intellectual content; agreed to submit to the current journal; gave final approval of the version to be published; and agree to be accountable for all aspects of the work. These four authors contributed equally to this study; co-first author: Xipei Wang, Yifan Wang, Fen Yao, and Shenglong Chen.
Funding
Author Chunbo Chen is currently receiving a grant (#81671963) from the National Natural Science Foundation of China, a grant (#201803010058) from the Guangzhou Science and Technology Program, and a grant (No. DFJH2020028) under the major program of Summit Project, Guangdong Province High-Level Hospital Construction Project of Guangdong Provincial People’s Hospital, Guangdong Academy of Medical Sciences. Author Shenglong Chen is currently receiving a grant (#81701875) from the National Natural Science Foundation of China, and a grant (#201904010039) from the Science and Technology Program of Guangzhou. Author Xipei Wang is currently receiving a grant (#2018A04) from the Guangdong Provincial Hospital Pharmaceutical Research Fund (ChiaTai Tianqing) of Guangdong Pharmaceutical Association and a grant (#A2020002) from Medical Scientific Research Foundation of Guangdong Province of China.
Disclosure
The authors declare that they have no conflicts of interest for this work.
References
1. Sazdanovic P, Jankovic SM, Kostic M, Dimitrijevic A, Stefanovic S. Pharmacokinetics of linezolid in critically ill patients. Expert Opin Drug Met. 2016;12(6):595–600. doi:10.1517/17425255.2016.1170807
2. Liu J, Gao YH, Wang XB, et al. Culture-positive spontaneous ascitic infection in patients with acute decompensated cirrhosis: multidrug-resistant pathogens and antibiotic strategies. Yonsei Med J. 2020;61(2):145–153. doi:10.3349/ymj.2020.61.2.145
3. Leach KL, Brickner SJ, Noe MC, Miller PF. Linezolid, the first oxazolidinone antibacterial agent. Ann NY Acad Sci. 2011;1222:49-54. doi:10.1111/j.1749-6632.2011.05962.x
4. Zhou YL, Chen HT, He HC, et al. Increased Enterococcus faecalis infection is associated with clinically active Crohn disease. Medicine. 2016;95(39):e5019. doi:10.1097/MD.0000000000005019
5. Ouyang W, Xue H, Chen Y, et al. Clinical characteristics and antimicrobial patterns in complicated intra-abdominal infections: a 6-year epidemiological study in southern China. Int J Antimicrob Ag. 2016;47(3):210–216. doi:10.1016/j.ijantimicag.2015.12.019
6. Liu ZH, Li JY, Liu HY, et al. The intestinal microbiota associated with cardiac valve calcification differs from that of coronary artery disease. Atherosclerosis. 2019;284:121–128. doi:10.1016/j.atherosclerosis.2018.11.038
7. Chen JY, Yi M, Yao SL, Zhang XP. Propofol target-controlled infusion modeling in rabbits: pharmacokinetic and pharmacodynamic analysis. J Huazhong U Sci-Med. 2016;36(3):428–433. doi:10.1007/s11596-016-1604-9
8. Dong H, Xie J, Chen L, et al. Developments in the pharmacokinetic/pharmacodynamic index of linezolid: a step toward dose optimization using Monte Carlo simulation in critically ill patients. Int J Infect Dis. 2014;22:35–40. doi:10.1016/j.ijid.2014.01.016
9. Li QH, Wen J, Yu KT, et al. Aloe-emodin induces apoptosis in human oral squamous cell carcinoma SCC15 cells. BMC Complement Altern Med. 2018:18. doi:10.1186/s12906-018-2353-z.
10. Pea F, Furlanut M, Cojutti P, et al. Therapeutic drug monitoring of linezolid: a retrospective monocentric analysis. Antimicrob Agents Ch. 2010;54(11): 4605-4610. doi:10.1128/aac.00177-10
11. Richards GA, Brink AJ. Therapeutic drug monitoring: linezolid too? Crit Care. 2014;18(5):525. doi:10.1186/s13054-014-0525-x
12. Zoller M, Maier B, Hornuss C, et al. Variability of linezolid concentrations after standard dosing in critically ill patients: a prospective observational study. Crit Care. 2014;18(4):R148. doi:10.1186/cc13984
13. Roger C, Muller L, Wallis SC, et al. Population pharmacokinetics of linezolid in critically ill patients on renal replacement therapy: comparison of equal doses in continuous venovenous haemofiltration and continuous venovenous haemodiafiltration. J Antimicrob Chemoth. 2016;71(2):464–470. doi:10.1093/jac/dkv349
14. Taubert M, Zoller M, Maier B, et al. Predictors of inadequate linezolid concentrations after standard dosing in critically ill patients. Antimicrob Agents Ch. 2016;60(9):5254–5261. doi:10.1128/AAC.00356-16
15. Ide T, Takesue Y, Ikawa K, et al. Population pharmacokinetics/pharmacodynamics of linezolid in sepsis patients with and without continuous renal replacement therapy. Int J Antimicrob Ag. 2018;51(5):745–751. doi:10.1016/j.ijantimicag.2018.01.021
16. Barrasa H, Soraluce A, Usón E, et al. Impact of augmented renal clearance on the pharmacokinetics of linezolid: advantages of continuous infusion from a pharmacokinetic/pharmacodynamic perspective. Int J Iect Dis. 2020;93:329–338. doi:10.1016/j.ijid.2020.02.044
17. Barrasa H, Soraluce A, Isla A, et al. Pharmacokinetics of linezolid in critically ill patients on continuous renal replacement therapy: influence of residual renal function on PK/PD target attainment. J Crit Care. 2019;50:69–76. doi:10.1016/j.jcrc.2018.11.016
18. Yang M, Zhang J, Chen Y, et al. Optimization of linezolid treatment regimens for Gram-positive bacterial infections based on pharmacokinetic/pharmacodynamic analysis. Future Microbiol. 2017;12:39–50. doi:10.2217/fmb-2016-0140
19. Mohri J, Katada C, Ueda M, et al. Predisposing factors for chemotherapy-induced nephrotoxicity in patients with advanced esophageal cancer who received combination chemotherapy with docetaxel, cisplatin, and 5-fluorouracil. J Trans Int Med. 2018;6(1):32–37. doi:10.2478/jtim-2018-0007
20. Owen EJ, Gibson GA, Buckman SA. Pharmacokinetics and pharmacodynamics of antimicrobials in critically ill patients. Surg Infect. 2018;19(2):155–162. doi:10.1089/sur.2017.262
21. Cockcroft DW, Gault MH. Prediction of creatinine clearance from serum creatinine. Nephron. 1976;16(1):31–41. doi:10.1159/000180580
22. U.S. Department of Health and Human Services FaDA, Center for Drug Evaluation and Research (CDER), Center for Veterinary Medicine (CVM). Bioanalytical method validation guidance for industry; May 2018. Available from: https://www.fda.gov/files/drugs/published/Bioanalytical-Method-Validation-Guidance-for-Industry.pdf.
23. Comets E, Brendel K, Mentré F. Computing normalised prediction distribution errors to evaluate nonlinear mixed-effect models: the npde add-on package for R. Comput Meth Prog Bio. 2008;90(2):154–166. doi:10.1016/j.cmpb.2007.12.002
24. Keizer RJ, Karlsson MO, Hooker A. Modeling and simulation workbench for NONMEM: tutorial on Pirana, PsN, and Xpose. CPT: Pharm Sys Pharm. 2013;2(6):e50. doi:10.1038/psp.2013.24
25. De Pascale G, Fortuna S, Tumbarello M, et al. Linezolid plasma and intrapulmonary concentrations in critically ill obese patients with ventilator-associated pneumonia: intermittent vs continuous administration. Intens Care Med. 2015;41(1):103–110. doi:10.1007/s00134-014-3550-y
26. Taubert M, Zander J, Frechen S, et al. Optimization of linezolid therapy in the critically ill: the effect of adjusted infusion regimens. J Antimicrob Chemoth. 2017;72(8):2304–2310. doi:10.1093/jac/dkx149
27. Rayner CR, Forrest A, Meagher AK, Birmingham MC, Schentag JJ. Clinical pharmacodynamics of linezolid in seriously ill patients treated in a compassionate use programme. Clin Pharmacokinet. 2003;42(15):1411–1423. doi:10.2165/00003088-200342150-00007
28. Choi GW, Lee JY, Chang MJ, et al. Risk factors for linezolid-induced thrombocytopenia in patients without haemato-oncologic diseases. Basic Clin Pharmacol Toxicol. 2019;124(2):228–234. doi:10.1111/bcpt.13123
29. Matsumoto K, Shigemi A, Takeshita A, et al. Analysis of thrombocytopenic effects and population pharmacokinetics of linezolid: a dosage strategy according to the trough concentration target and renal function in adult patients. Int J Antimicrob Ag. 2014;44(3):242–247. doi:10.1016/j.ijantimicag.2014.05.010
30. Minichmayr IK, Schaeftlein A, Kuti JL, Zeitlinger M, Kloft C. Clinical determinants of target non-attainment of linezolid in plasma and interstitial space fluid: a pooled population pharmacokinetic analysis with focus on critically ill patients. Clin Pharmacokinet. 2017;56(6):617–633. doi:10.1007/s40262-016-0463-7
31. Villa G, Di Maggio P, De Gaudio AR, et al. Effects of continuous renal replacement therapy on linezolid pharmacokinetic/pharmacodynamics: a systematic review. Crit Care. 2016;20(1):374. doi:10.1186/s13054-016-1551-7
32. Dong H, Xie J, Wang T, et al. Pharmacokinetic/pharmacodynamic evaluation of linezolid for the treatment of staphylococcal infections in critically ill patients. Int J Antimicrob Ag. 2016;48(3):259–264. doi:10.1016/j.ijantimicag.2016.05.009
33. Topper C, Steinbach CL, Dorn C, et al. Variable linezolid exposure in intensive care unit patients-possible role of drug-drug interactions. Ther Drug Monit. 2016;38(5):573–578. doi:10.1097/FTD.0000000000000324
34. Pea F, Viale P, Cojutti P, Del Pin B, Zamparini E, Furlanut M. Therapeutic drug monitoring may improve safety outcomes of long-term treatment with linezolid in adult patients. J Antimicrob Chemoth. 2012;67(8):2034–2042. doi:10.1093/jac/dks153
 © 2021 The Author(s). This work is published and licensed by Dove Medical Press Limited. The
full terms of this license are available at https://www.dovepress.com/terms
and incorporate the Creative Commons Attribution
- Non Commercial (unported, 3.0) License.
By accessing the work you hereby accept the Terms. Non-commercial uses of the work are permitted
without any further permission from Dove Medical Press Limited, provided the work is properly
attributed. For permission for commercial use of this work, please see paragraphs 4.2 and 5 of our Terms.
© 2021 The Author(s). This work is published and licensed by Dove Medical Press Limited. The
full terms of this license are available at https://www.dovepress.com/terms
and incorporate the Creative Commons Attribution
- Non Commercial (unported, 3.0) License.
By accessing the work you hereby accept the Terms. Non-commercial uses of the work are permitted
without any further permission from Dove Medical Press Limited, provided the work is properly
attributed. For permission for commercial use of this work, please see paragraphs 4.2 and 5 of our Terms.