Back to Journals » OncoTargets and Therapy » Volume 14
Peroxiredoxin1 Knockdown Inhibits Oral Carcinogenesis via Inducing Cell Senescence Dependent on Mitophagy
Authors Lu Y, Li L, Chen H ![]() , Jing X, Wang M, Ge L, Yang J, Zhang M
, Jing X, Wang M, Ge L, Yang J, Zhang M ![]() , Tang X
, Tang X ![]()
Received 30 September 2020
Accepted for publication 18 December 2020
Published 12 January 2021 Volume 2021:14 Pages 239—251
DOI https://doi.org/10.2147/OTT.S284182
Checked for plagiarism Yes
Review by Single anonymous peer review
Peer reviewer comments 2
Editor who approved publication: Dr Tohru Yamada
Yunping Lu, Lingyu Li, Hui Chen, Xinying Jing, Min Wang, Lihua Ge, Jing Yang, Min Zhang, Xiaofei Tang
Beijing Institute of Dental Research, Beijing Key Laboratory, Beijing Stomatological Hospital & School of Stomatology, Capital Medical University, Beijing 100050, People’s Republic of China
Correspondence: Xiaofei Tang; Min Zhang
Division of Oral Pathology, Beijing Institute of Dental Research, Beijing Stomatological Hospital & School of Stomatology, Capital Medical University, No. 4 Tiantan Xili, Dongcheng District, Beijing 100050, People’s Republic of China
Tel +86-10-57099311; +86-10-57099313
Fax +86-10-57099313
Email [email protected]; [email protected]
Purpose: Cellular senescence is a physiological phenomenon by which cells irreversibly lose their proliferative potential. It is not clear whether senescent cells are related to malignant transformation in oral precancerous lesions. The role of peroxiredoxin1 (Prx1)-induced cell senescence in OLK malignant transformation has not been reported. The aim of this study is to investigate the role and mechanism of cell senescence in oral carcinogenesis.
Methods: In this study, 4-nitro-quinoline-1-oxide (4NQO) induced tongue carcinogenesis model in Prx1+/+ and Prx1+/- mice and dysplastic oral keratinocyte (DOK) were used. Prx1 knockdown DOK cells were harvested with shRNA injection, and cell senescence was detected via the senescence-associated β-galactosidase (SA β-gal) assay. The senescence and mitophagy-related proteins were observed by immunohistochemistry (IHC), Western blot and qRT-PCR. The binding of Prx1 with prohibitin 2 (PHB2) and light chain 3 (LC3) was predicted via ZDOCK and measured in mice by Duolink analysis.
Results: Histologically, 4NQO treatment induced epithelial hyperplasia, dysplasia (mild, moderate and severe), carcinomas in situ and oral squamous cell carcinoma (OSCC) in mouse tongue mucosa. The malignant transformation rate in Prx1+/- mice (37.5%) was significantly lower compared with Prx1+/+ mice (57.1%). In Prx1+/+ mice, a higher number of senescent cells and greater expression of p53 and p21 were observed in hyperplastic and dysplastic tongue tissues when compared with those in OSCC tissues. Prx1 knockdown induced a greater number of senescent cells in hyperplastic tissues, and DOK cells accompanied cell cycle arrest at the G1 phase and PHB2/LC3II downregulation. Prx1 was predicted to dock with PHB2 and LC3 via ZDOCK, and the interactions were confirmed by in situ Duolink analysis.
Conclusion: Prx1 silencing inhibits the oral carcinogenesis by inducing cell senescence dependent on mitophagy.
Keywords: peroxiredoxin1, oral leukoplakia, oral squamous cell carcinoma, cell senescence, mitophagy
Introduction
Oral potentially malignant disorders (OPMDs) are chronic conditions, which have an increased risk of transformation to oral squamous cell carcinoma (OSCC).1,2 Oral leukoplakia (OLK) is the most prevalent OPMDs recognized by the World Health Organization (WHO).3,4 Based on observational 24 studies, Warnakulasuriya et al5,6 estimated OLK overall (mean) malignant transformation rate to 3.5% (405/11423), and the malignant transformation may range from 0.13% to 34.0% increasing with the degree of epithelial dysplasia.7–9 The mechanism of OLK progression remains unclear, which seriously affects clinical treatment.
In 1961, Hayflick first discovered that cell proliferation was limited in human fibroblasts, named the Hayflick limit, yet cells entered a state of cellular senescence. Molecular indicators of cell senescence mainly include inhibition of cell proliferation, increased activity of senescence-associated beta-galactosidase (SA β-gal), decreased ability for DNA damage repair and telomere shortening.10 At present, the classical signaling pathways of cellular senescence include p53/p21Cip1 and p16INK4a/Rb, which interact with each other but independently regulate the cell cycle.11 Recent studies have reported that there are abundant senescent cells in some precancerous lesions,12 suggesting that these senescent cells may play important roles in malignant transformation. The correlation between OLK and cell senescence has rarely been reported, with no clear and intensive studies on the mechanism of OLK cell senescence currently available.
It is indicated that the main function of peroxiredoxin1 (Prx1), mainly located in the cytoplasm and nucleus, is antioxidant.13,14 Recent research has reported that Prx1 exerts anti-aging effects, and a decrease in Prx1 expression can accelerate the senescence of rodents.15 Additionally, Prx1 is associated with mitophagy.16 In our previous studies, Prx1 expression was found to be increased in human OLK and OSCC tissues and was positively correlated with oral carcinogenesis. Prx1 knockdown inhibited oral carcinogenesis and metastasis in a 4NQO-induced tongue OLK animal model and OSCC xenograft model.17,18 Using bioinformatic analysis, we found that Prx1 was involved in mitophagy and cell senescence pathways in the human dysplastic oral keratinocyte (DOK) cells.19 Currently, the role of Prx1-induced cell senescence in OLK malignant transformation has not been reported. In this study, we explored the mechanism by which Prx1 regulates cell senescence in OLK carcinogenesis in a 4NQO-induced tongue carcinogenesis model in Prx1+/+ and Prx1+/- mice, as well as in DOK cells.
Materials and Methods
Cell Culture and shRNA Prx1 Transfection
The DOK cells (ECACC 94122104, purchased from European Collection of Authenticated Cell Cultures data bank) were gifted by Dr Qianming Chen from West China Medical center, China. The cell lines were cultured in high-glucose Dulbecco’s modified Eagle’s medium (DMEM-High glucose, Gibco, USA) containing 10% fetal bovine serum (FBS, Gibco, USA), 1% penicillin/streptomycin (Beyotime, China) and 5µg/mL hydrocortisone (Beyotime, China) in a humidified atmosphere of 5% CO2 and 95% air at 37 °C. DOK cells were transfected with negative control (NC) or shPrx1 (5ʹ-CTCTTGACTTCACCTTTGTGT-3ʹ, Gene chem China) and the stable Prx1 knockdown DOK cells were selected by 1 µg/mL puromycin (Sigma, USA) for 7 days. The study was approved by the Ethics Committee of Beijing Stomatological Hospital (Approval No. A-2020-01)
Animal Studies
All animal experiments were carried out and performed according to the Beijing Municipality on the Review of Welfare and Ethics of Laboratory Animals guidelines and all animal procedures were approved by the Animal Ethical and Welfare Committee of Beijing Stomatological Hospital (Approval No. KQYY-201809-001).
Wild type (Prx1+/+, C57BL/6) mice and Prx1 knockdown (Prx1+/−, C57BL/6) mice, 6–8 weeks old and weighing 25–30g, were established in our laboratory as described previously.20 In this study, we employed the tongue carcinogenesis model induced by 4NQO under the guidance of our previous study.21 Prx1+/+ (n=15, eight male and seven female) and Prx1+/- (n=15, eight male and seven female) mice were divided randomly into control groups (n=5) and 4NQO-treated groups (n=10), respectively. Control groups were fed with regular distilled water and experimental groups were provided with water containing 50μg/mL 4NQO for 16 weeks and were then provided distilled water. At the end of another 8 weeks, the mice were euthanized and tongues were removed, then cell senescence and mitophagy were analyzed based on histopathological stages.
Hematoxylin and Eosin (H&E) Staining
Each tongue tissue was cut into 4 μm-thick sections continuously for H&E staining and were observed via Olympus BX61 microscope (Olympus, Tokyo, Japan). According to the World Health Organization classification of head and neck tumors (fourth edition, 2017), histological changes in tongue mucosa were validated by two pathologists including normal mucosa, epithelial hyperplasia, epithelial dysplasia and OSCC. The diagnosis of epithelial dysplasia is practiced according to the WHO guidelines for pathology reporting based on the structure and the cell morphology in epithelium.
SA β-Gal Staining
SA β-gal activity was confirmed by the SA β-gal staining kit (sigma, 11828673001) according to the protocol. Senescent cells were observed as blue-stained cells by microscopy. More than 500 cells in five random fields were counted to evaluate the percentage of SA β-gal-positive cells.
Tissues removed from C57/BL6 mice were placed in an O.C.T compound (Sakura, 4583). Tissue sections, 6μm thick, were obtained by using a cryostat (Leica CM1850, Germany) and 10% formalin-fixed for 15 minutes, washed with PBS twice then incubated with X-gal staining solution at 37°C without CO2 for 18 hours.
Flow Cytometry for Cell Cycle
DOK cells were harvested using 0.25% trypsin (Hyclone, USA), centrifuged (1100 r/min), and rinsed twice with cold PBS for cell cycle analysis. The pellet was resuspended in ice-cold 70% ethanol overnight at 4°C. Cells were subsequently harvested, incubated with RNase A (100μg/mL, Sigma, USA) for 30 minutes at 37°C, followed with propidium iodide (20μg/mL, BD Biosciences, USA), and analyzed using ModfitFL32 (BD Accuri™ C6 PLUS, BD Biosciences).
Western Blot
Whole-cell lysates were obtained and denatured in a 5×SDS loading buffer at 100°C for 10 minutes with the guidance as described previously.17 Proteins in the samples were separated by SDS-PAGE (Biorad, 1611210), semi-dry electrophoretic transferred to PVDF membrane (Biorad, 1704156), and analyzed using the specified antibodies and an ECL detection system (Thermo Fisher Scientific) with Hsp90 used as a loading control. The primary antibodies were incubated as follows: anti-Prx1 (1:2000, Abcam), anti-p53 (1:1000, CST), anti-p21 (1:2000, Abcam), anti-CDK2 (1:1000, Abcam), anti-CDK4 (1:2000, Abcam), anti-CDK6 (1:500,CST), anti-PHB2 (1:10000, Abcam), anti-LC3B (1:1000, Abcam) and anti-Hsp90 (1:2000, Santa).
Immunohistochemistry Analysis
Immunohistochemistry (IHC) staining was performed to detect the expression of senescence and mitophagy proteins. After antigens repaired, all sections were incubated with the primary antibody overnight at 4°C after blockage of endogenous peroxidases. The primary antibodies were used as follows: anti-Ki67 (Maixin), anti-wtp53 (1:300, Bioss), anti-p21 (1:300, Bioss), anti-CDK2 (1:50, Abcam), anti-CDK4 (1:100, Bioss), anti-CDK6 (1:400, Bioss), anti-PHB2 (1:200, Abcam) and anti-LC3 (1:100, Abcam). Next, the sections were incubated with secondary antibody (Maixin, China) at 37°C for 30 minutes. Finally, slides were evaluated using the brown DAB precipitate (Maixin, China) and were performed with hematoxylin.
All sections were observed under the microscope (Olympus BX61, Japan) to randomly select three regions at 200× magnification. Image-Pro Plus software was used for MOD quantitative analyses (MOD = integral optical density/measurement area).
Real-Time Quantitative PCR (qRT-PCR)
Total RNA was extracted from mice tongue tissues by TRIZOL (Thermo Fisher Scientific, USA) according to the directions. cDNA was synthesized by reverse transcribing 2ug RNA with a cDNA Reverse Transcription Kit (CoWinBioscinces, China). One-microliter aliquots of cDNA were used as templates. qRT-PCR was conducted using SYBR Green PCR Master Mix (CoWinBioscinces, China) on a Step One Plus Real-Time PCR System (Biorad, USA). All primers, listed in Table 1, were designed and compounded by Sangon Biotech (Shanghai, China).
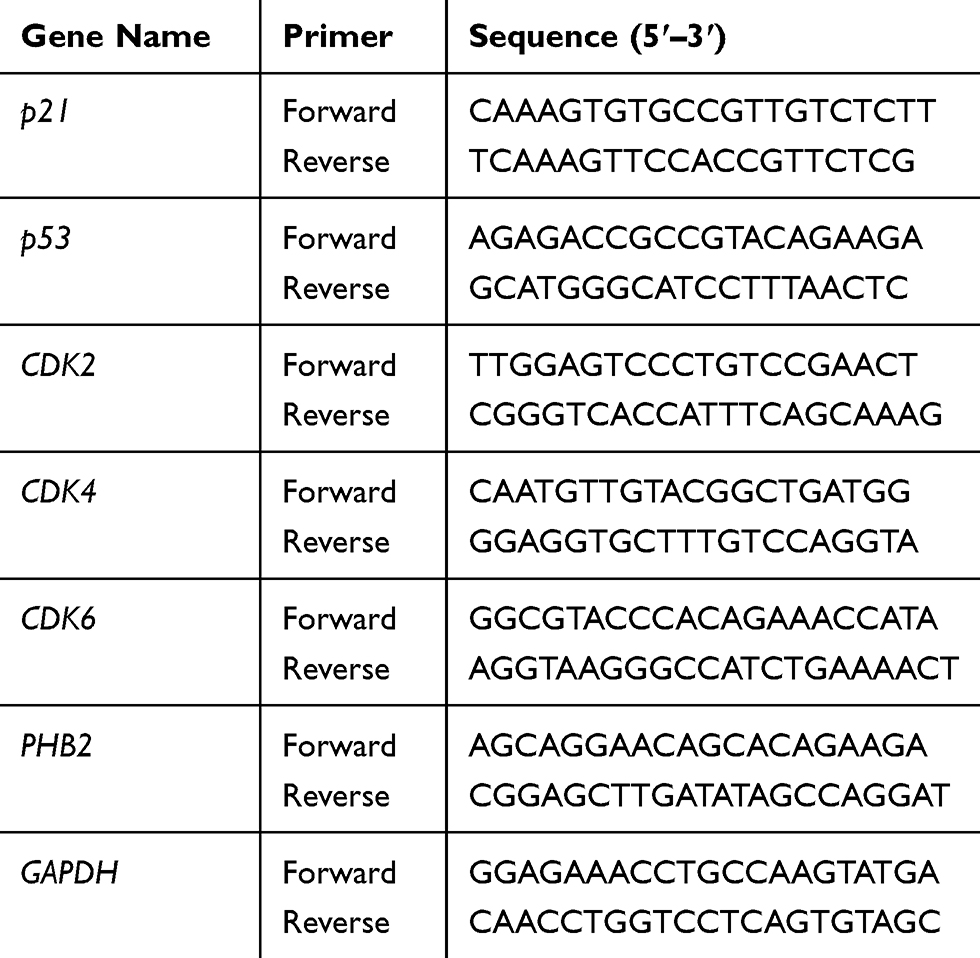 |
Table 1 The Primers Used in qRT-PCR |
Protein–Protein Docking
Docking of Prx1 (PDB ID:4xcs) with PHB2 (PDB ID:6iqe) and LC3B (PDB ID:5xad) were performed using ZDOCK and RDOCK from Discovery Studio 2016.22 The docking poses were ranked by the ZRANK algorithm and the best docked pose was selected based on evaluation of binding interface residue. The top-ranked structures were further visualized by Discovery Studio (DS) and Ligplot+ v.2.2.
Duolink Analysis
Paired proximity ligation assay (PLA) probes were used to probe two primary antibodies targeting Prx1 and its interacting proteins in mice sections. It is used to detect the interaction between two proteins with high sensitivity and specificity in situ. The experimental steps were performed as described previously.19
Statistical Analysis
Statistical analysis was performed using the SPSS 18.0 statistical software (SPSS, Chicago, USA). All data are shown as mean ± standard deviations. The tumor incidence was compared by chi-square test (χ2 test). The statistical difference was analyzed by the Student’s t-test or a one-way analysis of variance (ANOVA) and p<0.05 was considered statistically significant.
Results
Prx1 Knockdown Inhibits 4NQO-Induced Mouse Tongue Carcinogenesis
In 4NQO-treated Prx1+/+ groups, the weight of mice was significantly decreased than that in control groups (p<0.05). The weight was no statistically significant difference in 4NQO-treated Prx1+/- mice, compared with 4NQO-treated Prx1+/+ mice (p>0.05). Histologically, as shown in Figure 1A, 4NQO treatment induced epithelial hyperplasia, dysplasia (mild, moderate and severe), carcinomas in situ and OSCC in mouse tongue mucosa. The malignant transformation rate in Prx1+/- mice (37.5%) was significantly lower compared with Prx1+/+ mice (57.1%, Figure 1B, p< 0.05).
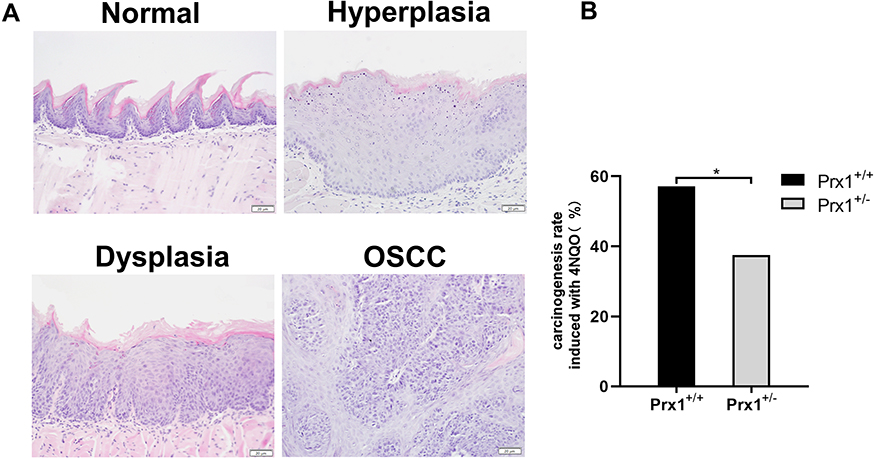 |
Figure 1 Histopathology of the tongue tissues in Prx1+/+ and Prx1+/- mice. (A) The representative H&E staining of mouse tongue including normal, hyperplasia, dysplasia and OSCC (magnification 200×). (B) The carcinogenesis rate induced with 4NQO in Prx1+/+ and Prx1+/- mice (*p<0.05). |
Numerous Senescent Cells Exist in Tongue Hyperplastic and Dysplastic Tissues in Mice
As shown in Figure 2A, SA β-gal activity was significantly increased in the hyperplastic and dysplastic tongue tissues when compared with normal and OSCC tongue tissues in wild-type mice. Additionally, Ki67 (a mitotic marker) positive rates increased with the progression of OLK in Prx1+/+ mice. Compared with the normal tissues, the positive rate of Ki67 was increased in the hyperplasic tissues, with no statistically significant difference (p>0.05). Compared with the normal tissues, Ki67-positive rate was significantly increased in the dysplastic tissues, with a further increase observed in OSCC tissues when compared with the dysplastic tissues (p<0.01, Figure 2B and C).
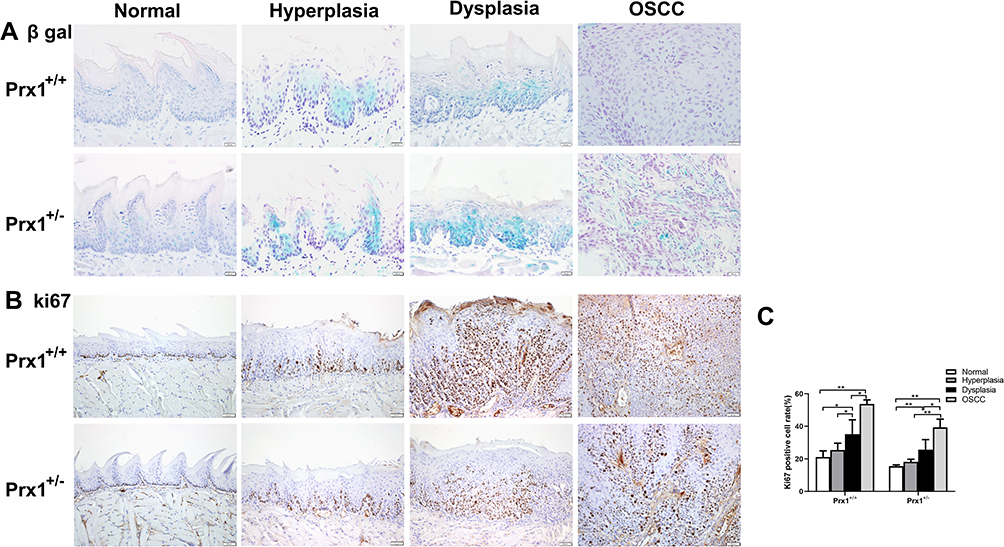 |
Figure 2 The levels of cellular senescence in tongue tissues from Prx1+/+ and Prx1+/- mice. (A) Representative β-gal staining in tongue tissues from Prx1+/+ and Prx1+/- mice in each group. (B and C) In each group, Ki67 was measured in the tongue tissues by IHC and the percentage of Ki67-positive cells was analyzed (magnification: 200×, data represent mean values ± SD, *p <0.05, **p<0.01). |
Prx1 Knockdown Induces Cell Senescence in Mouse Tongue Tissues
To elucidate the mechanisms of cell senescence, we established a tongue carcinogenesis animal model in Prx1+/+ and Prx1+/- mice. We observed that SA β-gal activity was higher in the tongue epithelium of Prx1+/- mice than that in Prx1+/+ controls (Figure 2A). In the hyperplastic and dysplastic tissues, the percentage of Ki67-positive cells was significantly lower in Prx1+/- mice than that in Prx1+/+ mice (p<0.05) There was no significance of the positive rate of ki67 in normal tissues compared Prx1+/- mice to Prx1+/+ mice (p>0.05). As shown in Figure 2B and C, the Ki67-positive rate significantly increased in dysplastic tissues compared with the normal group, with a further increase observed in the OSCC tissues compared with dysplastic tissues in Prx1+/- mice (p<0.01).
Prx1 Knockdown Upregulates p53 and p21 in Tongue Hyperplastic and Dysplastic Tissues in Mice
As shown in Figure 3A and B and D and E, the wild-type p53 (wt-p53) and p21 protein expression levels, detected with IHC staining were significantly increased in the tongue epithelial tissues of the Prx1+/+ mice hyperplastic and dysplastic tissues when compared with those in the OSCC and normal tissues (p<0.01). Compared with the hyperplastic tissues in Prx1+/+ mice, wt-p53 expression in the dysplastic tissues was significantly increased (p<0.01), with no significant difference observed in the increased expression of p21 (p>0.05). Meanwhile, the wt-p53 and p21 expression levels in the OSCC tissues were significantly decreased when compared with those in the tongue dysplastic tissues (p<0.01).
 |
Figure 3 The levels of wt-p53 and p21 in tongue tissues from Prx1+/+ and Prx1+/- mice. (A and B) wt-p53 protein levels measured by IHC. (C) p53 mRNA levels detected by qRT-PCR; (D and E) p21 protein levels measured by IHC. (F) p21 mRNA levels detected by qRT-PCR analysis in tongue tissues. (magnification: 200×, value represent mean ± SD, *p<0.05; **p<0.01). |
In Prx1+/- mice, compared with Prx1+/+ mice, p21 expression was significantly increased in the normal, dysplastic, and OSCC tissues (p<0.05, p<0.01, p<0.01, Figure 3D and E), and p53 expression significantly increased in the normal and tongue hyperplastic tissues in Prx1+/- mice (p<0.05, Figure 3A and B). Compared with the normal and OSCC tissues in Prx1+/- mice, the expression of wt-p53 (Figure 3A and B) and p21 (Figure 3D and E) increased significantly in the tongue dysplastic tissues (p<0.01), with only wt-p53 expression significantly increased in tongue hyperplastic tissues of Prx1+/- mice (p<0.05). qRT-PCR analysis showed that p53 and p21 mRNA expression levels were similar to those of protein expression (p<0.05, Figure 3C and F). This further confirmed that there were a high number of senescent cells in OLK tissues.
Prx1 Knockdown Affects CDK2, CDK4 and CDK6 Expression in Mouse Tongue Tissues
Next, we examined the effects of Prx1 on the cell cycle. As shown in Figure 4A and B, the protein levels of CDK2 in the tongue hyperplastic and dysplastic tissues were lower than those observed in the OSCC tissues in both Prx1+/+ and Prx1+/- mice (p<0.05, p<0.01). Compared with Prx1+/+ mice, Prx1 knockdown decreased CDK2 protein expression in the hyperplastic, dysplastic, and OSCC tissues in Prx1+/- mice (p<0.01). There was no significance of CDK2 expression in normal tissues compared Prx1+/- mice to Prx1+/+ mice (p>0.05). qRT-PCR analysis revealed that CDK2 mRNA expression in the OPL and OSCC groups showed similar changes when compared with the protein expression (p<0.05, Figure 4C).
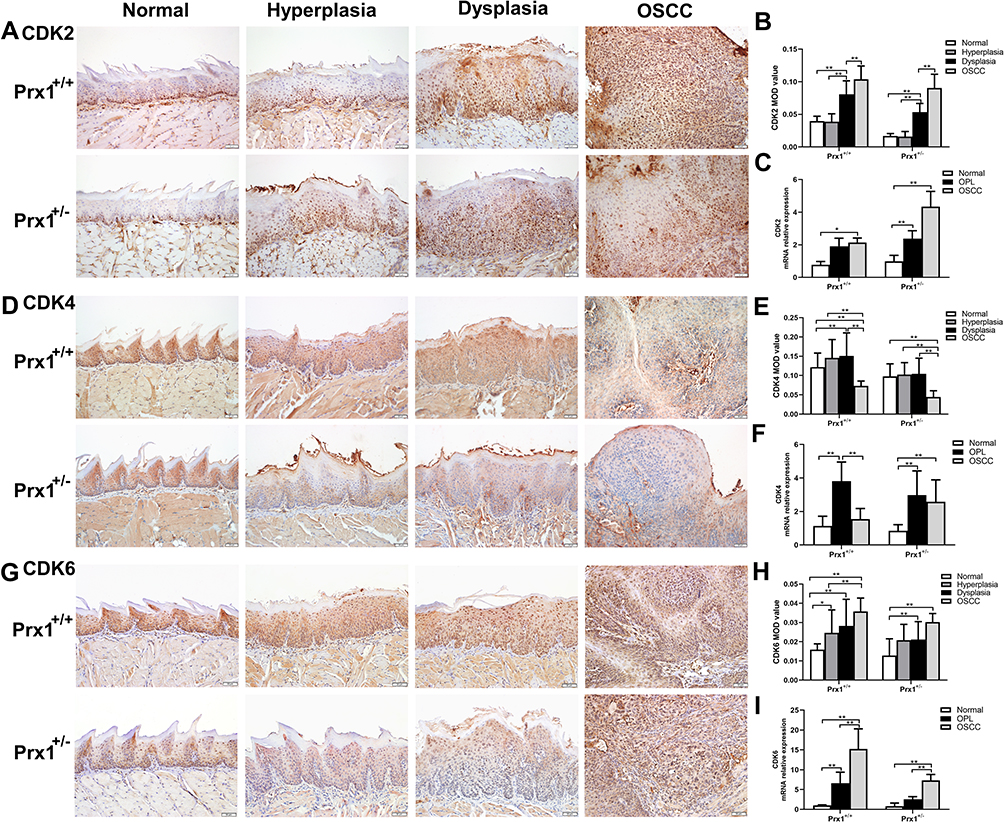 |
Figure 4 The levels of cell cycle relative proteins CDK2, CDK4 and CDK6 in tongue tissues from Prx1+/+ and Prx1+/- mice. (A and B) CDK2 protein levels measured by IHC; (C) CDK2 mRNA levels detected by qRT-PCR analysis in tongue tissues. (D and E) CDK4 protein levels measured by IHC; (F) CDK4 mRNA levels detected by qRT-PCR analysis in tongue tissues. (G and H) CDK6 protein levels measured by IHC. (I) CDK6 mRNA levels detected by qRT-PCR analysis in tongue tissues. (magnification: 200×, value represent mean ± SD, *p<0.05; **p<0.01). |
Furthermore, CDK4 protein and mRNA expression were upregulated in the tongue hyperplastic and dysplastic tissues when compared with that in the OSCC tissues in Prx1+/+ mice (p<0.01, Figure 4D–F). In Prx1+/+ mice, compared with the normal tissues, CDK4 protein and mRNA expression levels were significantly increased in OPL group (p<0.01). Prx1 knockdown decreased CDK4 protein expression in the tongue hyperplastic and dysplastic tissues when compared with those in wild-type mice (p<0.01). There were no statistically significant differences in CDK4 expression in normal tissues compared with Prx1+/- mice to Prx1+/+ mice (p>0.05).
In addition, as shown in Figure 4G and H, compared with the normal tissues, the protein expression of CDK6 in the tongue hyperplastic, dysplastic and OSCC tissues was upregulated (p<0.05, p<0.01, p<0.01). And the protein expression of CDK6 from tongue hyperplastic tissues was lower than that observed in the OSCC tissues in Prx1+/+ mice (p<0.01). The expression of CDK6 in the tongue dysplastic and OSCC tissues were higher than that in normal tissues in Prx1+/- mice (p<0.01). Compared with Prx1+/+ mice, Prx1 knockdown decreased CDK6 protein expression in the dysplastic tissues (p<0.01). There were no statistically significant differences of CDK6 expression in normal, hyperplastic and OSCC tissues compared with Prx1+/- mice to Prx1+/+ mice (p>0.05). qRT-PCR analysis showed that the change of CDK6 mRNA expression was similar to those of protein expressions (p<0.05, Figure 4I).
Prx1 Knockdown Induced Cell Senescence and Mitophagy in DOK Cells
We assessed cell senescence using SA β-gal staining in NC and shPrx1 DOK cells. As shown in Figure 5A, an increased number of positively stained cells were detected, with flattened and enlarged morphology, in shPrx1 DOK cells than those in NC cells (p<0.01). Western blotting was used to detect the expression of cell senescence and mitophagy-related proteins. Prx1 knockdown significantly increased the expression of p53 and p21 in DOK cells (p<0.01, Figure 5B) and decreased the expression of CDK4, CDK2 and CDK6 (p<0.01, p<0.05, Figure 5B). In shPrx1 DOK cells, the percentage of cells in the G1 phase was higher than that in NC DOK cells (76.97 ± 8.49% versus 68.43 ± 2.06%, p<0.05, Figure 5C and D), suggesting that Prx1 knockdown DOK cells were arrested at the G0/G1 phase when compared with NC cells. Additionally, Prx1 knockdown resulted in a significant reduction in PHB2 and LC3II expression (p<0.01, p<0.05, Figure 5B).
 |
Figure 5 Prx1 knockdown induced DOK cell senescence. (A) shPrx1 DOK cells are larger in appearance, with an increase in SA-β-gal-positive cells (*p<0.05, **p<0.01). (B) The expression of senescence and mitophagy-related proteins in shPrx1DOK cells. The relative levels of protein were normalized to Hsp90 used as an internal control. Values presented as means ±SD for three experiments (*p<0.05; **p<0.01). (C and D) Mitotic indices of DOK from NC and shPrx1 groups. Graphs represent the percentages of cells in G0/G1, S, and G2/M phases of the cell cycle. An increase in the percentage of cells in the G0/G1 phase and a decrease in the percentage of cells in the S phase can be observed in shPrx1 cells (*p<0.05, **p<0.01). |
Prx1 Knockdown Downregulates PHB2 and LC3II in Mouse Tongue Tissues
It has been widely recognized that mitophagy acts on cell senescence.23 To further explore whether Prx1 mediates mitophagy to regulate cell senescence, we examined the expression of mitophagy markers. As shown in Figure 6, compared with the control group, the expression of PHB2 and LC3II was significantly increased in the tongue hyperplastic and dysplastic tissues of Prx1+/+ mice (p<0.01, p<0.05). In addition, the expression levels of PHB2 and LC3II in the OSCC tissues were significantly lower than those in the dysplastic tongue tissues in Prx1+/+ mice (P<0.01). In Prx1+/+ mice, a higher level of LC3II expression was observed in the tongue dysplastic tissues than that in the tongue hyperplastic tissues (p<0.01).
 |
Figure 6 The levels of mitophagy markers PHB2 and LC3 in tongue tissues from Prx1+/+ and Prx1+/- mice. (A and B) PHB2 protein levels measured by IHC. (C) PHB2 mRNA levels detected by qRT-PCR in tongue tissues. (D and E) LC3 protein levels were measured by IHC. (magnification: 200×, value represent mean ± SD, *p<0.05; **p<0.01). |
Compared with the wild-type mice, Prx1 knockdown significantly inhibited the expression of PHB2 and LC3II in the dysplastic tissues (p<0.05, p<0.01, Figure 6A and B and D) though the downregulation of PHB2 and LC3II in normal tissues, hyperplastic tissues and OSCC tissues was no significant difference (p>0.05). Furthermore, the expressions of PHB2 and LC3II in the hyperplastic and dysplastic tissues were significantly upregulated when compared with that in the normal tissues in Prx1+/- mice (p<0.01, p<0.05). In Prx1+/- mice, PHB2 and LC3II expression levels were lower in OSCC tissues than those in the hyperplastic tissues (p<0.01). qRT-PCR analysis showed that the change of PHB2 mRNA expression was similar to that of protein expression (Figure 6C).
Prx1 is Involved in Mitophagy by Interacting with PHB2 and LC3 in Mouse Tongue Tissues
Using the Discovery Studio (DS) 2016 ZDOCK program, every possible Prx1-PHB2 and Prx1-LC3B binding pose in 3D space was calculated and evaluated, and each pose was scored using an energy-based scoring function. The ZDOCK docking results indicated that Prx1-PHB2 and Prx1-LC3B exhibited surface complementarity in the interface area (Figure 7A and C). The hydrophobic effect and H-bond interaction of Prx1-PHB2 and Prx1-LC3B were analyzed by DS2016 and Ligplot+ v.2.2. Prx1 Asp122 and Glu123 formed H-bonds with PHB2 (Figure 7B). Prx1 Cys52(A), Lys92(A) and Prx1 Lys178(B) formed H-bonds with LC3B (Figure 7D and E). These data suggest that Prx1 binds to PHB2 and LC3B. Additionally, we confirmed the interactions of Prx1 with PHB2 and LC3B in the mouse tongue tissues by in situ Duolink analysis (Figure 8A and B). PLA signals indicated that Prx1 combined with PHB2 and LC3 to mediate mitophagy and suppress OLK malignant transformation.
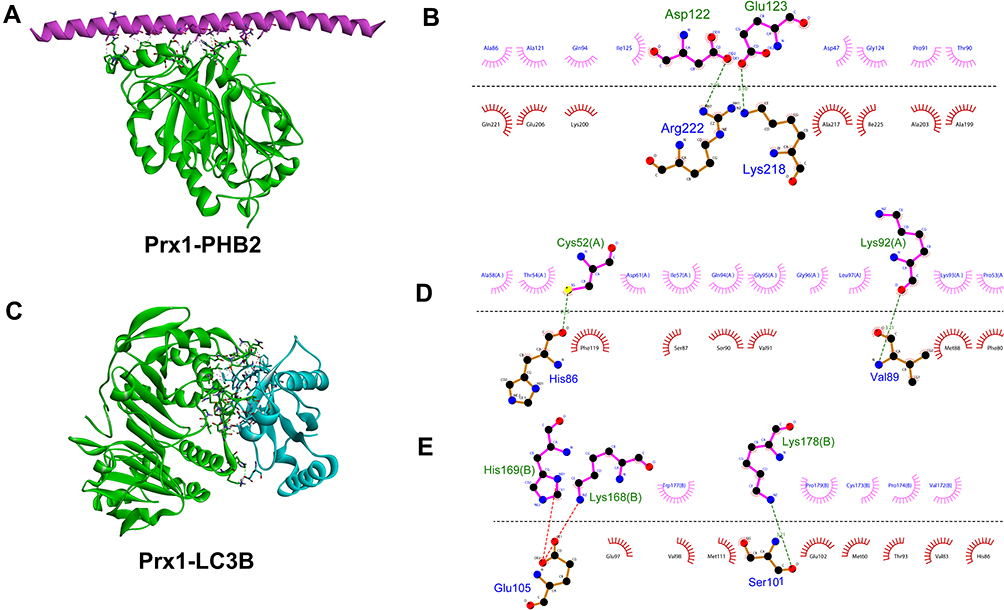 |
Figure 7 The interaction between Prx1 and PHB2 or LC3B. (A) Structure of Prx1 bound to PHB2. Prx1 is shown in cyan, and PHB2 is shown in red. (B) Prx1-PHB2 interaction plot. Prx1 residues are shown in pink above the dashed line, and PHB2 residues are shown in red beneath the dashed line. Hydrogen bonds are shown as green dashed lines. The arcs represent the other residues involved in the Prx1 interaction. (C) Structure of Prx1 bound to LC3B. Prx1 is shown in cyan and LC3B is shown in blue (D and E). Prx1(A)-LC3B and Prx1(B)-LC3B interaction plot. Prx1 residues are shown in pink above the dashed line, and LC3B residues are shown in red beneath the dashed line. The images were constructed using Discovery Studio (DS) 2016 and Ligplot+ v.2.2. |
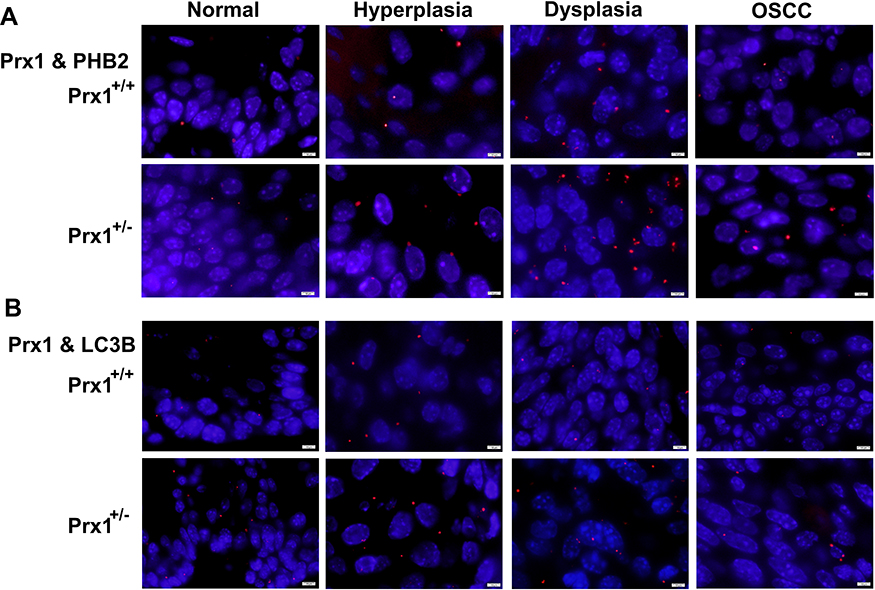 |
Figure 8 The PLA of Duolink analysis. The interactions of Prx1 with PHB2 (A), LC3B (B) in tongue tissues from Prx1+/+ and Prx1+/- mice were detected by in situ Duolink analysis. PLA signal was red and the nuclei was blue. (magnification: 1000×). |
Discussion
Recent studies have revealed that there are abundant senescent cells in premalignant lesions, while minimal cell senescence is present in malignant cancers.24,25 Once induced by relative regulatory factors, the cells can acquire an infinite proliferation ability and even malignant transformation with the escape of cell senescence in the premalignant lesions.26 It suggests that cell senescence acts as a barrier to cancer and plays a key role in preventing the malignant transformation of some precancerous lesions. However, it has been reported that cell senescence can also accelerate tumor invasion and migration via the action of senescence-associated secretory phenotype (SASP) through both autocrine and paracrine pathways.27
Notably, p53 is recognized as the main regulator of cellular senescence, and the wt-p53 gene is a tumor suppressor that causes permanent cell cycle arrest at the G1 phase.28 As a downstream gene of p53, p21 plays the role of a cyclin-dependent kinase inhibitor to negatively regulate the cell cycle.29 Various cell senescence-related molecular markers, including p21, p16, p53 and Rb, have demonstrated higher expression in precancerous epithelial cells of the esophagus, pancreas, and larynx than those in corresponding normal and malignant tumors.30 SA β-gal has been widely used in vitro31 and in vivo32 as an indicator of cell senescence. In this study, we observed that SA β-gal activity significantly increased in hyperplastic and dysplastic tongue tissues when compared with that in OSCC tissues. Simultaneously, the expression levels of wt-p53 and p21 were also considerably higher in hyperplastic and dysplastic tongue tissues. This indicates that there are more senescent cells in oral precancerous tissues, suggesting that senescent cells prevent most oral precancerous lesions from transforming into OSCC. However, the mechanism of cell senescence in oral carcinogenesis remains ambiguous. In the present study, we observed that there were more senescent cells in the dysplastic tongue tissues than that in hyperplastic tongue tissues. As an important feature, heterogeneous cell populations in precancerous lesions could explain the number of senescent cells present in dysplastic tongue tissues, as well as the relationship between proliferation and senescence in precancerous lesions. When senescent cells account for majority of lesions, it limits the deterioration of precancerous lesions. In contrast, under oxidative stress or other factors, if the balance between senescence and proliferation is disrupted, the cells undergo cancerous modifications favorable to proliferation, even invasion, and migration.33
Prx1, an antioxidant enzyme, protects cells by removing reactive oxygen species (ROS). Previous studies indicate that Prx1 is strongly linked to the development of various malignant tumors, such as proliferation, differentiation, invasion, and migration.14 Our previous studies have revealed that the expression of Prx1 was increased in human OLK and OSCC tissues, positively correlating with OLK progression. Prx1 knockdown inhibited oral precancerous lesion progression and OSCC metastasis in a 4NQO-induced animal model and OSCC xenograft model.17,34 In this study, we confirm that Prx1 knockdown can decrease the malignant transformation rate of tongue mucosa in mice. Recent studies have shown that Prx1 is involved in cell senescence. Several cells with SA β-gal activity were detected in the liver, lung, intestine, and uterus of Prx1-/- mice.33 In our previous study, some aging signs were additionally observed in Prx1+/- mice. In this study, we found that Prx1 knockdown enhanced SA β-gal activity and the expression of p53 and p21 in oral precancerous lesion cells in vivo and in vitro. It suggests Prx1 knockdown induces cell senescence.
Cell cycle abnormalities are one mechanism of tumorigenesis, which is associated with the activity of four cyclin-dependent kinases (CDK1, CDK2, CDK4, and CDK6). It has been suggested that cell cycle arrest is induced by p53 during senescence.35 G1 phase arrest results in cell senescence. The G1/S-phase transition is regulated by interactions of CDK4/6 and CDK2 complexes with retinoblastoma protein (Rb) and inhibitors of Cip/Kip or Ink4a family.36,37 CDK activity is regulated by p21 and is involved in cell cycle regulation. CDK2 and CDK6 overexpression can lead to tumor development, it was significantly correlated with tumor differentiation, invasion and metastasis.38,39 CDK4 can be inhibited by p21 to prevent the phosphorylation of Rb and maintain cell stagnation in the G1 phase.40 CDK4 expression was obviously increased with grade of dysplastic oral leukoplakia.39 In this study, we observed that the expression level of CDK2 and CDK6 was lower in Prx1+/+ mouse tongue hyperplastic and dysplastic tissues than those in the OSCC tissues. Prx1 knockdown resulted in CDK2 and CDK6 expression decrease in the tongue hyperplastic and dysplastic tissues. Furthermore, the shPrx1 DOK cells were arrested at the G1 phase, and the expression of CDK2 and CDK6 was decreased when compared with that observed in the normal control. These data suggest that Prx1 knockdown induces cell senescence by decreasing CDK2 and CDK6 expression.
In addition, in the present study, CDK4 expression was upregulated in the Prx1+/+ mouse tongue hyperplastic and dysplastic tissues when compared with that in the OSCC tissues. Prx1 knockdown decreased CDK4 expression in tongue hyperplastic and dysplastic tissues and DOK cells. It has been reported that CDK4 can active pRB provides feedback to inhibit p16 expression.41 We speculate that CDK4 is co-regulated by p21 and p16, and there may be positive and negative feedback modulation mechanisms during cell senescence to restore balance in the cell cycle. Complex regulatory mechanisms could dynamically regulate CDK4 and the cell cycle in oral carcinogenesis.
Reportedly, mitophagy affects cell senescence.23,42 In normal cells, the role of p53 in mitophagy has been introduced in recent reports, but the regulation of mitophagy by p53 in tumor cells remains poorly understood.43 Prohibitins are sometimes located in the nucleus and induce the transcriptional activity of p53 and other transcription factors.44,45 Our previous study predicted that Prx1 bound to PHB2, associated with mitophagy, in DOK cells by proteomic analysis.19 Studies have shown that PHB2 induces oxidative stress, causing aging-related diseases, including tumors, diabetes, and neurodegenerative diseases.16 PHB2, located in the inner mitochondrial membrane, regulates mitochondrial assembly, and plays an important role in mitophagy.46,47 LC3II, which is converted from LC3I using phosphatidylethanolamine, is associated with autophagosome formation.48 To further explore whether Prx1 regulates cell senescence by mediating mitophagy, we examined the expression of mitophagy markers. Prx1 knockdown led to an obvious decrease in PHB2 and LC3II expression in tongue hyperplastic and dysplastic tissues in mice and DOK cells.
To predict the interaction and binding sites of Prx1 and PHB2 or LC3B in detail, Discovery Studio (DS) 2016 and Ligplot+ v.2.2 were used to construct 3D and 2D structures of Prx1 interactions of PHB2 and LC3B to analyze the key residues involved in the interface between Prx1 and PHB2 or LC3B. As demonstrated, one of the key residues for Prx1 (Cys52 A) bound to Ser383, located in LC3B, by forming hydrogen bonds. The other residues of Prx1 (92, 78, 169, 168, 178, 122 and 133) were also involved in hydrogen or hydrophobic interactions with LC3B and PHB2. The above docking results indicate that Prx1 may combine with PHB2 and LC3B. Duolink analysis showed that Prx1 can interact with PHB2 and LC3 in mice tongue hyperplastic and dysplastic tissues, indicating that Prx1/PHB2/LC3 forms complexes and induces mitophagy. Reportedly, mitophagy activation can remove ROS and dysfunctional mitochondria during senescence.49 Mitophagy induces senescence and cell cycle arrest by selectively inhibiting components of SASP, which is a phenotype of cell senescence.42,50 Collectively, these data suggest that Prx1 regulates cell senescence by mediating mitophagy in OLK.
Conclusions
We found, for the first time, Prx1 silencing induces cell senescence by mediating p53/p21 pathway and mitophagy dependent on its binding to PHB2/LC3B, which then inhibits OLK malignant transformation. Prx1 is a potential molecular target for the prevention of oral carcinogenesis.
Abbreviations
OSCC, oral squamous cell carcinoma; OLK, oral leukoplakia; Prx1, peroxiredoxin1; wt-p53, wild-type p53; CDK2, cyclin-dependent kinase 2; CDK4, cyclin-dependent kinase 4; CDK6, cyclin-dependent kinase 6; PHB2, prohibitin2; LC3, light chain 3; ROS, reactive oxygen species; 4NQO, 4-nitro-quinoline-1-oxide; SDS-PAGE, sodium dodecyl sulfate-polyacrylamide gel electrophoresis; DMEM-High glucose, high-glucose Dulbecco’s modified Eagle’s medium; FBS, fetal bovine serum; SA β-gal, senescence-associated beta-galactosidase; PLA, proximity ligation assay.
Acknowledgments
We would like to thank Prof. Qianming Chen for the assistance on this project.
Funding
This research was funded by the Beijing Natural Science Foundation of China (7192075).
Disclosure
The authors declare no conflict of interest.
References
1. Mello FW, Miguel AFP, Dutra KL, et al. Prevalence of oral potentially malignant disorders: a systematic review and meta-analysis. J Oral Pathol Med. 2018;47(7):633–640. doi:10.1111/jop.12726
2. Iocca O, Sollecito TP, Alawi F, et al. Potentially malignant disorders of the oral cavity and oral dysplasia: a systematic review and meta-analysis of malignant transformation rate by subtype. Head Neck. 2020;42(3):539–555. doi:10.1002/hed.26006
3. Warnakulasuriya S. Oral potentially malignant disorders: a comprehensive review on clinical aspects and management. Oral Oncol. 2020;102:104550. doi:10.1016/j.oraloncology.2019.104550
4. Pinto AC, Caramês J, Francisco H, et al. Malignant transformation rate of oral leukoplakia-systematic review. Oral Surg Oral Med Oral Pathol Oral Radiol. 2020;129:600–611.e2. doi:10.1016/j.oooo.2020.02.017
5. Jayasooriya PR, Dayaratne K, Dissanayake UB, et al. Malignant transformation of oral leukoplakia: a follow-up study. Clin Oral Investig. 2020;24(12):4563–4569. doi:10.1007/s00784-020-03322-4
6. Warnakulasuriya S, Ariyawardana A. Malignant transformation of oral leukoplakia: a systematic review of observational studies. J Oral Pathol Med. 2016;45(3):155–166. doi:10.1111/jop.12339
7. Mehanna HM, Rattay T, Smith J, et al. Treatment and follow-up of oral dysplasia - a systematic review and meta-analysis. Head Neck. 2009;31(12):1600–1609. doi:10.1002/hed.21131
8. Mithani SK, Mydlarz WK, Grumbine FL, et al. Molecular genetics of premalignant oral lesions. Oral Dis. 2007;13(2):126–133. doi:10.1111/j.1601-0825.2006.01349.x
9. Vokes EE, Weichselbaum RR, Lippman SM, et al. Head and neck cancer. N Engl J Med. 1993;328(3):184–194. doi:10.1056/NEJM199301213280306
10. Hayflick L, Moorhead PS. The serial cultivation of human diploid cell strains. Exp Cell Res. 1961;25:585–621. doi:10.1016/0014-4827(61)90192-6
11. He S, Sharpless NE. Senescence in health and disease. Cell. 2017;169(6):1000–1011. doi:10.1016/j.cell.2017.05.015
12. Campisi J. Aging, cellular senescence, and cancer. Annu Rev Physiol. 2013;75:685–705. doi:10.1146/annurev-physiol-030212-183653
13. Jeong S-J, Kim S, Park J-G, et al. Prdx1 (peroxiredoxin 1) deficiency reduces cholesterol efflux via impaired macrophage lipophagic flux. Autophagy. 2018;14(1):120–133. doi:10.1080/15548627.2017.1327942
14. Zhu Z, Zheng X, Li D, et al. Prx1 promotes the proliferation and migration of vascular smooth muscle cells in a TLR4-dependent manner. Mol Med Rep. 2017;15(1):345–351. doi:10.3892/mmr.2016.5987
15. Collins JA, Wood ST, Nelson KJ, et al. Oxidative stress promotes peroxiredoxin hyperoxidation and attenuates pro-survival signaling in aging chondrocytes. J Biol Chem. 2016;291(13):6641–6654. doi:10.1074/jbc.M115.693523
16. Li J, Wang Q, Cai H, et al. FGF1 improves functional recovery through inducing PRDX1 to regulate autophagy and anti-ROS after spinal cord injury. J Cell Mol Med. 2018;22(5):2727–2738. doi:10.1111/jcmm.13566
17. Wang M, Niu W, Qi M, et al. Nicotine promotes cervical metastasis of oral cancer by regulating peroxiredoxin 1 and epithelial-mesenchymal transition in mice. Onco Targets Ther. 2019;12:3327–3338. doi:10.2147/OTT.S194129
18. Wang C, Niu W, Chen H, et al. Nicotine suppresses apoptosis by regulating α7nAChR/Prx1 axis in oral precancerous lesions. Oncotarget. 2017;8(43):75065–75075. doi:10.18632/oncotarget.20506
19. Qi M, Li L, Lu Y, et al. Proteome profiling to identify peroxiredoxin 1 interacting protein partners in nicotine-associated oral leukoplakia. Arch Oral Biol. 2019;108:104537. doi:10.1016/j.archoralbio.2019.104537
20. Min Z, Hong L, Xiongzhi Q, et al. Establishment of Prx1 gene knockout mice. Beijing J Stomatol. 2012;20(5):246–248. doi:10.3969/j.issn.1006-673X.2012.05.002
21. Zhang J, Jing X, Niu W, et al. Peroxiredoxin 1 has an anti-apoptotic role via apoptosis signal-regulating kinase 1 and p38 activation in mouse models with oral precancerous lesions. Oncol Lett. 2016;12(1):413–420. doi:10.3892/ol.2016.4659
22. Pierce B, Tong W, Weng Z. M-ZDOCK: a grid-based approach for Cn symmetric multimer docking. Bioinformatics. 2005;21(8):1472–1478. doi:10.1093/bioinformatics/bti229
23. Ma Y, Qi M, An Y, et al. Autophagy controls mesenchymal stem cell properties and senescence during bone aging. Aging Cell. 2018;17(1):e12709. doi:10.1111/acel.12709
24. Collado M, Gil J, Efeyan A, et al. Tumour biology: senescence in premalignant tumours. Nature. 2005;436(7051):642. doi:10.1038/436642a
25. Collado M, Serrano M. The power and the promise of oncogene-induced senescence markers. Nat Rev Cancer. 2006;6(6):472–476. doi:10.1038/nrc1884
26. Loaiza N, Demaria M. Cellular senescence and tumor promotion: is aging the key? Biochim Biophys Acta. 2016;1865(2):155–167. doi:10.1016/j.bbcan.2016.01.007
27. Campo-Trapero J, Cano-Sánchez J, Palacios-Sánchez B, et al. Cellular senescence in oral cancer and precancer and treatment implications: a review. Acta oncologica. 2008;47(8):1464–1474. doi:10.1080/02841860802183612
28. Rufini A, Tucci P, Celardo I, et al. Senescence and aging: the critical roles of p53. Oncogene. 2013;32(43):5129–5143. doi:10.1038/onc.2012.640
29. Childs BG, Baker DJ, Kirkland JL, et al. Senescence and apoptosis: dueling or complementary cell fates? EMBO Rep. 2014;15(11):1139–1153. doi:10.15252/embr.201439245
30. Campisi J. Senescent cells, tumor suppression, and organismal aging: good citizens, bad neighbors. Cell. 2005;120(4):513–522. doi:10.1016/j.cell.2005.02.003
31. Bodnar AG, Ouellette M, Frolkis M, et al. Extension of life-span by introduction of telomerase into normal human cells. Science (New York, N Y). 1998;279(5349):349–352. doi:10.1126/science.279.5349.349
32. Sigal SH, Rajvanshi P, Gorla GR, et al. Partial hepatectomy-induced polyploidy attenuates hepatocyte replication and activates cell aging events. Am J Physiol. 1999;276(5):G1260–G1272. doi:10.1152/ajpgi.1999.276.5.G1260
33. Park Y-H, Kim H-S, Lee J-H, et al. Peroxiredoxin I participates in the protection of reactive oxygen species-mediated cellular senescence. BMB Rep. 2017;50(10):528–533. doi:10.5483/BMBRep.2017.50.10.121
34. Vigneron A, Vousden KH. p53, ROS and senescence in the control of aging. Aging. 2010;2(8):471–474. doi:10.18632/aging.100189
35. Bendris N, Lemmers B, Blanchard JM. Cell cycle, cytoskeleton dynamics and beyond: the many functions of cyclins and CDK inhibitors. Cell Cycle. 2015;14(12):1786–1798. doi:10.1080/15384101.2014.998085
36. Takeuchi S, Kasamatsu A, Yamatoji M, et al. TEAD4-YAP interaction regulates tumoral growth by controlling cell-cycle arrest at the G1 phase. Biochem Biophys Res Commun. 2017;486(2):385–390. doi:10.1016/j.bbrc.2017.03.050
37. Satyanarayana A, Hilton MB, Kaldis P. p21 Inhibits Cdk1 in the absence of Cdk2 to maintain the G1/S phase DNA damage checkpoint. Mol Biol Cell. 2008;19(1):65–77. doi:10.1091/mbc.e07-06-0525
38. Mihara M, Shintani S, Nakahara Y, et al. Overexpression of CDK2 is a prognostic indicator of oral cancer progression. Jpn J Cancer Res. 2001;92(3):352–360. doi:10.1111/j.1349-7006.2001.tb01102.x
39. Kujan O, Huang G, Ravindran A, et al. The role of cyclin-dependent kinases in oral potentially malignant disorders and oral squamous cell carcinoma. J Oral Pathol Med. 2019;48(7):560–565. doi:10.1111/jop.12903
40. Li Y, Cheng X, Chen C, et al. Apigenin, a flavonoid constituent derived from P. villosa, inhibits hepatocellular carcinoma cell growth by CyclinD1/CDK4 regulation via p38 MAPK-p21 signaling. Pathol Res Pract. 2020;216(1):152701. doi:10.1016/j.prp.2019.152701
41. Walker DG, Duan W, Popovic EA, et al. Homozygous deletions of the multiple tumor suppressor gene 1 in the progression of human astrocytomas. Cancer Res. 1995;55(1):20–23.
42. Correia-Melo C, Ichim G, Tait SWG, et al. Depletion of mitochondria in mammalian cells through enforced mitophagy. Nat Protoc. 2017;12(1):183–194. doi:10.1038/nprot.2016.159
43. Zheng R, Yao Q, Xie G, et al. TAT-ODD-p53 enhances the radiosensitivity of hypoxic breast cancer cells by inhibiting Parkin-mediated mitophagy. Oncotarget. 2015;6(19):17417–17429. doi:10.18632/oncotarget.4002
44. Fusaro G, Dasgupta P, Rastogi S, et al. Prohibitin induces the transcriptional activity of p53 and is exported from the nucleus upon apoptotic signaling. J Biol Chem. 2003;278(48):47853–47861. doi:10.1074/jbc.M305171200
45. Wang S, Nath N, Fusaro G, et al. Rb and prohibitin target distinct regions of E2F1 for repression and respond to different upstream signals. Mol Cell Biol. 1999;19(11):7447–7460. doi:10.1128/MCB.19.11.7447
46. Wei Y, Chiang W-C, Sumpter R, et al. Prohibitin 2 is an inner mitochondrial membrane mitophagy receptor. Cell. 2017;168(1–2):224–238.e10. doi:10.1016/j.cell.2016.11.042
47. Xiao Y, Zhou Y, Lu Y, et al. PHB2 interacts with LC3 and SQSTM1 is required for bile acids-induced mitophagy in cholestatic liver. Cell Death Dis. 2018;9(2):160. doi:10.1038/s41419-017-0228-8
48. Klionsky DJ, Abdelmohsen K, Abe A, et al. Guidelines for the use and interpretation of assays for monitoring autophagy (3rd edition). Autophagy. 2016;12(1). doi:10.1080/15548627.2015.1100356
49. Ding W-X, Yin X-M. Mitophagy: mechanisms, pathophysiological roles, and analysis. Biol Chem. 2012;393(7):547–564. doi:10.1515/hsz-2012-0119
50. Vasileiou PVS, Evangelou K, Vlasis K, et al. Mitochondrial homeostasis and cellular senescence. Cells. 2019;8(7):686. doi:10.3390/cells8070686
 © 2021 The Author(s). This work is published and licensed by Dove Medical Press Limited. The
full terms of this license are available at https://www.dovepress.com/terms
and incorporate the Creative Commons Attribution
- Non Commercial (unported, 3.0) License.
By accessing the work you hereby accept the Terms. Non-commercial uses of the work are permitted
without any further permission from Dove Medical Press Limited, provided the work is properly
attributed. For permission for commercial use of this work, please see paragraphs 4.2 and 5 of our Terms.
© 2021 The Author(s). This work is published and licensed by Dove Medical Press Limited. The
full terms of this license are available at https://www.dovepress.com/terms
and incorporate the Creative Commons Attribution
- Non Commercial (unported, 3.0) License.
By accessing the work you hereby accept the Terms. Non-commercial uses of the work are permitted
without any further permission from Dove Medical Press Limited, provided the work is properly
attributed. For permission for commercial use of this work, please see paragraphs 4.2 and 5 of our Terms.