Back to Journals » Diabetes, Metabolic Syndrome and Obesity » Volume 16
Perirenal Fat Thickness is Associated with Metabolic Dysfunction-Associated Fatty Liver Disease in Type 2 Diabetes Mellitus
Authors Yang J, Li CW, Zhang JR, Qiu H, Guo XL, Wang W ![]()
Received 2 April 2023
Accepted for publication 26 June 2023
Published 28 June 2023 Volume 2023:16 Pages 1953—1965
DOI https://doi.org/10.2147/DMSO.S415477
Checked for plagiarism Yes
Review by Single anonymous peer review
Peer reviewer comments 2
Editor who approved publication: Professor Gian Paolo Fadini
Jian Yang,* Chuan Wang Li,* Jing Ru Zhang, Honglin Qiu, Xiu Li Guo, Wei Wang
Longyan First Affiliated Hospital of Fujian Medical University, Longyan, Fujian, 364000, People’s Republic of China
*These authors contributed equally to this work
Correspondence: Wei Wang; Xiu Li Guo, Department of Endocrinology, Longyan First Affiliated Hospital of Fujian Medical University, Longyan, Fujian, 364000, People’s Republic of China, Email [email protected]; [email protected]
Objective: Recent advances in perirenal adipose tissue (PAT) highlighted that PAT might involve in the pathogenesis of chronic inflammatory and dysfunctional metabolic diseases. This study assessed the association between perirenal fat thickness (PrFT) and metabolic dysfunction-associated fatty liver disease (MALFD) in type 2 diabetes mellitus (T2DM).
Methods: This study comprised 867 eligible participants with T2DM. Trained reviewers collected anthropometric and biochemical measurements. The diagnosis of MAFLD was based on the latest international expert consensus statement. PrFT and fatty liver were evaluated by computed tomography. The visceral fat area (VFA) and subcutaneous fat area (SFA) were measured by bioelectrical impedance analysis. The non-alcoholic fatty liver disease fibrosis score (NFS) and fibrosis-4 (FIB-4) index were used to assess progressive liver fibrosis in MAFLD.
Results: Overall, the prevalence of MAFLD was 62.3% in T2DM. The PrFT in the MAFLD group was statistically increased than in the non-MAFLD group (P < 0.05). Correlation analysis showed that PrFT was significantly correlated with dysfunctional metabolic factors like body mass index, waist circumference, triglycerides, high-density lipoprotein cholesterol, systolic blood pressure, diastolic blood pressure, uric acid, and insulin resistance. Multiple regression analysis revealed that PrFT was positively correlated with NFS (β=0.146, P< 0.001) and FIB-4 (β=0.082, P=0.025) in the MAFLD. In contrast, PrFT was negatively correlated with CTL-S (β=− 0.188, P< 0.001). Furthermore, PrFT was also significantly associated with MAFLD independent of VFA and SFA, the OR (95% CI) was 1.279 (1.191– 1.374). Meanwhile, PrFT also had a good identifying value for MAFLD as VFA. The area under the curve (95% CI) value of PrFT identifying MAFLD was 0.782 (0.751– 0.812). The optimal cut-off value of PrFT was 12.6mm, with a sensitivity of 77.8% and specificity of 70.8%.
Conclusion: PrFT was independently associated with MAFLD, NFS, and FIB-4 and showed a similar identifying value for MAFLD as VFA, which suggested that PrFT can be used as an alternative index to VFA.
Keywords: metabolic dysfunction-associated fatty liver disease, liver fibrosis, perirenal fat thickness, obesity, type 2 diabetes mellitus
Introduction
Metabolic dysfunction-associated fatty liver disease (MAFLD) is the most common chronic liver disease characterized by liver fat content exceeding 5% (hepatic steatosis), which in turn can progress to its severe forms like non-alcoholic steatohepatitis (NASH), liver fibrosis, cirrhosis, and hepatocellular carcinoma. MAFLD was previously named non-alcoholic fatty liver disease (NAFLD). The golden criteria of NAFLD, NASH, and liver fibrosis were based on liver biopsy, which was not widely used in patients with NAFLD due to its invasive nature. Hence, the latest expert consensus statement set new “positive” criteria (hepatic steatosis in adults detected by imaging techniques, blood biomarkers, or liver histology). The novel classification downplays the importance of alcohol in the definition of NAFLD and highlights metabolic risk factors for NAFLD-related pathological progression.1 Type 2 diabetes mellitus (T2DM) is a metabolic disease characterized by chronic hyperglycemia, rapidly increasing and becoming a major public concern worldwide. MAFLD and T2DM share the same metabolic risk factors like genetic factors, insulin resistance, dyslipidemia, obesity, and unhealthy lifestyle,2 which cause a high prevalence of MAFLD in T2DM. The latest epidemiological data suggested that the prevalence of MAFLD was up to 55.2% in T2DM.3 In addition to MAFLD-associated liver injury, it can worsen glycemic control and increase the incidence of diabetes-associated complications, such as cardiovascular disease, diabetic nephropathy, and diabetic retinopathy.4
Current guidelines for the management of MAFLD in T2DM focused on developing effective strategies to treat metabolic risk factors, as well as preventing diabetes-related target organ damage and adverse liver outcomes. Obesity is a crucial risk factor that links MAFLD with T2DM. Obesity involves excessive adipose tissue accumulation in subcutaneous and visceral. Compared to subcutaneous adipose tissue (SAT), visceral adipose tissue (VAT) plays more functional roles in the pathogenesis of T2DM and MAFLD.5 In clinical practice, we can also observe that the lean or normal-weight population is accompanied by MAFLD. Increased VAT may be responsible for these conditions. Therefore, more insights should be put into VAT rather than SAT.
Perirenal adipose tissue (PAT) is a crucial classification of VAT located in retro-peritoneal space and surrounds the kidney. Histological studies suggested PAT shared the exact developmental origin as typical VAT,6 making it have the same functional roles as VAT in T2DM and MAFLD. Emerging evidence found that PAT played more functional roles in energy metabolism, adipokine bio-transformation, and cytokine secretion than typical VAT,7 which provided a basis for PAT involvement in the pathogenesis of chronic inflammatory and dysfunctional metabolic diseases. Several clinical studies observed that perirenal fat thickness (PrFT) was closely associated with metabolic dysfunctions like hypertension, increased insulin resistance and uric acid (UA), and dyslipidemia.8,9 Based on these findings, it can be assumed that PAT may involve in the development of MAFLD. Work completed on data showed that the association between PrFT and MAFLD remained uncertain. Furthermore, previous studies revealed that the visceral fat area (VFA) had a relatively good identifying value for MAFLD.10 Whether PrFT had the same identifying value for MAFLD still needs further evaluation. Hence, this study aimed to assess the correlation of PrFT with MALFD and further evaluate the identifying value of PrFT for MALFD.
Methods
Study Population
This cross-sectional study consecutively enrolled T2DM admitted to the national metabolic management center at Longyan First Affiliated Hospital of Fujian Medical University between April 2022 to December 2022. Participants were excluded if there were as follows: (1) type 1 diabetes mellitus, gestational diabetes mellitus, or special type diabetes mellitus. (2) with other liver comorbidities (ie, liver malignancy, viral hepatitis, autoimmune liver disease). (3) treatment with medicines that could induce liver steatosis or insulin sensitization (ie, estrogens, amiodarone, methotrexate, and tamoxifen). (4) with a history of renal region surgery, renal tumors, and cysts that can interfere with normal renal structure. (5) with some conditions (pregnancy or severe spinal curvature) that could not complete CT scanning. (6) with acute diseases that could interfere with glucose and lipid metabolism. All procedures were conducted in compliance with the Declaration of Helsinki. Informed consent was obtained from all participants. This study was approved by the Ethical Committee of Longyan First Affiliated Hospital of Fujian Medical University (LY-2020069). The flow diagram of excluded and included participants is presented in Figure 1. A total of 46 participants were excluded. Among them, 22 participants with incomplete data, 12 with other liver comorbidities (11 with active b viral hepatitis and 1 with autoimmune liver disease), 8 with abnormal renal structure, and 4 with type 1 diabetes mellitus. Participants were separated into the MALFD group and the non-MALFD group. Meanwhile, participants were divided into three groups according to the tertiles of PrFT.
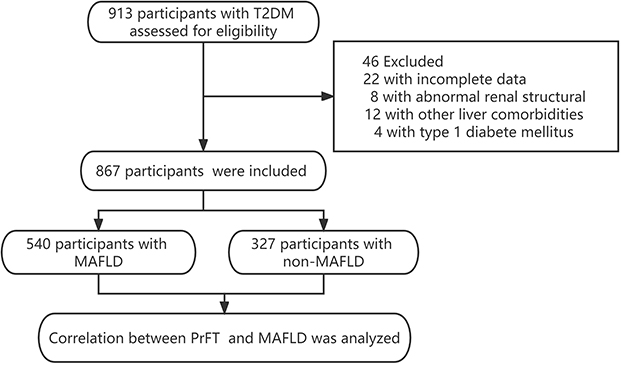 |
Figure 1 The flow diagram of the participants excluded and included in this study. |
Definition of T2DM and MAFLD
The definition of T2DM was according to the World Health Organization criteria (2019 edition): (1) fasting blood glucose (FBG)≥126 mg/dl. 2) 2h postprandial≥200 mg/dl during oral glucose tolerance test. (3) random plasma glucose≥200 mg/dl with classic hyperglycemia or hyperglycemic crisis symptom. (4) glycosylated hemoglobin A1c (HbA1c)≥6.5%. Participants meeting at least one of these criteria were considered to have T2DM. The definition of MAFLD was according to the latest international expert consensus statement:11 hepatic steatosis (fatty liver) in adults detected either by imaging techniques, blood biomarkers, or liver histology in addition to one of the following three criteria, namely overweight/obesity, presence of T2DM, or evidence of metabolic dysregulation. Owing to the study participants being all T2DM, the diagnosis of MAFLD in our study was according to the assessment of hepatic steatosis (fatty liver) by CTL-S. The criteria of metabolic dysfunction were as follows:11 (1) waist circumference (WC)≥90 cm in men or WC≥80 cm in women. (2) blood pressure≥130/85 mmHg or specific drug treatment. (3) triglycerides (TG) ≥150 mg/dl (≥1.70 mmol/L) or specific drug treatment. 4) high-density lipoprotein (HDL-c) <40 mg/dl (<1.0 mmol/L) for men or<50 mg/dl (<1.3 mmol/L) for women, or specific drug treatment. 5) Prediabetes or diabetes. 6) homeostasis model assessment of insulin resistance score (HOMA-IR)≥2.5. 7) UA≥420 µmol/L or specific drug treatment.
Clinical and Laboratory Assessments
Trained interviewers collected demographic information through a standard questionnaire and a review of medical records and laboratory data. The demographic information consists of gender, age, duration of diabetes, current or prior use of medicine, history of the disease, smoking, drinking, and physical activity. Drinking was defined as participants drinking more than once a year. Smoking was defined as participants smoking more than 4 cigarettes a week for at least 6 months continually or accumulative. Sedentary behavior12 was defined as participants having any waking behaviors characterized by an energy expenditure≤1.5 metabolic equivalents (eg, watching television, reading, writing, or playing video games). The trained research nurses measured anthropometric information using standardized methods, including height, weight, systolic blood pressure, and diastolic blood pressure (DBP).
Standardized methods using fasting venous blood samples were conducted to determine laboratory assessments. The blood samples were taken between 8 and 9 am after fasting overnight and stored in standardized tubes. Serum levels of creatinine, alanine aminotransferase (ALT), aspartate aminotransferase (AST), alkaline phosphatase (ALP), HbA1c, diabetic autoimmune antibodies (GADA, IAA, and ICA), UA, FBG, serum insulin, total cholesterol (TC), HDL-c, low-density lipoprotein (LDL-c), TG, albumin, and Platelets (PLT) were determined. An auto-biochemical analyzer (Roche Diagnostics Corporation) was used to measure the serum lipids. PLT was determined by flow cytometry. HbA1c was determined by high-performance liquid chromatography with a D10 set (Bio-RAD). Serum insulin was determined by electrochemiluminescence immunoassay with immunoassay analyzers. HOMA-IR was calculated with the following formula: fasting serum insulin (µU/mL) FBG (mmol/l)/22.5.13
Assessment of the Liver Fibrosis Score
The NAFLD fibrosis score (NFS) and fibrosis-4 (FIB-4) index were used to assess the progressive liver fibrosis in MAFLD. NFS and FIB-4 were calculated with the following formulas:14 NFS=−1.675+0.037×age (years)+0.094×BMI (kg/m2) +1.13+0.99×AST/ALT ratio-0.013×PLT (109/L) −0.66×albumin (g/dl). FIB-4=age (years)×AST (U/L)/ (PLT (109/L) ×ALT (U/L)1/2). Participants with MFALD were stratified into possessing low, intermediate, or high groups according to the following points: NFS (−1.455 and 0.676) and FIB-4 (1.30 and 2.67).
Measurement of Visceral and Subcutaneous Fat Area
VFA and subcutaneous fat area (SFA) were measured by bioelectrical impedance analysis using DUALSCAN HDS-2000 (Omron, Japan) in a supine position. The procedure of measurement was performed according to the instrument operating manual.
Measurement of Perirenal Fat Thickness and Fatty Liver
Participants were performed with CT scanning by Revolution VCT 128 (General Electric, Milwaukee, USA) to obtain abdominal structure images in a supine position. The CT scanning area was covered between the pubic symphysis and the 10th thoracic vertebra. The Advantage Windows 4.4 software (GE, Milwaukee, USA) was used to reconstruct images and obtain 1.25-mm-thick consecutive slices. Two radiologists have been involved in the PrFT and fatty liver measurements to reduce inter-operator variability and were blind to clinical findings.
PAT was differentiated from other tissues by density (HU). The window center is set at −100 HU, and widths range from 50 to 200 HU. Favre et al found that PrFT measured with CT is a reliable estimate of perirenal fat mass.15 Therefore, the measurement of PrFT in this study was based on the above study. The average maximal distance between the kidney’s posterior wall and the abdominal wall’s inner limit across the renal venous plane on the left and right side was measured as PrFT. The inter-operator agreement of PrFT measurement between the two radiologists is 0.88.
The diagnosis of fatty liver was based on the CTL-S, which was reported to be the most accurate CT index for assessing fatty liver.16 Participants with 0.7<CTL-S<1.0, 0.5<CTL-S<0.7, and CTL-S<0.7 were considered to have mild, moderate, and severe fatty liver.17 CTL-S was calculated with the following formula: mean liver attenuation divided by the mean spleen attenuation. Liver attenuation was measured by the average HU value of three 3 cm2 circular regions of interest (ROI). Three ROIs were manually drawn at the left hepatic lobe, anterior segment of the right hepatic lobe, and posterior part of the right hepatic lobe. Meanwhile, splenic attenuation was calculated as the average HU of three 2 cm2 ROIs of the spleen’s upper, middle, and lower thirds. The inter-operator agreement of CTL-S measurement between the two radiologists is 0.92.
Statistical Analysis
Data were analyzed using the SPSS 23.0 software (SPSS Inc. IBM). Descriptive data are expressed as means ± standard deviation (SD). Discrete variables were summarized in frequency tables (N, %). Statistical differences among groups were performed with a one-way analysis of variance, followed by the Turkey test for multiple comparisons. The chi-squared (χ2) test or Fisher exact test was used to compare categorical variables. The Pearson or Spearman correlation analysis assessed the relationship between PrFT and metabolic risk factors. Multiple regression analysis was used to estimate independent associations between PrFT and NFS, FIB-4. Binomial logistic regression analysis was used to estimate the independent variable of PrFT for MAFLD. The receiver operating characteristic (ROC) curves were used to evaluate the identifying value of PrFT for MAFLD in T2DM. The maximum of the Youden Index was used to evaluate the optimal cut-off value of PrFT. A two-tailed value of P<0.05 was considered statistically significant.
Results
Clinical and Laboratory Characteristics of Participants
A total of 837 participants with complete data were included in the final analysis, and approximately half were men (50.7%). The mean age of participants was 53.9±8.1 years, and the mean diabetes duration was 8.3±3.3 years. The prevalence of MAFLD was 62.3% in T2DM. The clinical and laboratory characteristics of participants in MAFLD and non-MAFLD groups were summarized in Table 1. The results showed that there were no significant differences in age, diabetes duration, HbA1c, TG, LDL-c, creatinine, ALP, albumin, platelets, and the proportion of male, smoking, and drinking between MAFLD and non-MAFLD groups (P>0.05). In contrast, metabolic risk factors and liver function indicators like BMI, WC, SBP, DBP, TG, UA, ALT, AST, HOMA-IR, PrFT, SFA, and VFA were significantly increased in the MAFLD group than the non-MAFLD group (P<0.05). Meanwhile, the proportion of participants with hypertension and sedentary behavior was also higher in the MAFLD group (P<0.05).
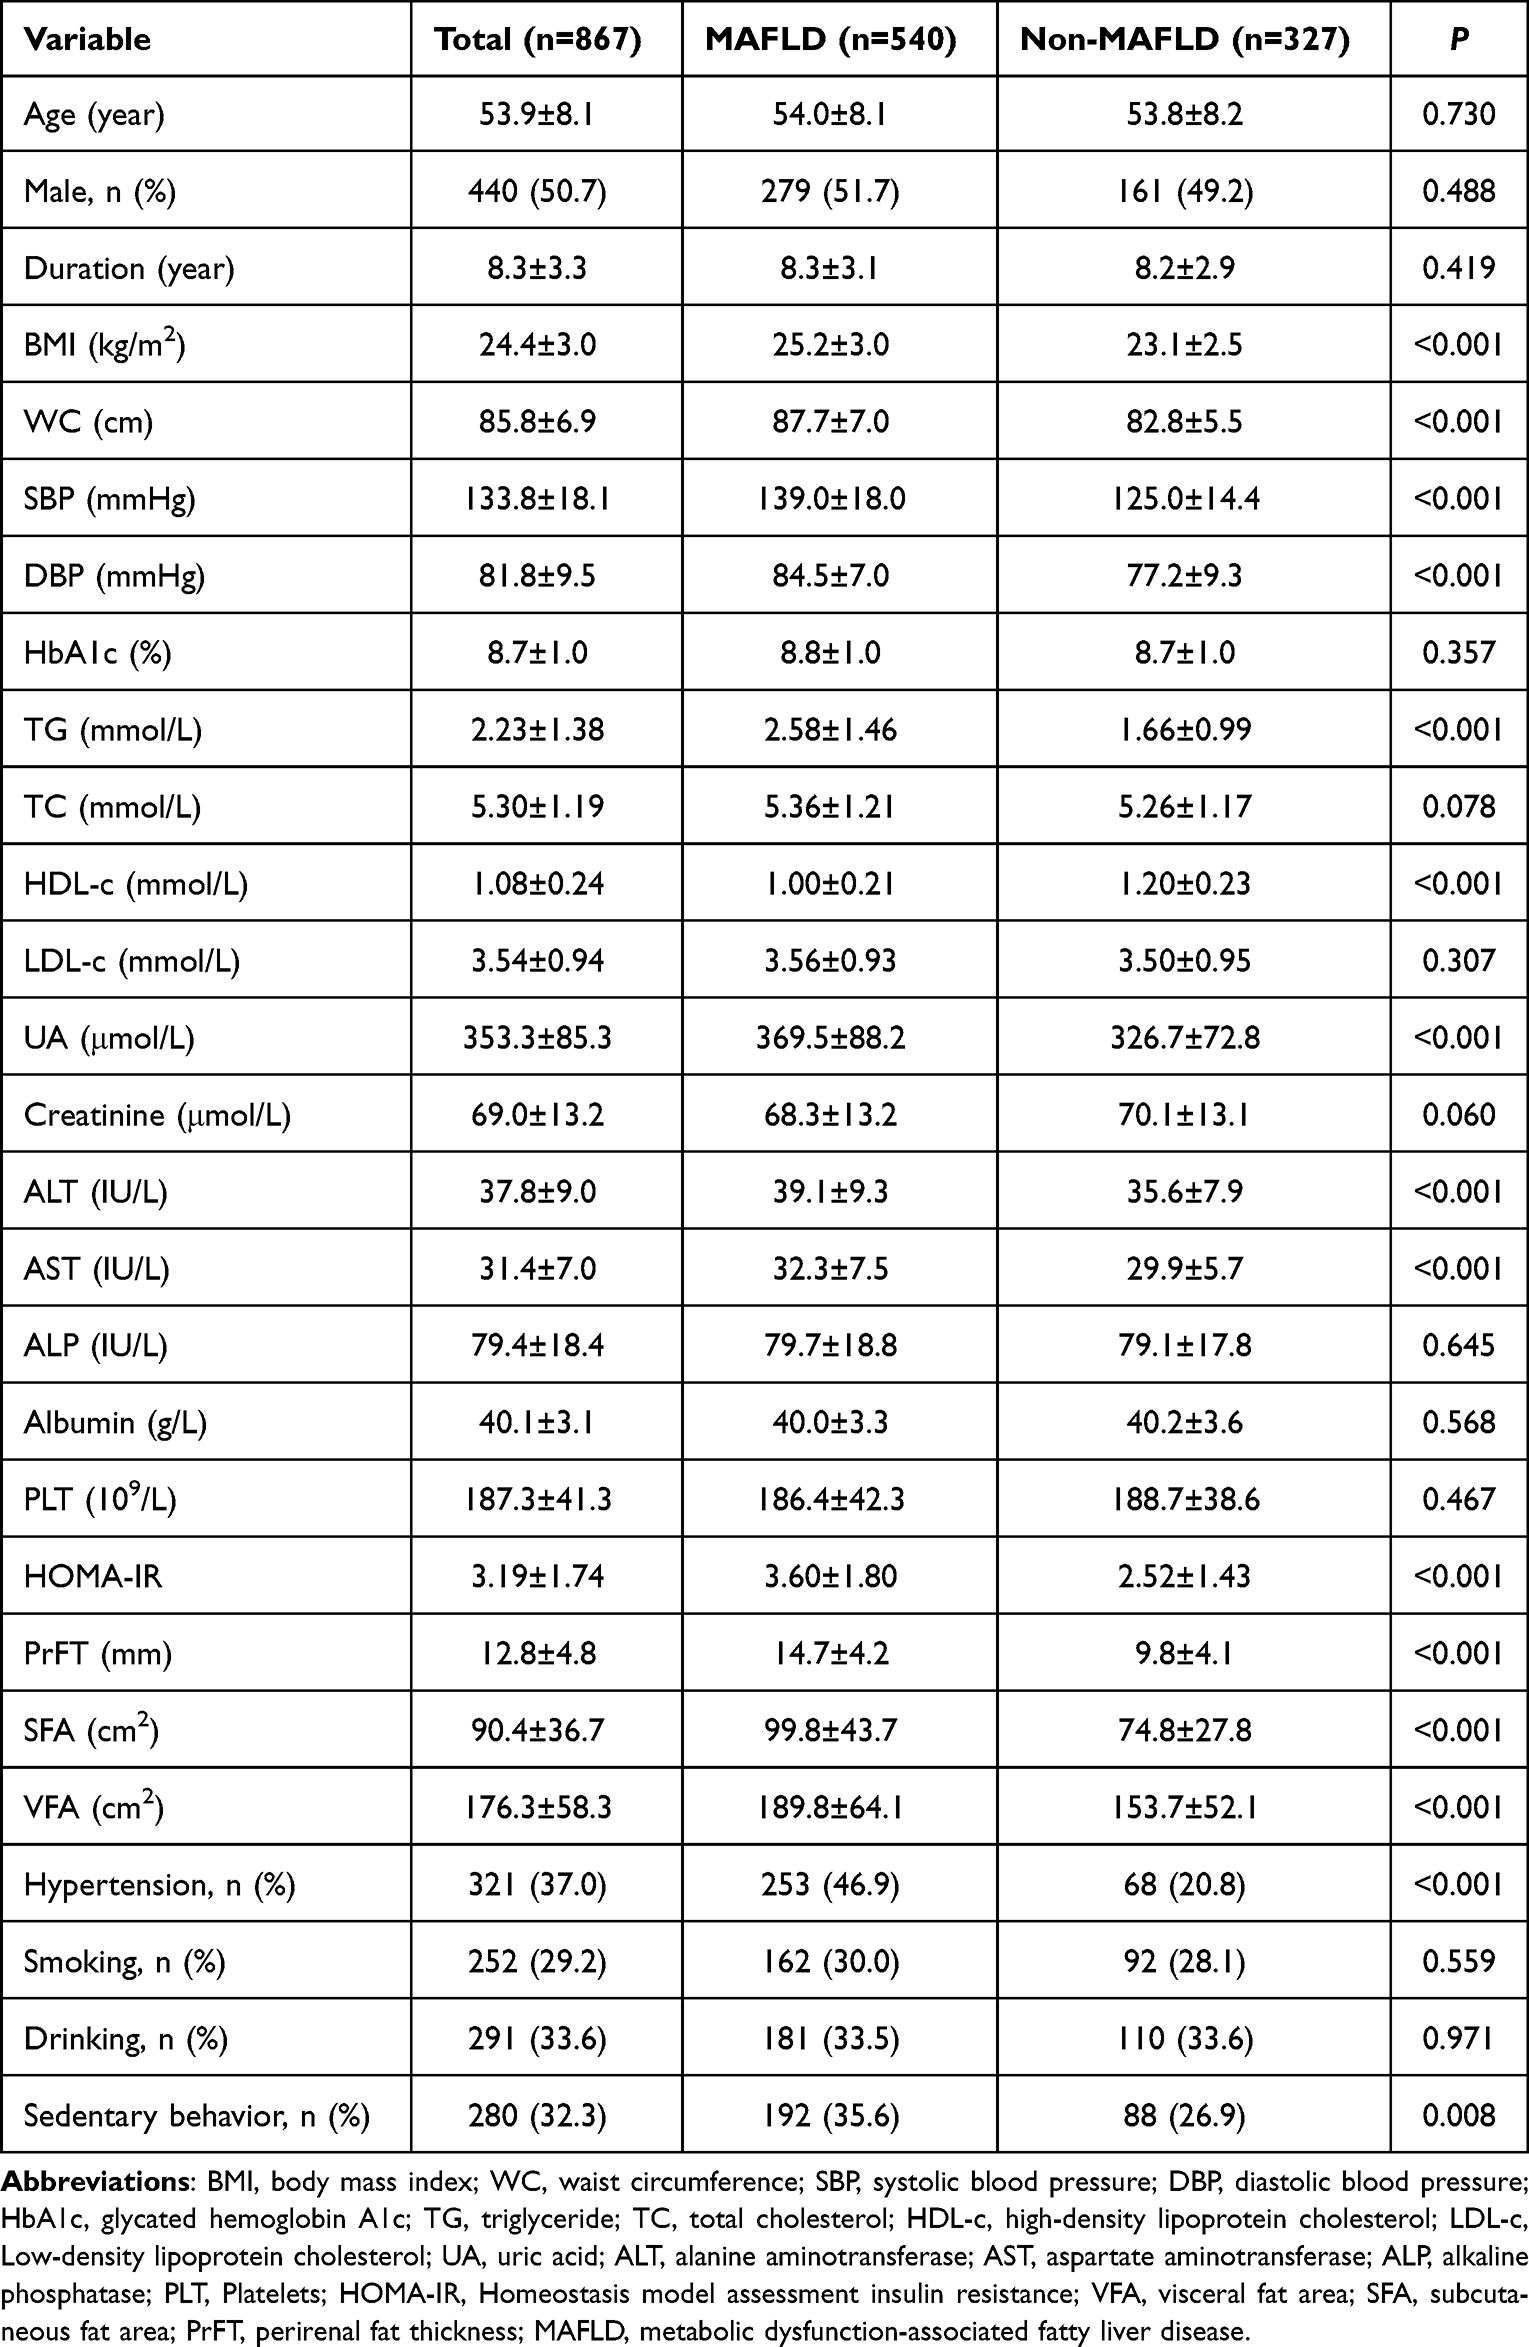 |
Table 1 Clinical and Laboratory Characteristics of Participants in MAFLD and Non-MAFLD Groups |
Metabolic Risk Factors and Liver Function Indicators Based on PrFT Tertiles
Table 2 summarizes the metabolic risk factors and liver function indicators across the PrFT tertiles in the total and MAFLD population. The results revealed that there were no significant differences in HbA1c, ALT, AST, and ALP across the PrFT tertiles in whole and MAFLD populations (P>0.05). In contrast, increasing trends were observed in the BMI, WC, SBP, DBP, TG, TC, UA, HOMA-IR, SFA, VFA, and the proportion of participants with hypertension across the PrFT tertiles in total and MAFLD populations (P<0.05). Meanwhile, decreasing trends were observed in HDL-c and CTL-S (P<0.05).
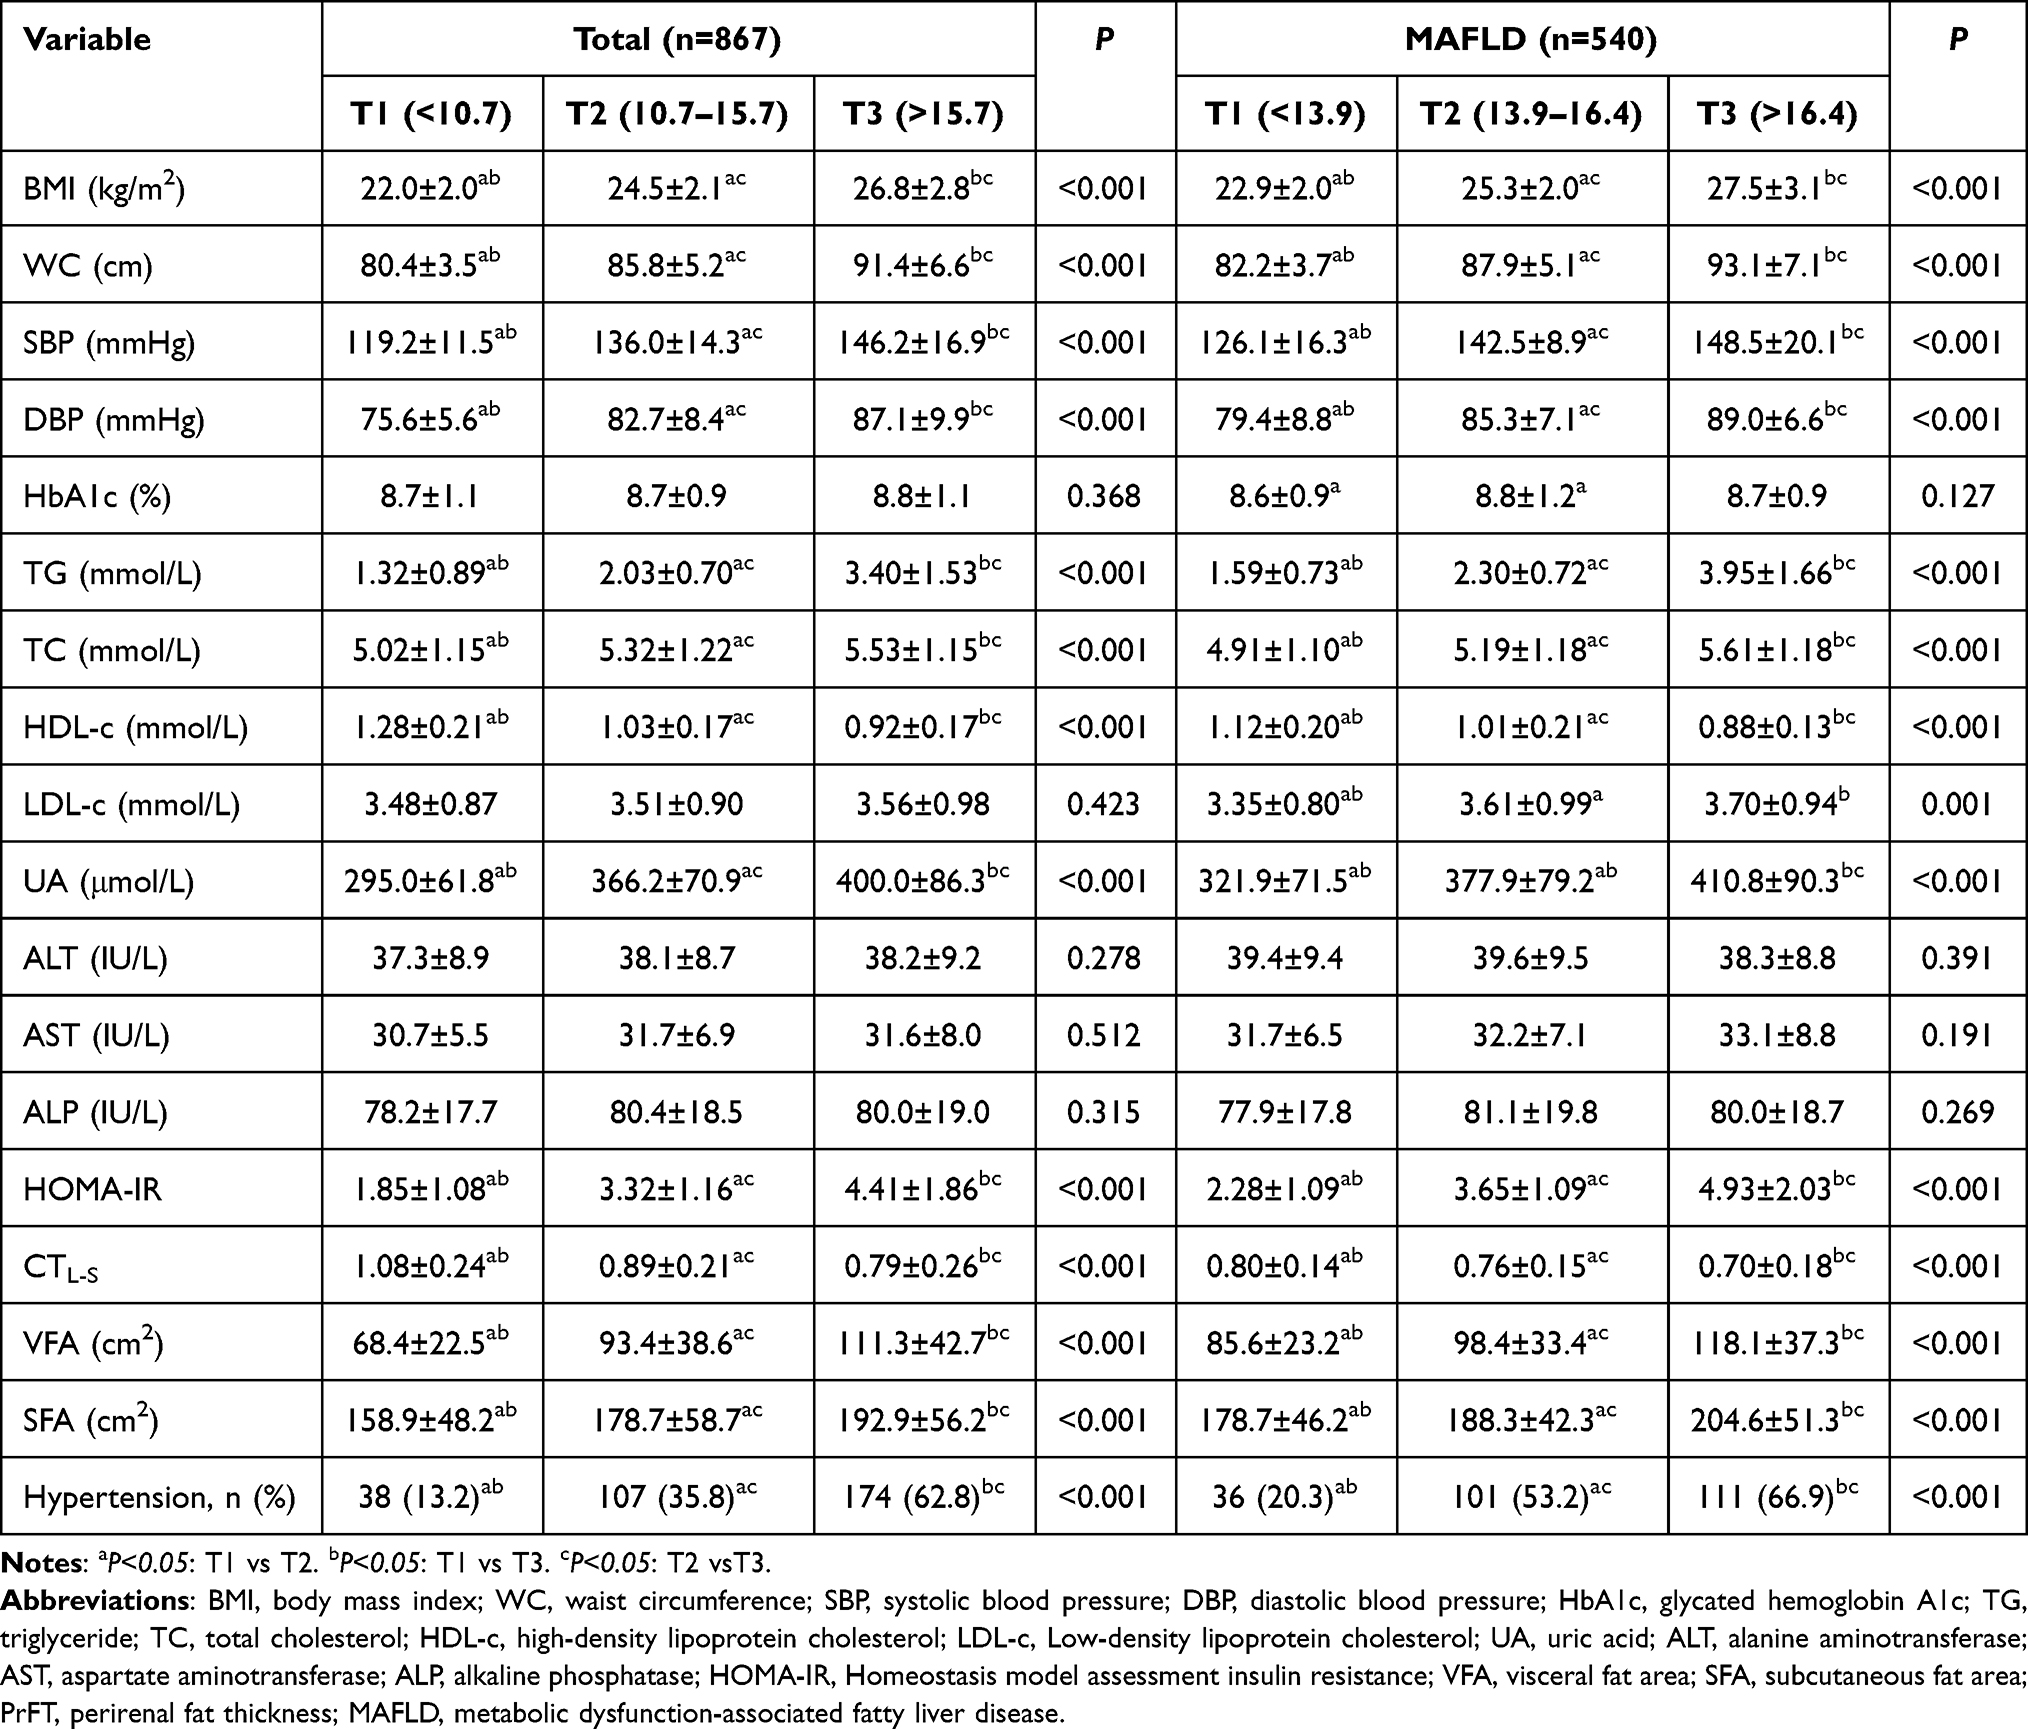 |
Table 2 Metabolic Risk Factors and Liver Function Indicators of T2DM Across Tertiles of PrFT in Total and MAFLD Population |
Figure 2 illustrates the prevalence of MAFLD and the distribution of metabolic dysfunctions based on PrFT tertiles in T2DM. Participants in higher PrFT tertiles had a higher prevalence of MAFLD (Figure 2A). Furthermore, the proportion of T2DM with more than 3 metabolic dysfunctions increased significantly with increasing PrFT tertiles, which were 16.3%, 79.6%, and 95.4% in each tertile (Figure 2B). Meanwhile, participants in higher PrFT tertiles had a higher prevalence of moderate or severe fatty liver (Figure 3A). The mean NFS and FIB-4 were −0.38 ± 0.56 and 1.52 ± 0.45 in MAFLD, respectively. The proportion of intermediate or high progressive liver fibrosis based on NFS (Figure 3B) and FIB-4 (Figure 3C) was also significantly increased in the higher PrFT tertiles.
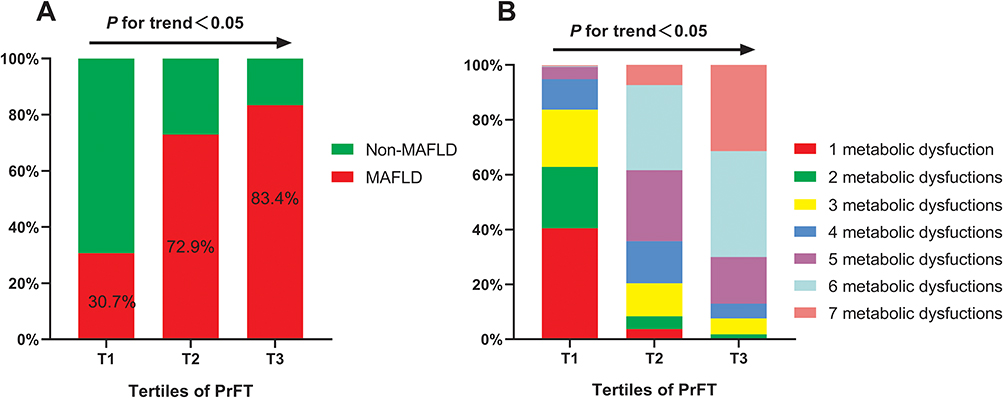 |
Figure 2 The prevalence of MAFLD (A) and distribution of metabolic dysfunctions (B) across PrFT tertiles in T2DM. Abbreviations: PrFT, perirenal fat thickness; MAFLD, metabolic dysfunction-associated fatty liver disease. |
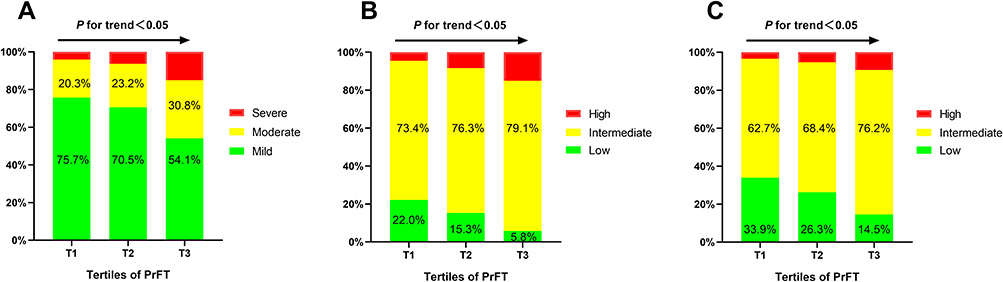 |
Figure 3 The fatty liver severity (A) and proportion of progressive liver fibrosis based on NFS (B) and FIB-4 (C) across PrFT tertiles in T2DM with MAFLD. Abbreviations: PrFT, perirenal fat thickness; MAFLD, metabolic dysfunction-associated fatty liver disease; NFS, non-alcoholic fatty liver disease fibrosis score; FIB-4, fibrosis-4 index. |
Main Correlations of PrFT with Metabolic Risk Factors and CTL-S
The main correlations of PrFT with metabolic risk factors and CTL-S in total and MAFLD population were presented in Table 3. In the Pearson or Spearman correlation analysis, PrFT showed a positive correlation with BMI, WC, SBP, DBP, TG, TC, UA, HOMA-IR, SFA, and VFA in total and MAFLD populations (P<0.05). Meanwhile, PrFT also presented a negative correlation with HDL-c and CTL-S (P<0.05). In addition, PrFT was also positively correlated with NFS (r=0.363, P<0.001) and FIB4 (r=0.186, P<0.001) in MAFLD (Figure 4).
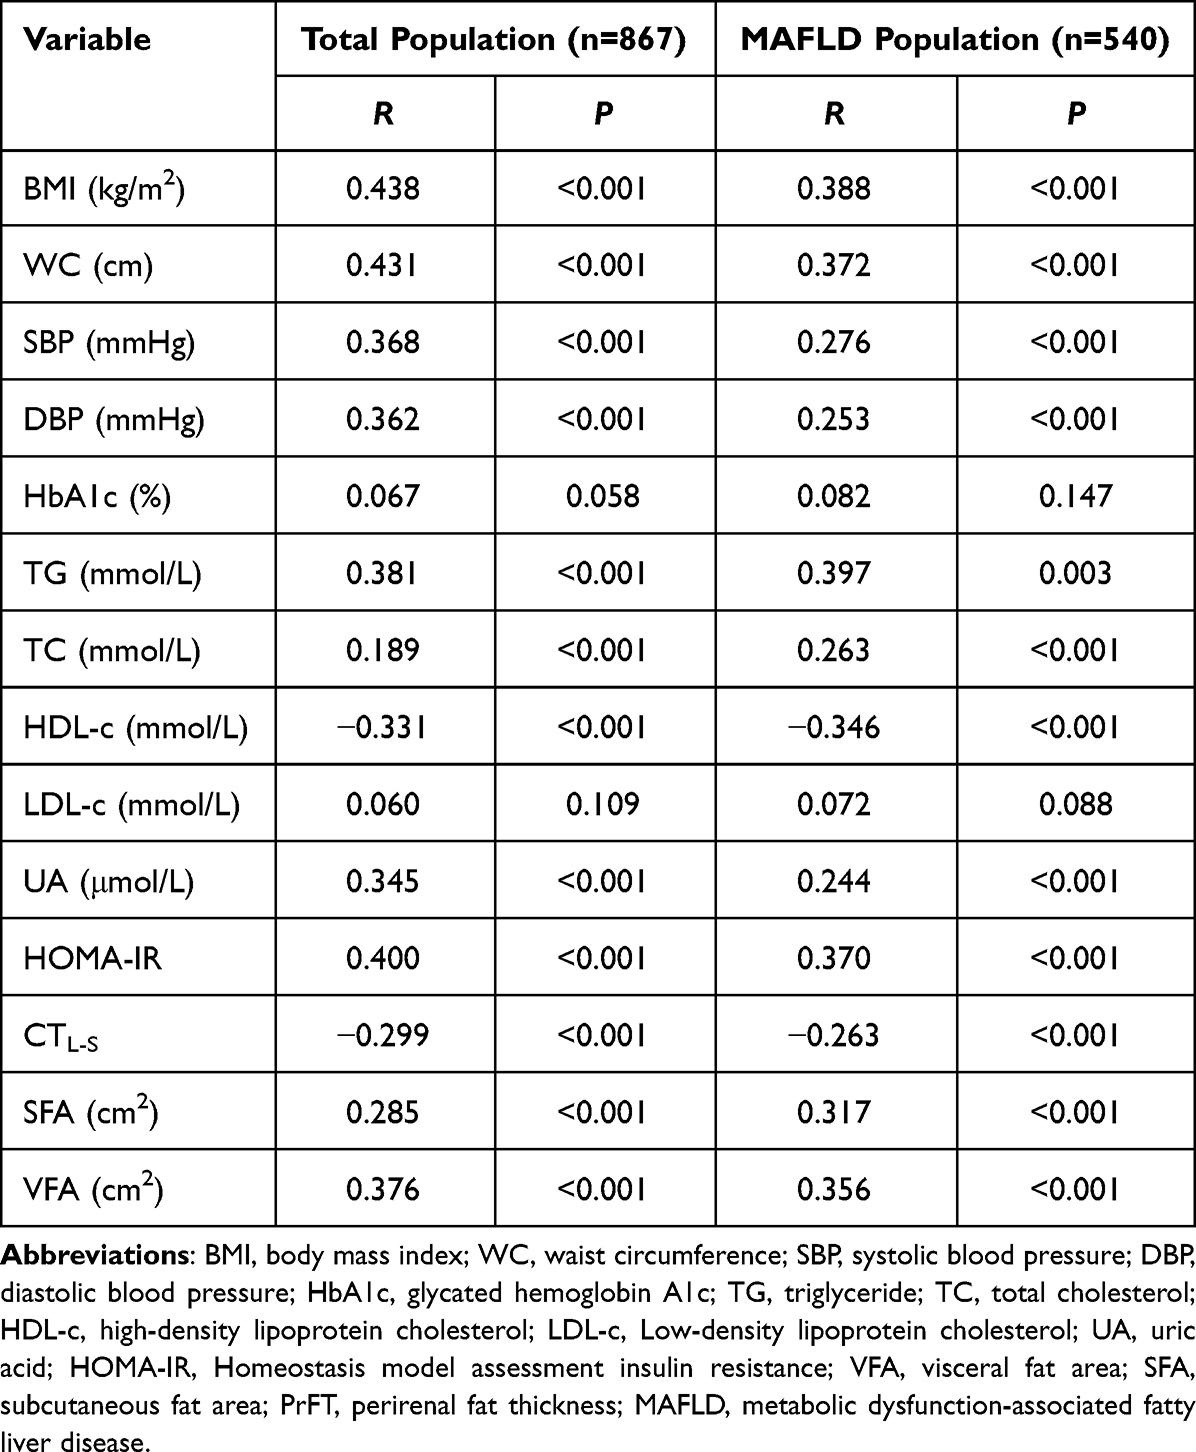 |
Table 3 Main Correlations of PrFT with Metabolic Risk Factors and CTL-S |
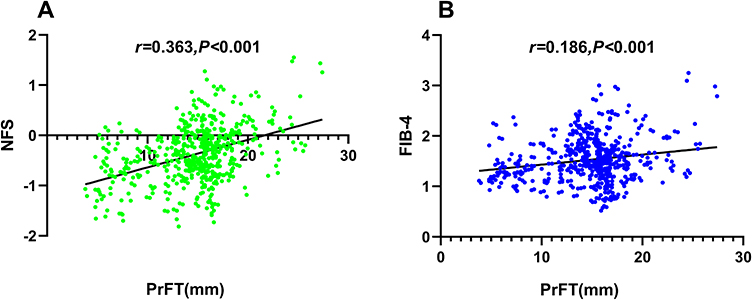 |
Figure 4 The correlation of PrFT with NFS (A) and FIB-4 (B) in T2DM with MAFLD. Abbreviations: PrFT, perirenal fat thickness; MAFLD, metabolic dysfunction-associated fatty liver disease; NFS, non-alcoholic fatty liver disease fibrosis score; FIB-4, fibrosis-4 index. |
Correlation of PrFT with CTL-S, NFS, and FIB-4
Multiple linear regression analyses evaluated the correlation between PrFT and NFS, FIB-4, and CTL-S. As shown in Table 4, PrFT was shown to be significantly correlated with CTL-S both in the total population and MAFLD population after adjustment for age, gender, diabetes duration, smoking, drinking, sedentary behavior (Model 1), and liver function indicators like ALT, AST, ALP, albumin, and PLT (Model 2). Meanwhile, PrFT remained significantly correlated with CTL-S in the total population (β=−0.159, P<0.001) and MAFLD population (β=−0.188, P<0.001) after additional adjustment for metabolic risk factors like BMI, WC, SBP, DBP, HbA1c, TG, TC, LDL-c, HDL-c, UA, HOMA-IR, SFA, and VFA (Model 3). Furthermore, PrFT was also shown to be significantly correlated with NFS (β=0.146, P<0.001) and FIB-4 (β=0.082, P=0.025) in the MAFLD population after adjustment for Model 3.
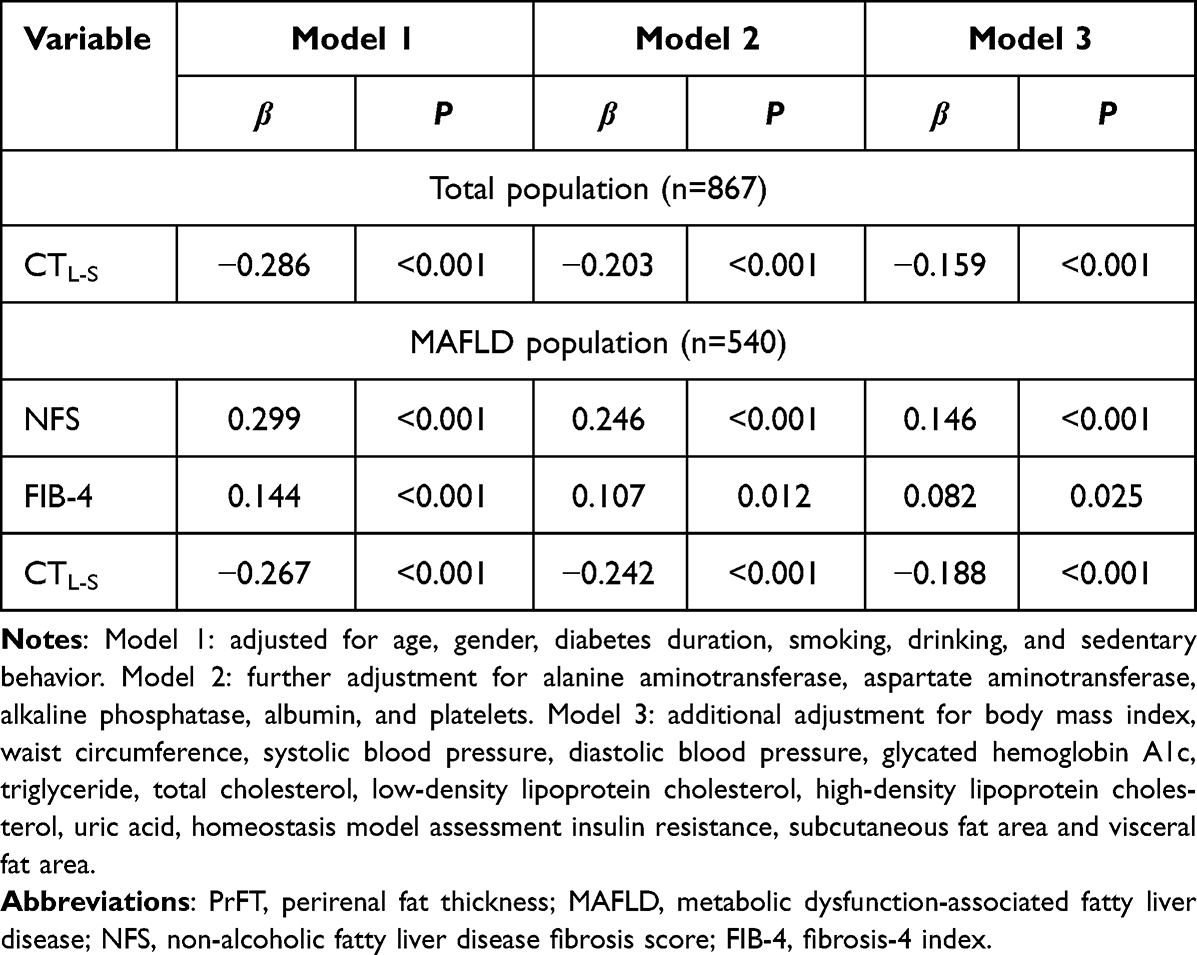 |
Table 4 Multivariate Linear Regression Analysis of the Association Between PrFT and CTL-S, NFS, and FIB-4 |
Impact of PrFT on MAFLD
Binomial logistic regression analysis was conducted to investigate the correlation of PrFT with MAFLD in T2DM. As illustrated in Figure 5, PrFT was shown to be independently correlated with MAFLD after adjustment for age, gender, diabetes duration, smoking, drinking, sedentary behavior (Model 1), and liver function indicators like ALT, AST, ALP, albumin, and PLT (Model 2). After additional adjustment for metabolic risk factors like BMI, WC, SBP, DBP, HbA1c, TG, TC, LDL-c, HDL-c, UA, HOMA-IR, SFA, and VFA (Model 3), PrFT remained independently correlated with MAFLD. The OR (95% CI) was 1.279 (1.191–1.374).
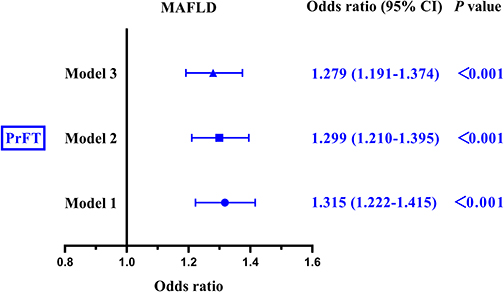 |
Figure 5 Impact of PrFT on MAFLD in T2DM by binomial logistic regression analysis. Model 1: adjusted for age, gender, diabetes duration, smoking, drinking, and sedentary behavior. Model 2: further adjustment for alanine aminotransferase, aspartate aminotransferase, alkaline phosphatase, albumin, and platelets. Model 3: additional adjustment for body mass index, waist circumference, systolic blood pressure, diastolic blood pressure, glycated hemoglobin A1c, triglyceride, total cholesterol, low-density lipoprotein cholesterol, high-density lipoprotein cholesterol, uric acid, homeostasis model assessment insulin resistance, subcutaneous fat area and visceral fat area. Abbreviations: PrFT, perirenal fat thickness; MAFLD, metabolic dysfunction-associated fatty liver disease. |
ROC curve analysis was used to evaluate the identifying value of PrFT for MAFLD. The results revealed that PrFT had a good identifying value for MAFLD. As shown in Figure 6, the AUC (95% CI) value of PrFT identifying MAFLD was 0.782 (0.751–0.812), which was similar to the VFA (AUC 0.766, 95% CI 0.733–0.799). The optimal cut-off value of PrFT was 12.6mm, with a sensitivity of 77.8% and specificity of 70.8% (Table 5).
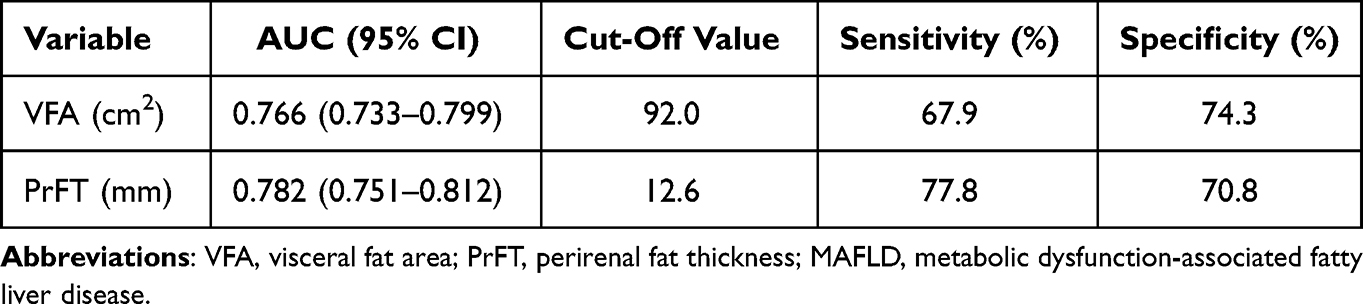 |
Table 5 ROC Curve Analysis of PrFT and VFA in Identifying MAFLD |
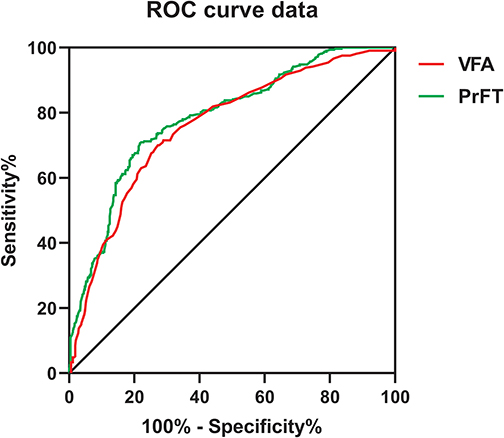 |
Figure 6 Receiver operating characteristic curves for the cutoff value of PrFT identifying MAFLD. |
Discussion
The increase in MAFLD and T2DM has been linked to the rising trends in obesity. Recent advances in VAT highlighted that the excessive accumulation of PAT played a crucial role in metabolic dysfunctions. This study assessed the association between PrFT and MAFLD in T2DM. The results revealed that PrFT was significantly increased in the MALFD population. PrFT was also closely associated with metabolic risk factors, CTL-S, NFS, and FIB-4. Furthermore, after adjusting confounding factors, PrFT remained significantly correlated with CTL-S, NFS, and FIB-4. Likewise, PrFT was independently associated with MAFLD and showed a similar identifying value for MAFLD as VFA.
Increasing evidence demonstrated that PAT was involved in the development of metabolic dysfunctions. Hypertension, hyperuricemia, insulin resistance, abdominal obesity, and dyslipidemia are the major metabolic dysfunctions that play crucial roles in the pathogenesis of MAFLD and its progression.18 Our study found that PrFT was closely associated with metabolic risk factors such as WC, SBP, DBP, TG, HDL-C, TC, UA, HOMA-IR, SFA, and VFA, whether in total or MAFLD population, which was consistent with the previous studies. De Pergola et al observed a positive association between PrFT and mean 24-h BP levels in 42 overweight and obese subjects.19 Yang et al also revealed that PrFT was independently associated with serum UA levels in T2DM.20 Meanwhile, PrFT was also reported as an independent predictor of hyperuricemia.21 Ke et al found that PrFT was negatively correlated with the serum HDL-c level and positively correlated with cholesterol efflux capacity in T2DM.22 In addition, several observational studies also revealed that increased PrFT was positively associated with increased WC and HOMA-IR.8,23,24
The effects of VAT on metabolic dysfunctions and inflammation have been reported previously. Recent advances in PAT also highlighted that PAT plays a crucial role in metabolic and inflammatory disorders. Several studies revealed that increased PrFT was associated with a reduced glomerular filtration rate and a higher risk of developing chronic kidney disease.25,26 Increased PrFT was also reported to be associated with increased carotid intima-media thickness in children and HIV-1-infected patients receiving highly active antiretroviral therapy.27,28 Furthermore, our previous study revealed that PrFT was closely associated with metabolic risk factors and showed a substantial predictive value for metabolic syndrome in 445 newly diagnosed T2DM.29 As another metabolic dysfunctional and inflammatory disease, our study observed that PrFT was independently associated with MAFLD independent of VFA and SFA. This finding indicates that excessive PAT may play a role in MAFLD development. NFS and FIB-4 are validated non-invasive markers for assessing progressive liver fibrosis, which have been widely used in clinical practice. Our study also found that PrFT was negatively correlated with NFS independent of VFA and SFA, which suggests that excessive PAT may be associated with progressive liver fibrosis. However, this association needs to be further confirmed by the longitudinal studies with liver biology examination. Previous studies demonstrated that VFA had a good identifying value for MAFLD and liver fibrosis.10,30 Our study found that PrFT also had a good identifying value for MAFLD. The AUC (95% CI) value of PrFT identifying MAFLD was 0.782 (0.751–0.812), which was similar to the VFA (AUC 0.766, 95% CI 0.733–0.799). Therefore, PrFT can be used as an alternative index to VFA in identifying MAFLD.
Among the potential mechanisms of PAT related to MAFLD, the unique structural and biological features of PAT contribute to its critical roles in MAFLD and its progression. Anatomical studies confirmed that PAT was well vascularized, innervated, and drained into the lymphatic system, which was unique compared to other connective tissues. These special structural features ensure that PAT may modulate metabolism and trigger inflammation via neural reflexes, adipocyte interactions, and paracrine substances.31,32 The excessive accumulation of PAT supplies fatty acids to the liver that can exacerbate steatosis and generate reactive oxygen species, finally injuring the liver.33,34 In addition, PAT was highly active in adipokine and inflammatory cytokines secretion, such as leptin, adiponectin, tumor necrosis factor-a, interleukin-6, interleukin-8, and MCP-1.35,36 These adipokine and inflammatory cytokines synthesized by the excessive PAT can also promote hepatic steatosis and increase the production of pro-inflammatory macrophages.37,38
Limitation
Several limitations need to be mentioned in our study. First, this study was a cross-sectional analysis based on prospectively collected data from a single center in the Chinese population without follow-up that cannot directly reflect the association between PrFT and MAFLD. Second, the distribution of visceral fat varies among different races. The optimal cut-off values of PrFT may not apply to other races. Third, the golden criteria of MAFLD diagnosis and liver fibrosis assessment were based on histological examination. A CT scan may be less accurate in diagnosing mild fatty lesions, whereas it was commonly used in clinical practice to assess hepatic steatosis. In addition, CT scans cannot repeatedly measure PrFT in the short term due to radiation exposure, which might have less value for clinical practicability.
Conclusion
In conclusion, PrFT was independently correlated with MAFLD, CTL-S, NFS, and FIB-4 independent of VFA and SFA in T2DM, which indicated that the excessive accumulation of PAT might contribute to a role in MAFLD its progression. In addition, PrFT also had a similar AUC value in identifying MAFLD as VFA, which suggested that PrFT can be used as an alternative index to VFA. Meanwhile, more studies are needed to confirm these findings and illustrate the underlying mechanisms.
Abbreviations
ALT, alanine aminotransferase; AST, aspartate aminotransferase; BMI, body mass index; DBP, diastolic blood pressure; HDL-c, high-density lipoprotein cholesterol; HbA1c, glycated hemoglobin; HOMR-IR, homeostasis model assessment insulin resistance; LDL-c, low-density lipoprotein cholesterol; HDL-c, high-density lipoprotein; MAFLD, metabolic dysfunction-associated fatty liver disease; NAFLD, non-alcoholic fatty liver disease; NASH, non-alcoholic steatohepatitis; NFS, non-alcoholic fatty liver disease fibrosis score; PrFT, perirenal fat thickness; PAT, perirenal adipose tissue; SBP, systolic blood pressure; SFA, subcutaneous fat area; UA, uric acid; VFA, visceral fat area; WC, waist circumference; TG, triglyceride; TC, total cholesterol; T2DM, type 2 diabetes mellitus.
Data Sharing Statement
Datasets are available from the corresponding author upon reasonable request.
Ethics Approval and Informed Consent
This study involving human participants was reviewed and approved by the Ethical Committee of Longyan First Affiliated Hospital of Fujian Medical University (LY-2020069). The patients/participants provided written informed consent to participate in this study.
Consent for Publication
All participants have consented to the submission of the data to the journal.
Funding
There is no funding to report.
Disclosure
The authors report no conflicts of interest in this work.
References
1. Eslam M, Alkhouri N, Vajro P, et al. Defining paediatric metabolic (dysfunction)-associated fatty liver disease: an international expert consensus statement. Lancet Gastroenterol Hepatol. 2021;6(10):864–873.
2. Targher G, Corey K, Byrne C, et al. The complex link between NAFLD and type 2 diabetes mellitus - mechanisms and treatments. Nat Rev Gastroenterol Hepatol. 2021;18(9):599–612. doi:10.1038/s41575-021-00448-y
3. Younossi Z, Golabi P, de Avila L, et al. The global epidemiology of NAFLD and NASH in patients with type 2 diabetes: a systematic review and meta-analysis. J Hepatol. 2019;71(4):793–801. doi:10.1016/j.jhep.2019.06.021
4. Mantovani A, Scorletti E, Mosca A, et al. Complications, morbidity and mortality of nonalcoholic fatty liver disease. Metab Clin Exp. 2020;111:154170. doi:10.1016/j.metabol.2020.154170
5. Agbim U, Carr R, Pickett-Blakely O, et al. Ethnic disparities in adiposity: focus on non-alcoholic fatty liver disease, visceral, and generalized obesity. Curr Obes Rep. 2019;8(3):243–254. doi:10.1007/s13679-019-00349-x
6. Chau Y, Bandiera R, Serrels A, et al. Visceral and subcutaneous fat have different origins and evidence supports a mesothelial source. Nat Cell Biol. 2014;16(4):367–375. doi:10.1038/ncb2922
7. Foster M, Pagliassotti M. Metabolic alterations following visceral fat removal and expansion: beyond anatomic location. Adipocyte. 2012;1(4):192–199. doi:10.4161/adip.21756
8. D’Marco L, Salazar J, Cortez M, et al. Perirenal fat thickness is associated with metabolic risk factors in patients with chronic kidney disease. Kidney Res Clin Pract. 2019;38(3):365–372. doi:10.23876/j.krcp.18.0155
9. Roever L, Resende E, Veloso F, et al. Perirenal fat and association with metabolic risk factors: the Uberlândia heart study. Medicine. 2015;94(38):e1105. doi:10.1097/MD.0000000000001105
10. Hernández-Conde M, Llop E, Carrillo C, et al. Estimation of visceral fat is useful for the diagnosis of significant fibrosis in patients with non-alcoholic fatty liver disease. World J Gastroenterol. 2020;26(42):6658–6668. doi:10.3748/wjg.v26.i42.6658
11. Eslam M, Newsome P, Sarin S, et al. A new definition for metabolic dysfunction-associated fatty liver disease: an international expert consensus statement. J Hepatol. 2020;73(1):202–209. doi:10.1016/j.jhep.2020.03.039
12. DiPietro L, Al-Ansari S, Biddle S, et al. Advancing the global physical activity agenda: recommendations for future research by the 2020 WHO physical activity and sedentary behavior guidelines development group. Int J Behav Nutr Phys Act. 2020;17(1):143. doi:10.1186/s12966-020-01042-2
13. Bonora E, Targher G, Alberiche M, et al. Homeostasis model assessment closely mirrors the glucose clamp technique in the assessment of insulin sensitivity: studies in subjects with various degrees of glucose tolerance and insulin sensitivity. Diabetes Care. 2000;23(1):57–63. doi:10.2337/diacare.23.1.57
14. Bril F, McPhaul M, Caulfield M, et al. Performance of plasma biomarkers and diagnostic panels for nonalcoholic steatohepatitis and advanced fibrosis in patients with type 2 diabetes. Diabetes Care. 2020;43(2):290–297. doi:10.2337/dc19-1071
15. Favre G, Grangeon-Chapon C, Raffaelli C, et al. Perirenal fat thickness measured with computed tomography is a reliable estimate of perirenal fat mass. PLoS One. 2017;12(4):e0175561. doi:10.1371/journal.pone.0175561
16. Starekova J, Hernando D, Pickhardt P, et al. Quantification of liver fat content with CT and MRI: state of the art. Radiology. 2021;301(2):250–262. doi:10.1148/radiol.2021204288
17. Zeng MD, Fan JG, Lu LG, et al. Guidelines for the diagnosis and treatment of nonalcoholic fatty liver diseases. J Dig Dis. 2008;9(2):108–112. doi:10.1111/j.1751-2980.2008.00331.x
18. Lim S, Kim J, Targher G. Links between metabolic syndrome and metabolic dysfunction-associated fatty liver disease. Trends Endocrinol Metab. 2021;32(7):500–514. doi:10.1016/j.tem.2021.04.008
19. De Pergola G, Campobasso N, Nardecchia A, et al. Para- and perirenal ultrasonographic fat thickness is associated with 24-hours mean diastolic blood pressure levels in overweight and obese subjects. BMC Cardiovasc Disord. 2015;15:108. doi:10.1186/s12872-015-0101-6
20. Yang Y, Ma Y, Cheng Y, et al. The perirenal fat thickness was independently associated with serum uric acid level in patients with type 2 diabetes mellitus. BMC Endocr Disord. 2022;22(1):210. doi:10.1186/s12902-022-01081-9
21. Lamacchia O, Nicastro V, Camarchio D, et al. Para- and perirenal fat thickness is an independent predictor of chronic kidney disease, increased renal resistance index and hyperuricaemia in type-2 diabetic patients. Nephrol Dial Transplant. 2011;26(3):892–898. doi:10.1093/ndt/gfq522
22. Ke J, Wang Y, Liu S, et al. Relationship of para and perirenal fat and high-density lipoprotein and its function in patients with type 2 diabetes mellitus. Int J Endocrinol. 2021;2021:9286492. doi:10.1155/2021/9286492
23. Manno C, Campobasso N, Nardecchia A, et al. Relationship of para- and perirenal fat and epicardial fat with metabolic parameters in overweight and obese subjects. Eat Weight Disord. 2019;24(1):67–72. doi:10.1007/s40519-018-0532-z
24. Chen X, Mao Y, Hu J, et al. Perirenal fat thickness is significantly associated with the risk for development of chronic kidney disease in patients with diabetes. Diabetes. 2021;70(10):2322–2332. doi:10.2337/db20-1031
25. Fang Y, Xu Y, Yang Y, et al. The relationship between perirenal fat thickness and reduced glomerular filtration rate in patients with type 2 diabetes. J Diabetes Res. 2020;2020:6076145. doi:10.1155/2020/6076145
26. Geraci G, Zammuto M, Mattina A, et al. Para-perirenal distribution of body fat is associated with reduced glomerular filtration rate regardless of other indices of adiposity in hypertensive patients. J Clin Hypertens. 2018;20(10):1438–1446. doi:10.1111/jch.13366
27. Grima P, Guido M, Zizza A, et al. Sonographically measured perirenal fat thickness: an early predictor of atherosclerosis in HIV-1-infected patients receiving highly active antiretroviral therapy? J Clin Ultrasound. 2010;38(4):190–195. doi:10.1002/jcu.20664
28. Bassols J, Martínez-Calcerrada J, Prats-Puig A, et al. Perirenal fat is related to carotid intima-media thickness in children. Int J Obes. 2018;42(4):641–647. doi:10.1038/ijo.2017.236
29. Guo X, Tu M, Chen Y, et al. Perirenal fat thickness: a surrogate marker for metabolic syndrome in Chinese newly diagnosed type 2 diabetes. Front Endocrinol. 2022;13:850334. doi:10.3389/fendo.2022.850334
30. Fukuda K, Seki Y, Ichihi M, et al. Usefulness of ultrasonographic estimation of preperitoneal and subcutaneous fat thickness in the diagnosis of nonalcoholic fatty liver disease in diabetic patients. J Med Ultrason. 2015;42(3):357–363. doi:10.1007/s10396-015-0615-7
31. Wu C, Zhang H, Zhang J, et al. Inflammation and fibrosis in perirenal adipose tissue of patients with aldosterone-producing adenoma. Endocrinology. 2018;159(1):227–237. doi:10.1210/en.2017-00651
32. Sun L, Li F, Han C, et al. Alterations in mitochondrial biogenesis and respiratory activity, inflammation of the senescence-associated secretory phenotype, and lipolysis in the perirenal fat and liver of rats following lifelong exercise and detraining. FASEB J. 2021;35(10):e21890. doi:10.1096/fj.202100868R
33. Vacca M, Allison M, Griffin J, et al. Fatty acid and glucose sensors in hepatic lipid metabolism: implications in NAFLD. Semin Liver Dis. 2015;35(3):250–261. doi:10.1055/s-0035-1562945
34. Caserta F, Tchkonia T, Civelek V, et al. Fat depot origin affects fatty acid handling in cultured rat and human preadipocytes. Am J Physiol Endocrinol Metab. 2001;280(2):E238–47. doi:10.1152/ajpendo.2001.280.2.E238
35. Roerink S, Wagenmakers M, Langenhuijsen J, et al. Increased adipocyte size, macrophage infiltration, and adverse local adipokine profile in perirenal fat in cushing’s syndrome. Obesity. 2017;25(8):1369–1374. doi:10.1002/oby.21887
36. Hoogduijn M, Crop M, Peeters A, et al. Human heart, spleen, and perirenal fat-derived mesenchymal stem cells have immunomodulatory capacities. Stem Cells Dev. 2007;16(4):597–604. doi:10.1089/scd.2006.0110
37. Francisco V, Sanz M, Real J, et al. Adipokines in non-alcoholic fatty liver disease: are we on the road toward new biomarkers and therapeutic targets? Biology. 2022;11(8):1237. doi:10.3390/biology11081237
38. Lumeng C, Bodzin J, Saltiel A. Obesity induces a phenotypic switch in adipose tissue macrophage polarization. J Clin Invest. 2007;117(1):175–184. doi:10.1172/JCI29881
 © 2023 The Author(s). This work is published and licensed by Dove Medical Press Limited. The
full terms of this license are available at https://www.dovepress.com/terms
and incorporate the Creative Commons Attribution
- Non Commercial (unported, 3.0) License.
By accessing the work you hereby accept the Terms. Non-commercial uses of the work are permitted
without any further permission from Dove Medical Press Limited, provided the work is properly
attributed. For permission for commercial use of this work, please see paragraphs 4.2 and 5 of our Terms.
© 2023 The Author(s). This work is published and licensed by Dove Medical Press Limited. The
full terms of this license are available at https://www.dovepress.com/terms
and incorporate the Creative Commons Attribution
- Non Commercial (unported, 3.0) License.
By accessing the work you hereby accept the Terms. Non-commercial uses of the work are permitted
without any further permission from Dove Medical Press Limited, provided the work is properly
attributed. For permission for commercial use of this work, please see paragraphs 4.2 and 5 of our Terms.
Recommended articles
Serum Fibrinogen-Like Protein 1 Levels in Obese Patients Before and After Laparoscopic Sleeve Gastrectomy: A Six-Month Longitudinal Study
Dilimulati D, Du L, Huang X, Jayachandran M, Cai M, Zhang Y, Zhou D, Zhu J, Su L, Zhang M, Qu S
Diabetes, Metabolic Syndrome and Obesity 2022, 15:2511-2520
Published Date: 17 August 2022
Tirzepatide: Does the Evidence to Date Show Potential for the Treatment of Early Stage Type 2 Diabetes?
Razzaki TS, Weiner A, Shukla AP
Therapeutics and Clinical Risk Management 2022, 18:955-964
Published Date: 28 September 2022
Adolescents with Type 2 Diabetes: Overcoming Barriers to Effective Weight Management
Salama M, Biggs BK, Creo A, Prissel R, Al Nofal A, Kumar S
Diabetes, Metabolic Syndrome and Obesity 2023, 16:693-711
Published Date: 9 March 2023
Clinical Classification of Obesity and Implications for Metabolic Dysfunction-Associated Fatty Liver Disease and Treatment
Ding Y, Deng Q, Yang M, Niu H, Wang Z, Xia S
Diabetes, Metabolic Syndrome and Obesity 2023, 16:3303-3329
Published Date: 25 October 2023
Resistance Training in Cardiovascular Diseases: A Review on Its Effectiveness in Controlling Risk Factors
Nazir A, Heryaman H, Juli C, Ugusman A, Martha JW, Moeliono MA, Atik N
Integrated Blood Pressure Control 2024, 17:21-37
Published Date: 18 March 2024