Back to Journals » International Journal of Chronic Obstructive Pulmonary Disease » Volume 12
Peripheral leukocyte microRNAs as novel biomarkers for COPD
Authors Wang R ![]() , Xu J, Liu H, Zhao Z
, Xu J, Liu H, Zhao Z
Received 16 December 2016
Accepted for publication 30 January 2017
Published 6 April 2017 Volume 2017:12 Pages 1101—1112
DOI https://doi.org/10.2147/COPD.S130416
Checked for plagiarism Yes
Review by Single anonymous peer review
Peer reviewer comments 2
Editor who approved publication: Prof. Dr. Richard Russell
Ruiying Wang,* Jianying Xu,* Hu Liu,* Zhiping Zhao*
Department of Respiratory, Shanxi Dayi Hospital Affiliated to Shanxi Medical University, Taiyuan, Shanxi, People’s Republic of China
*These authors contributed equally to this work
Abstract: COPD is a multifactorial disease caused by environmental determinants as well as genetic risk factors. The prevalence and mortality of COPD continue to increase, and underdiagnosis of COPD remains a critical issue. Previous reports investigated promising microRNAs (miRNAs) to reveal the molecular mechanism for the development of COPD; however, diagnostic and therapeutic markers for COPD have not yet been found. For this study, 20 representative COPD patients were separated into four groups based on increasing severity (A, B, C, and D) and compared to six healthy controls. Small RNA profiles of peripheral leukocytes were differentially expressed miRNAs (analyzed via next-generation sequencing) were validated via quantitative reverse transcriptase-polymerase chain reaction. Compared to healthy controls, 19 differentially expressed miRNAs were found in COPD patients. For all COPD groups, miR-3177-3p was downregulated, while 17 miRNAs were upregulated. Furthermore, the results revealed 21 differentially expressed miRNAs, of which miR-183-5p was continually downregulated from A to B to D. Between respective bronchodilator reversibility positive and negative groups of COPD different groups (A, B, C, and D), 10 miRNAs were differentially expressed, while miR-100-5p was upregulated in the negative groups. In conclusion, miR-106b-5p, miR-125a-5p, miR-183-5p, and miR-100-5p are central for the development of COPD. The severity of COPD was attenuated by miR-106b-5p, thus suggesting this miRNA as potential target for disease treatment.
Keywords: COPD, miRNA, sequencing, diagnosis, qRT-PCR
Introduction
COPD is a major public health problem. Prevalence ranged from 0.2% to 37%, and mortality ranged from 3 to 111 deaths per 100,000 population. Furthermore, mortality steadily increased during the last 30–40 years.1 In 2020, COPD is projected to rank fifth worldwide in terms of disease burden and third in terms of mortality.2 In China, the reported prevalence of COPD varied from 5% to 13% in different provinces and cities, and the prevalence of COPD was significantly higher in men than in women (8.3%–18.9% vs 3.8%–7.1%, respectively). Furthermore, the prevalence and burden of COPD were predicted to increase throughout future decades due to continued exposure to COPD risk factors and the aging of the world’s population.2,3 A further central feature of COPD epidemiology is the elevated risk of underdiagnosis. Mainly for mild to moderate disease processes, 60%–85% of patients are estimated to remain undiagnosed.4,5 Due to the progressive nature of the disease, forced expiratory volume in 1 second (FEV1) typically declines over time.6 Clinical manifestations of COPD are highly variable, and comorbidities are significantly increased in patients, severely affecting survival quality and life.7 To date, the majority of treatments do not prevent the decline of lung function.8 Therefore, we assume to screen the biomarkers and treatment targets that are associated with severity of the disease, aiming to guide individual treatment for COPD.
The markers derived from lung tissue are not routinely available for clinical disease monitoring, whereas blood is readily accessible. Biomarkers in blood, especially inflammatory markers, are associated with exacerbations and mortality in larger COPD cohort studies.9 MicroRNAs (miRNAs) are a subtype of noncoding RNA and have been extensively studied primarily due to their vital role as posttranscriptional gene regulators. Owing to its high stability, strong specificity, high sensitivity, and detection easily in blood, miRNAs have been implicated in a variety of lung diseases,10 and Leidinger et al11 suggested that specific peripheral miRNA profiles could distinguish lung cancer from COPD. The authors12 revealed miR-3620-3p as a promising biomarker, separating COPD and asthma. Kara et al13 demonstrated that miR-29c and miR-126 are essential for the development of COPD.
Alveolar macrophages have been implicated in the pathophysiology of COPD.14 In our present study, we extracted peripheral blood leukocytes from COPD patients and healthy controls, utilizing miRNA screening via next-generation sequencing. We found four miRNAs (miR-106b-5p, miR-125a-5p, miR-183-5p, and miR-100-5p) to be significant for the development of COPD, including disease transformation and evaluation of bronchodilator reversibility (BDR). Both central miRNAs (miR-106b-5p and miR-125a-5p) were validated via quantitative real-time polymerase chain reaction (qRT-PCR) in a large sample set and acted as diagnostic and therapeutic markers. Hence, peripheral leukocyte miRNAs could act as novel biomarkers for COPD.
Materials and methods
Ethics statement
This study was approved by the Clinical Research Ethics Committee of the Shanxi Medical University. Written informed consent was obtained from participants prior to their enrollment in the study.
Patients
The study is a cross-sectional observation study. Between January 1, 2015, and November 31, 2015, a total of 1,809 cases were tested in the pulmonary function room of the Shanxi Dayi Hospital. According to the Global Initiative for Chronic Obstructive Lung Disease (GOLD) guideline,2 141 patients were diagnosed using spirometry as having COPD (postbronchodilator FEV1/forced vital capacity (FVC) ratio<70%), and using combined assessment, this led to allocation of 16 cases to A-group (low risk, less symptoms GOLD 1–2 mild or moderate airflow limitation, 0–1 exacerbations per year, and modified British Medical Research Council (mMRC) grade 0–1 or CAT score <10), 52 cases to B-group (low risk, more symptoms GOLD 1–2 mild or moderate airflow limitation, 0–1 exacerbations per year, and mMRC grade ≥2 or COPD Assessment Test (CAT) score ≥10), 25 cases to C-group (high risk, less symptoms GOLD 3–4 severe or very severe airflow limitation, and/or ≥2 exacerbations per year, and/or ≥1 hospitalized exacerbation per year, and mMRC grade 0–1 or CAT score <10), and 48 cases to D-group (high risk, more symptoms GOLD 3–4 severe or very severe airflow limitation, and/or ≥2 exacerbations per year/≥1 hospitalized exacerbation per year, and mMRC grade ≥2 or CAT score ≥10). We found BDR-positive patients in each group. Our inclusion criteria were as follows: 1) Meet the spirometry-diagnosed criteria. 2) Region of origin, age, and smoking status were consistent with other already diagnosed COPD patients. Our exclusion criteria were as follows: 1) Prior history of other respiratory diseases. 2) Complete blood cell counts were abnormal during the month prior to this study. 3) Having other comorbidities. We recruited 20 male COPD patients aged between 48 and 79 years (average age of 63 years) with a smoking history of at least 20 pack-years. The reason why we selected only male smokers was as follows: it is widely accepted that smoking is the key risk factor in the development of COPD; furthermore, in our diagnosed 141 COPD patients, 92% of patients had smoking history and 76% of patients were males who had a smoking history of 20 pack-years. Furthermore, according to a previous study,3 the ratio of COPD was significantly higher in men than in women (8.3%–18.9% vs 3.8%–7.1%, respectively).
Age-matched, healthy, male smokers (at least 20 packs per year of smoking history) were enrolled in this study, and they possessed normal lung function.
Consequently, the following groups were obtained: A, B, C, D, and control. Each group BDR-N and BDR-P patients: A-N, A-P; B-N, B-P; C-N, C-P; D-N, D-P.
During disease progression, the lung function and symptoms of patients varied frequently, which led to changes regarding the combined assessment and severity of COPD. We followed-up the 20 recruited COPD patients for 1 year with combined assessment per 3 month and clinically observed that the development of COPD severity often followed the progression pattern of A-B-D (progressing from A to B group to D group) or A-C-D (progressing from A group to C group to D group), with only few patients progressing step-by-step from B to C groups. Hence, we proposed two clinical experimental models for further comparison within A-B-D and A-C-D groups.
Sample
Using EDTA anticoagulation tubes, peripheral blood was collected. All samples were numbered, and leukocytes were immediately extracted.
Isolation of peripheral leukocytes
The protocol of leukocyte isolation was as follows:
- Fresh whole blood was slowly added to a 15 mL centrifuge tube containing the lymphocyte separation solution or ficoll. Blood was placed over lymphocyte separated liquid, ensuring that both liquids did not mix and that the interface was clear.
- The samples were centrifuged at 3,500 rpm for 20 min at 18°C, then delaminated, discarding the supernatant fluid.
- The leukocyte layer was carefully separated with a pipette and removed to a new centrifuge tube.
- Phosphate-buffered saline (10 mL) was added to the centrifuge tube, samples were centrifuged at 2,000 rpm for 10 min at 18°C, and the upper fluid was discarded.
- Phosphate-buffered saline (5 mL) was added again to the centrifuge tube, followed by centrifugation at 2,000 rpm for 5 min at 18°C. The fluid was discarded and stored at −80°C in liquid nitrogen.
RNA extraction
Total RNA was isolated via the Trizol extraction method (Invitrogen, Carlsbad, CA, USA). RNA integrity and concentration were tested using an Agilent 2100 BioAnalyzer (Agilent Technologies, Santa Clara, CA, USA). We obtained an average of 4.4 μg of total RNA. The mean RNA integrity number was 8.9, and the ratio of 28S/18S was >1.5.
Small RNA library construction and Sequencing
The procedure followed a previously published protocol.15–18 According to the manufacturer’s protocol, we prepared the library as follows:
- Filtering small RNA: We used 200 ng to 1 μg of RNA samples, then separated RNA segments of different sizes via sodium dodecyl sulfate-polyacrylamide gel electrophoresis (SDS-PAGE), selected 18–30 nt (14–30 ssRNA Ladder Marker, Takara, ) stripe, and recycled.
- Adaptor ligation: We prepared a connection 3′adaptor system (TruSeq Small RNA Sample Pre Kit, Illumina, San Diego, CA, USA) utilizing the following reaction conditions: 70°C for 2 min; 28°C for 1 h; 28°C for 15 min. Then, we added the 5′adaptor mix system with the following reaction conditions: 70°C for 2 min; 28°C for 1 h.
- RT-PCR: We prepared the first strand master mix and super script II (Invitrogen) reverse transcription (reaction condition: 70°C for 2 min; 50°C for 1 h); this was followed by several rounds of PCR amplification with PCR primer cocktail and PCR master mix to enrich the cDNA fragments (reaction conditions: 98°C for 30 s; 11 cycles of 98°C for 10 s, 60°C for 30 s, 72°C for 15 s; 72°C for 10 min; 4°C hold).
- Purify PCR products: Subsequently, the PCR products were purified with SDS-PAGE, dissolving the recycled products in ethidium bromide solution.
- Validation of the library: The final library was quantified in two ways: determination of the average molecule length using the Agilent 2100 bioanalyzer instrument (Agilent DNA 1000 reagents) and quantifying the library via qRT-PCR (TaqMan Probe, Thermo Fisher Scientific, Waltham, MA, USA).
- Sequencing libraries: The qualified libraries were amplified on cBot to generate the cluster on the flowcell. Furthermore, the amplified flowcell was sequenced single end on the HiSeq 2000 System (Illumina); reading length 50 was the most frequently used sequencing strategy.
Small RNA sequencing data analysis
Subsequent to filtering out low quality and adapter reads, the clean reads were aligned to the human reference genome (version 19) utilizing the short oligonucleotide alignment program 2.0 program (Microsoft Corporation, Redmond, WA, USA).19 Occurrences of each of the unique sequence reads were counted as sequence tags (the number of reads for each tag reflects the relative expression level), and only those small RNA sequences of 18 to 30 nt were retained for further analysis.16 The expression amount of every miRNA in each sample was calculated. The DEGseq method20 was used to identify differentially expressed miRNAs within the COPD groups (A/B/C/D and BDR-N and BDR-P groups) as well as between the groups (COPD vs control group) in accordance with the standard of selection: log2 ratio ≥1 and P≤0.001. The miRNAs target prediction was done via DIANA-microT21 (web server v5.0). To obtain dependable prediction, KEGG pathway22 analysis was carried out to identify significantly enriched gene ontology terms and pathways associated with the target genes using miRPath,23 with a cutoff of corrected P-value <0.05.
RT-PCR validation of large samples
The clinical sample size of COPD (A/B/C/D groups) was expanded to 20 cases per group. The differentially expressed miRNAs were validated via qRT-PCR. The procedure included three steps: miRNA isolation (miRNeasy Mini Kit, QIAGEN, Hilden, Germany), cDNA synthesis (miScript II RT Kit, QIAGEN), and qRT-PCR (miScript SYBR Green PCR Kit, QIAGEN). According to the manufacturer’s protocol and previously published protocol,24 a specific experimental process was carried out. The qRT-PCR was run on the Applied Biosystems 7500 Fast Real-Time PCR System (Foster City, CA, USA), using U6 as internal reference gene.
Statistical analysis
Small RNA sequencing data were filtered and screened in accordance with the standard (qvalue ≤0.001 and abs (log2(Y/X)) ≥1). Relative expression level profiles of selected miRNAs from qRT-PCR experiments were used as independent variable. The relative expression of miRNAs was calculated using Microsoft Excel (2007), comparing cycle threshold (Ct) values. The data are depicted with the software Graphpad prism 5 (Graphpad Software Inc., La Jolla, CA, USA).
Results
Patients
Between January 1, 2015, and November 31, 2015, 141 COPD patients were diagnosed and invited to participate in this study. The ratio of male to female was 8–2. The age distribution is 38–82 years. A number of male COPD patients were 112, and 88 were agreed to take part in the study. Sixty-eight male patients, with a smoking history of at least 20 pack-years, agreed to fill in the questionnaire survey and agreed for collection of peripheral blood samples. However, 48 patients had other comorbidities. In the end, we selected 20 stable COPD patients (Figure 1), 5 patients per group (A/B/C/D groups, Table 1). The control group consisted of six patients with a mean age of 61.5 years.
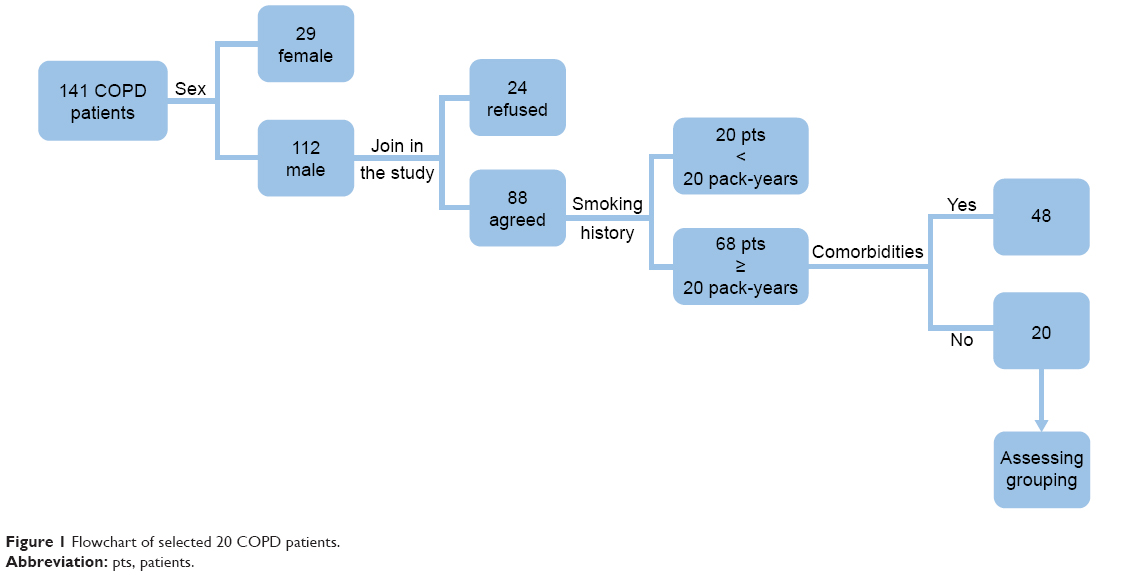 | Figure 1 Flowchart of selected 20 COPD patients. |
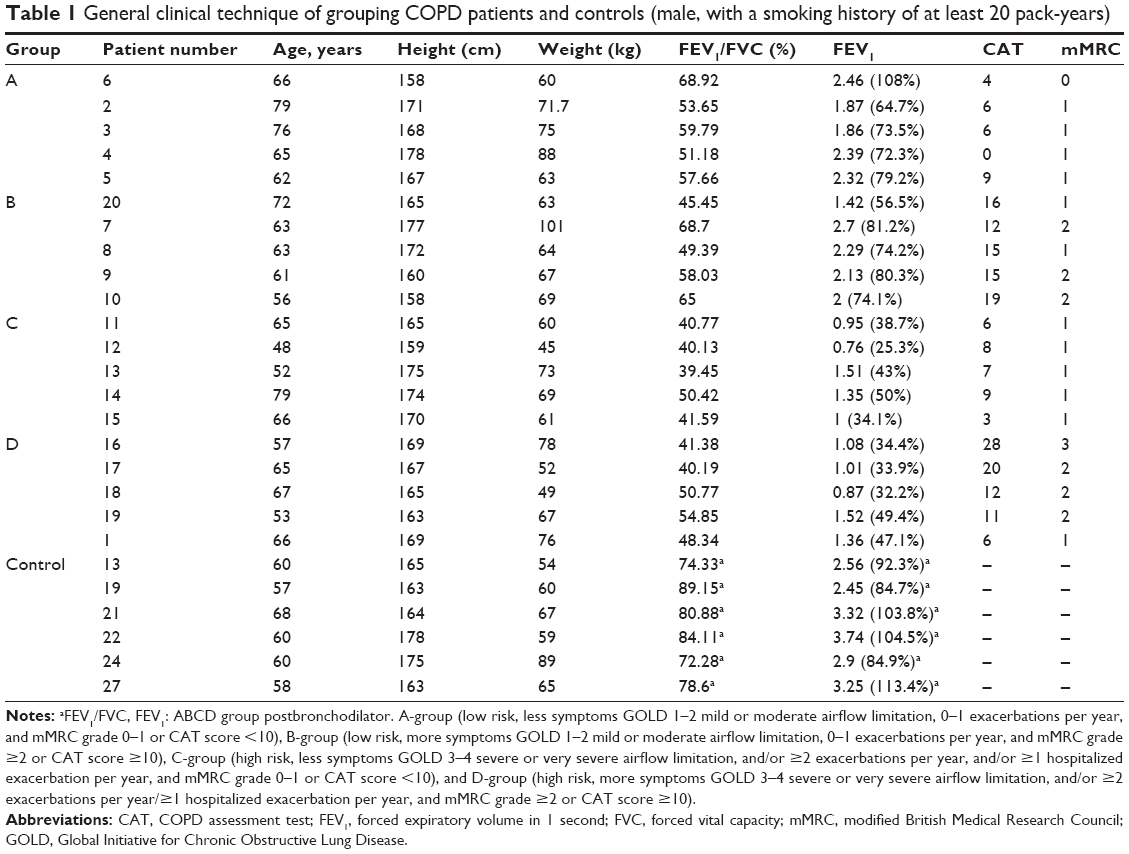 | Table 1 General clinical technique of grouping COPD patients and controls (male, with a smoking history of at least 20 pack-years) |
Small RNA sequencing data description and annotation
The average of the raw sequencing data (NCBI SRX2502315) for the next-generation sequencing reads of 26 samples was 14.3 M. Following filtering out low quality reads and adapter reads, the mean value of final clean reads was 12.9 M. The total percentage of sequence tag length between 20 and 24 (nt) was 74, and the mean value of detected miRNAs in each sample was 890 (Table S1). The expression level of every miRNA was calculated for each sample.
Differentially expressed miRNAs between COPD patients and control
Compared with the healthy controls, there were 1,715 differentially expressed miRNAs, including 51 upregulated and 18 downregulated, in COPD patients.
The comparison of differentially expressed miRNAs among ABCD groups
Compared to control, all COPD groups had 19 differentially expressed miRNAs in common. Of these, miR-3177-3p was downregulated and 17 miRNAs were upregulated in all groups (Table 2). A Venn diagram presents the 19 miRNAs in detail in Figure 2.
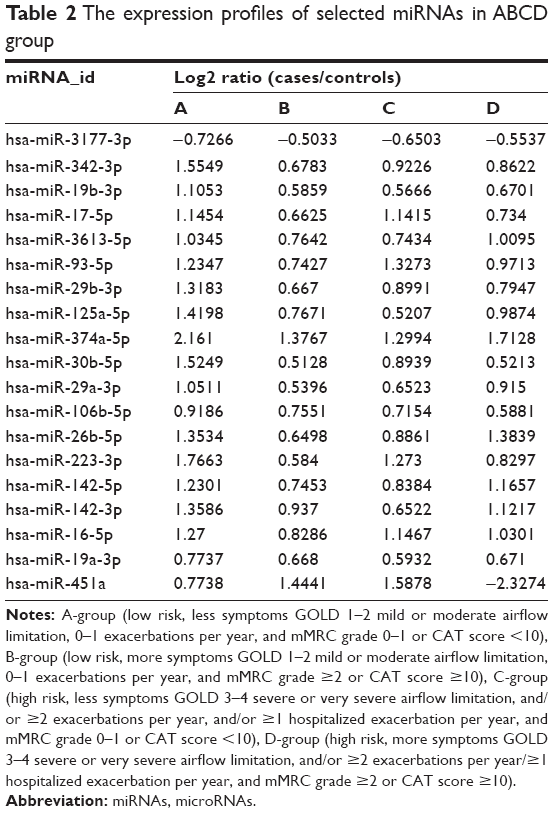 | Table 2 The expression profiles of selected miRNAs in ABCD group |
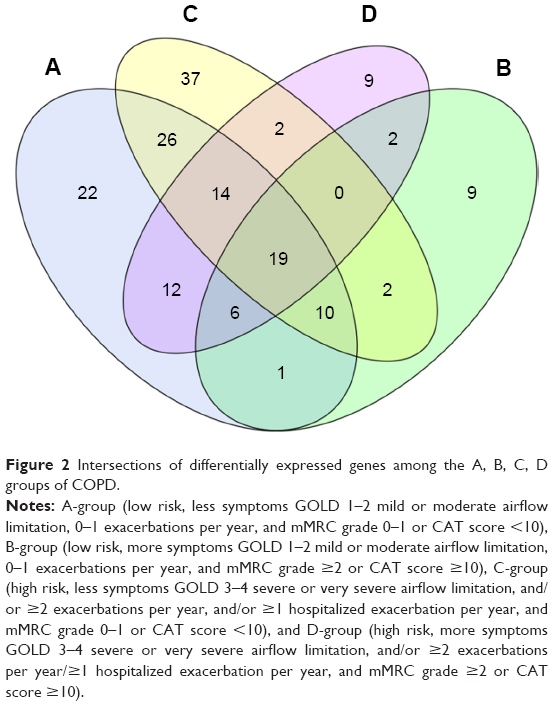 | Figure 2 Intersections of differentially expressed genes among the A, B, C, D groups of COPD. |
Compared with the healthy controls, there were 33 downregulated miRNAs and 87 upregulated miRNAs in A group; there were 23 downregulated miRNAs and 27 upregulated miRNAs in B group; there were 44 downregulated miRNAs and 80 upregulated miRNAs in C group; and there were 24 downregulated miRNAs and 65 upregulated miRNAs in D group. The profile of differentially expressed miRNAs is given in Figure 3.
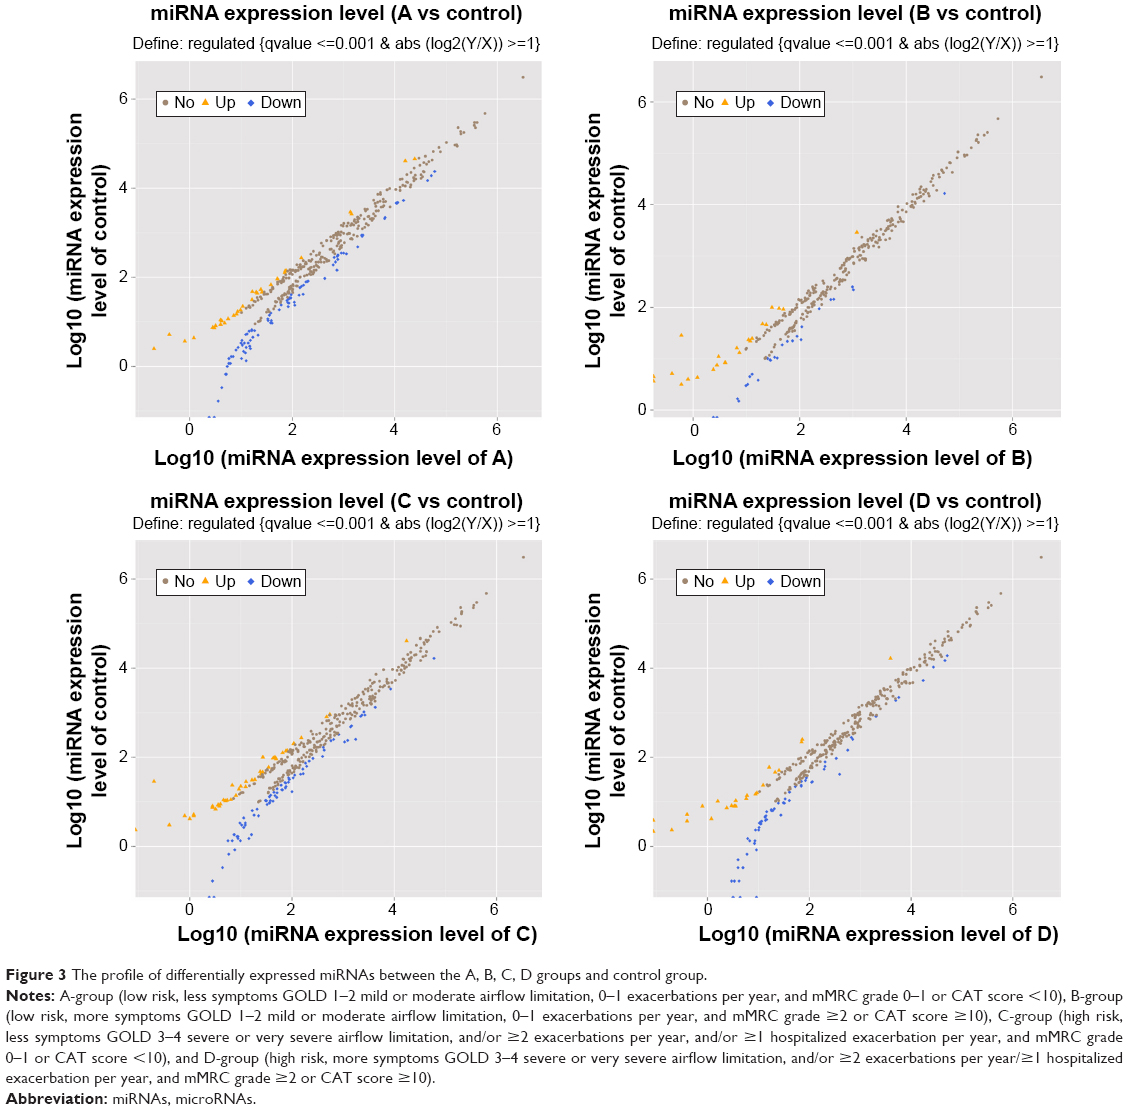 | Figure 3 The profile of differentially expressed miRNAs between the A, B, C, D groups and control group. |
Surprisingly, we detected that the expression level of miR-106b-5p in A group was the highest and in D group the lowest. In other words, miR-106b-5p may negatively correlate with disease severity of COPD. miR-125a-5p was upregulated in all groups and was inversely correlated with ABC, but the expression level was elevated again in D-group. miR-451a was upregulated in ABC and positively correlated with ABC; however, expression was downregulated in D-group. Thus, these three miRNAs (miR-106b-5p, miR-125a-5p, and miR-451a) are noteworthy, especially the common upregulated miRNAs (miR-106b-5p and miR-125a-5p).
In our study, enrichment analysis was carried out to reveal relevant pathways. Via KEGG analysis, the representative signaling pathways of these targeted genes were found to be involved in the regulation of autophagy, toll-like receptor signaling pathway, non-small-cell lung cancer, and arrhythmogenic right ventricular cardiomyopathy (Table 3), all of which are involved as complications of COPD.
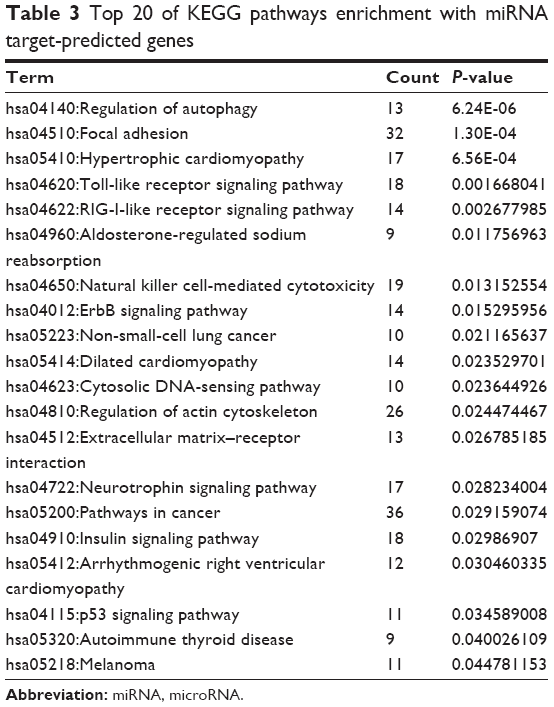 | Table 3 Top 20 of KEGG pathways enrichment with miRNA target-predicted genes |
Differentially expressed miRNAs in the progression of experimental groups
In the progression of ABD, we detected 21 common differentially expressed miRNAs, of which only miR-183-5p was found to be continually downregulated. In the progression of ACD, we found 33 common differentially expressed miRNAs (including miR-183-5p); however, there were no continuously upregulated or downregulated miRNAs (Table 4).
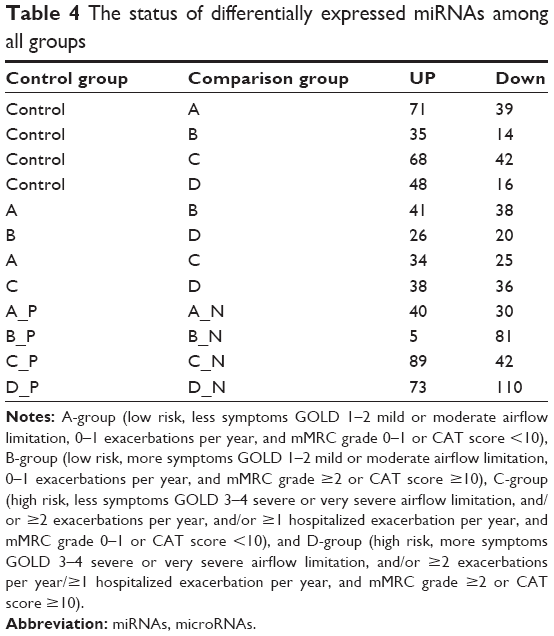 | Table 4 The status of differentially expressed miRNAs among all groups |
Detected miRNAs between BDR-P and BDR-N groups
Within each group, an average of 51.75 miRNAs were upregulated and 65.75 miRNAs were downregulated in BDR-N groups, compared to BDR-P groups. Respective BDR-P and -N groups of ABCD had 10 differentially expressed known miRNAs in common. Only miR-100-5p was upregulated in all negative groups. These 10 miRNA sets are presented in detail in the Venn diagram (Figure 4). Consequently, miR-100-5p may be used as a biological marker for the evaluation of bronchial obstruction reversibility.
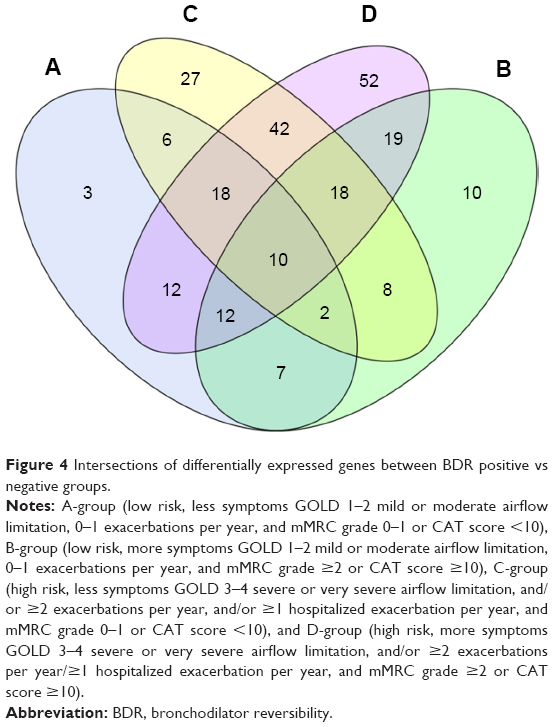 | Figure 4 Intersections of differentially expressed genes between BDR positive vs negative groups. |
Discussion
COPD is a multifactorial disorder caused by environmental determinants, most commonly cigarette smoking, and genetic risk factors.6 Unfortunately, few studies have successfully unraveled the genetic predisposition and pathogenetic mechanisms for COPD.25 Dysregulation of miRNAs has been reported to be involved in the pathogenesis of pulmonary diseases, including COPD.26 In previous studies, miR-146a27,28 has been considered closely related to inflammatory responses of COPD, via regulation of its targets COX2, TRAF6, and IRAK1 and involvement in NF-kB and toll-like receptor signaling. Moreover, Wang et al29 observed that miR-34 could inhibit the expression of CD80 and CD86 as well as the secretion of IFN-α to restrain dendritic cell dysfunction in COPD patients. Furthermore, miR-34c has been reported to be correlated with the severity of emphysema in COPD by modulating its predicted targets.30 Consequently, via regulation of mRNA degradation and translational repression, miRNAs affect different biological process of COPD, such as inflammatory responses, emphysematous lesions, and tissue repair.31
It was reported that 234 miRNAs were detected by miRNA microarray in current smokers with COPD, and miR-145-5p could be a promising biomarker of COPD.12 Because of the different characteristics of selected COPD patients and the different method used, our results might be different. By next-generation sequencing, we found 1,715 differentially expressed miRNAs, and 7 miRNAs (hsa-miR-3177-3p, hsa-miR-19b-3p, hsa-miR-3613-5p, hsa-miR-93-5p, hsa-miR-29a-3p, hsa-miR-142-5p, and hsa-miR-19a-3p) might be novel in COPD. 12 miRNAs (miR-342-3p,32 miR-17-5p,13 miR-16-5p,13 miR-29b-3p,32,33 miR-26b-5p,33 miR-125a-5p,13,34 miR-106b-5p,33 miR-223-3p,35 miR-142-3p,36 miR-30b-5p,36 miR-374a-5p,37 and miR-451a37) had been reported in previous COPD studies. It has been reported that miR-29b38 and miR-106b39 are involved in TGF-β1 signaling. Previous studies33–39 employed the spirometric-based staging of the degree of airflow obstruction and examined airway epithelial cells, serum, plasma, and lung tissue using microarray or RT-PCR.
Furthermore, we found that miR-106b-5p and miR-125a-5p might be potential markers of COPD. And it was an exciting discovery that miR-106b-5p was negatively correlated to severity of COPD; this was validated via qRT-PCR in large samples (Table 5 and Figure 5A). Recent studies about miR-106b-5p40–43 and miR-125a-5p44–48 are mainly related to other diseases, and few studies relate to COPD. Soeda et al33 reported that miR-106b plasma levels are evidently downregulated in COPD and are negatively correlated with disease duration. In this study, miR-106b-5p was upregulated. The cause for this inconsistency might due to different samples used, different technology followed, and different regions studied. However, the correlation was consistent; the previous study merely did not classify the patients with COPD and clarify regulatory mechanisms. We speculate the upregulation of miR-106b-5p in our study might be involved in signaling pathways, including TGF-β signal pathway, cell cycle, p53 signal pathway, apoptosis, and lung cancer. These pathways have been shown to be related to COPD development. Kosacka et al49 assessed serum levels of apoptosis-related markers (sFasL, TNFα, p53, and bcl-2) in COPD patients, the study described the vital role of apoptosis in the pathogenesis of COPD. Morty et al50 covered the impact of TGF-β signaling on COPD. Cigarette smoke may affect the reparative potential of lung fibroblasts, altering the progression of the cell cycle to S phase, which contributes to the development of pulmonary emphysema.51 And, it is widely known that lung cancer is one of the comorbidities of COPD. Previous studies13,34,52,53 have suggested miR-125 to be an important regulatory factor related to inflammation and further proposed that miR-125 might be connected with COPD and involved in disease pathogenesis; however, the authors did not expound the specific relationship. We found miR-125a-5p to be upregulated in COPD in all ABCD groups, which was confirmed via qRT-PCR in large samples (Table 5 and Figure 5B), and it might also be involved in the Wnt signaling pathway via its targeted gene SMAD4, thus affecting the process of COPD. Consequently, we proposed miR-106b-5p and miR-125a-5p to be potential targets, especially the graded marker miR-106b-5p due to its relevancy to COPD severity.
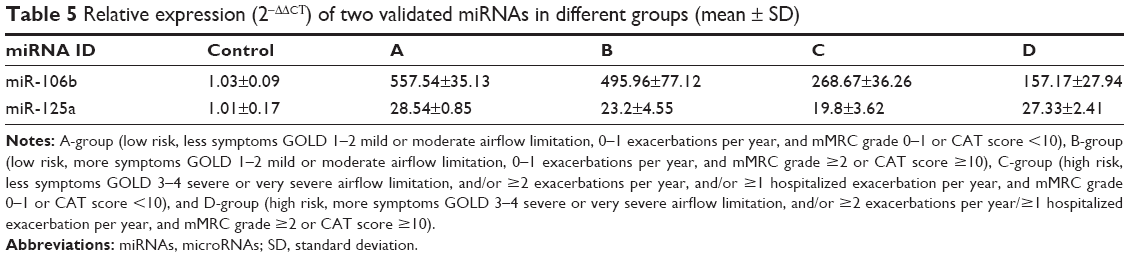 | Table 5 Relative expression (2−ΔΔCT) of two validated miRNAs in different groups (mean ± SD) |
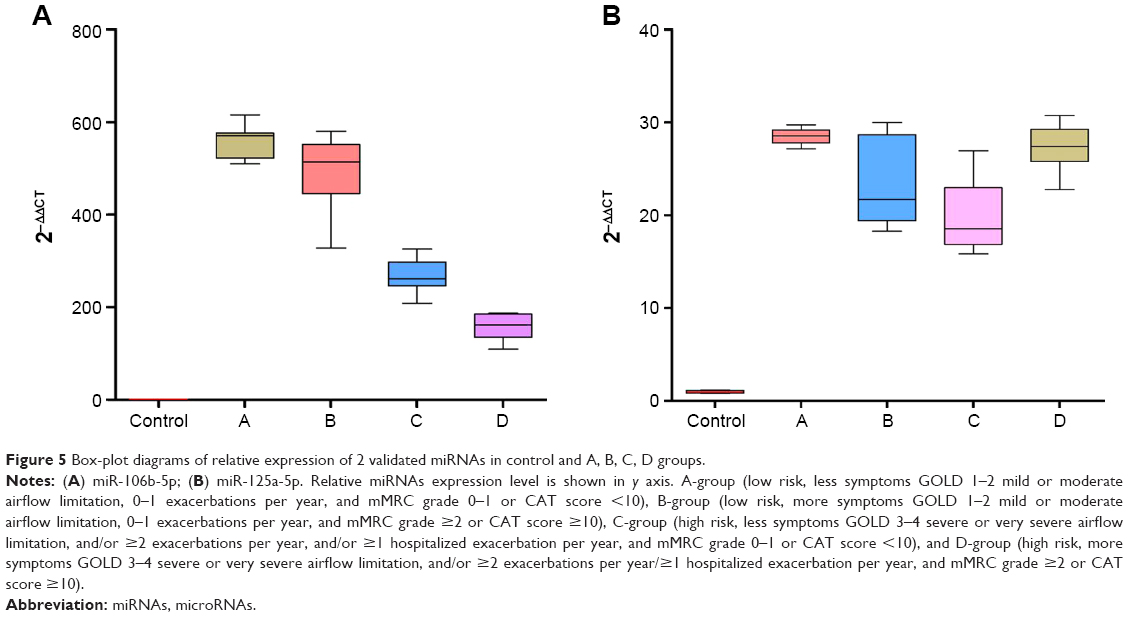 | Figure 5 Box-plot diagrams of relative expression of 2 validated miRNAs in control and A, B, C, D groups. |
- miR-183-5p might play a central role in the development of COPD, especially for the evaluation of disease progression (from A to B to D). This seems to explain the clinical phenomenon of different developmental directions for disease severity in patients with COPD. It was reported54 that miR-183-5p was related to immune responses, and so while chronic inflammatory responses were the significant pathophysiology in COPD, miR-183-5p might affect development of COPD by regulating inflammatory mediators.
- Moreover, miR-100-5p was commonly upregulated in the BDR negative groups. Akbas et al55 reported miR-100 to be related to COPD. However, there has currently been no correlative reference about miRNAs of BDR. Zanini et al56 reported bronchial reversibility as a more frequently present characteristic in COPD patients, although it could be one single phenotype of COPD. The ECLIPSE study showed that BDR was related to a decline of FEV1.57 Rhee58 speculated on whether pure patients with COPD with BDR can be considered having asthma–COPD overlap syndrome (ACOS). Consequently, we specifically analyzed the sequencing data and found promising viability for miR-100-5p as biological marker to evaluate BDR in COPD, further distinguishing between COPD, asthma, and ACOS.
The limitations of this study include that it focused on male smokers with COPD and did not account for variability in the BD response. Further studies are needed to confirm the role of miR-183-5p and miR-100-5p in l patient with long-term follow-up. Furthermore, the regulatory mechanism of miR-106b-5p and miR-125a-5p might need to be clarified in subsequent research.
Conclusion
Here, we have listed the evidence for miRNA as viable diagnostic biomarkers for COPD owing to its function in regulating apoptosis, NF-kB, Toll-like receptor, TGF-β, or Wnt signaling pathways, thereby affecting COPD progression. In particular, we found that miR-106b-5p might become a graded marker for the evaluation of COPD severity. Therefore, the expression of miRNA and its targeted mRNA may provide a promising possibility for therapeutic intervention at an early stage. However, it is still a challenge to fully expose the function and molecular interactions of miRNA in cell and animal models, which would contribute to formulate specific diagnosis as well as treatment strategies.
Disclosure
The authors report no conflicts of interest in this work.
References
Rycroft CE, Heyes A, Lanza L, Becker K. Epidemiology of chronic obstructive pulmonary disease: a literature review. Int J Chron Obstruct Pulmon Dis. 2012;7:457–494. | ||
Vestbo J, Hurd SS, Agustí AG, et al. Global strategy for the diagnosis, management, and prevention of chronic obstructive pulmonary disease. Am J Respir Crit Care Med. 2013;187(4):347–365. | ||
Fang X, Wang X, Bai C. COPD in China: the burden and importance of proper management. Chest. 2011;139:920–929. | ||
Miravitlles M, Soriano JB, García-Río F, et al. Prevalence of COPD in Spain: impact of undiagnosed COPD on quality of life and daily life activities. Thorax. 2009;64:863–868. | ||
Hvidsten SC, Storesund L, Wentzel-Larsen T, Gulsvik A, Lehmann S. Prevalence and predictors of undiagnosed chronic obstructive pulmonary disease in a Norwegian adult general population. Clin Respir J. 2010;4(1):13–21. | ||
Decramer M, Janssens W, Miravitlles M. Chronic obstructive pulmonary disease. Lancet. 2012;379(9823):1341–1351. | ||
Agusti A, Calverley PM, Celli B, et al. Characterisation of COPD heterogeneity in the ECLIPSE cohort. Respir Res. 2010;11:122. | ||
Anthonisen NR, Connett JE, Kiley JP, et al. Effects of smoking intervention and the use of an inhaled anticholinergic bronchodilator on the rate of decline of FEV1. The lung health study. JAMA. 1994;272(19):1497–1505. | ||
Shaw JG, Vaughan A, Dent AG, et al. Biomarkers of progression of chronic obstructive pulmonary disease (COPD). J Thorac Dis. 2014;6(11):1532–1547. | ||
Tzortzaki EG, Papi A, Neofytou E, Soulitzis N, Siafakas NM. Immune and genetic mechanisms in COPD: possible targets for therapeutic interventions. Curr Drug Targets. 2013;14(2):141–148. | ||
Leidinger P, Keller A, Borries A, et al. Specific peripheral miRNA profiles for distinguishing lung cancer from COPD. Lung Cancer. 2011;74(1):41–47. | ||
Wang M, Huang Y, Liang Z, et al. Plasma miRNAs might be promising Biomarkers of chronic obstructive pulmonary disease. Clin Respir J. 2016;10(1):104–111. | ||
Kara M, Kirkil G, Kalemci S. Differential expression of microRNAs in chronic obstructive pulmonary disease. Adv Clin Exp Med. 2016;25(1):21–26. | ||
Doyle I, Ratcliffe M, Walding A, et al. Differential gene expression analysis in human monocyte-derived macrophages: impact of cigarette smoke on host defence. Mol Immunol. 2010;47(5):1058–1065. | ||
McGinn J, Czech B. Small RNA library construction for high-throughput sequencing methods. Mol Biol. 2014;1093:195–208. | ||
Xu G, Wu J, Zhou L, et al. Characterization of the small RNA transcriptomes of androgen dependent and independent prostate cancer cell line by deep sequencing. PLoS One. 2010;5(11):e15519. | ||
Podnar J, Deiderick H, Huerta G, Hunicke-Smith S. Next-generation sequencing RNA-seq library construction. Curr Protoc Mol Biol. 2014;106(4):1–19. | ||
Park G, Borkovich KA. Small RNA isolation and library construction for expression profiling of small RNAs from Neurospora and Fusarium using illumina high-throughput deep sequencing. Methods Mol Biol. 2012;883:155–164. | ||
Li R, Yu C, Li Y, et al. SOAP2: an improved ultrafast tool for short read alignment. Bioinformatics. 2009;25(15):1966–1967. | ||
Wang L, Feng Z, Wang X, Wang X, Zhang X. DEGseq: an R package for identifying differentially expressed genes from RNA-seq data. Bioinformatics. 2010;26(1):136–138. | ||
Paraskevopoulou MD, Georgakilas G, Kostoulas N, et al. DIANA-microT web server v5.0: service integration into miRNA functional analysis workflows. Nucleic Acids Res. 2013;41(Web Server issue): W169–W173. | ||
Ashburner M, Ball CA, Blake JA, et al. Gene ontology: tool for the unification of biology. The Gene Ontology Consortium. Nat Genet. 2000;25(1):25–29. | ||
Kanehisa M, Araki M, Goto S, et al. KEGG for linking genomes to life and the environment. Nucleic Acids Res. 2008;36(Database issue):D480–D484. | ||
Costa MC, Leitão AL, Enguita FJ. MicroRNA profiling in plasma or serum using quantitative RT-PCR. Methods Mol Biol. 2014;1182:121–129. | ||
Berndt A, Leme AS, Shapiro SD. Emerging genetics of COPD. EMBO Mol Med. 2012;4(11):1144–1155. | ||
Comer BS, Ba M, Singer CA, Gerthoffer WT. Epigenetic targets for novel therapies of lung diseases. Pharmacol Ther. 2015;147:91–110. | ||
Wang R, Li M, Zhou S, et al. Effect of a single nucleotide polymorphism in miR-146a on COX-2 protein expression and lung function in smokers with chronic obstructive pulmonary disease. Int J Chron Obstruct Pulmon Dis. 2015;10:463–473. | ||
Taganov KD, Boldin MP, Chang KJ, Baltimore D. NF-κB-dependent induction of microRNA miR-146, an inhibitor targeted to signaling proteins of innate immune responses. Proc Natl Acad Sci U S A. 2006;103(33):12481–12486. | ||
Wang X, Zhang C, Huang G, et al. Resveratrol inhibits dysfunction of dendritic cells from chronic obstructive pulmonary disease patients through promoting miR-34. Int J Clin Exp Pathol. 2015;8(5):5145–5152. | ||
Savarimuthu Francis SM, Davidson MR, Tan ME, et al. MicroRNA-34c is associated with emphysema severity and modulates SERPINE1 expression. BMC Genomics. 2014;15:88. | ||
Osei ET, Florez-Sampedro L, Timens W, Postma DS, Heijink IH, Brandsma CA. Unravelling the complexity of COPD by microRNAs: it’s a small world after all. Eur Respir J. 2015;46(3):807–818. | ||
Molina-Pinelo S, Pastor MD, Suarez R, et al. MicroRNA clusters: dysregulation in lung adenocarcinoma and COPD. Eur Respir J. 2014;43(6):1740–1749. | ||
Soeda S, Ohyashiki JH, Ohtsuki K, Umezu T, Setoguchi Y, Ohyashiki K. Clinical relevance of plasma miR-106b levels in patients with chronic obstructive pulmonary disease. Int J Mol Med. 2013;31(3):533–539. | ||
Van Pottelberge GR, Mestdagh P, Bracke KR, et al. MicroRNA expression in induced sputum of smokers and patients with chronic obstructive pulmonary disease. Am J Respir Crit Care Med. 2011;183(7):898–906. | ||
Hua L, Zheng W, Xia H, Zhou P, An L. Integration of multi-microarray datasets to identify chronic obstructive pulmonary disease-related miRNAs. Biomed Mater Eng. 2015;26(Suppl 1):S1903–S1915. | ||
Ellis KL, Cameron VA, Troughton RW, Frampton CM, Ellmers LJ, Richards AM. Circulating microRNAs as candidate markers to distinguish heart failure in breathless patients. Eur J Heart Fail. 2013;15(10):1138–1147. | ||
Ezzie ME, Crawford M, Cho JH, Orellana R, Zhang S. Gene expression networks in COPD: microRNA and mRNA regulation. Thorax. 2012;67:122–123. | ||
Yang T, Liang Y, Lin Q, et al. MiR-29 mediates TGFβ1-induced extracellular matrix synthesis through activation of PI3K-AKT pathway in human lung fibroblasts. J Cell Biochem. 2013;114(6):1336–13342. | ||
Ivanovska I, Ball AS, Diaz RL, et al. MicroRNAs in the miR-106b family regulate p21/CDKN1A and promote cell cycle progression. Mol Cell Biol. 2008;28(7):2167–2174. | ||
Liu F, Gong J, Huang W, et al. MicroRNA-106b-5p boosts glioma tumorigenesis by targeting multiple tumor suppressor genes. Oncogene. 2014;33(40):4813–4822. | ||
Zhang JX, Song W, Chen ZH, et al. Prognostic and predictive value of a microRNA signature in stage II colon cancer: a microRNA expression analysis. Lancet Oncol. 2013;14(13):1295–1306. | ||
Wang J, Yu JT, Tan L, et al. Genome-wide circulating microRNA expression profiling indicates biomarkers for epilepsy. Sci Rep. 2015;5:9522. | ||
Deiuliis J, Mihai G, Zhang J, et al. Renin-sensitive microRNAs correlate with atherosclerosis plaque progression. J Hum Hypertens. 2014;28(4):251–258. | ||
Khalyfa A, Kheirandish-Gozal L, Bhattacharjee R, Khalyfa AA, Gozal D. Circulating microRNAs as potential biomarkers of endothelial dysfunction in obese children. Chest. 2016;149(3):786–800. | ||
Coppola N, Potenza N, Pisaturo M, et al. Liver microRNA hsa-miR-125a-5p in HBV chronic infection: correlation with HBV replication and disease progression. PLoS One. 2013;8(7):e65336. | ||
Ozcan O, Kara M, Yumrutas O, Bozgeyik E, Bozgeyik I, Celik OI. MTUS1 and its targeting miRNAs in colorectal carcinoma: significant associations. Tumour Biol. 2016;37(5):6637–6645. | ||
Sand M, Skrygan M, Sand D, et al. Expression of microRNAs in basal cell carcinoma. Br J Dermatol. 2012;167(4):847–855. | ||
Jiang L, Huang Q, Chang J, Wang E, Qiu X. MicroRNA HSA-miR-125a-5p induces apoptosis by activating p53 in lung cancer cells. Exp Lung Res. 2011;37(7):387–398. | ||
Kosacka M, Porębska I, Korzeniewska A, et al. Serum levels of apoptosis-related markers (sFasL, TNF-a, p53 and bcl-2) in COPD patients. Pneumonol Alergol Pol. 2016;84(1):11–15. | ||
Morty RE, Königshoff M, Eickelberg O. Transforming growth factor-b signaling across ages from distorted lung development to chronic obstructive pulmonary disease. Proc Am Thorac Soc. 2009;6(7):607–613. | ||
D’Anna C, Cigna D, Costanzo G, et al. Cigarette smoke alters cell cycle and induces inflammation in lung fibroblasts. Life Sci. 2015;126:10–18. | ||
Lee HM, Kim TS, Jo EK. MiR-146 and miR-125 in the regulation of innate immunity and inflammation. BMB Rep. 2016;49(6):311–318. | ||
Sun YM, Lin KY, Chen YQ. Diverse functions of miR-125 family in different cell contexts. J Hematol Oncol. 2013;6:6. | ||
Rider CF, Yamamoto M, Günther OP, et al. Controlled diesel exhaust and allergen coexposure modulates microRNA and gene expression in humans: effects on inflammatory lung markers. J Allergy Clin Immunol. 2016;138(6):1690–1700. | ||
Akbas F, Coskunpinar E, Aynaci E, Oltulu YM, Yildiz P. Analysis of serum micro-RNAs as potential biomarker in chronic obstructive pulmonary disease. Exp Lung Res. 2012;38(6):286–294. | ||
Zanini A, Cherubino F, Zampogna E, Croce S, Pignatti P, Spanevello A. Bronchial hyperresponsiveness, airway inflammation, and reversibility in patients with chronic obstructive pulmonary disease. Int J Chron Obstruct Pulmon Dis. 2015;10:1155–1161. | ||
Vestbo J, Edwards LD, Scanlon PD, et al. Changes in forced expiratory volume in 1 second over time in COPD. N Engl J Med. 2011;365(13):1184–1192. | ||
Rhee CK. Phenotype of asthma-chronic obstructive pulmonary disease overlap syndrome. Korean J Intern Med. 2015;30(4):443–449. |
Supplementary material
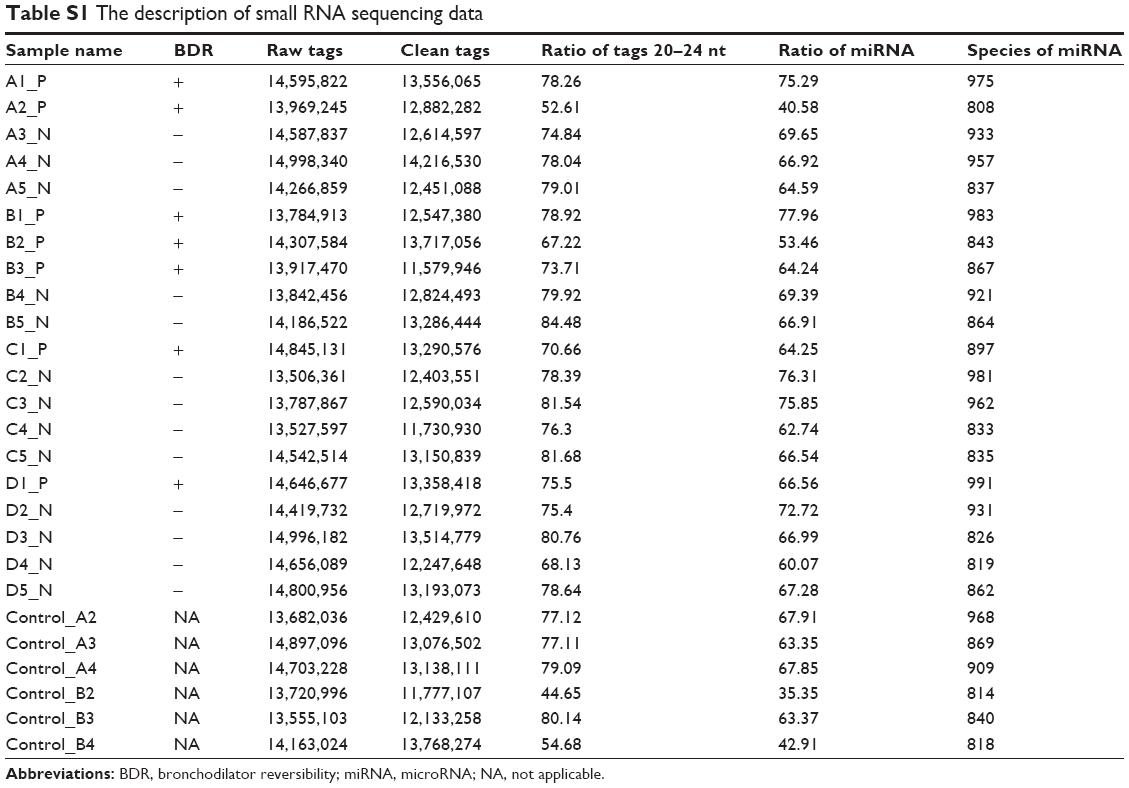 | Table S1 The description of small RNA sequencing data |
 © 2017 The Author(s). This work is published and licensed by Dove Medical Press Limited. The
full terms of this license are available at https://www.dovepress.com/terms
and incorporate the Creative Commons Attribution
- Non Commercial (unported, 3.0) License.
By accessing the work you hereby accept the Terms. Non-commercial uses of the work are permitted
without any further permission from Dove Medical Press Limited, provided the work is properly
attributed. For permission for commercial use of this work, please see paragraphs 4.2 and 5 of our Terms.
© 2017 The Author(s). This work is published and licensed by Dove Medical Press Limited. The
full terms of this license are available at https://www.dovepress.com/terms
and incorporate the Creative Commons Attribution
- Non Commercial (unported, 3.0) License.
By accessing the work you hereby accept the Terms. Non-commercial uses of the work are permitted
without any further permission from Dove Medical Press Limited, provided the work is properly
attributed. For permission for commercial use of this work, please see paragraphs 4.2 and 5 of our Terms.