Back to Journals » Neuropsychiatric Disease and Treatment » Volume 19
Peripheral Blood Th1/Th17 Immune Cell Shift is Associated with Disease Activity and Severity of AQP4 Antibody Sero-Positive Neuromyelitis Optica Spectrum Disorder
Authors Cao F ![]() , Wang Y
, Wang Y ![]() , Wei R, Li C
, Wei R, Li C ![]() , Cheng Y, Zhou Y
, Cheng Y, Zhou Y ![]() , Jin T, Zhang H, Lin L, Xu B
, Jin T, Zhang H, Lin L, Xu B ![]()
Received 21 July 2023
Accepted for publication 2 November 2023
Published 9 November 2023 Volume 2023:19 Pages 2413—2421
DOI https://doi.org/10.2147/NDT.S425759
Checked for plagiarism Yes
Review by Single anonymous peer review
Peer reviewer comments 2
Editor who approved publication: Dr Roger Pinder
Fangzheng Cao,1,* Yiqi Wang,2,* Ruili Wei,3 Chunrong Li,2 Yifan Cheng,2 Yu Zhou,1 Tianyu Jin,1 Houwen Zhang,1 Luting Lin,4 Bin Xu5
1The Second Clinical Medical College of Zhejiang Chinese Medical University, Hangzhou, People’s Republic of China; 2Department of Neurology, Center for Rehabilitation Medicine, People’s Hospital of Hangzhou Medical College, Zhejiang Provincial People’s Hospital, Hangzhou, People’s Republic of China; 3Department of Neurology, First Affiliated Hospital, Zhejiang University School of Medicine, Hangzhou, People’s Republic of China; 4School of Pharmaceutical Sciences, Zhejiang Chinese Medical University, Hangzhou, People’s Republic of China; 5Department of Neurology, The Second Affiliated Hospital of Zhejiang Chinese Medical University, Hangzhou, People’s Republic of China
*These authors contributed equally to this work
Correspondence: Bin Xu, Department of Neurology, The Second Affiliated Hospital of Zhejiang Chinese Medical University, Hangzhou, People’s Republic of China, Email [email protected]
Purpose: Neuromyelitis optica spectrum disorder (NMOSD) is a rare recurrent autoimmune disease of the central nervous system. However, to date, the peripheral blood profile of the T helper cell subsets in NMOSD remains controversial and poorly understood. This study aimed to compare the levels of helper T cell subsets in the peripheral blood from patients with NMOSD in different phases of the disease and studied their correlation with the clinical severity of the disease.
Patients and methods: We used flow cytometry with cellular membrane surface staining to measure the levels of helper T cell subsets in 50 patients with NMOSD during the attack (n = 25) and remission (n = 25) phases and in 21 healthy controls.
Results: Patients with NMOSD had higher levels of Th1 and Th17 cells in the attack phase compared to parallel populations in the remission phase and healthy controls. Th1/Th2 and Th17/Treg ratios were positively correlated with the severity of the disease in the attack phase of NMOSD. In contrast, Treg cell levels were negatively correlated with the severity of the disease in the attack phase in patients with NMOSD.
Conclusion: The peripheral blood immune profile in NMOSD towards a Th1/Th17 cell-mediated pro-inflammatory immune response, which is associated with disease activity and severity of neuromyelitis optica spectrum disorder.
Keywords: neuromyelitis optica spectrum disorder, helper T cell, flow cytometry, lymphocyte subsets
Introduction
Neuromyelitis optica spectrum disorder (NMOSD) is a rare and recurrent central nervous system autoimmune disease that is clinically characterized by optic neuritis and longitudinally extensive transverse myelitis.1 Recent epidemiological studies indicate that the prevalence and incidence of NMOSD ranged from 2.6–4.9/100,000 and 0.39–0.6/100,000 person-years in Asia, respectively.2 However, the precise mechanisms underlying the development and progression of NMOSD remain unclear. Anti-aquaporin 4 IgG antibodies (AQP4-IgG) were discovered in 2004, and many scholars have focused on the humoral immune aspects of the disease.3,4 However, as patients with NMOSD with AQP4-IgG-negative continue to be identified,5 an increasing number of studies have found that antibody conversion in patients with NMOSD with AQP4-IgG-positive does not correlate sufficiently with the rates of disease recurrence and the severity of clinical symptoms.6,7 These findings suggest that the pathogenesis of NMOSD is not simply due to the high expression of AQP4-IgG secreted by B lymphocytes, which are commonly recognized as mediators of humoral immunity.
T lymphocytes are the main lymphocytes that mediate cellular immunity and have various biological functions. Previous research has shown that a significant number of CD4+ T cells infiltrate the blood vessels of NMOSD lesions, suggesting helper T (Th) cells are involved in NMOSD pathogenesis.8 According to their different functions, Th cells can be further classified into different subpopulations, such as Th1, Th2, Th17, and regulatory T (Treg) cells.
Th1 and Th2 cells are the first identified CD4+ T cell subtypes derived from naïve CD4+ T cells (Th0) that maintain a dynamic balance in the organism. Th1 cells are associated with cellular immunity and Th2 cells humoral immunity. However, studies on the Th1/Th2 balance in the peripheral blood of patients with NMOSD are rare and controversial.9,10 It remains unclear whether Th1 or Th2 cells dominate the pathogenesis of NMOSD. Th17 and Tregs exhibit contrasting immunological functions. Th17 cells secrete pro-inflammatory cytokines, such as IL-17 and IL-22, to cause inflammation, while Treg cells secrete IL-10 and TGF-β to suppress immune responses.11 The role of Th17 cells and Treg cells in NMOSD has gradually gained attention in recent years, however, the proportion of Th17 and Treg cells and their clinical significance in patients with NMOSD remain unknown, especially Treg cells.
This study aimed to compare the levels of Th1, Th2, Th17, and Treg cells in the peripheral blood of patients with NMOSD during different phases of the disease and to study their correlation with the clinical severity of the disease.
Methods
Patients
We recruited 50 patients with NMOSD (25 in the attack phase and 25 in the remission phase) and 21 healthy controls (HC) from the Second Affiliated Hospital of Zhejiang Chinese Medical University and Zhejiang Provincial People’s Hospital from October 2021 to September 2023. The 50 patients were enrolled according to the 2015 diagnostic criteria for NMOSD.1 AQP4 antibody-positive NMOSD patients were defined as those who were diagnosed with AQP4 antibody seropositive current or previous. An attack was defined as a new or recurrent neurological symptom that persisted for at least 24 hours without fever, infection, or other autoimmune diseases. The attack phase was defined as the period <1 month after an attack, and the remission phase was defined as the period >1 month after an attack. This study was carried out following the Declaration of Helsinki and was approved by the Ethics Committees of the Second Affiliated Hospital of Zhejiang Chinese Medical University and Zhejiang Provincial People’s Hospital. Informed consent was obtained from all participants. Demographic data for patients are shown in Table 1.
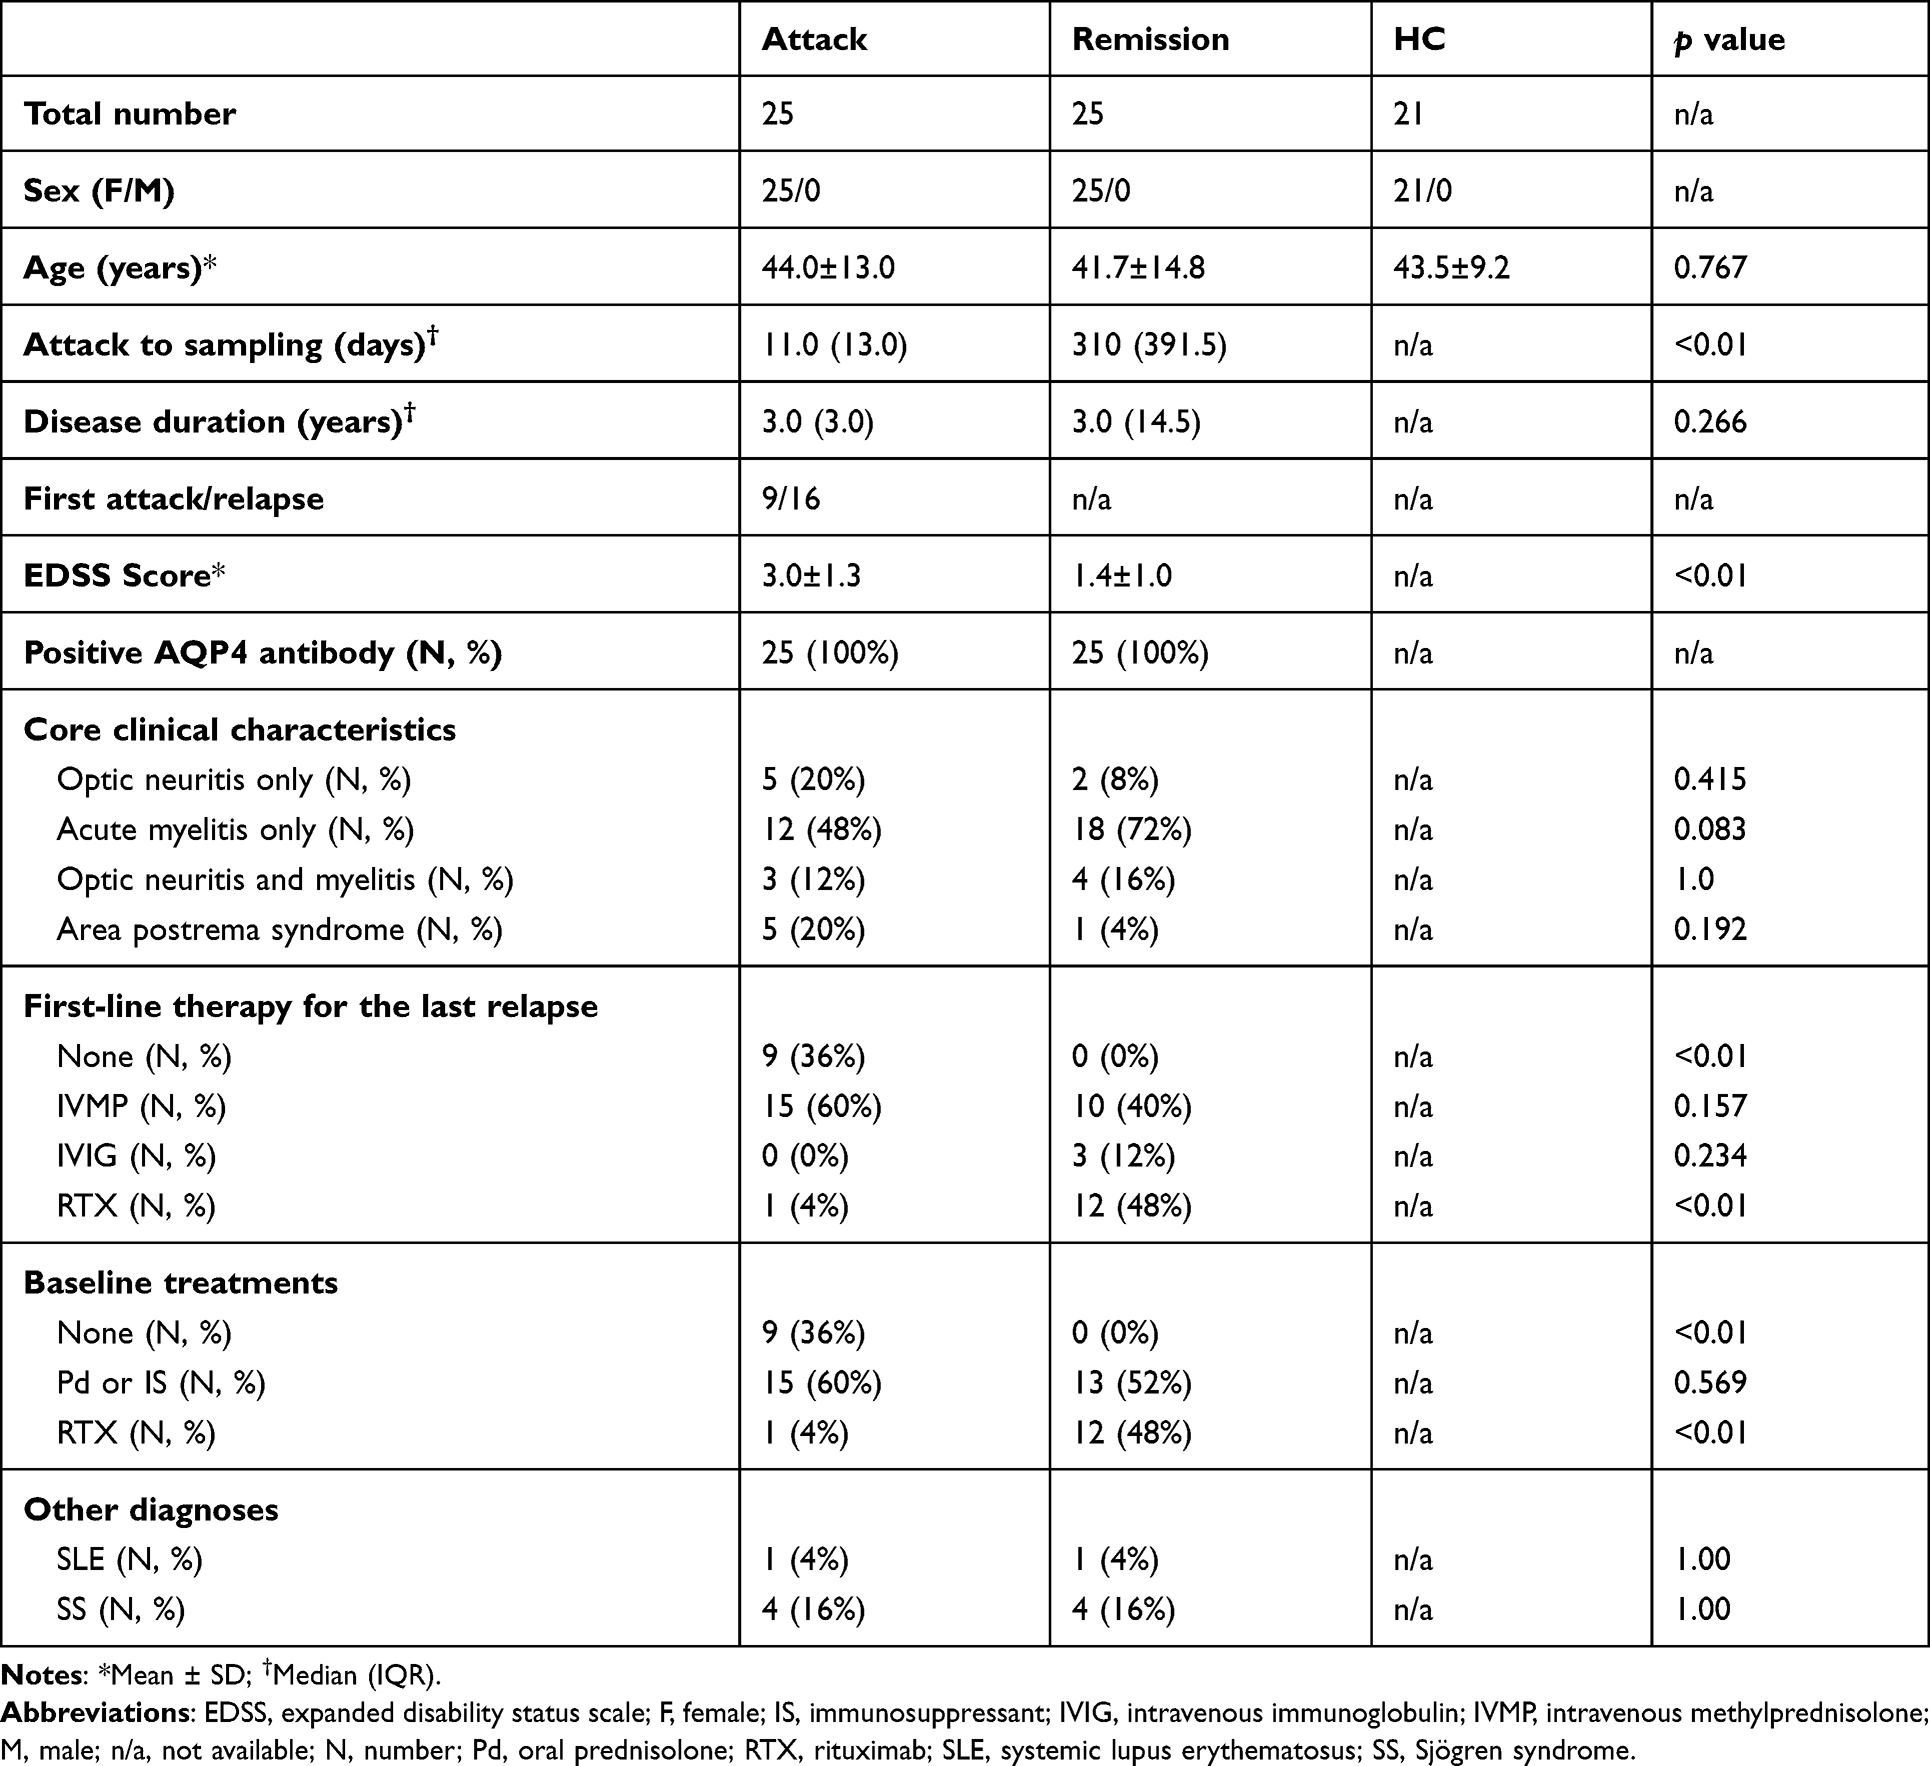 |
Table 1 Demographic Data of the Patients |
Clinical Information Collection
The hospital’s electronic medical record review system was used to collect clinical data from patients with NMOSD diagnosed in the two neurology departments. These data included sex, age, date of the last attack, past medical history, serum AQP4-antibody status, disease duration, date of the first attack, clinical symptoms, and expanded disability status scale (EDSS) scores.
Sample Collection
Peripheral blood samples (2 mL) were collected from fasting patients in EDTA-K2 anticoagulant vacuum blood collection tubes (BD Vacutainer) in the morning. The samples were stored at 4°C and flow cytometry analysis was performed within 6 hours after sample collection.
Flow Cytometry Analysis
Sample blood (100 µL) was taken and surface staining was performed using mouse anti-human fluorescent antibodies, including BV605-CD3, Alexa Fluor 700-CD4, BV421-CD127, PE-CD25, PE-Cy7-CCR6, and APC-CXCR3 (all the antibodies were from BD Pharmingen). Leukocytes were isolated using lysing buffer (BD Pharmingen) according to the manufacturer’s instructions. Each data was collected using a BD FACSCanto flow cytometer (BD Biosciences) and FlowJo X V10.0.7 software for further data analysis. We defined T lymphocytes as CD3+ cells from the lymphocyte gate; helper T cells as CD4+ cells from the T lymphocyte gate; Th1, Th2, Th17, and Treg cells as CXCR3+CCR6-, CXCR3-CCR6-, CXCR3-CCR6+, CD127lowCD25+ cells from the helper T cell gate, respectively.12 Meanwhile, the Th1/Th2 and Th17/Treg ratio was defined as CD3+CD4+CXCR3+CCR6-/CD3+CD4+CXCR3-CCR6-, and CD3+CD4+CXCR3-CCR6+/CD3+CD4+CD127lowCD25+. The flow cytometry gating strategy is illustrated in Figure 1.
 |
Figure 1 The flow cytometry gating strategy and comparison of T lymphocyte subsets between the HC, remission, and attack phases of NMOSD. CD3+CD4+T cells are first gated from single lymphocytes. Th1 (CXCR3+CCR6-), Th2 (CXCR3-CCR6-), Th17 (CXCR3-CCR6+), and Treg (CD127lowCD25+) cells are finally gated from the CD3+CD4+ T cells population.12 The level of a kind of T cells is defined as the proportion of T cells in lymphocytes. |
Statistical Analysis
Demographic data for normally distributed patients are presented as mean ± SD and for non-normally distributed patients as median (IQR). Mean ± SD was used to represent levels for T lymphocyte subsets and T-cell ratios; the Kruskal–Wallis test was performed for three or more groups comparison, the Bonferroni-Dunn test for post hoc comparisons, and correlation analysis between EDSS scores and indicators was analyzed using Spearman’s rank correlation coefficient test. Chi-square and Fisher’s exact tests were used to compare indicators for categorical variables. SPSS 25 software was used for statistical analysis. Statistical significance was defined as p<0.05.
Results
Demographic Data
Demographic data are summarized in Table 1.
There were no significant differences between the three groups in terms of sex or age. Patients enrolled in the attack phase were naïve to attack-related treatment. No significant differences in positive AQP4 antibody percentage, disease duration, core clinical characteristics, or other diagnoses were observed between the attack and remission groups. Patients in the attack phase had a shorter time from attack to sampling (p < 0.01) and higher EDSS scores (p < 0.01) than patients in the remission phase. Nine patients in the attack phase experienced their first attack and were not treated with any immunotherapy. The number of patients who received immunosuppressive or oral prednisolone therapy at baseline during the two phases did not show statistical differences. Rituximab was used more in the remission phase than in the attack phase (p < 0.01). We analyzed the T lymphocyte subsets among different clinical phenotypes, and the levels of T lymphocyte subsets showed no difference among different core clinical characteristics. No significant difference was found between the first-line therapy and any T lymphocyte subsets. We also compared no immunotherapeutic treatment patients (first attack patients) with baseline treatment patients (including Pd, IS, and RTX) in the attack phase group and compared Pd and IS baseline treatment patients with RTX baseline treatment patients in the remission phase group; neither comparison showed significant differences in any T lymphocyte subsets.
Levels of T Lymphocyte Subsets in Lymphocyte
The number of T lymphocytes was defined as the proportion of T cells in the lymphocytes. (Figure 2A–F) shows a comparison of T lymphocyte subsets between the three groups. The levels of CD3+ and CD4+T cells did not differ between the three groups. (p = 0.064; p = 0.286). The levels of Th1 (p = 0.006; p = 0.001) and Th17 (p = 0.005; p = 0.018) cells in the attack group were significantly higher than those of the remission and HC groups. The levels of Th2 and Treg cells between the three groups were not significantly different (p = 0.507; p = 0.292). Elevated ratios of Th1/Th2 (p = 0.040; p = 0.001) and Th17/Treg (p = 0.046; p < 0.001) were detected in patients in the attack phase compared to those of the remission or HC group. (Figure 2G and H) shows the ratios of the T cell subsets between the three groups.
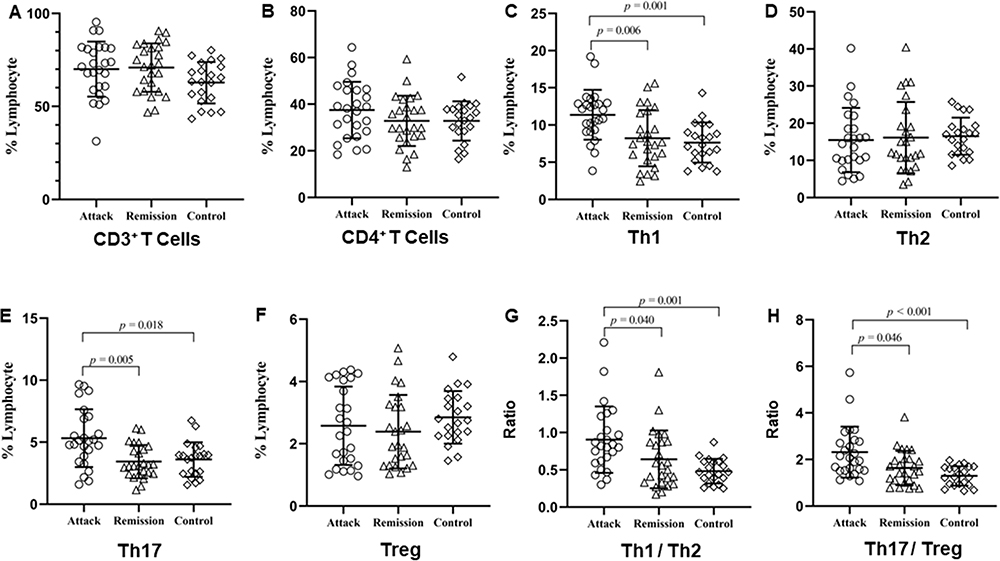 |
Figure 2 Comparison of T lymphocyte subsets between patients with NMOSD in the attack and remission phase and HC. (A–F) Comparison of levels of blood CD3+ T cells, CD4+ T cells, Th1, Th2, Th17, and Treg between patients with NMOSD in the attack and remission phase and HC. (G and H) Comparison of ratios of blood Th1/Th2 and Th17/Treg between patients with NMOSD in the attack and remission phase and HC. Hollow circles, hollow triangles, and hollow diamonds represent the levels or ratios of the corresponding T cells in the attack phase, remission phase, and healthy control group, respectively. NMOSD, neuromyelitis optica spectrum disorder; Th1, type 1 T helper cells; Th2, type 2 T helper cells; Th17, type 17 T helper cells; Treg, regulatory T cells. |
Correlation Between the T Lymphocyte Subset and the EDSS Score
The levels of T lymphocyte subsets and EDSS scores during the different phases of NMOSD were analyzed. During the attack phase, higher Treg cell levels were associated with lower EDSS scores (r = −0.431, p = 0.031). Higher Th1/Th2 and Th17/Treg ratios were significantly correlated with higher EDSS scores (r = 0.498, p = 0.011; r = 0.597, p = 0.002). No significant association was found between Th1, Th17, or Th2 cells and the EDSS score during the attack phase. Figure 3 shows the results of the patients in the attack phase. No correlation was found between the T lymphocyte subset and the EDSS score in patients in the remission phase.
 |
Figure 3 Correlation between the EDSS score and the levels or ratios of T lymphocyte subsets in the attack phase of patients with NMOSD. (A–D) Correlation analysis between EDSS score and levels of blood Th1, Th2, Th17 as well as Treg in the attack phase of patients with NMOSD; (E and F) Correlation analysis between EDSS score and the Th1/Th2 and Th17/Treg ratios in the attack phase of patients with NMOSD. EDSS, expanded disability status scale; NMOSD, neuromyelitis optica spectrum disorder; Th1, type 1 T helper cells; Th2, type 2 T helper cells; Th17, type 17 T helper cells; Treg, regulatory T cells. |
Discussion
Previous histopathological research showed that CD4+T cell infiltration was prominent among lesion sites during the acute phase of NMOSD and decreased when it entered remission, suggesting that helper T lymphocytes are involved in the pathogenesis of NMOSD.8 However, the peripheral blood profile of the Th cell subsets in NMOSD remains controversial and poorly understood. In the present study, peripheral blood levels of CD4+ T lymphocyte subsets, including Th1, Th2, Th17, and Tregs were assessed. Higher levels of Th1 and Th17 cells were observed in patients with NMOSD during the attack phase; the Th1/Th2 and Th17/Treg ratios were also higher and positively correlated with the severity of the clinical disease in the attack phase. Furthermore, a higher level of Tregs was correlated with a lower EDSS score in the attack phase of NMOSD was found in our study, although no significantly elevated levels of Treg cells were detected. This study showed an imbalance in peripheral blood T lymphocyte subsets in the attack phase of patients with NMOSD, which also implies that the Th1/Th17 immune cell shift was involved in the pathogenesis of NMOSD.
The classic Th1/Th2 paradigm has been studied in different autoimmune diseases for decades, and with the discovery of AQP4-IgG in NMOSD, some studies speculate that Th2 dominant immune states could be involved in the pathogenesis of NMOSD.13 However, previous studies on the paradigm in NMOSD are limited, old, and controversial. Uzawa et al reported no significant differences in Th1/Th2 imbalance in the attack phase of NMO compared to HC.9 Shimizu et al found that the proportion of Th1 cells was significantly higher in the acute phase of patients with NMO than in healthy controls and that the Th1/Th2 cell ratio was higher in patients with NMO during relapse than during remission.10 After matching patients by clinical characteristics, more cases were included in our study than in previous studies, which met the latest diagnostic criteria for NMOSD.1 Our study observed that the Th1 level and Th1/Th2 ratio of patients with NMOSD in the attack phase were higher than the patients in the remission and the HC group, consistent with the research by Shimizu et al, which could not support the dominancy of Th2 in NMOSD. In our study, a positive correlation was shown between the Th1/Th2 ratio and the EDSS score of NMOSD, which was not observed by Shimizu et al, implying that the Th1-dominant status is pathogenic in NMOSD. We speculate that the mechanism underlying this correlation may be related to the expression of cytokines and pro-inflammatory cells at lesion sites and the blood-brain barrier. Several cytokine studies have revealed that cerebrospinal fluid (CSF) and serum levels of IP-10, a pro-inflammatory chemokine involved in the activation and recruitment of monocytes and Th1 cells, are significantly increased in patients with NMOSD in the attack phase.14–17 Furthermore, astrocyte- and myelin-laden macrophages and T lymphocytes are prominently infiltrated at the lesion sites of NMOSD in the acute phase, consistent with the effect of IP-10. Therefore, the Th1/Th2 ratio could be a potential biomarker to predict disease severity, and the precise functions of Th1 and Th2 lymphocytes in NMOSD deserve further investigation.
Some studies have detected elevated levels of Th17 cells and their related cytokines and chemokines, such as IL-17, IL-6, and CXCL8, in the CSF and peripheral blood of patients with NMOSD during attacks.17–19 Our study also found higher levels of Th17 cells in patients with NMOSD during the attack phase than during the remission phase or in HC, which is consistent with previous findings. Neutrophil infiltration observed in the histopathological findings of acute NMOSD lesions may be caused by increased activation of Th17 cells and their cytokines.8 However, studies on Th17 cells in patients with NMOSD are few and rarely detect Th17/Treg balance. The role and changes in Treg cells in patients with NMOSD are still unknown and have received increasing attention in recent years. Beyond our expectations, considering as an immunomodulatory cell, we found no significant differences in Treg cell levels between patients with NMOSD at different phases, which is consistent with the previous study by Tanaka et al.20 However, we observed that EDSS scores were negatively correlated with Treg cell levels, suggesting that a high Treg cell level was correlated with a low clinical disease severity. A recent study reported a decrease in Treg cells during attacks in patients with NMOSD.21 Furthermore, based on an NMOSD mouse model, Treg cells were shown to reduce tissue damage by inhibiting macrophage, neutrophil, and T cell infiltration and modulating the inflammatory state of microglia, and lowering levels of chemokines and pro-inflammatory cytokines,21 supporting the negative correlation between Treg cells level and EDSS score in our study. No significantly different frequencies between the three groups of Treg cells were found that could be caused by patients with NMOSD in our study recruited with a relatively low EDSS score, and a study with similar results to ours did not list EDSS scores for patients with NMOSD.20 Furthermore, we also found a significant positive correlation between the EDSS score and the Th17/Treg ratio of patients with NMOSD during the attack phase, indicating that Th17/Treg imbalance could also represent a potential biomarker to predict the clinical severity of the disease.
As a first-line therapy to prevent relapses in NMOSD, azathioprine showed significant inhibition of the Th1 cell effect.22 In addition, Methotrexate and tacrolimus, which are also considered to be useful for NMOSD relapse prevention, are more likely to make Th1/Th2 balance toward a Th2 profile.23 The effect of these immunosuppressive agents supports our result that NMOSD is a Th1-mediated disease. However, interferon-β (IFN-β), which is thought to achieve efficacy in multiple sclerosis (MS) by inhibiting Th1 effects, is not as effective as MS in NMOSD.24,25 Attention needs to be paid to the role of Th17 and B cells in this phenomenon. IFN-β and other MS drugs (such as fingolimod, and glatiramer acetate) have been reported to be harmful to Th17-related autoimmune diseases, and elevate the B-cell-stimulating cytokine BAFF to promote B-cell survival to exacerbate the condition of the disease.24,25 Collectively, the evidence above supports our result that Th1/Th17 immune cell shift in NMOSD patients.
There are some limitations to this study. First, Due to the rarity of the disease, we were unable to include a large number of patients with NMOSD. Second, this study did not examine the levels of cytokines, or monitor the T lymphocyte subsets and AQP4 antibody titers of the same patient at different phases. In future research, we plan to increase the sample size, follow up on patients in the attack phase, and perform cytokine assays on their stored plasma samples.
Conclusion
Our study showed that the Th1/Th17 immune cell shift was associated with the disease activity and severity of NMOSD. Therefore, the concept that NMOSD is a Th2-dominated immune disease must be validated. Large prospective studies are needed to confirm these findings.
Acknowledgments
We would like to thank the Medical and Health Research Project of Zhejiang Province (grant number 2019KY120) and the Young Programme of the Department of Zhejiang Province Health and Planning Commission (grant number 2019RC005) for supporting our work.
Funding
This work was supported by the Medical and Health Research Project of Zhejiang Province (grant number 2019KY120) and the Young Programme of the Department of Zhejiang Province Health and Planning Commission (grant number 2019RC005).
Disclosure
The authors report no conflicts of interest in this work.
References
1. Wingerchuk DM, Banwell B, Bennett JL., et al. International consensus diagnostic criteria for neuromyelitis optica spectrum disorders. Neurology. 2015;85(2):177–189. doi:10.1212/WNL.0000000000001729
2. Papp V, Magyari M, Aktas O, et al. Worldwide incidence and prevalence of neuromyelitis optica: a systematic review. Neurology. 2021;96(2):59–77. doi:10.1212/WNL.0000000000011153
3. Lennon VA, Wingerchuk DM, Kryzer TJ, et al. A serum autoantibody marker of neuromyelitis optica: distinction from multiple sclerosis. Lancet. 2004;364(9451):2106–2112. doi:10.1016/S0140-6736(04)17551-X
4. Carnero Contentti E, Correale J. Neuromyelitis optica spectrum disorders: from pathophysiology to therapeutic strategies. J Neuroinflammation. 2021;18(1):208. doi:10.1186/s12974-021-02249-1
5. Hyun JW, Kim Y, Kim KH, et al. CSF GFAP levels in double seronegative neuromyelitis optica spectrum disorder: no evidence of astrocyte damage. J Neuroinflammation. 2022;19(1):86. doi:10.1186/s12974-022-02450-w
6. Liu J, Tan G, Li B, et al. Serum aquaporin 4-immunoglobulin g titer and neuromyelitis optica spectrum disorder activity and severity: a systematic review and meta-analysis. Front Neurol. 2021;12:746959. doi:10.3389/fneur.2021.746959
7. Zhang X, Liu X, Yu H, Deng B, Zhang Y, Chen X. Longitudinal evaluation of clinical characteristics of Chinese neuromyelitis optica spectrum disorder patients with different AQP4-IgG serostatus. Mult Scler Relat Disord. 2022;62:103786. doi:10.1016/j.msard.2022.103786
8. Takai Y, Misu T, Suzuki H, et al. Staging of astrocytopathy and complement activation in neuromyelitis optica spectrum disorders. Brain. 2021;144(8):2401–2415. doi:10.1093/brain/awab102
9. Uzawa A, Mori M, Hayakawa S, Masuda S, Nomura F, Kuwabara S. Expression of chemokine receptors on peripheral blood lymphocytes in multiple sclerosis and neuromyelitis optica. BMC Neurol. 2010;10(1):113. doi:10.1186/1471-2377-10-113
10. Shimizu Y, Ota K, Kubo S, et al. Association of Th1/Th2-related chemokine receptors in peripheral T cells with disease activity in patients with multiple sclerosis and neuromyelitis optica. Eur Neurol. 2011;66(2):91–97. doi:10.1159/000329576
11. Lee G. The balance of Th17 versus treg cells in autoimmunity. Int J Mol Sci. 2018;19(3). doi:10.3390/ijms19030730
12. Maecker HT, McCoy JP, Nussenblatt R. Standardizing immunophenotyping for the human immunology project. Nat Rev Immunol. 2012;12(3):191–200. doi:10.1038/nri3158
13. Salvador NRS, Brito MNG, Alvarenga MP, Alvarenga RMP. Neuromyelitis optica and pregnancy-puerperal cycle. Mult Scler Relat Disord. 2019;34:59–62. doi:10.1016/j.msard.2019.05.007
14. Uzawa A, Mori M, Arai K, et al. Cytokine and chemokine profiles in neuromyelitis optica: significance of interleukin-6. Mult Scler. 2010;16(12):1443–1452. doi:10.1177/1352458510379247
15. Antonelli A, Ferrari SM, Giuggioli D, Ferrannini E, Ferri C, Fallahi P. Chemokine (C-X-C motif) ligand (CXCL)10 in autoimmune diseases. Autoimmun Rev. 2014;13(3):272–280. doi:10.1016/j.autrev.2013.10.010
16. Shimizu F, Nishihara H, Sano Y, et al. Markedly increased IP-10 production by blood-brain barrier in neuromyelitis optica. PLoS One. 2015;10(3):e0122000. doi:10.1371/journal.pone.0122000
17. Kaneko K, Sato DK, Nakashima I, et al. CSF cytokine profile in MOG-IgG+ neurological disease is similar to AQP4-IgG+ NMOSD but distinct from MS: a cross-sectional study and potential therapeutic implications. J Neurol Neurosurg Psychiatry. 2018;89(9):927–936. doi:10.1136/jnnp-2018-317969
18. Hou MM, Li YF, He LL, et al. Proportions of Th17 cells and Th17-related cytokines in neuromyelitis optica spectrum disorders patients: a meta-analysis. Int Immunopharmacol. 2019;75:105793. doi:10.1016/j.intimp.2019.105793
19. Liu J, Mori M, Sugimoto K, et al. Peripheral blood helper T cell profiles and their clinical relevance in MOG-IgG-associated and AQP4-IgG-associated disorders and MS. J Neurol Neurosurg Psychiatry. 2020;91(2):132–139. doi:10.1136/jnnp-2019-321988
20. Tanaka S, Hashimoto B, Izaki S, Oji S, Fukaura H, Nomura K. Clinical and immunological differences between MOG associated disease and anti AQP4 antibody-positive neuromyelitis optica spectrum disorders: blood-brain barrier breakdown and peripheral plasmablasts. Mult Scler Relat Disord. 2020;41:102005. doi:10.1016/j.msard.2020.102005
21. Ma X, Qin C, Chen M, et al. Regulatory T cells protect against brain damage by alleviating inflammatory response in neuromyelitis optica spectrum disorder. J Neuroinflammation. 2021;18(1):201. doi:10.1186/s12974-021-02266-0
22. Ingelfinger F, Sparano C, Bamert D, et al. Azathioprine therapy induces selective NK cell depletion and IFN-gamma deficiency predisposing to herpesvirus reactivation. J Allergy Clin Immunol. 2023;151(1):280–286 e282. doi:10.1016/j.jaci.2022.09.010
23. Lv QK, Liu JX, Li SN, et al. Mycophenolate mofetil modulates differentiation of Th1/Th2 and the secretion of cytokines in an active crohn’s disease mouse model. Int J Mol Sci. 2015;16(11):26654–26666. doi:10.3390/ijms161125985
24. Axtell RC, Raman C, Steinman L. Type I interferons: beneficial in Th1 and detrimental in Th17 autoimmunity. Clin Rev Allergy Immunol. 2013;44(2):114–120. doi:10.1007/s12016-011-8296-5
25. Traub J, Hausser-Kinzel S, Weber MS. Differential Effects of MS therapeutics on B cells-implications for their use and failure in AQP4-positive NMOSD patients. Int J Mol Sci. 2020;21(14):5021. doi:10.3390/ijms21145021
 © 2023 The Author(s). This work is published and licensed by Dove Medical Press Limited. The
full terms of this license are available at https://www.dovepress.com/terms
and incorporate the Creative Commons Attribution
- Non Commercial (unported, 3.0) License.
By accessing the work you hereby accept the Terms. Non-commercial uses of the work are permitted
without any further permission from Dove Medical Press Limited, provided the work is properly
attributed. For permission for commercial use of this work, please see paragraphs 4.2 and 5 of our Terms.
© 2023 The Author(s). This work is published and licensed by Dove Medical Press Limited. The
full terms of this license are available at https://www.dovepress.com/terms
and incorporate the Creative Commons Attribution
- Non Commercial (unported, 3.0) License.
By accessing the work you hereby accept the Terms. Non-commercial uses of the work are permitted
without any further permission from Dove Medical Press Limited, provided the work is properly
attributed. For permission for commercial use of this work, please see paragraphs 4.2 and 5 of our Terms.