Back to Journals » Neuropsychiatric Disease and Treatment » Volume 19
Peripheral and Central Nervous System Biomarkers of Inflammation in Functional Seizures: Assessment with Magnetic Resonance Spectroscopy
Authors Mueller C ![]() , Sharma AA, Szaflarski JP
, Sharma AA, Szaflarski JP ![]()
Received 25 August 2023
Accepted for publication 21 November 2023
Published 5 December 2023 Volume 2023:19 Pages 2729—2743
DOI https://doi.org/10.2147/NDT.S437063
Checked for plagiarism Yes
Review by Single anonymous peer review
Peer reviewer comments 2
Editor who approved publication: Dr Roger Pinder
Christina Mueller,1 Ayushe A Sharma,2 Jerzy P Szaflarski3
1Department of Neurology, Heersink School of Medicine, University of Alabama at Birmingham, Birmingham, AL, USA; 2Department of Psychology, University of Alabama at Birmingham, Birmingham, AL, USA; 3Departments of Neurology, Neurobiology, and Neurosurgery, Heersink School of Medicine, University of Alabama at Birmingham, Birmingham, AL, USA
Correspondence: Christina Mueller, Department of Neurology, Heersink School of Medicine, University of Alabama at Birmingham, 1719 6th Ave S, Birmingham, AL, 35222, USA, Tel +1 205-975-4219, Fax +1 205-996-4802, Email [email protected]
Purpose: Inflammation may link trauma to clinical symptoms in functional seizures (FS). We compared brain temperature and metabolites in FS, psychiatric (PCs) and healthy controls (HCs) and quantified their associations with serum biomarkers of inflammation and clinical symptoms.
Patients and Methods: Brain temperature and metabolites were measured with whole-brain magnetic resonance spectroscopic imaging (MRSI) and compared between groups in regions of interest and the whole brain. Relationships with inflammatory biomarkers and symptoms were assessed with Pearson correlations.
Results: Brain temperature was higher in FS than HCs in the orbitofrontal cortex (OFC) and anterior cingulate gyrus (ACG) and lower in the occipital cortex and frontal lobe. PCs showed lower temperatures than HCs in the frontal lobe including precentral gyrus and in the cerebellum. Myo-inositol (MINO) was higher in FS than HCs in the precentral gyrus, posterior temporal gyrus, ACG and OFC, and choline (CHO) was higher in the occipital lobe. CHO was higher in PCs than HCs in the ACG and OFC, and N-acetylaspartate (NAA) was higher in the ACG. There were no significant correlations with the serum inflammatory biomarkers. In FS, brain temperature correlated with depression, quality of life, psychological symptoms, and disability, CHO correlated with disability, and MINO correlated with hostility, disability, and quality of life.
Conclusion: Some of the previously identified neuroimaging abnormalities in FS may be related to comorbid psychiatric symptoms, while others, such as abnormalities in sensorimotor cortex, occipital regions, and the temporo-parietal junction may be specific to FS. Overlapping MINO and temperature increases in the ACG and OFC in FS suggest neuroinflammation.
Keywords: brain temperature, magnetic resonance spectroscopy, functional seizures, inflammatory biomarkers, metabolites
A Letter to the Editor has been published for this article.
Introduction
Functional seizures (FS) are a subtype of functional neurological symptom disorder (FNSD). Their hallmark feature are recurrent episodes of altered awareness and abnormal motor behavior (ie, seizures) that clinically resemble epileptic seizures but are not attributable to epileptiform discharges. The etiology of FS is still being investigated and the field has seen an increased focus on identifying organic underpinnings of the disorder.1,2 For example, neuroimaging studies have uncovered abnormal brain structure and function in networks supporting salience, emotion regulation, self-agency, attention, and sensorimotor functions.1
Lifetime exposure to trauma is common among individuals with FS, yet how traumatic events are linked to brain structure and function in FS remains unclear.3–5 We recently proposed a two-hit model of FS pathophysiology which underscores the role of early life stressors (eg, physical, emotional) in later development of FNSD/FS in the setting of secondary trauma.2 We hypothesized that neuroinflammation (NI) is the pathophysiological process linking traumatic experiences with neural network alterations in FS.6 In this model, physical or psychological trauma activates the hypothalamic-pituitary-adrenal axis to release catecholamines,7 which causes the immune system to mount an inflammatory response. Interactions between the peripheral and central immune system lead to inflammatory responses in the brain, which leave the brain vulnerable to developing FS either spontaneously or in response to a second insult or trauma.8,9 Importantly, this model can account for the proportion of FS patients who do not report a history of trauma because inflammatory processes can be initiated through mechanisms other than trauma. To date, only two studies have directly tested inflammatory biomarkers in FS.10,11 Gledhill et al found elevations in TNF-related apoptosis-inducing ligand (TRAIL) and intercellular adhesion molecule (ICAM)-1 within 24 hours following FS compared to patients with epileptic seizures. In contrast, tumor necrosis factor (TNF) receptor 1 (TNF-R1) and monocyte chemoattractant protein (MCP)-1 were elevated following epileptic seizures compared to FS, supporting the idea that epileptic seizures and FS may have distinct inflammatory signatures.12 We recently described relationships between inflammatory biomarkers and white matter microstructure in the current study sample, showing associations between TNF-R1, interleukin (IL)-6, and ICAM-1, and neurite morphology in the uncinate fasciculus of FS patients, among other findings.11
Although NI may be difficult to quantify directly, advanced neuroimaging techniques allow us to detect metabolic abnormalities that point to the presence of NI.13–15 Magnetic Resonance Spectroscopic Imaging (MRSI) quantifies a number of brain metabolites that may be associated with NI, including choline (CHO), myo-inositol (MINO), and N-Acetyl-aspartate (NAA).13,16 MRSI can also be used to measure brain temperature, which may be a proxy for NI because heightened metabolic demands during NI increase temperature in the microenvironment.17,18
To provide support for the above two-hit hypothesis, we applied MRSI to assess whether FS are associated with abnormally elevated brain temperature and metabolites. We compared brain temperature, CHO, MINO, and NAA between 24 patients with FS, 27 psychiatric controls (PCs), and 18 healthy controls (HCs). We also assessed their relationships to serum levels of TNF-R1, TRAIL, IL-6, TNF-α, ICAM-1, and MCP-1, and to questionnaires assessing psychiatric symptoms, stressful life events, disability, and quality of life (QoL).
We hypothesized that brain temperature, CHO, and MINO would be higher and NAA lower in FS compared to PCs and HCs. We also hypothesized that brain temperature, CHO, and MINO would be higher and NAA lower in PCs compared to HCs. We hypothesized that higher brain temperature, CHO, and MINO, and lower NAA would be associated with higher levels of inflammatory biomarkers, more severe symptoms, and lower QoL in FS and PCs.
Materials and Methods
Study Design
The current study was a prospective, cross-sectional observational study comparing brain temperature and metabolites (CHO, MINO, NAA) and serum inflammatory biomarkers between FS, PCs, and HCs. We recruited two control groups to determine whether any identified brain abnormalities are specific to FS or could be due to the presence of psychiatric comorbidities, such as depression, anxiety, trauma, and dissociation, many of which have previously been linked to NI.19,20 TRAIL and ICAM-1 were measured due to their previously identified roles in FS and epileptic seizures.10 TNF-α, a pro-inflammatory cytokine, and its receptor, TNF-R1, have been shown previously to be elevated in depression and post-traumatic stress disorder (PTSD),21–23 and IL-6, a pro-inflammatory cytokine, has been linked to depression.24 Finally, MCP-1 is a chemokine involved in regulating the migration of monocytes and macrophages into the brain that has been linked to depression.25
The HC data have been previously reported as part of a repeatability analysis in Sharma et al.26 The serum biomarker and questionnaire data in the FS and PC groups have been previously reported in Mueller et al11 as part of an analysis investigating relationships between inflammatory biomarkers and white matter microstructure in FS.
Participants
Participants aged 15–60 years were recruited from the epilepsy monitoring unit and outpatient psychology clinics at the University of Alabama at Birmingham (UAB). FS patients had a documented diagnosis of FS.27 PCs were age-matched to FS participants and had a diagnosis of depression, anxiety, or PTSD. Both groups were undergoing standard-of-care pharmacological and non-pharmacological treatments. HCs reported no medical or mental health conditions. PCs and HCs were recruited through online advertisements. A phone screen was conducted to confirm inclusion and exclusion criteria, and information was checked against medical records when available. The following criteria were exclusionary: 1) autoimmune, inflammatory, or neurological condition (eg, epilepsy, stroke, multiple sclerosis), 2) pregnancy or plans to become pregnant during the study, 3) psychotic disorder (eg, schizophrenia), 4) personality disorder, 5) substance use disorder, 6) contraindications to MRI (eg, metallic implants or claustrophobia), 7) blood clotting disorder, and 8) conditions that would prevent participation. HCs did not provide blood samples or questionnaires.
Study Procedures
The study was conducted in accordance with the Declaration of Helsinki. The UAB Institutional Review Board approved the study procedures and written informed consent was obtained from all participants. Participants under 18 provided assent, and in these cases parents or legal guardians provided consent. Women of reproductive age underwent pregnancy testing. FS and PCs completed the Brief Trauma Questionnaire (BTQ),28 Dissociative Experiences Scale, second edition (DES-II),29 Somatoform Dissociation Questionnaire (SDQ),30 Symptom Checklist 90 (SCL-90),31 Holmes-Rahe Life Stress Inventory (LSI),32 Hospital Anxiety and Depression Scale (HADS),33 Quality of Life in Epilepsy short form (QOLIE-31),34 the World Health Organization Disability Assessment Schedule (WHODAS2.0),35 and a demographics form. FS patients reported the number of seizures experienced over the previous seven days.
Ten milliliters of blood were drawn into SST Vacutainers (BD, Franklin Lakes, NJ). Serum was separated by centrifugation and stored in −80°C freezers. The following inflammatory biomarkers were quantified via multiplex electrochemiluminescence using a Meso Scale Discovery QuickPlex SQ 120 imager (MSD, Rockville, MD): IL-6, TNF-α, ICAM-1, and MCP-1. TNF-R1 and TRAIL were quantified via R&D ELISA (Minneapolis, MN).
Neuroimaging
Neuroimaging was performed on a 3T Siemens Prisma Magnetom MRI with 20-channel head and neck coil (Siemens Healthineers, Erlangen, Germany). A T1-weighted Magnetization Prepared Gradient Echo (MPRAGE) sequence was acquired for anatomical reference with the following parameters: TR 2400ms, TE 2.22ms, flip angle: 8°, slice thickness 0.8mm, number of slices: 208, matrix: 256×256, voxel resolution: 0.8×0.8×0.8mm. A 3-dimensional echoplanar spectroscopic imaging (EPSI) sequence was acquired with TR1 1550ms, TR2 511ms, TE 17.6ms, inversion time for lipid signal suppression 198ms, GRAPPA acceleration factor 1.3, 71° flip angle, 280×280×180mm field-of-view, 50×50×18 matrix, and 5.6×5.6×10mm voxel resolution. A saturation band covered the eyes and sinuses and iterative shimming and off-resonance frequency adjustment were performed prior to acquisition.
Image Processing
MRSI data were processed with the Metabolite Imaging and Data Analysis System (MIDAS).16 The fully automated processing pipeline performs reconstruction of the spectroscopic data, magnetic field inhomogeneity correction, smoothing, and spectral fitting. Metabolite spectra were integrated with the water reference image. Voxel-wise temperature was calculated with the following formula: TCRE=−102.61×ΔH20-CRE +206.1°C, where ΔH20-CRE is the difference between locations of the water and creatine (CRE) peaks on the ppm scale. Temperature was corrected for gray and white matter content based on segmentation of the T1-weighted images. Metabolites (NAA, CHO, MINO) were expressed as CRE ratios using the SINorm module and interpolated to 4.375×4.375 × 5.625mm resolution. Temperature and metabolite maps were non-linearly warped into MNI 2mm space. The spatially normalized maps were exported from MIDAS and smoothed with AFNI’s 3dMedianFilter (2-voxel radius) followed by smoothing with an 8mm Gaussian kernel in SPM12 (https://www.fil.ion.ucl.ac.uk/) for MATLAB (version R2021a, MathWorks, Natick, MA). Only voxels with linewidths of 2.0 to 12.00 and cerebrospinal fluid content of <30% were used. Exported temperature maps are scaled so that a value of 0 corresponds to a temperature of 32°C. Voxels with temperatures outside the 35.0°C to 44.0°C range (raw values from 3 to 12) are physiologically impossible and were excluded from the analysis.
Statistical Analyses
Statistical analyses of region-of-interest (ROI)-based imaging outcomes, serum biomarkers, and questionnaire scores were conducted in IBM SPSS Statistics for Macintosh, v28.0 (IBM Corp, Armonk, NY). Group differences in continuous and categorical variables were assessed with independent-samples t-tests and Chi-square tests, respectively. Statistical significance was assumed at p<0.05 (two-tailed).
Mean temperature, CHO/CRE, MINO/CRE, and NAA/CRE were extracted with AFNI’s 3dROIstats function from the bilateral anterior cingulate gyrus (ACG), orbitofrontal cortex (OFC; Brodmann areas 10, 11, and 47), inferior frontal gyrus, precentral gyrus, temporo-parietal junction (TPJ; including the posterior superior temporal, supramarginal, and angular gyri), superior parietal lobe, and insula. The ROIs were selected based on prior literature showing abnormalities in FS in these regions.2 One-way analyses of variance (ANOVAs) were used to compare temperature (°C) and metabolites in the 14 ROIs (seven per hemisphere) among the three groups. ANOVAs were considered significant at p<0.0154 (corrected for 14 tests).36
Voxelwise group differences were assessed with AFNI’s 3dttest++. Three tests were run for each outcome testing the FS-PC, FS-HC, and PC-HC difference, respectively. Cluster thresholds were determined with the 3dFWHMx and 3dClustSim functions in AFNI. A voxel-level threshold of p<0.01 was applied, followed by the cluster extent threshold with nearest-neighbor 1 clustering, bi-sided thresholding, and α=0.05. The mean temperature and metabolite concentration were extracted from significant clusters for visualization. To determine relationships between brain outcomes, inflammatory biomarkers, and questionnaire outcomes, Pearson correlation coefficients were obtained in FS and PCs.
Results
Participant Characteristics
We screened 84 potential participants with FS, 42 of whom met inclusion criteria and were scheduled for the in-person visit. Thirteen FS participants withdrew before their visit, and five did not tolerate the MRI. The remaining 24 FS patients provided usable data. We screened 47 PCs, 31 of whom were scheduled. Four PCs withdrew before the visit, and 27 provided usable data. Twenty-two FS and 25 PCs provided blood and were included in correlations.
Table 1 shows demographic information and questionnaire means for FS and PCs. The mean age of HCs was 34.94 (SD=12.41), and did not differ from FS (t(40)=0.735, p=0.467) or PCs (t(43)=0.968, p=0.338). There were no differences in age, sex, or racial makeup between FS and PCs. The FS group reported higher HADS depression and anxiety, worse QoL related to seizure worry, emotional functioning, cognitive functioning, medication side effects, social functioning, and overall QoL than PCs. FS patients also reported higher somatization, obsessive-compulsive symptoms, depression, anxiety, phobic anxiety, psychoticism, and global psychological symptoms than PCs. Everyday dissociative experiences (DES-II) were more prevalent in FS compared to PCs, as was somatoform dissociation (SDQ). On the WHODAS2.0, FS patients reported greater disability than PCs in all six subdomains, and greater total disability. Significantly more FS (23/23 completed questionnaires) than PCs (21/27) reported lifetime trauma (p=0.016).
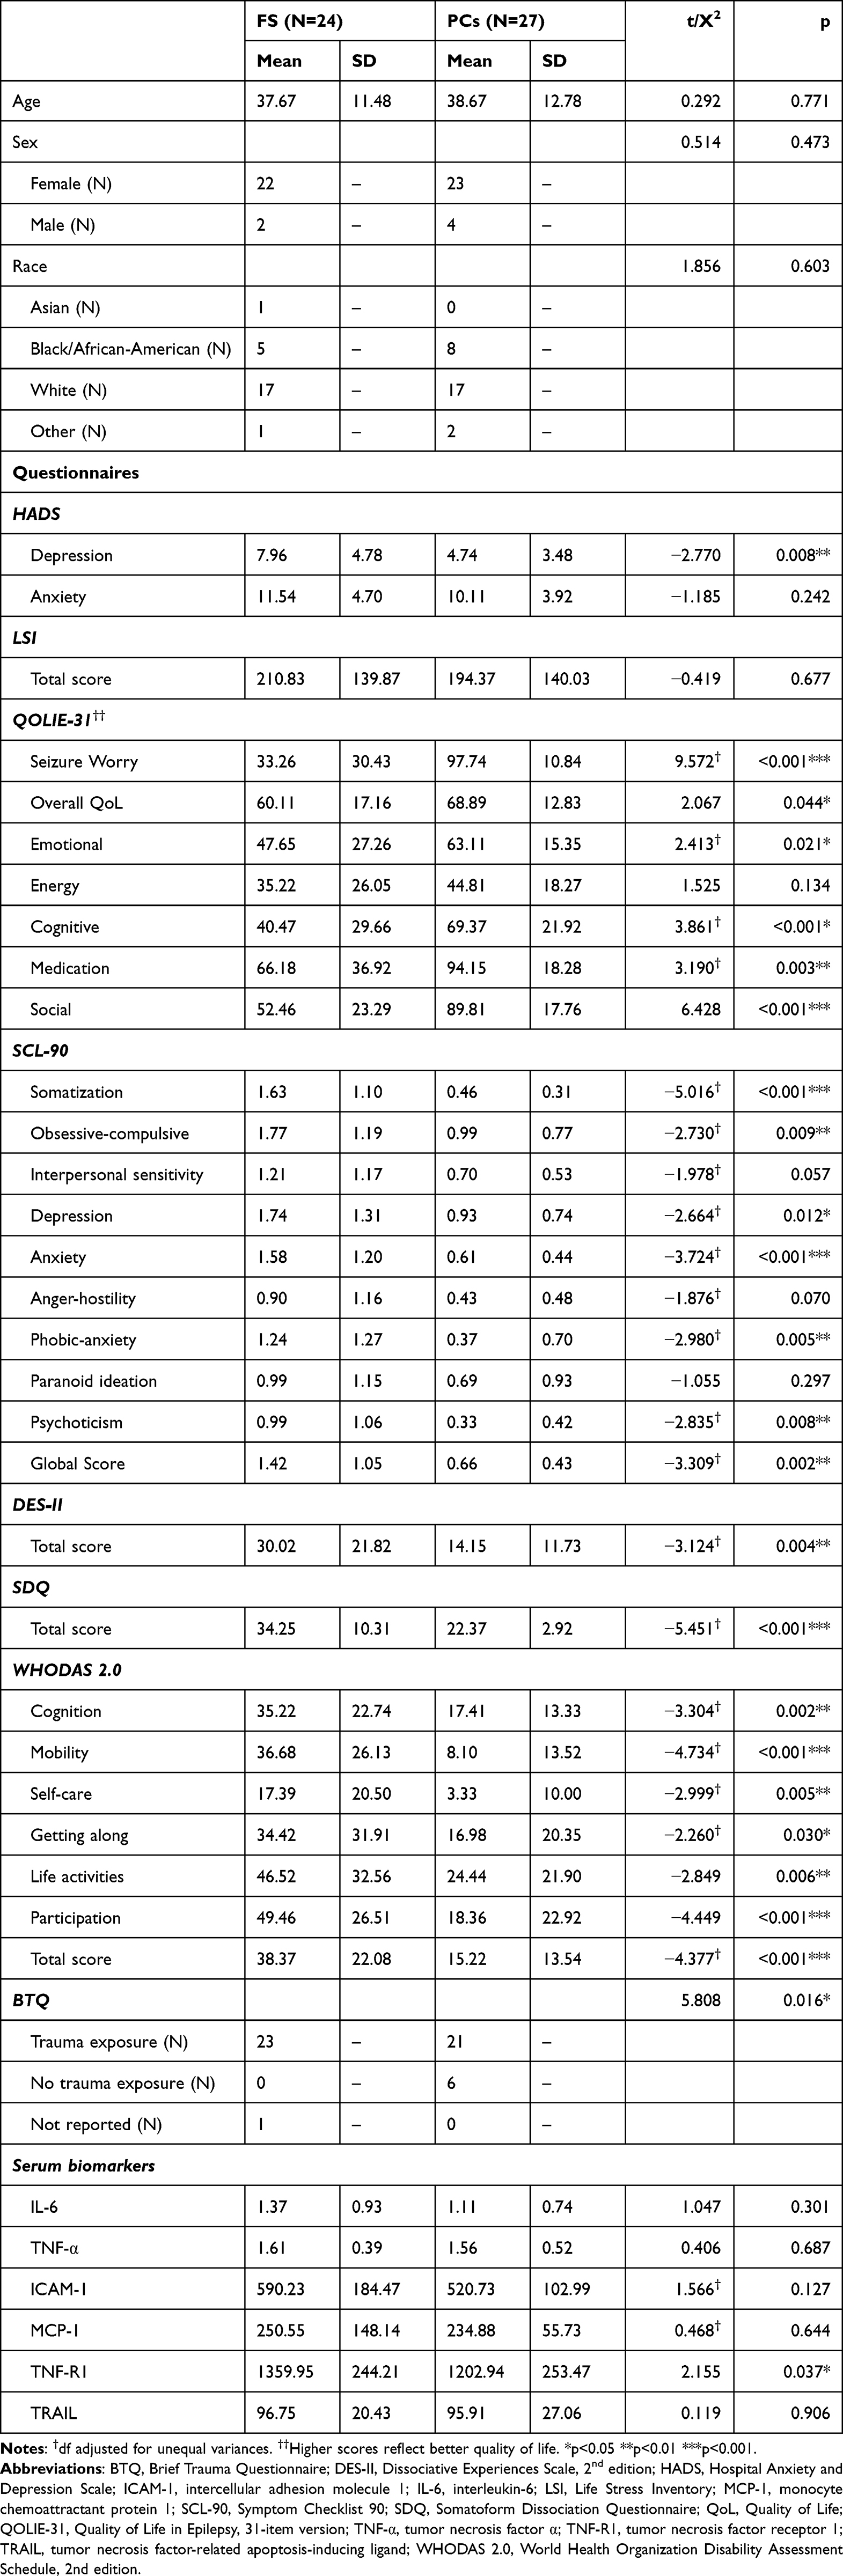 |
Table 1 Demographic Information and Questionnaire Data for the Final Sample |
At the time of study participation, 20/24 (83.3%) of FS patients and 20/27 (74.1%) PCs were taking psychotropic medications, and this proportion was not significantly different between groups (Χ2=0.644, p=0.422). The most commonly taken psychotropic medications were duloxetine (7 FS; 2 PCs), escitalopram (2 FS; 5 PCs), trazodone (6 FS; 2 PCs), sertraline (4 FS; 2 PCs), fluoxetine (3 FS; 2 PCs), and lamotrigine (5 FS; 0 PCs).
ROI-Based Analyses
The ANOVAs did not reveal brain areas with significant differences in temperature, CHO, MINO, or NAA among the three groups (all p>0.0148, corrected).
Whole-Brain Group Differences
Results from the whole-brain analyses are shown in Table 2. There were no clusters with significant differences in temperature, MINO, CHO, or NAA between FS and PCs. When assessing differences between FS and HCs, there were no significant differences in temperature or NAA surviving thresholds. MINO was higher in FS compared to HCs in the precentral gyrus, TPJ and adjacent areas, and the ACG and OFC (Figure 1). CHO was also higher in FS versus HCs in the occipital lobe and adjacent regions (Figure 1).
 |
Table 2 Clusters with Significant Differences in Brain Metabolites Between Functional Seizures (FS) and Healthy Controls (HC) and Between Psychiatric Controls (PC) and HCs |
 |
Figure 1 Differences in choline (CHO) and myo-inositol (MINO) between functional seizures (FS) and healthy controls (HC). All contrasts are FS>HC. Images are shown in neurological convention (left = left). Color bars indicate t-values; CRE = creatine. (A) CHO increases (FS>HC) in the occipital pole, inferior lateral occipital cortex, intracalcarine cortex, lingual gyrus, occipital fusiform gyrus, and forceps major. (B) MINO increases (FS>HC) in the precentral gyrus, posterior cingulate gyrus, precuneus, and corpus callosum. (C) MINO increases (FS>HC) in the posterior superior temporal gyrus, posterior middle temporal gyrus, posterior inferior temporal gyrus, temporo-occipital inferior temporal gyrus, and posterior temporal fusiform. (D) MINO increases (FS>HC) in the anterior cingulate gyrus, orbitofrontal cortex, frontal pole, medial frontal cortex, subcallosal cortex, paracingulate gyrus, corpus callosum, and forceps minor. |
There were no significant differences in temperature or MINO between PCs and HCs surviving cluster thresholds. CHO was higher in PCs than HCs in the ACG, OFC, and adjacent regions, and NAA was higher in PCs than HCs in the ACG and adjacent regions (Figure 2).
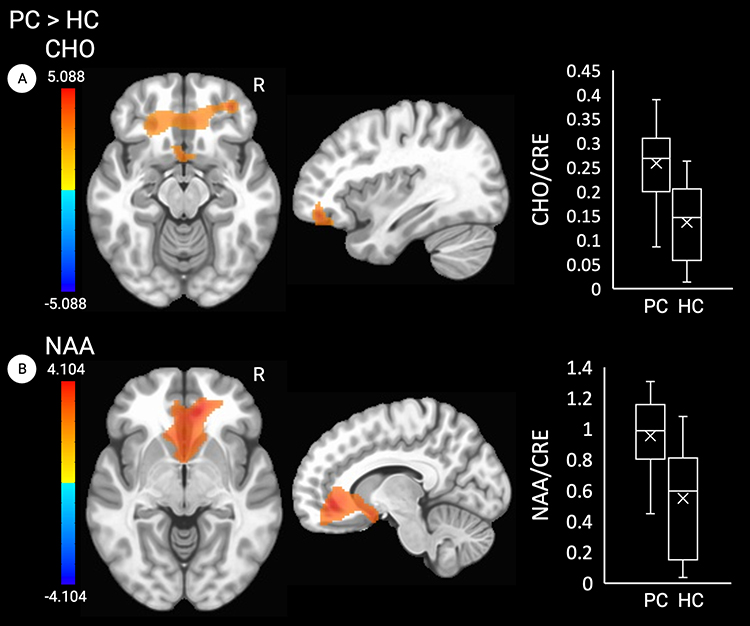 |
Figure 2 Differences in choline (CHO) and N-acetylaspartate (NAA) between psychiatric controls (PC) and healthy controls (HC). All contrasts are PC>HC. Images are shown in neurological convention (left = left). Color bars indicate t-values; CRE=creatine. (A) CHO increases (PC>HC) in the anterior cingulate gyrus, orbitofrontal cortex, frontal pole, medial frontal cortex, subcallosal cortex, paracingulate gyrus, corpus callosum, and forceps minor. (B) NAA increases (PC>HC) in the anterior cingulate gyrus, frontal pole, medial frontal cortex, subcallosal cortex, paracingulate gyrus, corpus callosum, and forceps minor. |
Because many brain regions are smaller than the cluster thresholds that were determined for the temperature analyses (>2100 voxels), we performed additional analyses with a cluster threshold of 500 voxels (Table 2, Figure 3). This identified two clusters in the occipital and frontal lobes where temperatures were lower in FS than HCs, and one cluster in the frontal lobe including the OFC and ACG, where temperature was higher in FS than HCs. Additionally, PCs exhibited lower temperatures than HCs in two clusters in the frontal lobe including the precentral gyrus and the cerebellum, respectively (Table 2, Figure 3).
 |
Figure 3 Differences in brain temperature between functional seizures (FS) and healthy controls (HC) and psychiatric controls (PC) and HCs. Images are shown in neurological convention (left = left). Color bars indicate t-values. (A) Temperature decreases (FS<HC) in the superior lateral occipital cortex, inferior lateral occipital cortex, and occipital pole. (B) Temperature decreases (FS<HC) in the frontal pole, superior frontal gyrus, and middle frontal gyrus. (C) Temperature increases (FS>HC) in the anterior cingulate gyrus, orbitofrontal cortex, frontal pole, frontal medial cortex, subcallosal cortex, paracingulate gyrus, genu of corpus callosum, anterior Corona radiata, and forceps minor. (D) Temperature decreases (PC<HC) in the precentral gyrus, superior frontal gyrus, and middle frontal gyrus. (E) Temperature decreases (PC<HC) in the cerebellum. |
Associations with Serum Inflammatory Biomarkers
Mean serum biomarker levels in FS and PCs are shown in Table 1. The FS group had higher levels of TNF-R1 than PCs (t(45)= 2.155, p=0.036). The remaining serum biomarkers did not differ between groups (all p>0.05). None of the clusters showing temperature or metabolite differences in FS versus HCs and in PCs versus HCs were correlated with serum biomarkers.
Associations with Clinical Symptoms
Several correlations between temperature and metabolites and clinical symptoms were identified in the FS group (Figure 4). Lower temperatures in the occipital lobe (cluster 1) were correlated with higher depression (HADS-D; r=−0.448, p=0.037), lower emotional QoL (r=0.429, p=0.047), higher interpersonal sensitivity (r=−0.523, p=0.013), and psychoticism (r=−0.487, p=0.021) on the SCL-90, and higher disability related to getting along with others (r=−0.555, p=0.007) and total disability (r=−0.426, p=0.048). Higher temperatures in the frontal lobes including the ACG and OFC (cluster 3) were associated with decreased overall QoL (r=−0.460, r=0.031).
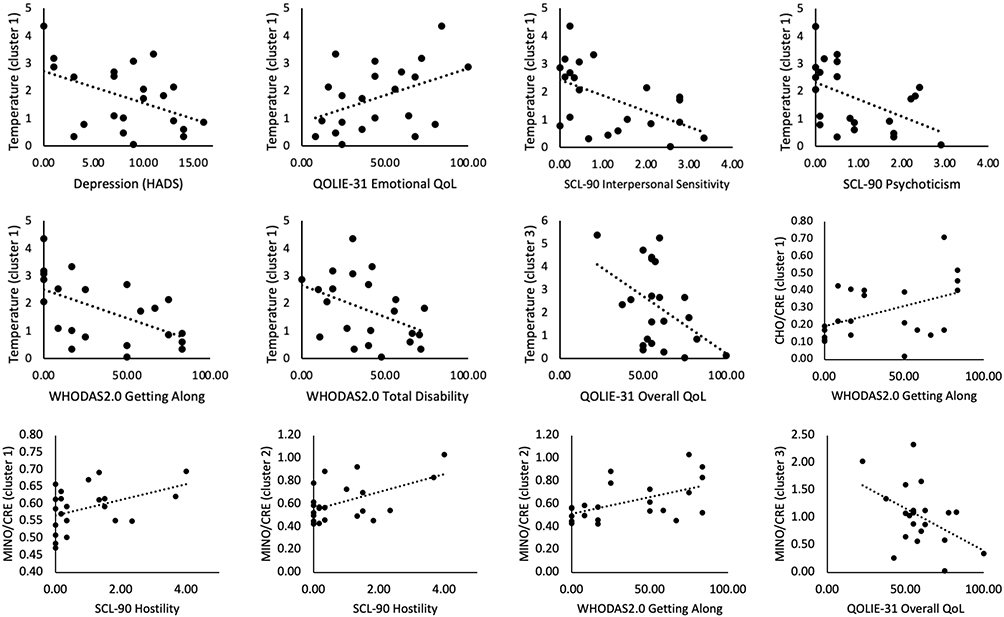 |
Figure 4 Significant correlations between brain temperature, choline (CHO), myo-inositol (MINO) and clinical symptoms in functional seizures. Abbreviations: CRE, creatine; HADS, Hospital Anxiety and Depression Scale; QoL, quality of life; QOLIE-31, Quality of Life in Epilepsy; SCL-90, Symptom Checklist 90; WHODAS 2.0, World Health Organization Disability Assessment Schedule, 2nd edition. |
Increased CHO in the occipital lobe was correlated with higher disability related to getting along with others (r=0.437, p=0.042). Increased MINO in the precentral gyrus (cluster 1) was associated with increased hostility (r=0.426, p=0.048), and increased MINO in the posterior superior temporal gyri (cluster 2) was associated with higher hostility (r=0.527, p=0.012) and higher disability related to getting along with others (r=0.527, p=0.012). Increased MINO in the ACG and OFC (cluster 3) was related to lower overall QoL (r=−0.461, p=0.031) and lower emotional QoL (r=−0.425, p=0.049). CHO and MINO increases did not correlate with 7-day FS count. There were no significant correlations with clinical symptoms in PCs.
Discussion
The aim of this study was to assess brain temperature and metabolic abnormalities in FS compared to PCs and healthy individuals. We compared brain temperature, CHO, MINO, and NAA in FS, PCs, and HCs in eight brain regions that have previously been implicated in FS. We did not identify the hypothesized differences between FS and PCs in the ROI-based or whole-brain exploratory analyses. When comparing the FS and PCs to HCs, we found differences in several brain regions. In FS, we found increased MINO in the precentral gyrus, the TPJ, ACG, and OFC, which corroborates previous study findings in FS.37 In PCs, we observed increased CHO in the ACG and OFC and increased NAA in the ACG (PC>HCs). We also found lower temperature in FS in the occipital and frontal lobe (FS<HCs), and higher temperature in the ACG and OFC (FS>HCs) that overlapped with MINO increases. In PCs, lower temperature was found in the precentral gyrus and cerebellum (PC<HCs), which did not overlap with metabolite abnormalities.
The FS group showed increased temperature and increased MINO in the ACG (FS>HC), with the MINO increases being associated with decreased emotional QoL. This may be an indication of NI-associated glial proliferation and could contribute to clinical outcomes in FS.38,39 In PCs, increased CHO and NAA were found in the ACG, possibly reflecting different pathological substrates in the two groups. The lack of clinical associations in PCs could be the result of low clinical scores or narrow symptom range in our sample. The ACG is involved in emotion regulation, reward anticipation, and cognitive control, and has been implicated in FS pathophysiology in previous studies.40,41 In our prior study in a different cohort of FS patients, we found decreased neurite density in the cingulum bundle,42 the white matter tract that connects the cingulate gyrus to other cortical and subcortical regions. Additionally, hypometabolism, abnormal functional connectivity, and increased sulcal depth have been detected in the ACG of FS patients.43 ACG abnormalities may underlie emotion regulation difficulties in FS, and may be similar to abnormalities seen in other psychiatric conditions.44 Patients with other FNSDs also exhibit structural changes in the anterior cingulate that correlate with dissociative symptoms.45 Because we found cingulate abnormalities in both FS and PCs when compared to HCs, but no differences between the two patient groups, cingulate abnormalities in FS could be due to psychiatric comorbidities rather than being specific to FS. This notion is supported by studies demonstrating changes in ACG activation after psychological treatment of functional tremor and depression.46
Another region that was differentially affected in FS and PCs was the OFC. We chose this as an ROI due to previous studies reporting structural abnormalities in FS in this region, including abnormal cortical thickness and sulcal depth.47 We found increased OFC temperature and MINO in FS and increased CHO in PCs. In FS, the abnormalities were associated with lower emotional and overall QoL, whereas in PCs, no association with clinical symptoms was found. The OFC plays a crucial role in action suppression and inhibition, thus supporting intentional behaviors. OFC abnormalities in FS may contribute to involuntary motor symptoms and altered awareness that are often observed during FS events.48
We also found increased MINO in the precentral gyrus in FS, but not in PCs. Abnormalities in cortical thickness,47 functional connectivity,43 and decreased neuronal activation49 have been previously reported in the precentral gyrus of FS patients.50 Since the precentral gyrus controls voluntary movement, abnormalities in this region may be contributing to the motor disturbances in FS. The only clinical correlation was found with hostility on the SCL-90, although we note that this cluster also included the posterior cingulate, precuneus, and corpus callosum, which could be driving the associations with hostility. Although we did not find an association between precentral gyrus abnormalities and FS frequency,50 it is worth noting that our participants were receiving treatment and reported relatively few FS prior to study participation.
Further, we found increased MINO in the TPJ in FS compared to HCs, but not in PCs. The TPJ includes the supramarginal gyrus, angular gyrus, and the posterior portions of the superior temporal gyrus.51 The TPJ has been implicated in regulating self-agency and theory of mind – processes that are disrupted in FS.51 Self-agency is the subjective sense that one is causing one’s own actions, and theory of mind is the ability to infer others’ mental states (eg, emotions, intentions, thoughts). Previous research has consistently demonstrated abnormalities in the TPJ of FS patients, including decreased cortical folding37 and decreased neuronal activation and functional connectivity.52 Interestingly, the elevated MINO in the TPJ was related to increased hostility on the SCL-90, and to increased disability related to getting along with others. The TPJ supports the ability to interpret other people’s intentions, which could explain the associations with hostility and problems getting along with others.
Increased CHO and lower brain temperature were found in the occipital lobe of FS patients compared to HCs. Although we did not define the occipital lobe as an ROI, previous studies have identified abnormalities in this region, including decreased functional connectivity43 and cortical thickness47 (FS < HCs). The occipital cortex supports visual processing and perception – processes that are disrupted in FS patients who report symptoms such as blurred or double vision, light sensitivity, and temporary loss of vision during seizures. The CHO abnormalities in the occipital lobe were correlated with increased disability in social interactions, which is not directly related to visual functioning. The temperature decreases were associated with higher depression, QoL, higher psychological symptoms, and disability. We note that the presence of decreased temperature in the occipital lobe does not support the idea that the symptoms are driven by NI, but given the overlapping CHO increases, this difference may be driven by abnormalities in cellular metabolism. Abnormalities in the occipital lobe have now been replicated in several FS studies43,47 and warrant further investigation to delineate their relevance to FS symptoms.
We note that none of the brain temperature or metabolite differences in FS and PCs were associated with inflammatory biomarkers, suggesting that blood tests may not be a suitable substitute for measuring brain metabolite abnormalities in these groups. The null findings regarding differences between FS and PCs also suggest that NI may be a prominent feature of both conditions such that brain temperature alone may not be used to distinguish between the two. Because the brain temperature differences between FS and HCs did not survive the cluster thresholds calculated based on spatial noise in the maps, we caution against over-interpreting these, and we also note that the observed brain metabolite abnormalities could be driven by factors other than NI, such as neurodegeneration or mitochondrial dysfunction.
Limitations
The current study had several limitations that should be considered. First, HCs did not provide blood samples, preventing a comparison of serum biomarkers between FS and age-matched HCs. Secondly, most FS patients were either undergoing or had recently completed psychological treatment, which is reflected in the low frequency of FS events reported by these patients at enrollment. The effects of psychotherapy on NI in this population are not known and need to be investigated, for example by comparing treated and untreated FS patients, or by tracking NI longitudinally before and after treatment. Regarding the current results, it is possible that the observed brain metabolite abnormalities are not generalizable to patients with untreated or more severe FS. If the two-hit model2 is correct, we would speculate that NI would be more severe in untreated compared to treated cases. A related issue is regarding the effects of pharmacological treatment on NI. There are currently no medications approved for the treatment of FS, but many patients with FS take psychotropic medications to treat comorbid psychiatric conditions, and this could have impacted our results. The effects of psychotropic medications are somewhat mitigated in the current study by the fact that our two patient groups were similar with regard to psychotropic medication use. However, when comparing patients to HCs, who were not on medication, the observed group differences could be related to the condition, the effects of medication, or a combination of both.
A third limitation is that this was a cross-sectional study and we did not time neuroimaging and biomarker collection in relation to seizures. One study has previously shown elevated serum inflammatory markers immediately following FS,10 so our results may have been biased depending on the timing of FS patients’ most recent seizure in relation to study participation. It is also likely that brain metabolites may be affected by a recent seizure, and this could be tested in longitudinal observational studies. Unlike other methods for imaging NI (eg, positron emission tomography), MRSI is completely non-invasive and does not require down-time to allow for radioactive decay, so it would be well suited for such longitudinal investigations.
Conclusion
Brain temperature mapping is emerging as a valuable tool for non-invasively detecting NI in patients with various neurological and psychiatric conditions, but no prior study has attempted to distinguish between brain temperature elevations related to FS in particular and those related to comorbid psychiatric symptoms. To that end, this study revealed several differences in brain temperature and metabolites (FS vs HCs, PCs vs HCs) that may be used to distinguish patients with FS from those with other psychiatric conditions. Importantly, we also found that brain temperature was not abnormally elevated in patients with FS when compared to patients with other psychiatric conditions, but was altered when compared to HCs. Some abnormalities previously associated with FS, such as those found in the ACG and frontal lobe, may be related to comorbid psychiatric symptoms. Abnormalities observed in sensorimotor regions, the TPJ, and the occipital lobe appear more specific to FS.
Acknowledgments
We would like to thank Holly Yazdi for assistance with participant recruitment and data collection. This research did not receive any specific grant from funding agencies in the public, commercial, or not-for-profit sectors. This study was supported by the UAB Department of Neurology and the UAB Epilepsy Center. The sponsor was not involved in the study design; in the collection, analysis and interpretation of data; in the writing of the report; and in the decision to submit the article for publication. During the data collection and processing stages of the study, Dr Ayushe Sharma was supported by an institutional training grant (T32-NS061788-13) funded by the National Institute of Health and the National Institute of Neurological Disorders and Stroke (NINDS). She is currently supported by a NIH Ruth L. Kirschstein National Research Service Award (1F31NS129288-01) from the NINDS.
Disclosure
Dr Jerzy P Szaflarski is funded by National Institutes of Health, CDMRP, State of Alabama, Shor Foundation for Epilepsy Research, UCB Pharma Inc., and NeuroPace Inc. He has served on consulting/advisory boards for Greenwich Biosciences Inc., NeuroPace, Inc., Serina Therapeutics Inc., LivaNova Inc., UCB Pharma Inc., iFovea, AdCel Biopharma LLC, and Elite Medical Experts LLC. He serves as an editorial board member for Epilepsy & Behavior, Journal of Epileptology (associate editor), Epilepsy & Behavior Reports (Editor-in-Chief), Journal of Medical Science, Epilepsy Currents (contributing editor), and Folia Medica Copernicana.
References
1. Perez DL, Nicholson TR, Asadi-Pooya AA, et al. Neuroimaging in functional neurological disorder: state of the field and research Agenda. Neuro Image. 2021;30:102623.
2. Sharma AA, Szaflarski JP. Neuroinflammation as a pathophysiological factor in the development and maintenance of functional seizures: a hypothesis. Epilepsy Behav Rep. 2021;16:100496. doi:10.1016/j.ebr.2021.100496
3. Goleva SB, Lake AM, Torstenson ES, Haas KF, Davis LK. Epidemiology of functional seizures among adults treated at a university hospital. JAMA Netw Open. 2020;3(12):e2027920. doi:10.1001/jamanetworkopen.2020.27920
4. Hingray C, Ertan D, Reuber M, et al. Heterogeneity of patients with functional/dissociative seizures: three multidimensional profiles. Epilepsia. 2022;63(6):1500–1515. doi:10.1111/epi.17230
5. Gray C, Calderbank A, Adewusi J, Hughes R, Reuber M. Symptoms of posttraumatic stress disorder in patients with functional neurological symptom disorder. J Psychosom Res. 2020;129:109907. doi:10.1016/j.jpsychores.2019.109907
6. Roelofs K, Pasman J. Stress, childhood trauma, and cognitive functions in functional neurologic disorders. Handb Clin Neurol. 2016;139:139–155. doi:10.1016/b978-0-12-801772-2.00013-8
7. Coelho R, Viola TW, Walss-Bass C, Brietzke E, Grassi-Oliveira R. Childhood maltreatment and inflammatory markers: a systematic review. Acta Psychiatr Scand. 2014;129(3):180–192. doi:10.1111/acps.12217
8. Kentner AC, Pittman QJ. Minireview: early-life programming by inflammation of the neuroendocrine system. Endocrinology. 2010;151(10):4602–4606. doi:10.1210/en.2010-0583
9. Kempuraj D, Thangavel R, Selvakumar GP, et al. Brain and peripheral atypical inflammatory mediators potentiate neuroinflammation and neurodegeneration. Review Front Cell Neurosci. 2017;11:216.
10. Gledhill JM, Brand EJ, Pollard JR, St Clair RD, Wallach TM, Crino PB. Association of epileptic and nonepileptic seizures and changes in circulating plasma proteins linked to neuroinflammation. Neurology. 2021;96(10):e1443–e1452. doi:10.1212/wnl.0000000000011552
11. Mueller C, Szaflarski JP. White matter microstructure and serum biomarkers of inflammation in psychogenic non-epileptic seizures. Neuroimage Clin. 2023;39:103462. doi:10.1016/j.nicl.2023.103462
12. Szaflarski JP. The molecular dichotomy between epileptic and functional seizures. Epilepsy Curr. 2021;21(4):258–260. doi:10.1177/15357597211011983
13. Maudsley AA, Darkazanli A, Alger JR, et al. Comprehensive processing, display and analysis for in vivo MR spectroscopic imaging. NMR Biomed. 2006;19(4):492–503. doi:10.1002/nbm.1025
14. Agarwal K, Manza P, Chapman M, et al. Inflammatory markers in substance use and mood disorders: a neuroimaging perspective. Front Psychiatr. 2022;13:863734. doi:10.3389/fpsyt.2022.863734
15. Chang L, Munsaka SM, Kraft-Terry S, Ernst T. Magnetic resonance spectroscopy to assess neuroinflammation and neuropathic pain. J Neuroimmune Pharmacol. 2013;8(3):576–593. doi:10.1007/s11481-013-9460-x
16. Maudsley AA, Domenig C, Govind V, et al. Mapping of brain metabolite distributions by volumetric proton MR spectroscopic imaging (MRSI). Mag Res Med. 2009;61(3):548–559.
17. Drury PP, Bennet L, Gunn AJ. Mechanisms of hypothermic neuroprotection. Semin Fetal Neonatal Med. 2010;15(5):287–292. doi:10.1016/j.siny.2010.05.005
18. Zhao H, Li CS, Gong P, et al. Molecular mechanisms of therapeutic hypothermia on neurological function in a swine model of cardiopulmonary resuscitation. Resuscitation. 2012;83(7):913–920. doi:10.1016/j.resuscitation.2012.01.001
19. Rahimian R, Belliveau C, Chen R, Mechawar N. Microglial inflammatory-metabolic pathways and their potential therapeutic implication in major depressive disorder. Front Psychiatr. 2022;13:871997. doi:10.3389/fpsyt.2022.871997
20. Wohleb ES. Neuron-microglia interactions in mental health disorders: “for better, and for worse”. Front Immunol. 2016;7:544. doi:10.3389/fimmu.2016.00544
21. Uzzan S, Azab AN. Anti-TNF-α Compounds as a Treatment for Depression. Molecules. 2021;26:8.
22. Dib P, Zhang Y, Ihnat MA, Gallucci RM, Standifer KM. TNF-alpha as an initiator of allodynia and anxiety-like behaviors in a preclinical model of PTSD and comorbid pain original research. Frontiers in Psychiatry. 2021;12. doi:10.3389/fpsyt.2021.721999
23. Soczynska JK, Kennedy SH, Goldstein BI, Lachowski A, Woldeyohannes HO, McIntyre RS. The effect of tumor necrosis factor antagonists on mood and mental health-associated quality of life: novel hypothesis-driven treatments for bipolar depression? NeuroToxicology. 2009;30(4):497–521.
24. Ting EY, Yang AC, Tsai SJ. Role of Interleukin-6 in depressive disorder. Int J Mol Sci. 2020;21:6.
25. Pae CU. The potential role of monocyte chemoattractant protein-1 for major depressive disorder. Psychiatry Invest. 2014;11(3):217–222. doi:10.4306/pi.2014.11.3.217
26. Sharma AA, Nenert R, Mueller C, Maudsley AA, Younger J, Szaflarski JP. Repeatability and reproducibility of in-vivo brain temperature measurements. Front Neurosci. 2020;14:598435.
27. LaFrance WC, Baker GA, Duncan R, Goldstein LH, Reuber M. Minimum requirements for the diagnosis of psychogenic nonepileptic seizures: a staged approach: a report from the international league against epilepsy nonepileptic seizures task force. Epilepsia. 2013;54(11):2005–2018. doi:10.1111/epi.12356
28. Schnurr P, Vielhauer M, Weathers F, Findler M. The Brief Trauma Questionnaire. White River Junction, VT: National Center for PTSD; 1999.
29. Carlson EB, Putnam FW. An update on the Dissociative Experiences Scale. Dissociation. 1993;6(1):16–27.
30. Nijenhuis ER, Spinhoven P, Van Dyck R, Van Der Hart O, Vanderlinden J. The development and psychometric characteristics of the Somatoform Dissociation Questionnaire (SDQ-20). J Nerv Ment Dis. 1996;184(11):688.
31. Derogatis L. Symptom Checklist-90-Revised, Brief Symptom Inventory, and BSI-18. In: Handbook of Psychological Assessment in Primary Care Settings.
32. Holmes TH, Rahe RH. The social readjustment rating scale. J Psychosom Res. 1967;1967:1.
33. Stern AF. The Hospital Anxiety and Depression Scale. Occup Med. 2014;64(5):393–394. doi:10.1093/occmed/kqu024
34. Cramer JA, Perrine K, Devinsky O, Bryant‐Comstock L, Meador K, Hermann B. Development and cross‐cultural translations of a 31‐item quality of life in epilepsy inventory. Epilepsia. 1998;39(1):81–88.
35. Üstün TB, Kostanjsek N, Chatterji S, Rehm J. Measuring Health and Disability: Manual for WHO Disability Assessment Schedule WHODAS 2.0. World Health Organization; 2010.
36. Storey JD. A direct approach to false discovery rates. J Royal Stat Soc. 2002;64(3):479–498. doi:10.1111/1467-9868.00346
37. Sharma AA, Goodman AM, Allendorfer JB, et al. Regional brain atrophy and aberrant cortical folding relate to anxiety and depression in patients with traumatic brain injury and psychogenic nonepileptic seizures. Epilepsia. 2022;63(1):222–236. doi:10.1111/epi.17109
38. Filibian M, Frasca A, Maggioni D, Micotti E, Vezzani A, Ravizza T. In vivo imaging of glia activation using 1H-magnetic resonance spectroscopy to detect putative biomarkers of tissue epileptogenicity. Epilepsia. 2012;53(11):1907–1916. doi:10.1111/j.1528-1167.2012.03685.x
39. Chhetri DR. Myo-inositol and its derivatives: their emerging role in the treatment of human diseases. Front Pharmacol. 2019;10:1172. doi:10.3389/fphar.2019.01172
40. Stevens FL, Hurley RA, Taber KH, Hurley RA, Hayman LA, Taber KH. Anterior cingulate cortex: unique role in cognition and emotion. J Neuropsychiatr Clin Neurosci. 2011;23(2):121–125. doi:10.1176/jnp.23.2.jnp121
41. Apps MA, Ramnani N. The anterior cingulate gyrus signals the net value of others’ rewards. J Neurosci. 2014;34(18):6190–6200. doi:10.1523/jneurosci.2701-13.2014
42. Goodman AM, Allendorfer JB, Blum AS, et al. White matter and neurite morphology differ in psychogenic nonepileptic seizures. Ann Clin Transl Neurol. 2020;7(10):1973–1984. doi:10.1002/acn3.51198
43. Ding JR, An D, Liao W, et al. Altered functional and structural connectivity networks in psychogenic non-epileptic seizures. PLoS One. 2013;8(5):e63850. doi:10.1371/journal.pone.0063850
44. Fu C, Zhang H, Xuan A, Gao Y, Xu J, Shi D. A combined study of (18)F-FDG PET-CT and fMRI for assessing resting cerebral function in patients with major depressive disorder. Exp Ther Med. 2018;16(3):1873–1881. doi:10.3892/etm.2018.6434
45. Perez DL, Matin N, Williams B, et al. Cortical thickness alterations linked to somatoform and psychological dissociation in functional neurological disorders. Human Brain Mapp. 2018;39(1):428–439. doi:10.1002/hbm.23853
46. Espay AJ, Ries S, Maloney T, et al. Clinical and neural responses to cognitive behavioral therapy for functional tremor. Neurology. 2019;93(19):e1787–e1798. doi:10.1212/wnl.0000000000008442
47. Ristić AJ, Daković M, Kerr M, Kovačević M, Parojčić A, Sokić D. Cortical thickness, surface area and folding in patients with psychogenic nonepileptic seizures. Epilepsy Res. 2015;112:84–91.
48. Baslet G. Psychogenic non-epileptic seizures: a model of their pathogenic mechanism. Seizure. 2011;20(1):1–13.
49. van der Kruijs SJ, Bodde NM, Vaessen MJ, et al. Functional connectivity of dissociation in patients with psychogenic non-epileptic seizures. J Neurol Neurosurg Psychiatry. 2012;83(3):239–247. doi:10.1136/jnnp-2011-300776
50. Maria GK, Mahdi J, Richard SF, Andrea OR. Psychogenic seizures and frontal disconnection: EEG synchronisation study. J Neurol Neurosurg Psychiatr. 2011;82(5):505. doi:10.1136/jnnp.2010.224873
51. Schurz M, Tholen MG, Perner J, Mars RB, Sallet J. Specifying the brain anatomy underlying temporo-parietal junction activations for theory of mind: a review using probabilistic atlases from different imaging modalities. Hum Brain Mapp. 2017;38(9):4788–4805. doi:10.1002/hbm.23675
52. Voon V, Cavanna AE, Coburn K, Sampson S, Reeve A, LaFrance WC. Functional Neuroanatomy and Neurophysiology of Functional Neurological Disorders (Conversion Disorder). J Neuropsychiatry Clin Neurosci. 2016;28(3):168–190.
 © 2023 The Author(s). This work is published and licensed by Dove Medical Press Limited. The
full terms of this license are available at https://www.dovepress.com/terms
and incorporate the Creative Commons Attribution
- Non Commercial (unported, 3.0) License.
By accessing the work you hereby accept the Terms. Non-commercial uses of the work are permitted
without any further permission from Dove Medical Press Limited, provided the work is properly
attributed. For permission for commercial use of this work, please see paragraphs 4.2 and 5 of our Terms.
© 2023 The Author(s). This work is published and licensed by Dove Medical Press Limited. The
full terms of this license are available at https://www.dovepress.com/terms
and incorporate the Creative Commons Attribution
- Non Commercial (unported, 3.0) License.
By accessing the work you hereby accept the Terms. Non-commercial uses of the work are permitted
without any further permission from Dove Medical Press Limited, provided the work is properly
attributed. For permission for commercial use of this work, please see paragraphs 4.2 and 5 of our Terms.