Back to Journals » Cancer Management and Research » Volume 11
Perfusion, Diffusion, Or Brain Tumor Barrier Integrity: Which Represents The Glioma Features Best?
Authors Yan LF, Sun YZ, Zhao SS, Hu YC ![]() , Han Y, Li G, Zhang X, Tian Q, Liu ZC, Yang Y, Nan HY, Yu Y
, Han Y, Li G, Zhang X, Tian Q, Liu ZC, Yang Y, Nan HY, Yu Y ![]() , Sun Q, Zhang J, Chen P, Hu B, Li F, Han TH, Wang W
, Sun Q, Zhang J, Chen P, Hu B, Li F, Han TH, Wang W ![]() , Cui GB
, Cui GB
Received 11 December 2018
Accepted for publication 30 September 2019
Published 27 November 2019 Volume 2019:11 Pages 9989—10000
DOI https://doi.org/10.2147/CMAR.S197839
Checked for plagiarism Yes
Review by Single anonymous peer review
Peer reviewer comments 2
Editor who approved publication: Dr Rituraj Purohit
Lin-Feng Yan,1,* Ying-Zhi Sun,1,* Sha-Sha Zhao,1,* Yu-Chuan Hu,1,* Yu Han,1 Gang Li,2 Xin Zhang,1 Qiang Tian,1 Zhi-Cheng Liu,1 Yang Yang,1 Hai-Yan Nan,1 Ying Yu,1 Qian Sun,1 Jin Zhang,1 Ping Chen,1 Bo Hu,1 Fei Li,3 Teng-Hui Han,3 Wen Wang,1 Guang-Bin Cui1
1Department of Radiology & Functional and Molecular Imaging Key Laboratory of Shaanxi Province, Tangdu Hospital, Fourth Military Medical University, Xi’an, Shaanxi 710038, People’s Republic of China; 2Department of Neurosurgery, Tangdu Hospital, Fourth Military Medical University, Xi’an, Shaanxi 710038, People’s Republic of China; 3Student Brigade, Fourth Military Medical University, Xi’an, Shaanxi 710032, People’s Republic of China
*These authors contributed equally to this work
Correspondence: Wen Wang; Guang-Bin Cui
Department of Radiology & Functional and Molecular Imaging Laboratory of Shaanxi Province, Tangdu Hospital, Fourth Military Medical University, 569 Xinsi Road, Xi’an 710038, People’s Republic of China
Tel +86-29-84778689; 86-29-84777863
Email [email protected]; [email protected]
Purpose: This study aims to incorporate informative histogram indicator analyses and advanced multimodal MRI parameters to differentiate low-grade gliomas (LGGs) from high-grade gliomas (HGGs) and to explore the features associated with patients’ survival.
Patients and methods: A total of 120 patients with pathologically confirmed LGGs or HGGs receiving conventional and advanced MRI such as three-dimensional arterial spin labeling (3D-ASL), intravoxel incoherent motion-diffusion weighted imaging (IVIM-DWI), and dynamic contrast-enhanced MRI (DCE-MRI) were included. The mean and histogram indicators from advanced MRI were calculated from the entire tumor. The efficacies of a single indicator or multiple parameters were tested in distinguishing HGGs from LGGs and predicting patients’ survival. Receiver operating characteristic (ROC) curve and multivariable stepwise logistic regression were used to evaluate the diagnostic efficacies. Leave-one-out cross-validation was further used to validate the accuracy of the parameter sets in glioma grading. Log-rank test using the Kaplan–Meier curve was utilized to predict patients’ survival.
Results: Overall, parameters from DCE-MRI performed better than those from 3D-ASL or IVIM-DWI in both glioma grading and survival prediction. The histogram metrics of Ve were demonstrated to have higher accuracies (the accuracies for Extended Tofts_Vemean and Extended Tofts_Vemedian were 68.33% and 71.67%, respectively, while those for the Incremental_Vemean and Incremental_Ve75th were 68.33% and 72.50%, respectively) in grading LGGs from HGGs. The combination of Tofts_Ve histogram metrics was the one with the highest accuracy (81.67%) and area under ROC curve (AUC = 0.840). On the other hand, Patlak_Ktrans95th (AUC = 0.9265) and Extended Tofts_Ve95th (AUC = 0.9154) performed better than their corresponding means (Patlak_Ktransmean: AUC = 0.9118 and Extended Tofts_Vemean: AUC = 0.9044) in predicting patients’ overall survival (OS) at 18-month follow-up.
Conclusion: DCE-MRI-derived histogram features from the entire tumor were promising metrics for glioma grading and OS prediction. Combining single modal histogram features improved glioma grading.
Trial registration: NCT 02622620.
Keywords: multi-modal MRI, histogram features, receiver operating curve, glioma grading, survival analysis
Introduction
Glioma is the most common primary central nervous system (CNS) tumor, with high incidence and low overall survival (OS) rate. According to the World Health Organization (WHO) criteria in 2007,1 gliomas are classified into low-grade gliomas (LGGs, including WHO grades I and II gliomas) and high-grade gliomas (HGGs, including WHO grades III and IV gliomas). The optimal treatment strategies highly depend on the glioma features (including tumor grading and pathological composition), as does patient survival. Although the histopathological characteristics of glioma are used as the gold standard biomarker for grading tumor and predicting patient survival, its application has been limited by the fact of not-timely post-operative sampling and inability to reflect the tumor heterogeneity. Thus, preoperative glioma grading and survival analysis based on the entire tumor features are urgently required.
Non-invasive MRI techniques are particularly valuable in glioma grading and survival prediction, but consensus has not been reached regarding the optimal technique. By using conventional magnetic resonance imaging (MRI) techniques, glioma grading accuracies ranged from 55% to 83% based on tumor enhancement and necrosis.2 However, the remarkable difference between LGGs and HGGs exists in the tumor microenvironments that can not be fully revealed with conventional MRI techniques. Fortunately, current advanced MR sequences, especially arterial spin labeling (ASL), intravoxel incoherent motion-diffusion weighted imaging (IVIM-DWI), and dynamic contrast-enhanced MRI (DCE-MRI), have been hypothesized to reflect the tumor perfusion, diffusion, and blood–brain barrier (BBB) permeability;3–6 thus these techniques are increasingly employed for tumor grading7–10 and predicting patients’ survival.3,11
Despite the promising outcome of these advanced MRI techniques, several issues should be addressed before their clinical applications. Previous studies were conducted mainly based on single modal advanced MRI, which partly reveals the tumor microenvironment features. Additionally, it is almost impossible to determine which parameter or sequence is the most impactful on tumor grading and survival prediction since the study populations for even the same research purpose were different concerning the epidemiological background. Lastly, in most studies, only the mean, maximum, minimum, or median value of a specific parameter within the 2-dimensional tumor region of interest (ROI) was utilized, leaving most of the informative histogram indicators within the entire tumor underestimated.
To make the best use of advanced MRIs, it is important to conduct a comprehensive investigation in a relatively large representative glioma patient population receiving DWI-, DCE-, and ASL-MRI scans to determine the most impactful functional parameters from the 3-dimensional volume of interest (VOI) using the informative histogram indicators analyses. Thus, we performed the current study on glioma patients to address these issues and further investigated the efficacies of parameter combinations in glioma grading and survival prediction.
Materials And Methods
Patient Population
The data of the current project were derived from a diagnostic trial that has been registered to ClinicalTrials.gov (NCT 02622620, https://www.clinicaltrials.gov/) with the trial protocol12 and part of the data were published.13,14 This study was conducted in accordance with the Declaration of Helsinki of 1975 in its most recent version. This study was approved by Ethics Committee of Tangdu Hospital of the Fourth Military Medical University, and informed consent was obtained prior to the enrollment.
From January 2014 to March 2016, 120 patients with pathologically confirmed gliomas were included in the current study. The patients were followed up till August 31, 2016. Excluding the patients without follow-up information, 90 patients who were alive or died of glioma-related disease were fed to survival analysis at 12-, 15-, and 18-month intervals from the date of surgery. The inclusion and exclusion criteria were shown in Fig.A.1.
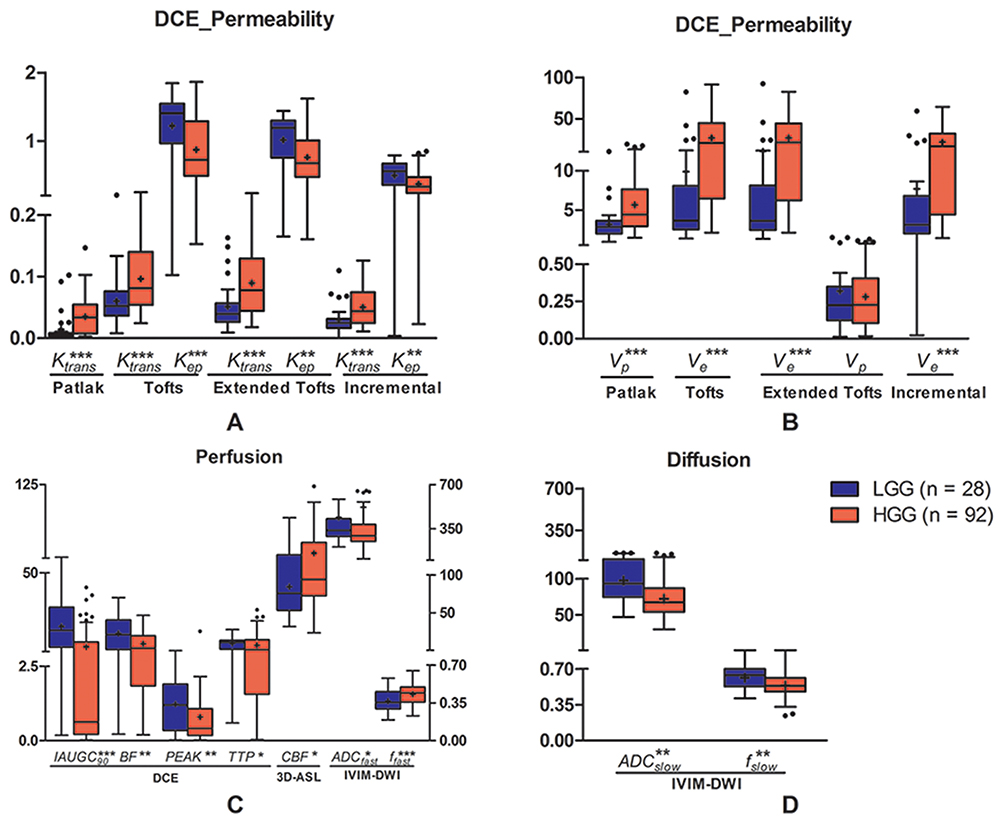 |
Figure 1 Differences of permeability (A, B), perfusion (C), and diffusion (D) parameters between LGGs and HGGs. All parameters, except Vp post-processed with extended Tofts, are significantly different between the two groups. * = P < 0.05, ** = P < 0.01, *** = P < 0.001, + = Mean, line in box = median, boundaries of boxes = interquartile range, whiskers = Turkey, and · = outlier. |
Image Data Acquisition
The MRI protocol was implemented on a 3.0-T MRI scanner (MR750, GE Healthcare, Milwaukee, Wisconsin, USA) with 8 channel head coil. Conventional MRI scans included axial T1-weighted spin-echo images (T1WI), T2-weighted fast spin-echo images (T2WI), fluid-attenuated inversion recovery (FLAIR), and T1-weighted contrast-enhanced images (T1CE). In addition to conventional MRI scans, advanced MR scans including three-dimensional ASL (3D-ASL), multiple b value DWI (multi-b DWI), and DCE-MRI were obtained (Fig. A.1), for each patient. All MR scans were acquired in axial planes (Table A.1).
The 3D-ASL was a pseudo-continuous arterial spin-labeling sequence using 3D segmented spiral readouts with the post-label delay time of 1.525 s. The multi-b DWI, a diffusion-weighted echo-planar sequence, was implemented with a single shot spin-echo using 13 different b-values (0, 30, 50, 100, 200, 300, 500, 800, 1000, 1500, 2000, 3000, 3500 s/mm2) in 3 orthogonal directions as described in our previous study.15 The DCE-MRI was performed with a 50-phase dynamic gradient-echo T1 scanning and each phase was 4 s. The bolus of gadodiamide contrast material (0.5 mmol, 0.2mL/kg, Omniscan, GE Healthcare, Ireland, UK) was injected using high-pressure injector at the rate of 2mL/s at the end of the 5th phase, followed by normal saline injection.
Image Processing And Data Analysis
The cerebral blood flow (CBF) map was derived from 3D-ASL images using the GE ADW4.6 workstation (GE Healthcare, Milwaukee, Wisconsin, USA), while the raw images of multi-b DWI and DCE-MRI were transferred and post-processed with corresponding modules integrated to the NordicICE (Version 4.0, Nordic-NeuroLab, Bergen, Norway) analysis platform.
The parametric maps derived from multi-b DWI were based on the biexponential IVIM analytic model.16 The DCE images were processed using Patlak,17 Tofts,18 extended Tofts,19 and Incremental models (the optimal model using a statistical test in NordicICE). The semiquantitative parameters were calculated based on fixed T1 values (1000 ms).20 A standard population-based arterial input function (AIF) was automatically defined. In addition, the initial area under gadolinium concentration–time curve (IAUGC) was acquired for the first-pass data (90 s) and model-free parameters were retrieved. All parameters derived from multi-modal MRI are listed in Table 1.
 |
Table 1 The Models And Corresponding Parameters Derived From Advanced MRI |
Tumor Segmentation Or Delineation
The VOI segmentation was manually drawn using NordicICE by two neuroradiologists (LF.Y, 12 years of experience and YC.H, 12 years of experience) who were blind to histopathological results. Multi-modal parametric maps were resampled using Nordic ICE. The VOIs covered the enhanced tumor part after thresholding on T1CE images and were then overlaid on T2 FLAIR where the hyperintense parts were delineated.21,22 The regions of edema, necrosis, or non-tumor macrovessels were avoided. The pixel-by-pixel values within VOIs were extracted from each parametric map.
Histogram Analysis
The histogram metrics23 including mean, median, max, min, skewness, kurtosis, energy, and entropy as well as the cumulative histogram indicators expressed as the nth percentiles were calculated. The 75th, 90th, and 95th percentiles were obtained from permeability and perfusion parameters, whereas the 5th, 10th, and 25th percentiles were derived from diffusion ones.
Statistical Analysis
An unpaired Student’s t-test or Mann–Whitney U-test was used to compare each histogram metric value between LGGs and HGGs. The receiver operating characteristic (ROC) curve analyses with area under the curve (AUC) were used to evaluate the diagnostic efficacy. Multivariable stepwise logistic regression for parameter combination was performed with Statistical Package for the Social Sciences (SPSS, Version 20.0, SPSS Inc., Chicago, IL, USA). In addition, leave-one-out cross-validation (LOOCV) was further used to validate the accuracy of the combined parameters in glioma grading by using WEKA software (Version 3.8.0, the University of WAIKATO). The log-rank test using the Kaplan–Meier curve was applied to predict overall survival (OS) at 12, 15, or 18 months after surgery.
Results
Patients’ Baseline Characteristics
The clinical characteristics of patients are listed in Table 2. Among the 120 glioma patients, 28 patients were diagnosed with LGGs and 92 patients were diagnosed with HGGs. HGG patients were older than LGG patients (P = 0.0002). There is no significant difference in gender (P = 0.2980) or tumor location (P = 0.0600) between the two groups.
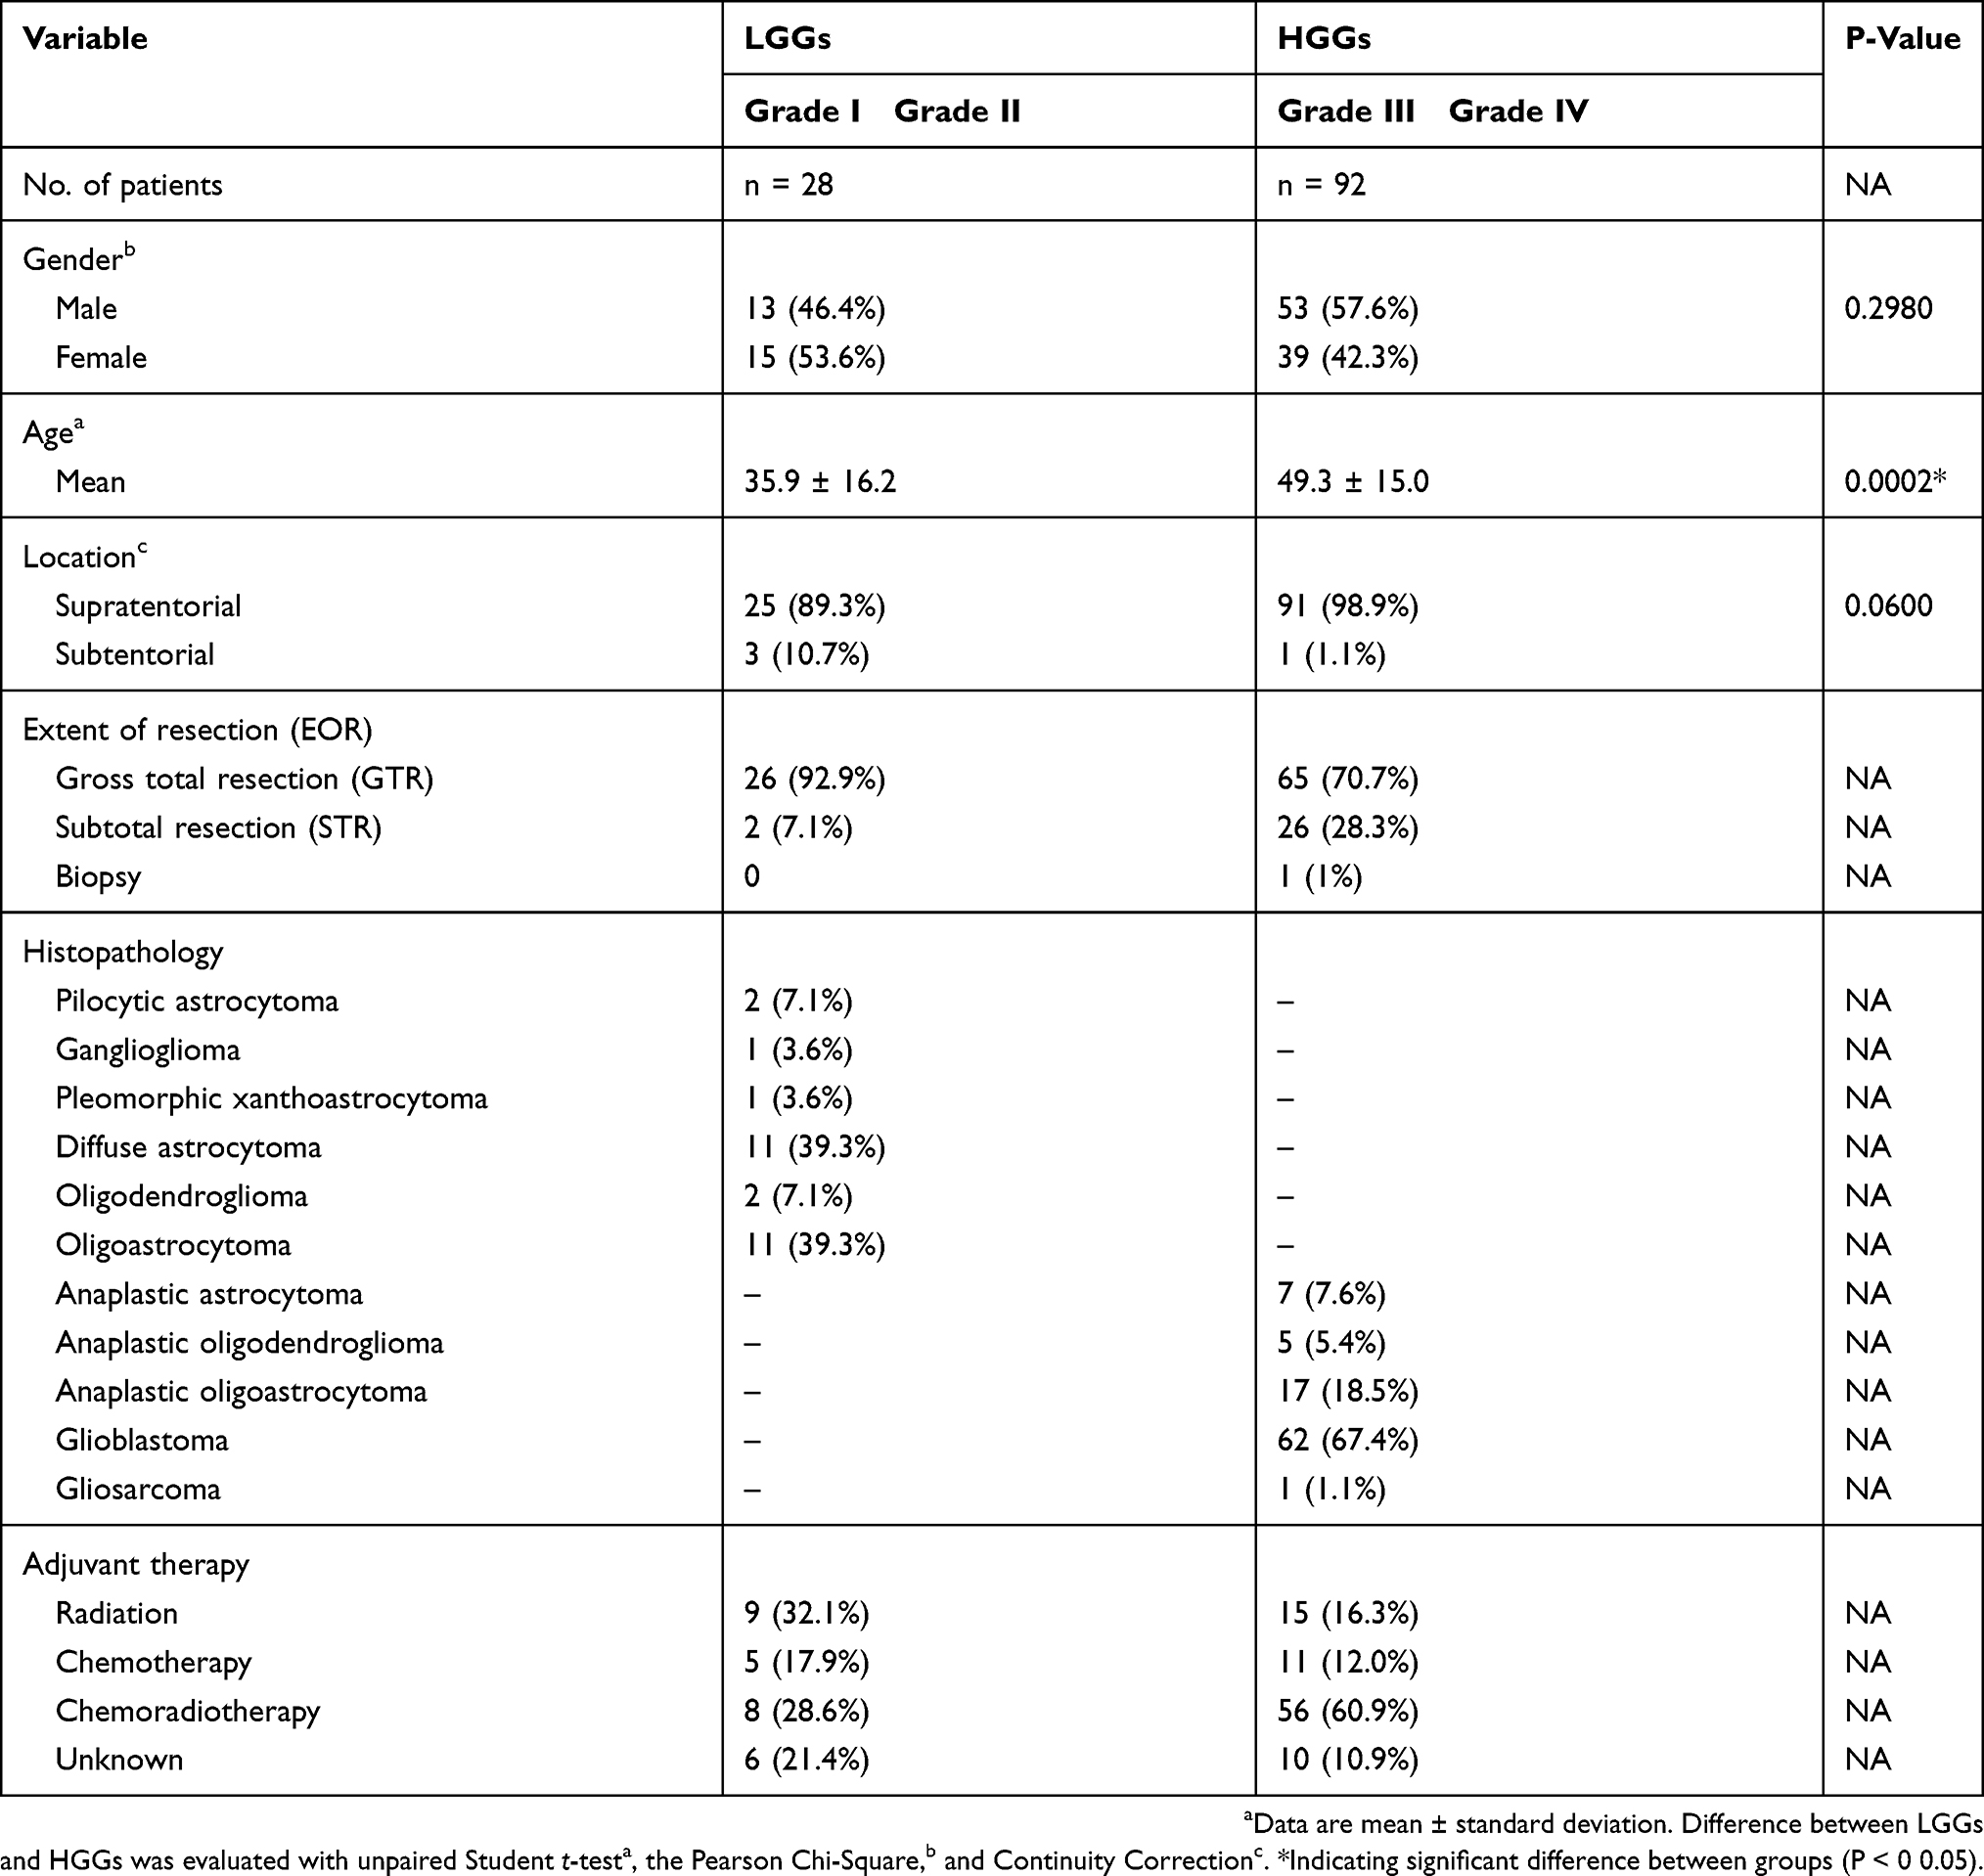 |
Table 2 Clinical Characteristics Of Patients |
Differences In Multi-Modal Parameters Between LGG And HGG Patients
Among the permeability parameters from DCE-MRI, despite the varied models used, the values of Ktrans (P < 0.0001, = 0.0004, 0.0002, or 0.0003 for Patlak, Tofts, Extended Tofts, or Incremental model, respectively), Ve (P < 0.0001, 0.0001, or 0.0001 for Tofts, Extended Tofts, or Incremental model, respectively), and Vp (P = 0.0003 for Patlak model) were significantly increased, while those of Kep (P = 0.0009, 0.0028, or 0.0016 for Tofts, Extended Tofts, or Incremental model, respectively) were significantly decreased in HGG patients. Among the perfusion parameters derived from 3D-ASL, IVIM-DWI, or DCE images, the values of IAUGC90 (P < 0.0001), BF (P = 0.0026), Peak (P = 0.0019), TTP (P = 0.0346), and ADCfast (P = 0.0333) were significantly decreased, nevertheless those of CBF (P = 0.0136) and ffast (P = 0.0029) were significantly increased in HGG patients. The diffusion parameters obtained from IVIM-DWI images, i.e., ADCslow and fslow (P < 0.0001, = 0.0019), were significantly decreased in HGG patients (Figure 1). Corresponding ROC curves were established and the AUC, diagnostic specificity, and sensitivity of ROC based on the mean of each parameter are summarized in Table A.2. The mean of DCE_IAUGC90, Ve from varied models (i.e., Tofts_Ve, Extended Tofts_Ve, Incremental_Ve), Ktrans from Patlak (Patlak_Ktrans), and ADCslow from IVIM model (IVIM_ADCslow) performed better (P < 0.0001).
Diagnostic Performance Of Histogram Metrics For Glioma Grading
To improve the diagnostic efficacies, we further tested histogram metrics’ performance in glioma grading. The AUCs and P values of the six parameters (Patlak_Ktrans, Tofts_Ve, Extended Tofts_Ve, Incremental_Ve, DCE_IAUGC90, and IVIM_ADCslow) and their corresponding histogram metrics are listed in Table A.3. Only Extended Tofts_Vemedian and Incremental_Ve75th were with higher accuracies than their means (Extended Tofts_Ve: mean = 68.33%, median = 71.67%; Incremental_Ve: mean = 68.33%, 75th = 72.50%) (Table 3). However, Patlak_Ktransmean (75.83%) was demonstrated to have the highest accuracy in glioma grading. The representative parametric maps and histograms are also shown in Figure 2.
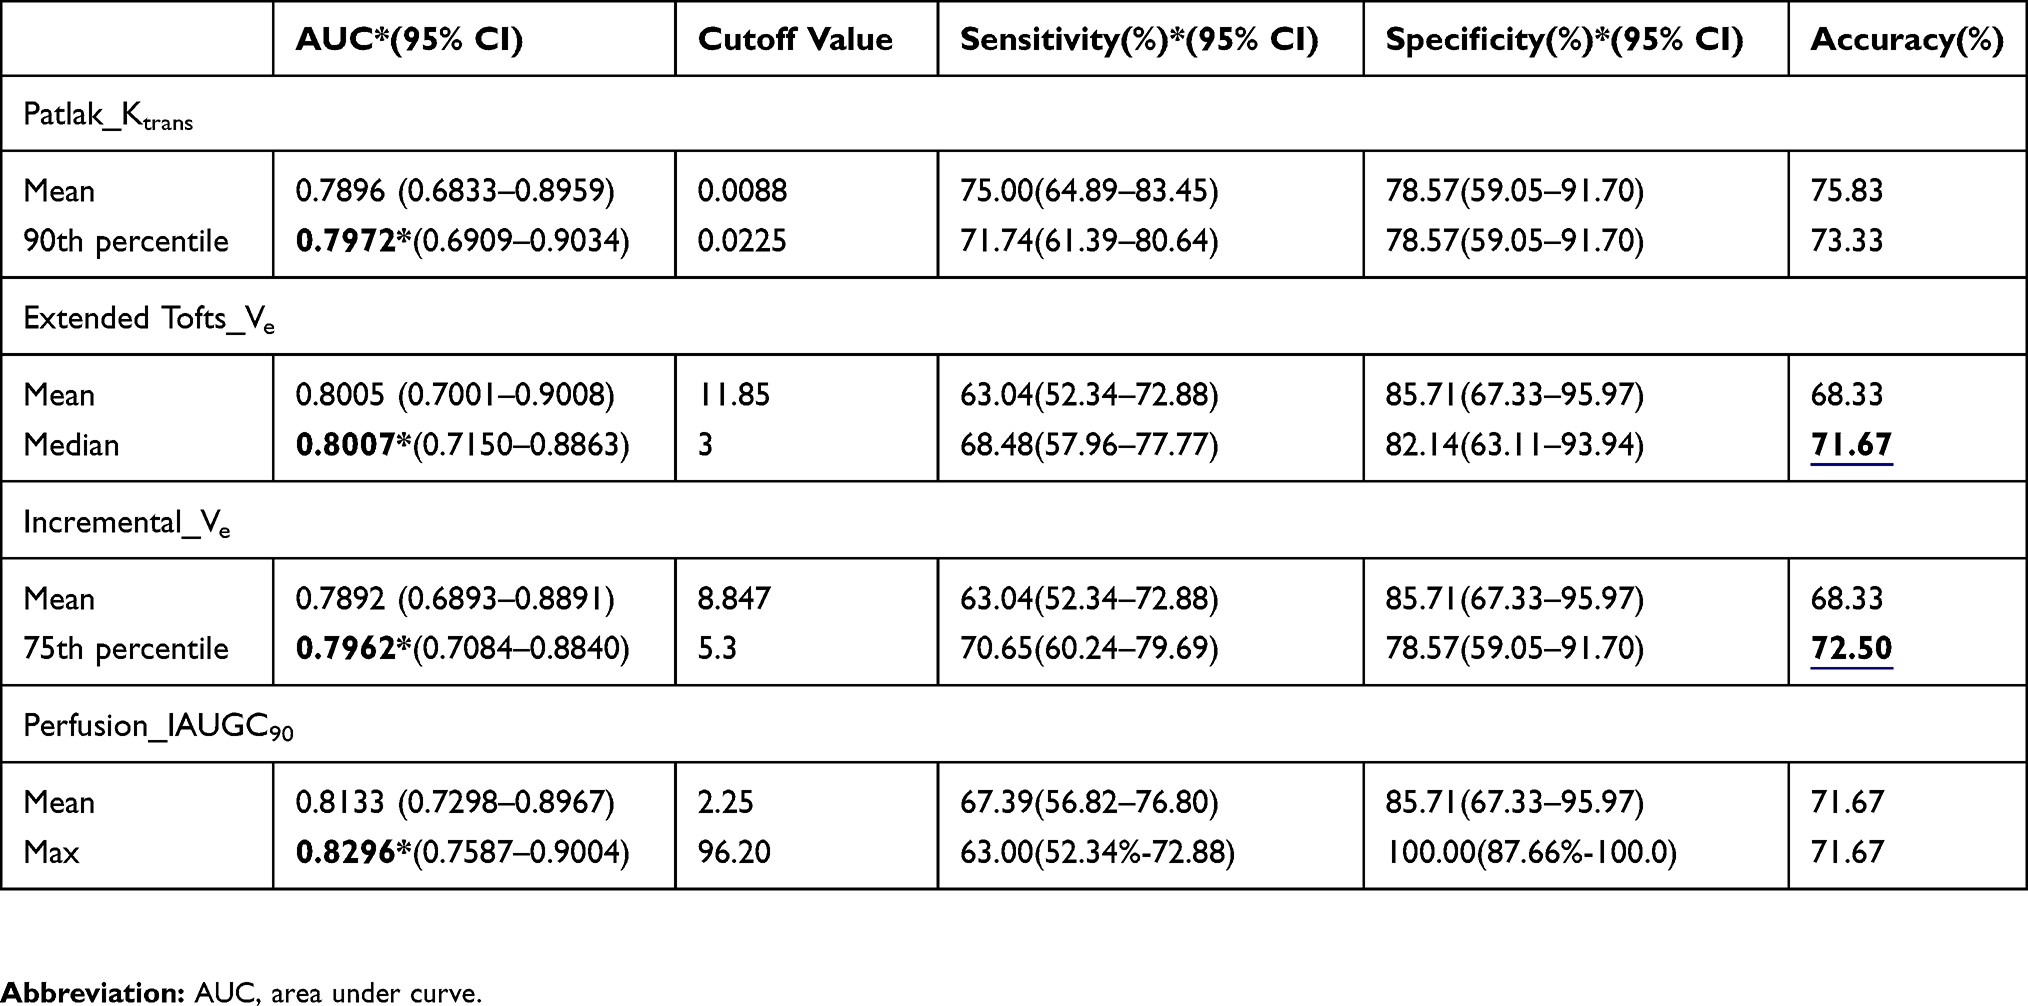 |
Table 3 Histogram Measure Of Multi-Modal Parameters In Differentiating LGGs From HGGs |
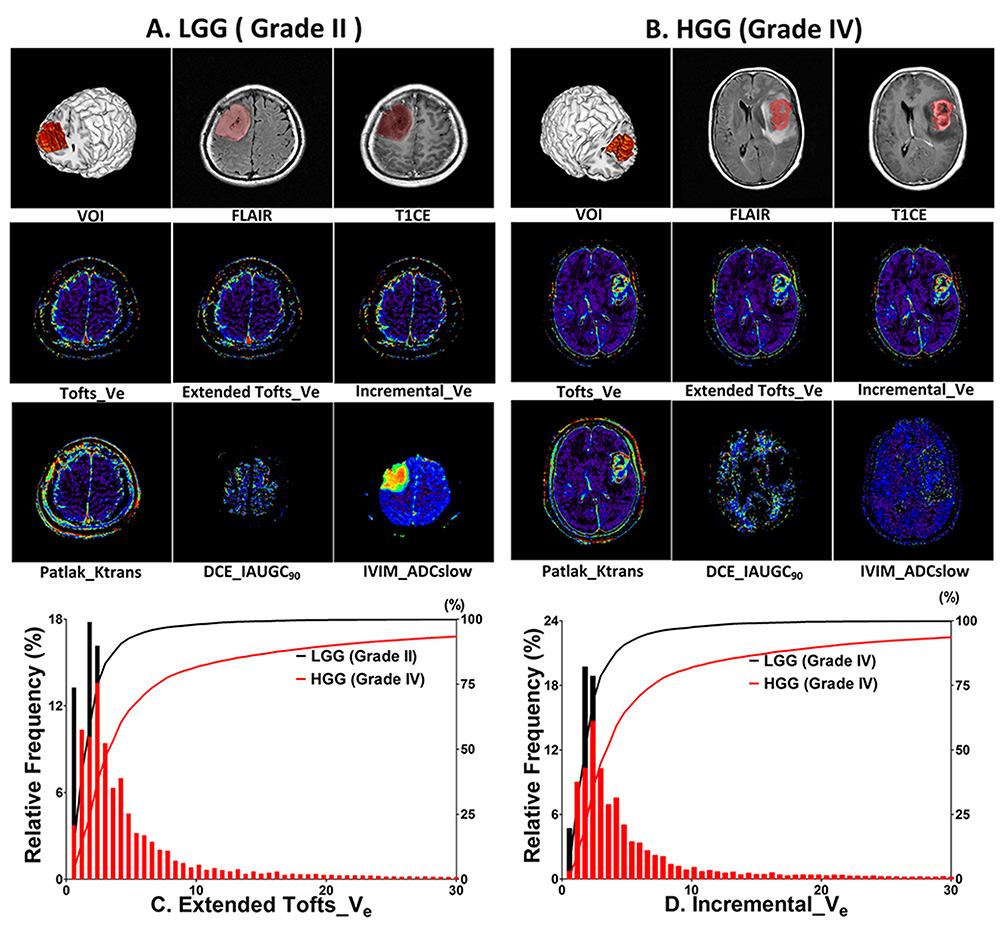 |
Figure 2 Multi-modal parameter maps and histograms from a representative LGG and HGG patients, respectively. (A) Images of a 45-year-old patient with grade II glioma. The VOI was drawn on FLAIR. (B) Images of a 63-year-old patient with grade IV glioma. The VOI is obtained from FLAIR or T1CE. HGG (B) is associated with increased Tofts_Ve, Extend Tofts_Ve, Incremental_Ve, Patlak_Ktrans and decreased DCE_IAUGC90, IVIM_ADCslow values within the VOI. Histograms and corresponding cumulative curves for Extended Tofts_Ve (C) and Incremental_Ve (D) in patients A and B, showing a left-shifted cumulative curve (smaller mean value) in LGG for both parameters. |
Parameter Combination For Glioma Grading
For the six parameters, multivariable logistic regression was performed to evaluate the efficacies of combined histogram metrics in glioma grading. Only the combination of Ve metrics (AUC = 0.8688, 0.8401, 0.8575, P < 0.0001, 0.0001, or 0.0001 for Tofts, Extended Tofts, or Incremental model, respectively) was associated with the increased diagnostic efficacies compared with their single histogram metrics. Moreover, combined mean metrics of the six parameters (AUC = 0.8611, P < 0.0001) performed better than the single mean as well (Figure 3). Thus, the combination of variables from either histogram metrics or multi-modal parameters could improve the efficacies of glioma grading.
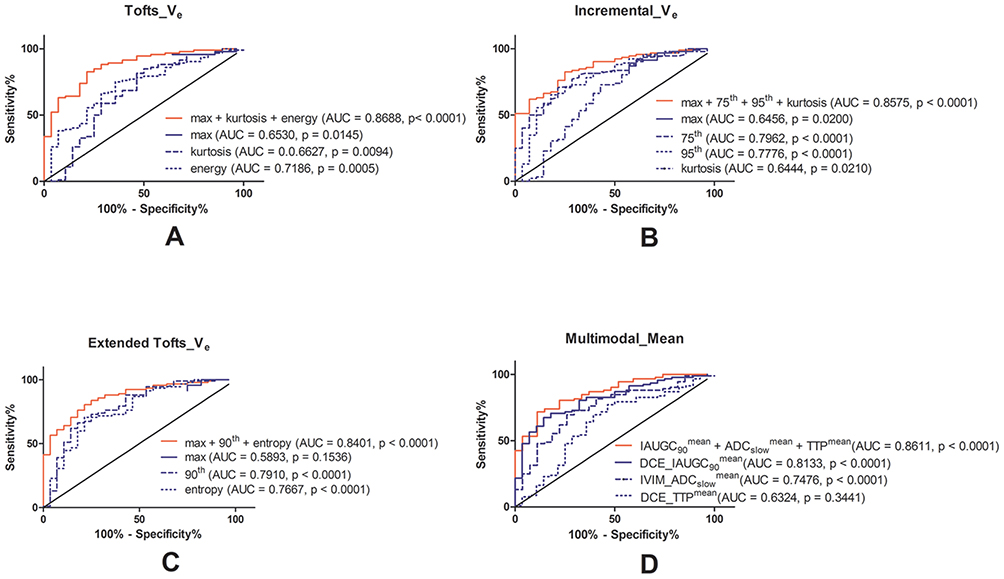 |
Figure 3 Diagnostic performance of multivariable logistic regression selected individual metrics or their combination in differentiating LGGs from HGGs. The ROC curves of (A) max, kurtosis, energy of Tofts_Ve as well as their combination; (B) max, 75th, 95th and kurtosis of Incremental_Ve as well as their combination; (C) max, 95th and entropy of Extended Tofts_Ve as well as their combination; (D) DCE_IAUGC90mean, IVIM_ADCslowmean, DCE_TTPmean as well as their combination. |
We further validated the accuracies of the combined metrics using LOOCV strategy. Only the combination of Tofts_Ve histogram metrics (max, kurtosis, and energy were combined) showed increased accuracy (81.67%, AUC = 0.840) (Table 4).
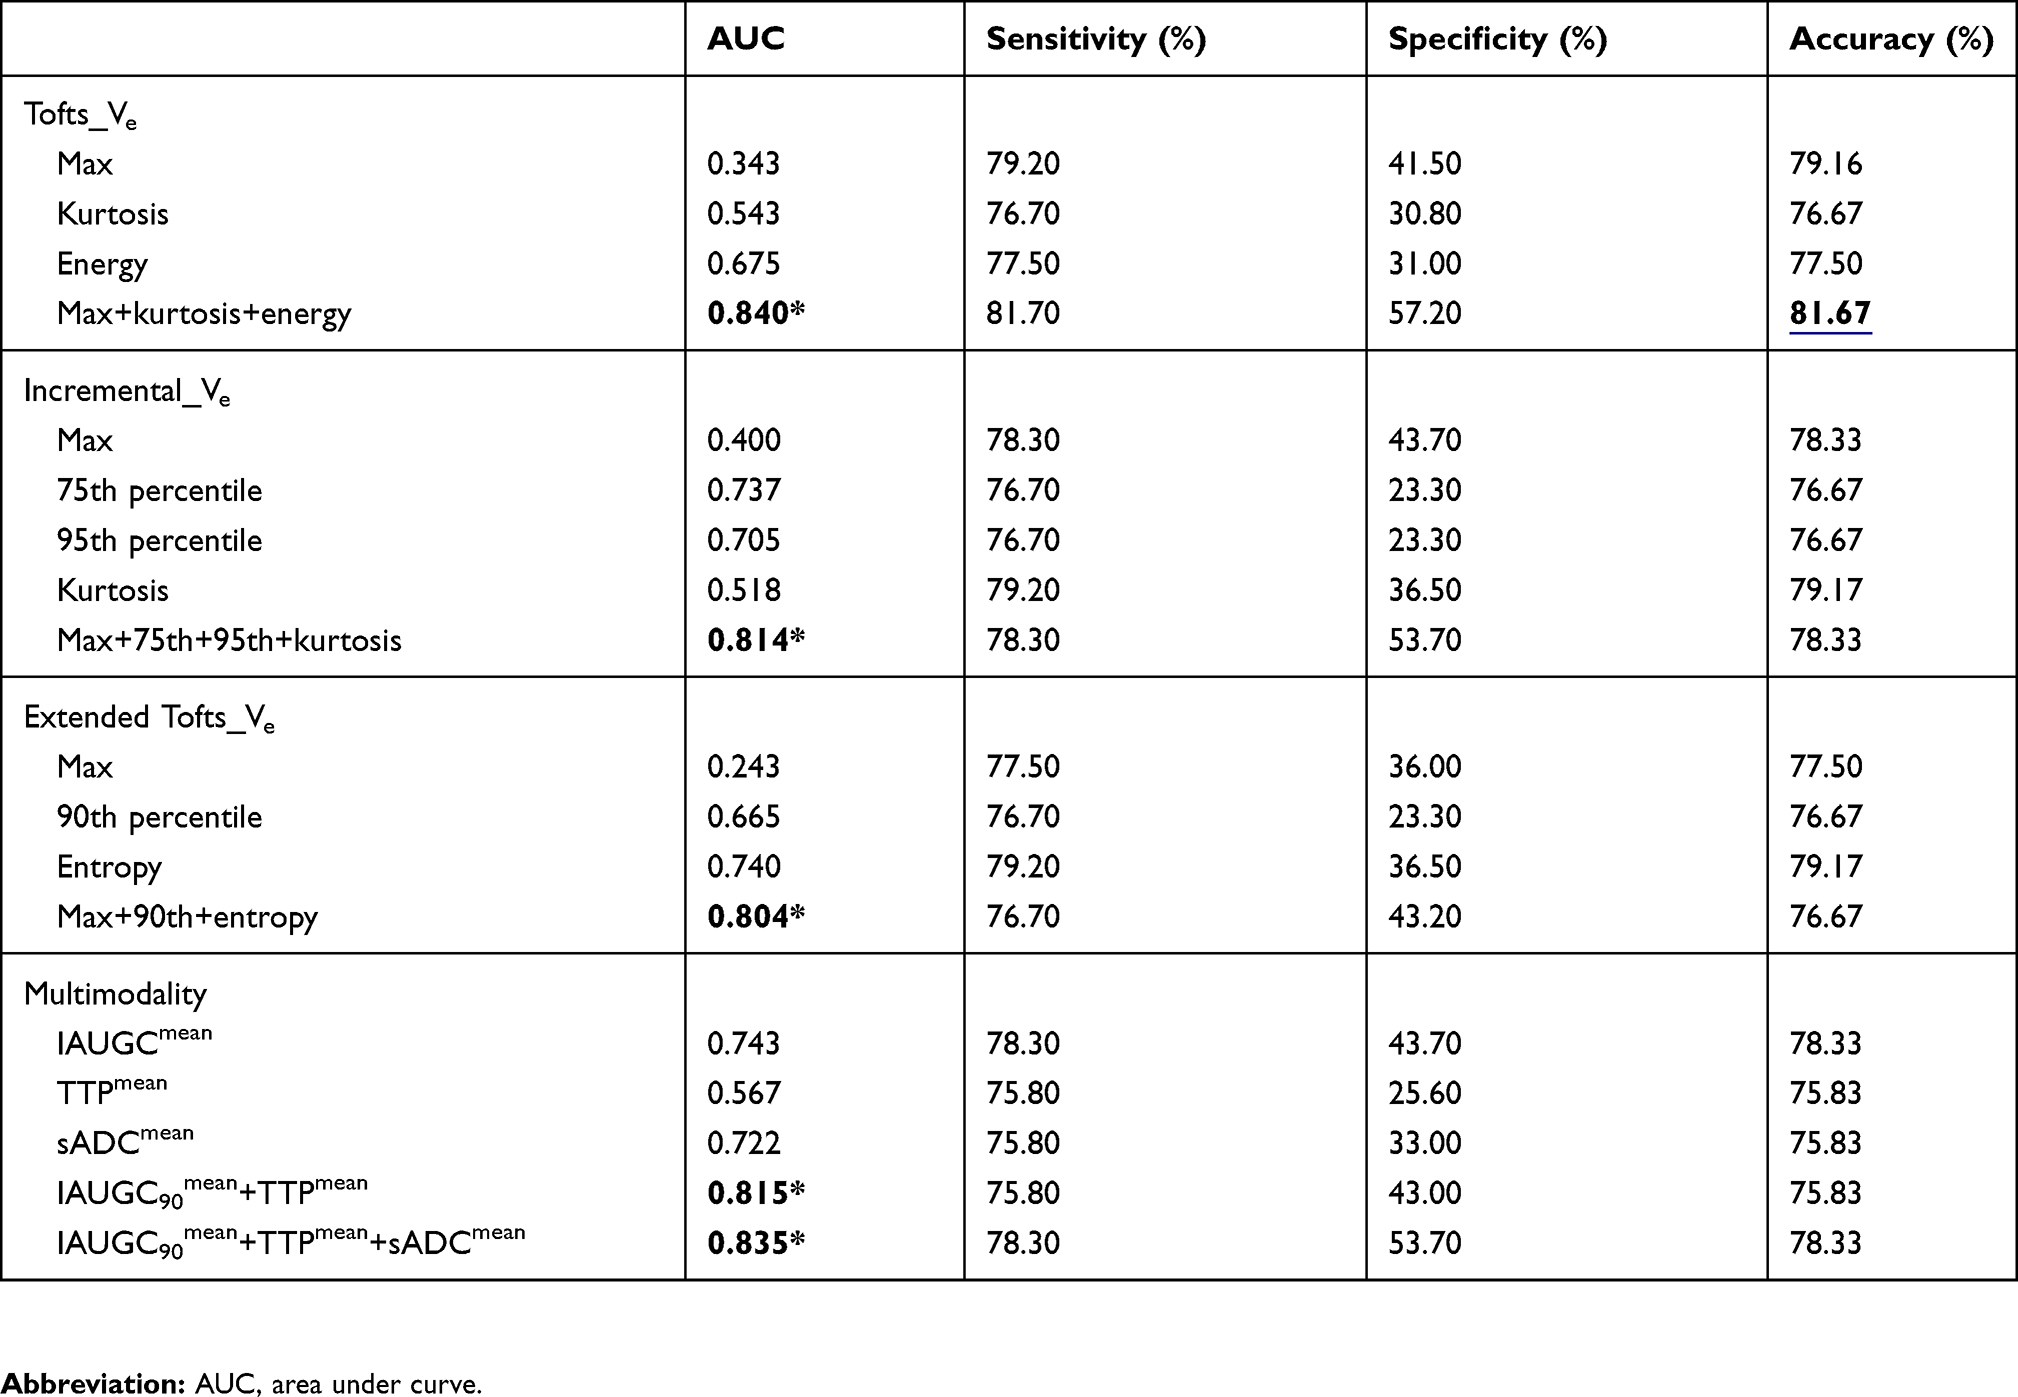 |
Table 4 Leave-One Out Cross-Validation For Combined Diagnostic Efficacies With Multivariate Logistic Regression |
Survival Prediction
ROC analyses were first used to evaluate efficacies of the mean values for predicting OS at 12, 15, and 18 months after surgery. Multi-modal parameters achieved mild to moderate prognostic powers at varied time points. Among the means, Patlak_Ktransmean (AUC = 0.9118, P = 0.0003) and Extended Tofts_Vemean (AUC = 0.9044, P = 0.0004) were the two optimal predictors which performed better at 18 months follow-up than at 12 or 15 months (Table A.4).
We further evaluated the roles of histogram metrics in predicting OS at 12, 15, and 18 months after surgery. The 95th percentiles of Patlak_Ktrans (AUC = 0.9265, P = 0.0002) and Extended Tofts_Ve (AUC = 0.9154, P = 0.0003) performed best at 18-month follow-up (Table A.5), and corresponding ROC curves of the means and 95th percentiles are shown in Figure 4.
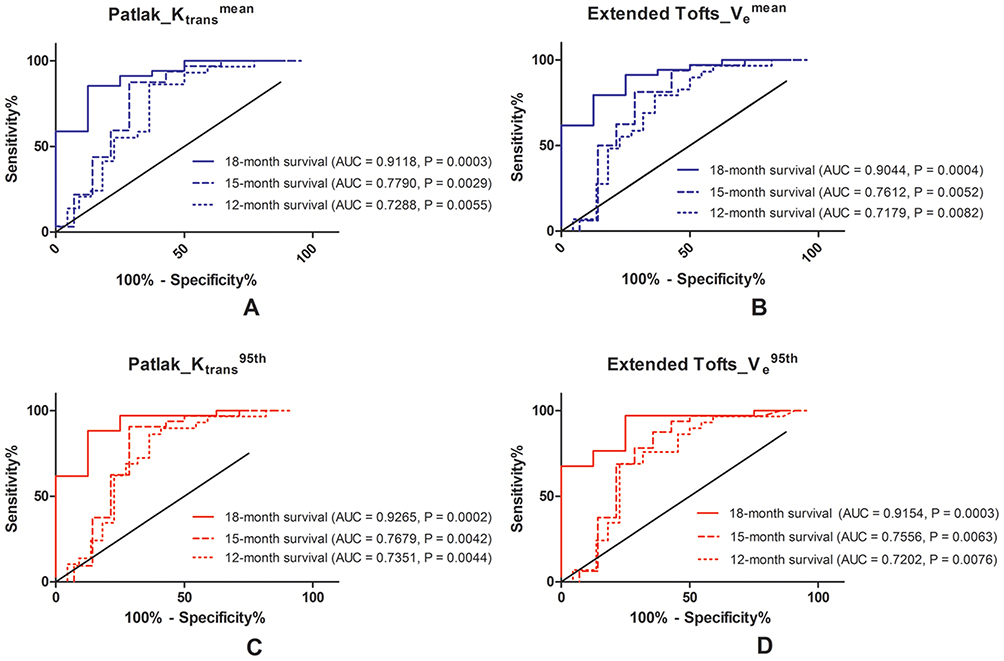 |
Figure 4 ROC analysis of histogram parameters in predicting patients’ survival. The ROC curves of (A) Patlak_Ktransmean, (B) Extended Tofts_Vemean, (C) Patlak_Ktrans95th, or (D) Extended Tofts_Ve95th for predicting patient survival at 12, 15, or 18 months after diagnosis. |
Log-rank test using Kaplan–Meier curve was performed to predict OS at varied follow-up time points. Using the medians of each metric, the patients were stratified into two groups. As for Patlak_Ktrans (Figure 5), the 95th percentile could predict 12-, 15-, or 18-month OS (P = 0.0109, 0.0373, 0.0157), but the mean metric (P = 0.0636, 0.0952, or 0.0755 for 12-, 15-, or 18-month OS) were not significantly effective. As for Extended Tofts_Ve (Figure 6), the 95th percentile (P = 0.0031, 0.0143, or 0.0063, for 12-, 15- or 18-month OS, respectively) also performed better than the mean (P = 0.0216, 0.0408, or 0.0423, for 12-, 15-, or 18-month OS, respectively). In brief, the histogram metrics like 95th percentile did improve the performance of Patlak_Ktrans and Extended Tofts_Ve for OS prediction.
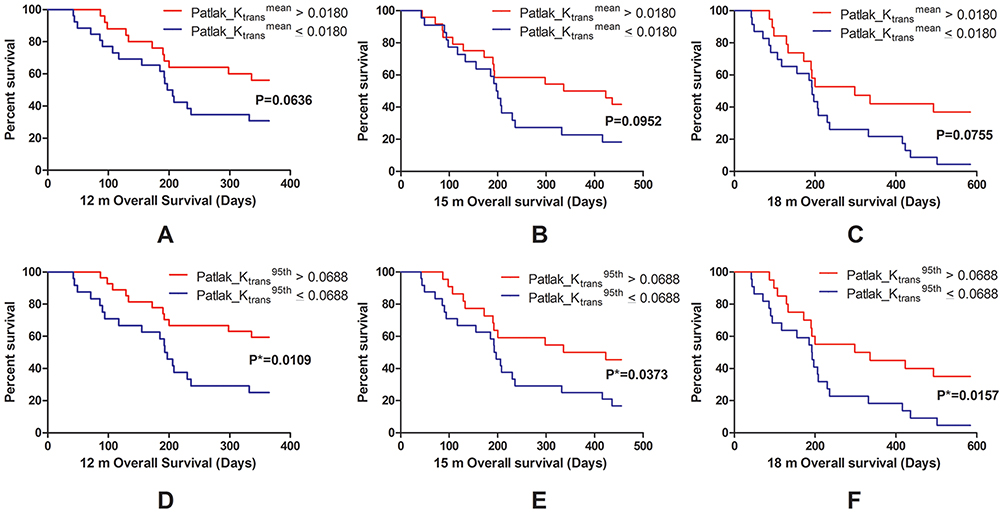 |
Figure 5 The Kaplan–Meier survival analysis of Patlak_Ktransmean (A, B, C) or Patlak_Ktrans95th (D, E, F). Kaplan–Meier curves of Patlak_Ktransmean for patient survival at 12 (A), 15 (B), or 18 (C) months after surgery. Kaplan–Meier curves of Patlak_Ktrans95th for patient survival at 12 (D), 15 (E), or 18 (F) months after surgery. Patlak_Ktrans95th performed better than Patlak_Ktrans mean based on the different P values (*P < 0.05). |
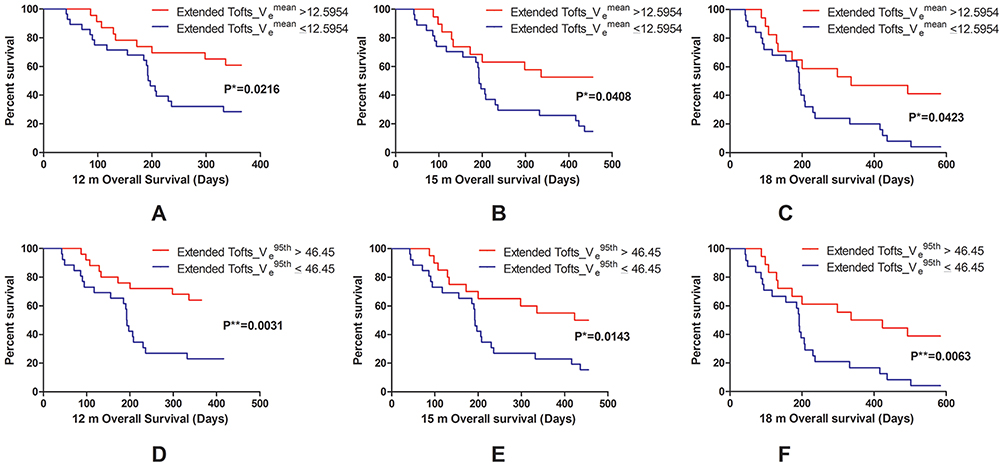 |
Figure 6 The Kaplan–Meier survival analysis of Extended Tofts_Vemean (A, B, C) or Extended Tofts_Ve95th (D, E, F). Kaplan–Meier curves of Extended Tofts_Vemean for patient survival at 12 (A), 15 (B), or 18 (C) months after surgery. Kaplan–Meier curves of Extended Tofts_Ve95th for patient survival at 12 (D), 15 (E), or 18 (F) months after surgery. Extended Tofts_Ve95th performed better than Extended Tofts_Vemean based on the different P values (*P < 0.05, **P < 0.01). |
Discussion
In this study, we revealed that DCE-MRI performed better than 3D-ASL or IVIM-DWI in both glioma grading and survival prediction. The mean or histogram metrics of IAUGC90, Ve, and Ktrans were associated with the higher grading efficacies. The mean or the 95th percentile values of Extended Tofts_Ve and Patlak_Ktrans were with the higher efficacies to predict OS. The combination of multiple histogram metrics of a single MRI parameter or means from multi-modal parameters was associated with increased glioma grading efficacy.
The mean or histogram metrics of Ktrans and Ve (independent from the pharmacokinetics algorithm) are associated with higher efficacies in glioma grading. However, only Ve histogram metrics were survived from multivariable stepwise regression for glioma grading. DCE-MRI derived parameters, especially Ktrans and Ve, were important imaging biomarkers for glioma grading,3,7,24–27 with similar efficacies.24,26 But a VOI-based histogram analysis revealed that histogram metrics of Ktrans but not that of Ve survived from multivariable stepwise regression.28 One possible explanation is that previous studies suffered from small patient population number (28,28 compared with 120 in the current study). However, further validation of Ktrans and Ve for glioma grading is needed before a consolidated conclusion is drawn.
Our study also demonstrated that Ve and Ktrans are promising prognostic factors for glioma patients’ OS. Some studies reported that high Ktrans or Ve was associated with significantly poor prognosis for glioma patients in both univariate and multivariate survival analyses.11 On the other hand, some studies suggested that there was no close relationship between permeability parameters from DCE and glioma survival, making Ktrans not a consistent survival predictor.29,30 Our study was different from previous ones concerning the subject number (90 of ours vs 69, 49 in previous ones), pharmacokinetic models used (4 models of ours vs only one in previous ones) and the tumor coverage methods (our VOI-based histogram analysis vs ROI-based analysis in other studies). Although more patients, varied models, and advanced VOI-based analysis were used in our study, the prognosis of glioma patients was still affected by multiple factors, such as age, histological type, molecular phenotype, extent of resection (EOR), post-operative neurological function, and adjuvant therapy.31,32 Using volumetric computations of the LGGs, EOR was demonstrated as an independent prognostic factor, even better than genetic markers.33 Another meta-analysis suggested that gross total resection (GTR) is associated with a better OS than subtotal resection (STR) and biopsy in HGGs.34 Postoperative neurological status is dynamically altered in varied therapeutic protocols including EOR and adjuvant therapy which may drastically influence OS.35–37 In our cohort, more than 92% LGGs and 70.7% HGGs were with GTR. Besides, due to adjuvant therapy and neurological status evaluation after surgery regulated by multicenter clinical experts, post-operative records would not be obtained in our institution. Therefore, our OS prediction was biased because only preoperative MRI was used, and it needs to be analyzed with multivariate cox regression regarding the therapies, histological grading, and clinical and molecular information in future studies.
The combination of multiple histogram metrics from a single parameter or means from multi-modal parameters was associated with the increased glioma grading efficacy. The combination of histogram metrics of Ve derived from Tofts model performed the best. This is quite consistent with previous studies showing that the multi-modal combinations are superior to single modal parameter38 for glioma grading.39–43 In addition, the efficacy of histogram metrics is superior to that of the mean when predicting patient survival. This histogram method is promising for clinical use after we reach the balance between labor cost and efficacy improvement.
Perfusion MR imaging technique such as dynamic susceptibility contrast (DSC) is widely used in the clinical work-up of brain tumors because of their ability to help quantify tumor microvessel proliferation. However, DCE was implemented in our study because DCE signal intensity time curve reflects a combination of tissue perfusion, microvessel permeability, and extravascular-extracellular space. A comprehensive meta-analysis has shown that both DCE and DSC are reliable techniques in differentiating glioma grades.44 A new multi-center standardized assessment demonstrated that DCE-derived Ktrans, Ve, and initial area under the concentration curve (iAUC) had higher accuracies than the metric from DSC for differentiating grade II from III or IV gliomas.45 Therefore, DCE was applicable for evaluating both perfusion and permeability of microvessel in clinical work-up of brain tumors.
There are some limitations for the current study. First, the prospective clinical trial from 2014 to 2016 was designed according to WHO 2007 grading criteria which has now been replaced by WHO 2016 grading criteria. Second, the number of patients with LGGs is relatively small compared with the number of HGGs patients and may have biased our final conclusion. Third, we did not utilize multivariable cox regression to predict OS, ignoring clinical characteristics effect.
Conclusions
In summary, we offered evidence that DCE-MRI performed better than 3D-ASL or IVIM-DWI in both glioma grading and survival prediction. Ktrans and Ve were associated with the higher glioma grading efficacies using either mean or histogram metrics. Combination of Ve histogram metrics was the one with the highest glioma grading accuracy. The mean or the 95th values of Ve and Ktrans were with the higher efficacies for survival prediction.
Acknowledgments
We would like to thank Dr. Xiao-Fei Yang from Beijing CiBR Med Co., Ltd and Nordic NeuroLab for offering software support and trial service of NordicICE.
Author Contributions
All authors made substantial contributions to conception and design, acquisition of data, or analysis and interpretation of data; took part in drafting the article or revising it critically for important intellectual content; gave final approval of the version to be published; and agree to be accountable for all aspects of the work.
Disclosure
The authors declare no conflicts of interest in this work.
References
1. Louis DN, Ohgaki H, Wiestler OD, et al. The 2007 WHO classification of tumours of the central nervous system. Acta Neuropathol. 2007;114(2):97–109. doi:10.1007/s00401-007-0243-4
2. Chung C, Metser U, Menard C. Advances in magnetic resonance imaging and positron emission tomography imaging for grading and molecular characterization of glioma. Semin Radiat Oncol. 2015;25(3):164–171. doi:10.1016/j.semradonc.2015.02.002
3. Choi YS, Kim DW, Lee SK, et al. The added prognostic value of preoperative dynamic contrast-enhanced MRI histogram analysis in patients with glioblastoma: analysis of overall and progression-free survival. AJNR Am J Neuroradiol. 2015;36(12):2235–2241. doi:10.3174/ajnr.A4449
4. Jia ZZ, Gu HM, Zhou XJ, et al. The assessment of immature microvascular density in brain gliomas with dynamic contrast-enhanced magnetic resonance imaging. Eur J Radiol. 2015;84(9):1805–1809. doi:10.1016/j.ejrad.2015.05.035
5. Awasthi R, Rathore RK, Soni P, et al. Discriminant analysis to classify glioma grading using dynamic contrast-enhanced MRI and immunohistochemical markers. Neuroradiology. 2012;54(3):205–213. doi:10.1007/s00234-011-0874-y
6. Papamichael D, Audisio RA, Glimelius B, et al. Treatment of colorectal cancer in older patients: international Society of Geriatric Oncology (SIOG) consensus recommendations 2013. Ann Oncol. 2015;26(3):463–476. doi:10.1093/annonc/mdu253
7. Li X, Zhu Y, Kang H, et al. Glioma grading by microvascular permeability parameters derived from dynamic contrast-enhanced MRI and intratumoral susceptibility signal on susceptibility weighted imaging. Cancer Imaging. 2015;15:4. doi:10.1186/s40644-015-0039-z
8. Hu YC, Yan LF, Wu L, et al. Intravoxel incoherent motion diffusion-weighted MR imaging of gliomas: efficacy in preoperative grading. Sci Rep. 2014;4:7208. doi:10.1038/srep07208
9. Cebeci H, Aydin O, Ozturk-Isik E, et al. Assesment of perfusion in glial tumors with arterial spin labeling; comparison with dynamic susceptibility contrast method. Eur J Radiol. 2014;83(10):1914–1919. doi:10.1016/j.ejrad.2014.07.002
10. Bisdas S, Koh TS, Roder C, et al. Intravoxel incoherent motion diffusion-weighted MR imaging of gliomas: feasibility of the method and initial results. Neuroradiology. 2013;55(10):1189–1196. doi:10.1007/s00234-013-1229-7
11. Nguyen TB, Cron GO, Mercier JF, et al. Preoperative prognostic value of dynamic contrast-enhanced MRI-derived contrast transfer coefficient and plasma volume in patients with cerebral gliomas. AJNR Am J Neuroradiol. 2015;36(1):63–69. doi:10.3174/ajnr.A4006
12. Liu ZC, Yan LF, Hu YC, et al. Combination of IVIM-DWI and 3D-ASL for differentiating true progression from pseudoprogression of Glioblastoma multiforme after concurrent chemoradiotherapy: study protocol of a prospective diagnostic trial. BMC Med Imaging. 2017;17(1):10. doi:10.1186/s12880-017-0183-y
13. Han Y, Yan LF, Wang XB, et al. Structural and advanced imaging in predicting MGMT promoter methylation of primary glioblastoma: a region of interest based analysis. BMC Cancer. 2018;18(1):215. doi:10.1186/s12885-018-4114-2
14. Tian Q, Yan LF, Zhang X, et al. Radiomics strategy for glioma grading using texture features from multiparametric MRI. J Magn Reson Imaging. 2018. doi:10.1002/jmri.26010
15. Hu YC, Yan LF, Sun Q, et al. Comparison between ultra-high and conventional mono b-value DWI for preoperative glioma grading. Oncotarget. 2017;8(23):37884–37895. doi:10.18632/oncotarget.14180
16. Le Bihan D, Breton E, Lallemand D, Aubin ML, Vignaud J, Laval-Jeantet M. Separation of diffusion and perfusion in intravoxel incoherent motion MR imaging. Radiology. 1988;168(2):497–505. doi:10.1148/radiology.168.2.3393671
17. Patlak CS, Blasberg RG, Fenstermacher JD. Graphical evaluation of blood-to-brain transfer constants from multiple-time uptake data. J Cereb Blood Flow Metab. 1983;3(1):1–7. doi:10.1038/jcbfm.1983.1
18. Tofts PS, Brix G, Buckley DL, et al. Estimating kinetic parameters from dynamic contrast-enhanced T(1)-weighted MRI of a diffusable tracer: standardized quantities and symbols. J Magn Reson Imaging. 1999;10(3):223–232. doi:10.1002/(SICI)1522-2586(199909)10:3<223::AID-JMRI2>3.0.CO;2-S
19. Bergamino M, Saitta L, Barletta L, et al. Measurement of blood-brain barrier permeability with t1-weighted dynamic contrast-enhanced MRI in brain tumors: a comparative study with two different algorithms. ISRN Neurosci. 2013;2013:905279. doi:10.1155/2013/905279
20. Tietze A, Mouridsen K, Mikkelsen IK. The impact of reliable prebolus T 1 measurements or a fixed T 1 value in the assessment of glioma patients with dynamic contrast enhancing MRI. Neuroradiology. 2015;57(6):561–572. doi:10.1007/s00234-015-1502-z
21. Wangaryattawanich P, Hatami M, Wang J, et al. Multicenter imaging outcomes study of The Cancer Genome Atlas glioblastoma patient cohort: imaging predictors of overall and progression-free survival. Neuro-Oncology. 2015;17(11):1525–1537. doi:10.1093/neuonc/nov117
22. Pichler J, Pachinger C, Pelz M, Kleiser R. MRI assessment of relapsed glioblastoma during treatment with bevacizumab: volumetric measurement of enhanced and FLAIR lesions for evaluation of response and progression–a pilot study. Eur J Radiol. 2013;82(5):e240–245. doi:10.1016/j.ejrad.2012.12.018
23. Kim HS, Kim JH, Kim SH, Cho KG, Kim SY. Posttreatment high-grade glioma: usefulness of peak height position with semiquantitative MR perfusion histogram analysis in an entire contrast-enhanced lesion for predicting volume fraction of recurrence. Radiology. 2010;256(3):906–915. doi:10.1148/radiol.10091461
24. Choi HS, Kim AH, Ahn SS, Shin NY, Kim J, Lee SK. Glioma grading capability: comparisons among parameters from dynamic contrast-enhanced MRI and ADC value on DWI. Korean J Radiol. 2013;14(3):487–492. doi:10.3348/kjr.2013.14.3.487
25. Zhao J, Yang ZY, Luo BN, Yang JY, Chu JP. Quantitative evaluation of diffusion and dynamic contrast-enhanced MR in tumor parenchyma and peritumoral area for distinction of brain tumors. PLoS One. 2015;10(9):e0138573. doi:10.1371/journal.pone.0138573
26. Zhang N, Zhang L, Qiu B, Meng L, Wang X, Hou BL. Correlation of volume transfer coefficient Ktrans with histopathologic grades of gliomas. J Magn Reson Imaging. 2012;36(2):355–363. doi:10.1002/jmri.v36.2
27. Brendle C, Hempel JM, Schittenhelm J, et al. Glioma grading and determination of IDH mutation status and ATRX loss by DCE and ASL perfusion. Clin Neuroradiol. 2017;28:421–428.
28. Jung SC, Yeom JA, Kim JH, et al. Glioma: application of histogram analysis of pharmacokinetic parameters from T1-weighted dynamic contrast-enhanced MR imaging to tumor grading. AJNR Am J Neuroradiol. 2014;35(6):1103–1110. doi:10.3174/ajnr.A3825
29. Hilario A, Hernandez-Lain A, Sepulveda JM, Lagares A, Perez-Nunez A, Ramos A. Perfusion MRI grading diffuse gliomas: impact of permeability parameters on molecular biomarkers and survival. Neurocirugia (Astur). 2019;30(1):11–18. doi:10.1016/j.neucir.2018.06.004
30. Ulyte A, Katsaros VK, Liouta E, et al. Prognostic value of preoperative dynamic contrast-enhanced MRI perfusion parameters for high-grade glioma patients. Neuroradiology. 2016;58(12):1197–1208. doi:10.1007/s00234-016-1741-7
31. Zinn PO, Colen RR, Kasper EM, Burkhardt JK. Extent of resection and radiotherapy in GBM: a 1973 to 2007 surveillance, epidemiology and end results analysis of 21,783 patients. Int J Oncol. 2013;42(3):929–934. doi:10.3892/ijo.2013.1770
32. Syed M, Liermann J, Verma V, et al. Survival and recurrence patterns of multifocal glioblastoma after radiation therapy. Cancer Manag Res. 2018;10:4229–4235. doi:10.2147/CMAR.S165956
33. Eseonu CI, Eguia F, ReFaey K, et al. Comparative volumetric analysis of the extent of resection of molecularly and histologically distinct low grade gliomas and its role on survival. J Neurooncol. 2017;134(1):65–74. doi:10.1007/s11060-017-2486-9
34. Almenawer SA, Badhiwala JH, Alhazzani W, et al. Biopsy versus partial versus gross total resection in older patients with high-grade glioma: a systematic review and meta-analysis. Neuro-Oncology. 2015;17(6):868–881. doi:10.1093/neuonc/nou349
35. Tang S, Liao J, Long Y. Comparative assessment of the efficacy of gross total versus subtotal total resection in patients with glioma: a meta-analysis. Int J Surg. 2019;63:90–97. doi:10.1016/j.ijsu.2019.02.004
36. Martinez R, Volter C, Behr R. Parameters assessing neurological status in malignant glioma patients: prognostic value for survival and relapse-free time. Br J Neurosurg. 2008;22(4):557–562. doi:10.1080/02688690802166424
37. Patel CK, Vemaraju R, Glasbey J, et al. Trends in peri-operative performance status following resection of high grade glioma and brain metastases: the impact on survival. Clin Neurol Neurosurg. 2018;164:67–71. doi:10.1016/j.clineuro.2017.11.016
38. de Fatima Vasco Aragao M, Law M, Batista de Almeida D, et al. Comparison of perfusion, diffusion, and MR spectroscopy between low-grade enhancing pilocytic astrocytomas and high-grade astrocytomas. AJNR Am J Neuroradiol. 2014;35(8):1495–1502. doi:10.3174/ajnr.A3905
39. Koob M, Girard N, Ghattas B, et al. The diagnostic accuracy of multiparametric MRI to determine pediatric brain tumor grades and types. J Neurooncol. 2016;127(2):345–353. doi:10.1007/s11060-015-2042-4
40. Wang XC, Zhang H, Tan Y, et al. Combined value of susceptibility-weighted and perfusion-weighted imaging in assessing who grade for brain astrocytomas. J Magn Reson Imaging. 2014;39(6):1569–1574. doi:10.1002/jmri.24312
41. Fudaba H, Shimomura T, Abe T, et al. Comparison of multiple parameters obtained on 3T pulsed arterial spin-labeling, diffusion tensor imaging, and MRS and the Ki-67 labeling index in evaluating glioma grading. AJNR Am J Neuroradiol. 2014;35(11):2091–2098. doi:10.3174/ajnr.A4018
42. Dunet V, Maeder P, Nicod-Lalonde M, et al. Combination of MRI and dynamic FET PET for initial glioma grading. Nuklearmedizin. 2014;53(4):155–161. doi:10.3413/Nukmed-0650-14-03
43. Goda JS, Dutta D, Raut N, et al. Can multiparametric MRI and FDG-PET predict outcome in diffuse brainstem glioma? A report from a prospective phase-II study. Pediatr Neurosurg. 2013;49(5):274–281. doi:10.1159/000366167
44. Liang J, Liu D, Gao P, et al. Diagnostic values of DCE-MRI and DSC-MRI for differentiation between high-grade and low-grade gliomas: a comprehensive meta-analysis. Acad Radiol. 2018;25(3):338–348. doi:10.1016/j.acra.2017.10.001
45. Anzalone N, Castellano A, Cadioli M, et al. Brain gliomas: multicenter standardized assessment of dynamic contrast-enhanced and dynamic susceptibility contrast MR images. Radiology. 2018;287(3):933–943. doi:10.1148/radiol.2017170362
 © 2019 The Author(s). This work is published and licensed by Dove Medical Press Limited. The
full terms of this license are available at https://www.dovepress.com/terms
and incorporate the Creative Commons Attribution
- Non Commercial (unported, 3.0) License.
By accessing the work you hereby accept the Terms. Non-commercial uses of the work are permitted
without any further permission from Dove Medical Press Limited, provided the work is properly
attributed. For permission for commercial use of this work, please see paragraphs 4.2 and 5 of our Terms.
© 2019 The Author(s). This work is published and licensed by Dove Medical Press Limited. The
full terms of this license are available at https://www.dovepress.com/terms
and incorporate the Creative Commons Attribution
- Non Commercial (unported, 3.0) License.
By accessing the work you hereby accept the Terms. Non-commercial uses of the work are permitted
without any further permission from Dove Medical Press Limited, provided the work is properly
attributed. For permission for commercial use of this work, please see paragraphs 4.2 and 5 of our Terms.