
Back to Journals » Risk Management and Healthcare Policy » Volume 19
Performance of Novel Inflammatory Bowel Disease-Specific Models for Risk Adjustment
Authors Moran KM, Hellems SS, Munshi KD, Smith I, Null KD 
Received 8 July 2025
Accepted for publication 19 January 2026
Published 26 February 2026 Volume 2026:19 546530
DOI https://doi.org/10.2147/RMHP.S546530
Checked for plagiarism Yes
Review by Single anonymous peer review
Peer reviewer comments 2
Editor who approved publication: Dr Gulsum Kaya
Kellyn M Moran,1 Sarah S Hellems,2 Kiraat D Munshi,1 Ian Smith,2 Kyle D Null1
1Takeda Pharmaceuticals U.S.A., Inc., Cambridge, MA, USA; 2Optum Advisory Services, Minneapolis, MN, USA
Correspondence: Kyle D Null, Takeda Pharmaceuticals U.S.A., Inc., Cambridge, MA, 02142, USA, Tel +1 601-703-9756, Email [email protected]
Objective: We aimed to develop and evaluate inflammatory bowel disease (IBD)-specific risk-adjustment models using an actuarial approach.
Methods: This retrospective, cross-sectional study was conducted using Optum administrative claims data from patients with Crohn’s disease and/or ulcerative colitis between January 1, 2020, and December 31, 2022. Clinical-risk groupers with three severity levels were developed for Crohn’s disease and ulcerative colitis based on IBD medical costs associated with diagnosis codes. Linear regression models assessed the relationship between clinical-risk groupers and concurrent or prospective costs. Separate models were developed for commercially and Medicare Advantage-insured patients, and for users and nonusers of targeted IBD therapies. Additional predictors that improved explanatory power (R2) were included.
Results: In commercially and Medicare Advantage-insured patients, the clinical-risk grouper explained 20.99% and 20.72% of the variance in concurrent costs incurred by targeted therapy users, and 2.07% and 2.01% of the variance for nonusers, respectively. Including IBD-related hospitalizations (number and duration of stay) increased R2 to 41.56% and 22.71% for targeted IBD therapy users and to 29.20% and 16.56% for nonusers who were commercially and Medicare Advantage-insured, respectively. In prospective models, the clinical-risk grouper explained 12.04% and 31.68% of the variance in costs of commercially and Medicare Advantage-insured targeted IBD therapy users and 6.73% and 4.65% of the variance in nonusers, respectively. No evaluated predictors improved prospective model performance.
Conclusion: Our novel concurrent and prospective risk-adjustment models for patients with IBD explain and predict IBD-related costs using administrative claims data, which may offer real-world utility in multiple settings.
Keywords: risk adjustment, inflammatory bowel disease, clinical-risk grouper, actuarial approach
Introduction
Crohn’s disease (CD) and ulcerative colitis (UC) are debilitating chronic and progressive inflammatory bowel diseases (IBDs) that are estimated to affect more than 2 million people in the USA.1,2 As a result, the economic burden of IBD is high. Although CD and UC typically follow a relapsing and remitting disease course,3 a subset of patients present with continuous active inflammation and a high number of complications, requiring numerous costly diagnostic tests, medications, and surgeries.4 In two US studies published in 2020, mean total direct costs were estimated to be approximately $25,000 per patient per year for those with CD,5 and more than $18,000 per patient per year for those with UC;6 however, these figures provide only a partial picture of the situation, because a disproportionately small number of patients account for a large proportion of the medical expenditure.7,8
Diagnosis-based clinical grouper models, also known as risk-adjustment models, provide a simple way of predicting health care costs based on diagnosis codes that are routinely captured in administrative claims data.9,10 Although risk-adjustment models have similarities to clinical prediction models, the developmental approaches and their applications may differ. For example, the Diagnostic Cost Group Hierarchical Condition Category (DCG-HCC) models were developed and adapted for the Centers for Medicare and Medicaid Services, and are commonly used in the insurance industry to risk-adjust capitated payments and to set premiums for health care plans that reflect expected costs.9,10 In the DCG-HCC model, diagnostic codes are assigned to risk groups of increasing severity based on their associated medical costs. Risk scores are then calculated for individuals based on how their expected costs differ from others according to their observed diagnoses and other relevant predictive variables.9,11
Most published actuarial risk-adjustment models are not disease specific because they aim to categorize the full population broadly within a managed care plan. Although clinical prediction models exist for IBD, they are predominantly designed to predict clinical outcomes.12,13 There is increasing interest in using machine learning-based methods for these models, most commonly tree-based algorithms, rather than conventional risk prediction models that rely on statistical methods.12,13 While there is evidence to suggest these complex models can outperform conventional risk prediction models, they require large datasets and have a high risk of bias.12 In contrast, few models are designed to predict health care costs.14 To the best of our knowledge, there are no clinical-risk grouper models for IBD that utilize actuarial approaches that are familiar to payers. A simple risk-adjustment model that can predict IBD-related medical costs using readily available claims data has broad application. In clinical practice, it could offer a quick method for identifying patients who are likely to incur high costs and who may benefit from disease management programs.15 In clinical research, it could enable the risk adjustment of cost-based outcomes in IBD studies, and, in the managed care setting, it could enable capitated arrangements with provider groups. Herein, we describe the development and performance of novel IBD-specific risk-adjustment models designed to risk-normalize concurrent and predict prospective per patient per month (PPPM) medical costs in patients with IBD using diagnosis codes and other predictors.
Methods
Study Design and Objectives
This retrospective, cross-sectional study was conducted using administrative claims data from commercially insured and Medicare Advantage-insured patients with CD and/or UC between January 1, 2020, and December 31, 2022. An actuarial approach was employed with three objectives. First, create an IBD-specific diagnostic classification system (clinical-risk grouper) based on IBD-related medical expenditures and assign patients to severity groups based on their IBD diagnosis codes. Second, develop models using these diagnosis-based severity groups (and additional predictors) to risk-normalize concurrent IBD-related PPPM medical costs and predict prospective IBD-related PPPM medical costs. Third, evaluate and describe the performance of the models.
Data Source and Study Population
Claims data were obtained from Optum’s proprietary de-identified Normative Health Information database: a large, longitudinal claims database comprising data from 42 million individuals per year. The database is representative of commercially insured and Medicare Advantage-insured patients in the US covering diverse geographic regions and healthcare settings. No adjustments were made in this study for missing data. The study population included patients with at least one claim containing a primary International Classification of Diseases, 10th Revision, Clinical Modification (ICD-10-CM) diagnosis code for CD or UC during the 3-year study period. For the concurrent risk-adjustment models, patients were required to be eligible for and to have medical and pharmacy coverage for at least 1 month during the study year. For the prospective risk-adjustment models, patients were required to be eligible for and to have medical and pharmacy coverage for at least 1 month and to have at least one CD or UC claim in 2 consecutive study years.
Data Analysis
Descriptive statistics were used to summarize the demographics and the clinical characteristics of the study population for each study year.
Development and Application of the Clinical-Risk Grouper
The clinical-risk grouper was developed by applying a similar approach and the principles that were used to develop the DCG-HCC models.9,16 The principles are intended to guide model development rather than impose strict rules, and competing principles should be prioritized according to needs. The degree to which each principle was followed was determined by author consensus through multiple model iterations. The referenced principles and how they were applied are outlined below and described fully in the Supplementary Table 1.
Model principles state that because each diagnostic code contains potentially relevant clinical information, models should incorporate all International Classification of Diseases (ICD) codes (principle 9; Supplementary Table 1).9,16 There are 77 IBD ICD-10-CM diagnosis codes (28 CD codes and 49 UC codes); all were included in our clinical-risk grouper. The CD and UC diagnosis codes describe disease location (eg, small intestine) and complications (eg, presence of fistula or abscess). To assign the CD and UC codes to severity groups, the mean IBD-related PPPM medical costs were calculated for patients with a primary diagnosis for each code.
DCG-HCC model principles state that diagnoses in the same severity group are reasonably homogenous with respect to their effect on incurred medical costs (principle 2; Supplementary Table 1).9,16 To achieve this, rules were developed to group ICD-10-CM codes together with similar mean IBD-related medical costs per month using cluster analysis. For CD diagnosis codes, mean PPPM costs ranged from 84% to 155% of the mean CD-associated PPPM costs. The distribution of costs was greater across UC diagnosis codes, ranging from 26% to 182% of the mean; therefore, different rules were applied to assign codes to CD or UC severity groups (Supplementary Table 2). Each code was assigned to one severity group only, and all severity groups were assessed for separation by cost, sample size, and clinical meaning before finalization, in line with DCG-HCC model principles.9,16 In the final groupings (Table 1), the diagnosis codes in CD severity group 1 (lowest risk) predominantly comprised codes for CD without complications, with unspecified complications, or with rectal bleeding. CD severity group 3 (highest risk) included codes indicating extensive disease (in the small and large intestines) and CD with fistula or abscess. UC severity group 1 predominantly included codes related to inflammatory polyps, and severity group 3 included codes associated with more extensive disease (eg, pancolitis). The relative PPPM IBD costs for CD severity groups 1, 2, and 3 were 88%, 114%, and 141% of the overall mean CD costs, respectively; for UC severity groups 1, 2, and 3, these costs were 48%, 103%, and 150% of the overall mean UC costs, respectively (Table 1). The mean and relative costs for all IBD-related codes are shown in Supplementary Table 3.
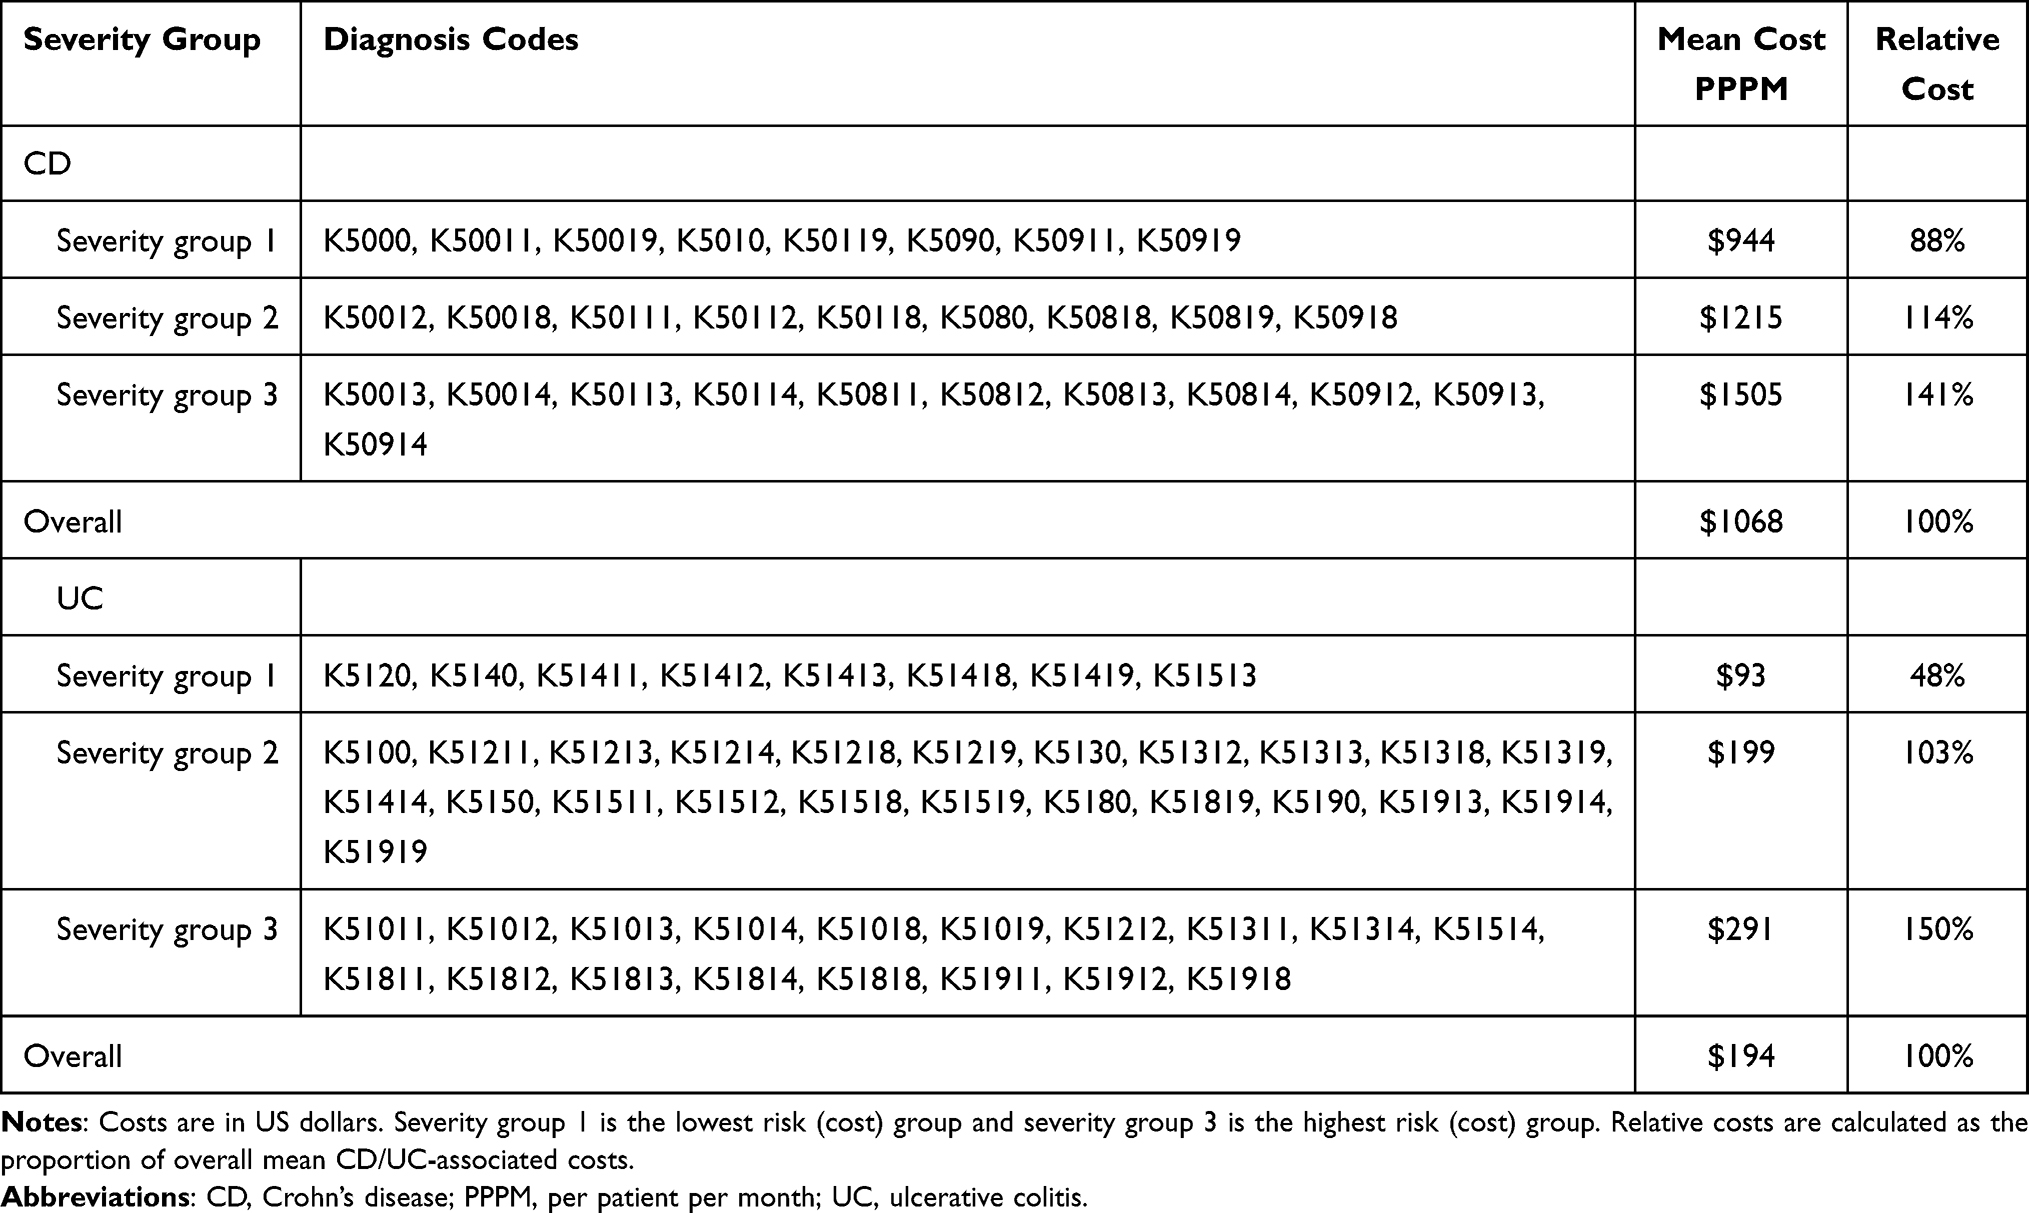 |
Table 1 Diagnosis Codes and Costs by Severity Group in the Proposed Clinical-Risk Grouper System for CD and UC |
To apply the clinical-risk grouper, patients were hierarchically assigned to the highest severity group based on the CD and/or UC diagnosis codes recorded for their claims data during the study year (see Supplementary Table 4 for examples). This reflects a key principle of HCC-DCG models: more severe manifestations of a condition override the effect of less serious ones (principle 4; Supplementary Table 1). The diagnostic classification should not reward coding proliferation;9,16 therefore, the number of claims submitted for each code did not affect group designation (principle 6; Supplementary Table 1).
Risk-Adjustment Models
The relationship between clinical-risk groupers and concurrent or prospective IBD-related PPPM costs, with and without additional predictors, was evaluated using ordinary least-squares regression analyses. This is the preferred method for risk-adjustment models, and as such the approach is well established.17 Ordinary least-squares regression models perform well in this setting because medical expenditure data are often skewed, and more complex log-transformed models may produce biased cost estimates under heteroskedasticity.9,18–20 This is the primary approach that the Centers for Medicare & Medicaid Services uses for their risk-adjusted capitated payment programs for Medicare Hierarchical Condition Categories and Medicare Part D Prescription Drug Hierarchical Condition Categories, as well as being commonly used in secondary capitated payment arrangements.9,21–23
For the prospective risk-adjustment model, patient characteristics were measured in the first study year and IBD-related medical costs were captured in the second year (Supplementary Figure 1). Our primary aim was to build and validate the clinical-risk grouper, which was therefore included in the model as a prespecified variable. Regression models were fitted without intercept to allow the β-coefficients to represent US dollar values and to ensure overall predicted costs were positive. The presence of both CD and UC diagnoses for a given patient within a study year was additive because both diagnoses are independently associated with higher health care costs.8 Interactions between CD and UC were not tested. Patients with both a CD diagnosis and a UC diagnosis were classified as having indeterminate colitis.
To account for medical expenditure differences between patient subgroups, separate models were developed for commercially and Medicare Advantage-insured patients, and for patients who were users and nonusers of targeted IBD therapies (biologics, including biosimilars; and small synthetic molecules, including Janus kinase inhibitors and sphingosine-1-phosphate pathway modulators). The performance of each model was evaluated using R2, which indicates the proportion of variance in the outcome (PPPM IBD-related medical costs) that is accounted for by the clinical-risk grouper and model predictors. Previously published concurrent risk-adjustment models typically report R2 values between 25% and 50%;24 in prospective models, R2 typically ranges from 2% to 16%.25 To create a parsimonious model and maximize R2, forward selection was used to determine additional predictors for inclusion, retaining variables that improved R2 only. The following predictors were tested: age, gender, insurance type, treatment type, comorbidities that may influence IBD outcomes, IBD-related hospitalizations and associated duration of stay, IBD-related emergency room (ER) visits, IBD flares, gastrointestinal surgeries/procedures, and the presence of extraintestinal manifestations.
Results
Study Population
Across all 3 study years, 158,649 patients with IBD were identified, including 64,714 patients with CD, 88,507 patients with UC, and 5428 patients with indeterminate colitis (Table 2). The mean age across all study years was 51.3 years in patients with CD, 57.3 years in patients with UC, and 49.9 years in patients with indeterminate colitis. Targeted IBD therapy use was highest in those with indeterminate colitis, and lowest in those with UC (CD, 41.3%; UC, 16.5%; indeterminate colitis, 53.2%). The proportion of patients with one or more IBD-related hospitalization was also highest in those with indeterminate colitis and lowest in those with UC (CD, 6.8%; UC, 3.7%; indeterminate colitis, 16.5%); this trend was reflected in the mean concurrent PPPM IBD-related costs (CD, $619; UC, $304; indeterminate colitis, $1217) and the proportion of patients who were commercially insured (CD, 62.1%; UC, 53.1%; indeterminate colitis, 65.5%).
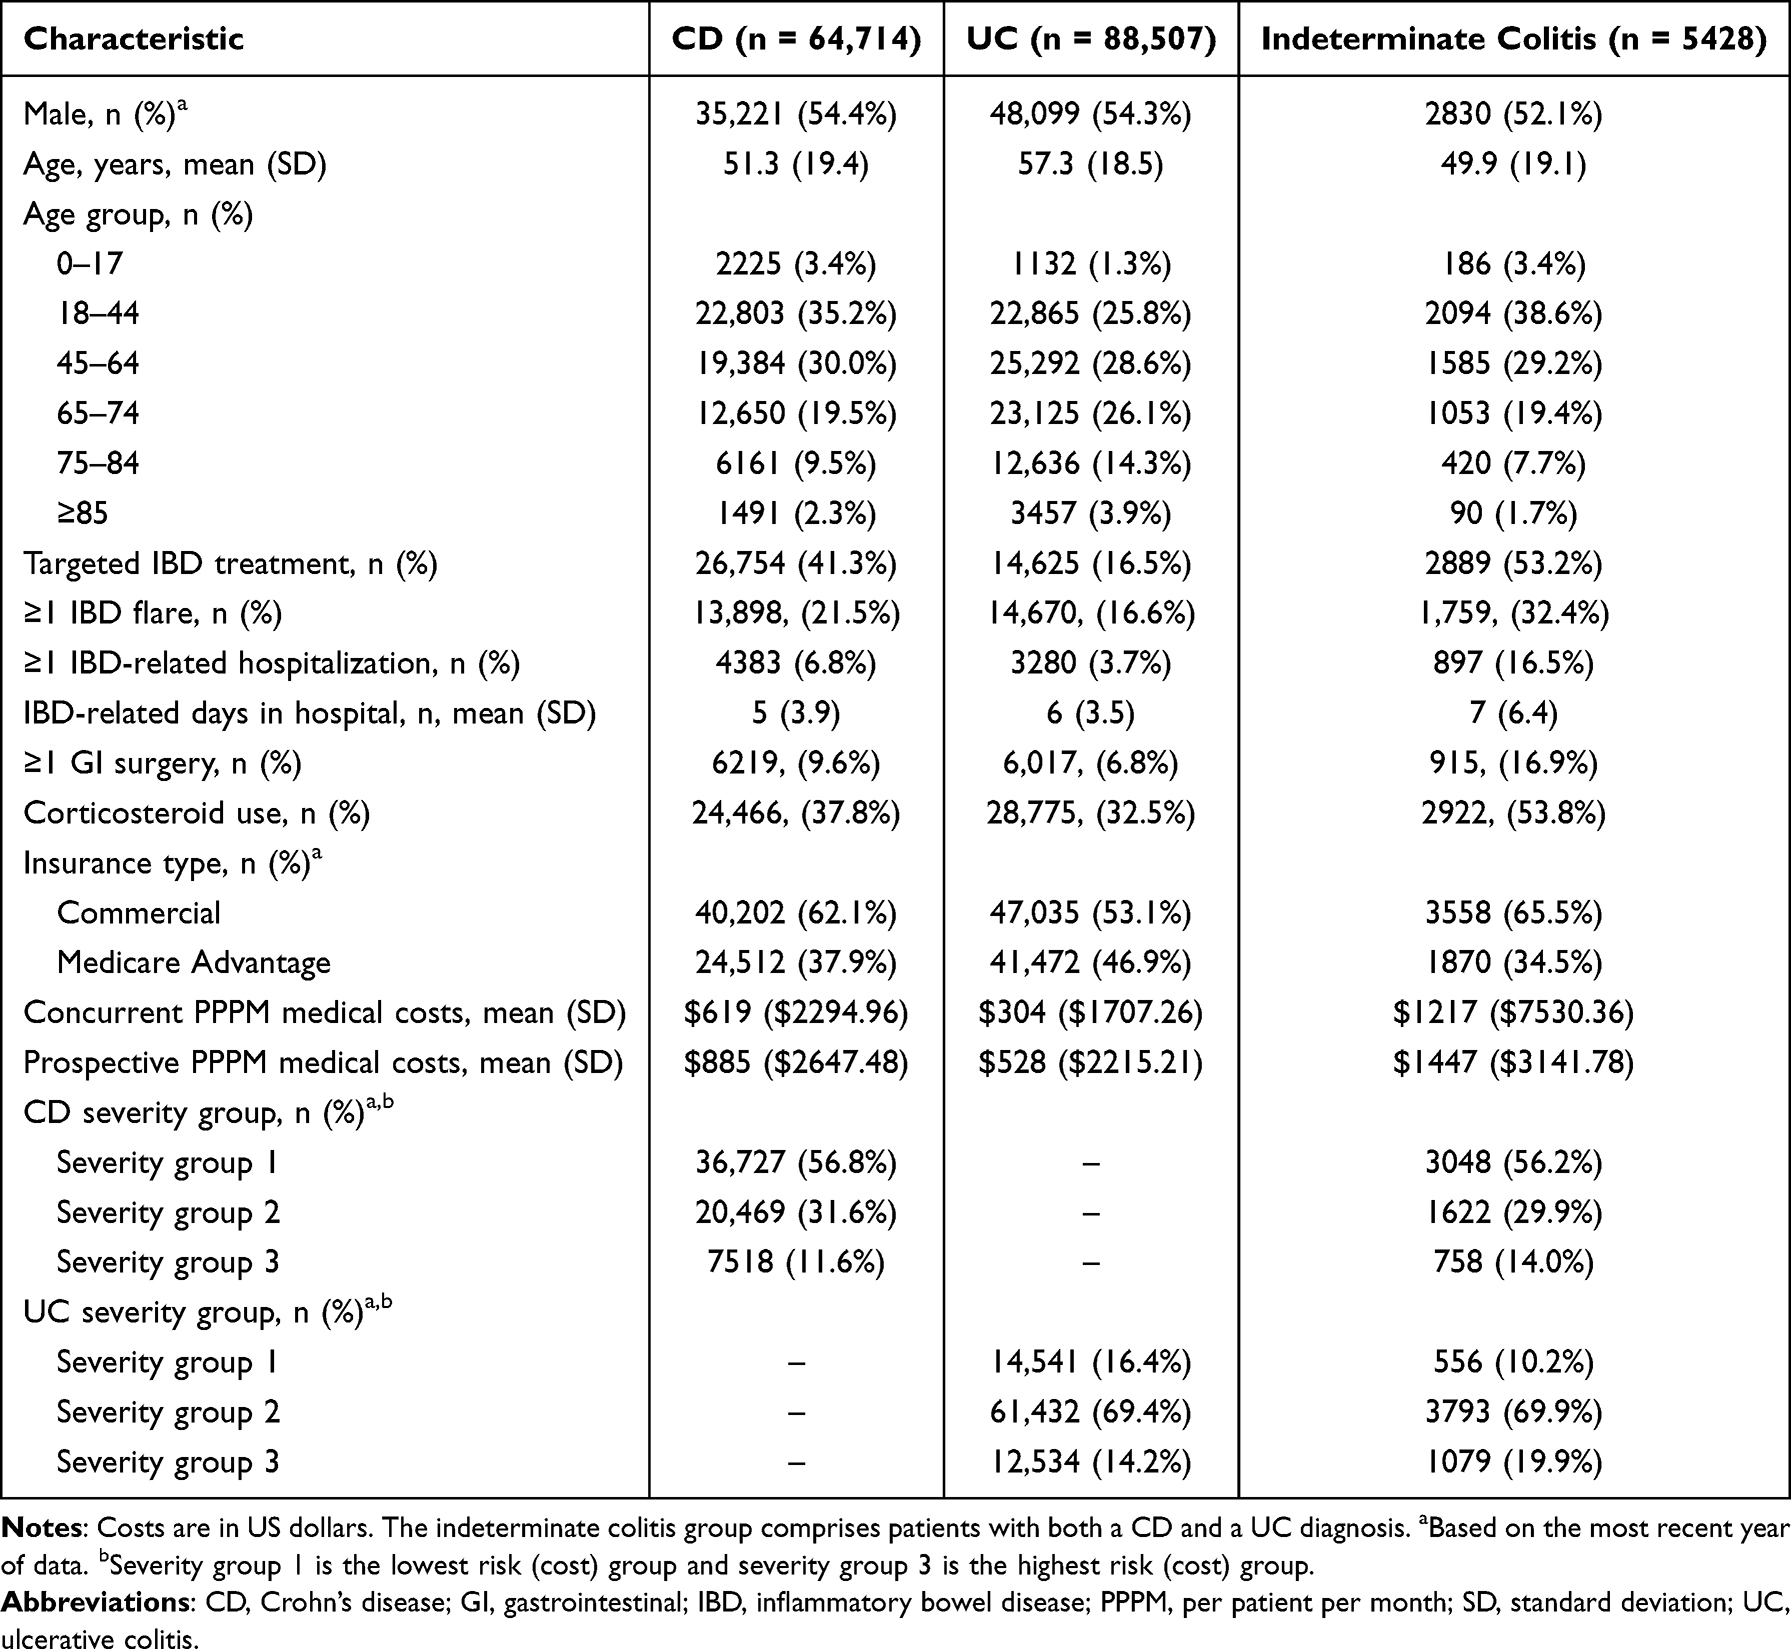 |
Table 2 Patient Demographics, Clinical Characteristics, and IBD-Related Medical Costs in Patients with CD, UC, or Indeterminate Colitis During the 3-Year Study Period |
Model Performance in Commercially Insured Patients
In the concurrent models, the clinical-risk grouper explained 20.99% of the variance in costs of patients who were targeted IBD therapy users and 2.07% of the variance for nonusers (Table 3). Number of IBD-related hospitalizations (range, 0–5) and duration of IBD-related hospitalizations (range, 0–119 days) increased explanatory power of the concurrent models to 41.56% in patients who were users of targeted IBD therapies and to 29.20% in nonusers, while still preserving the clinical-risk grouper severity rankings.
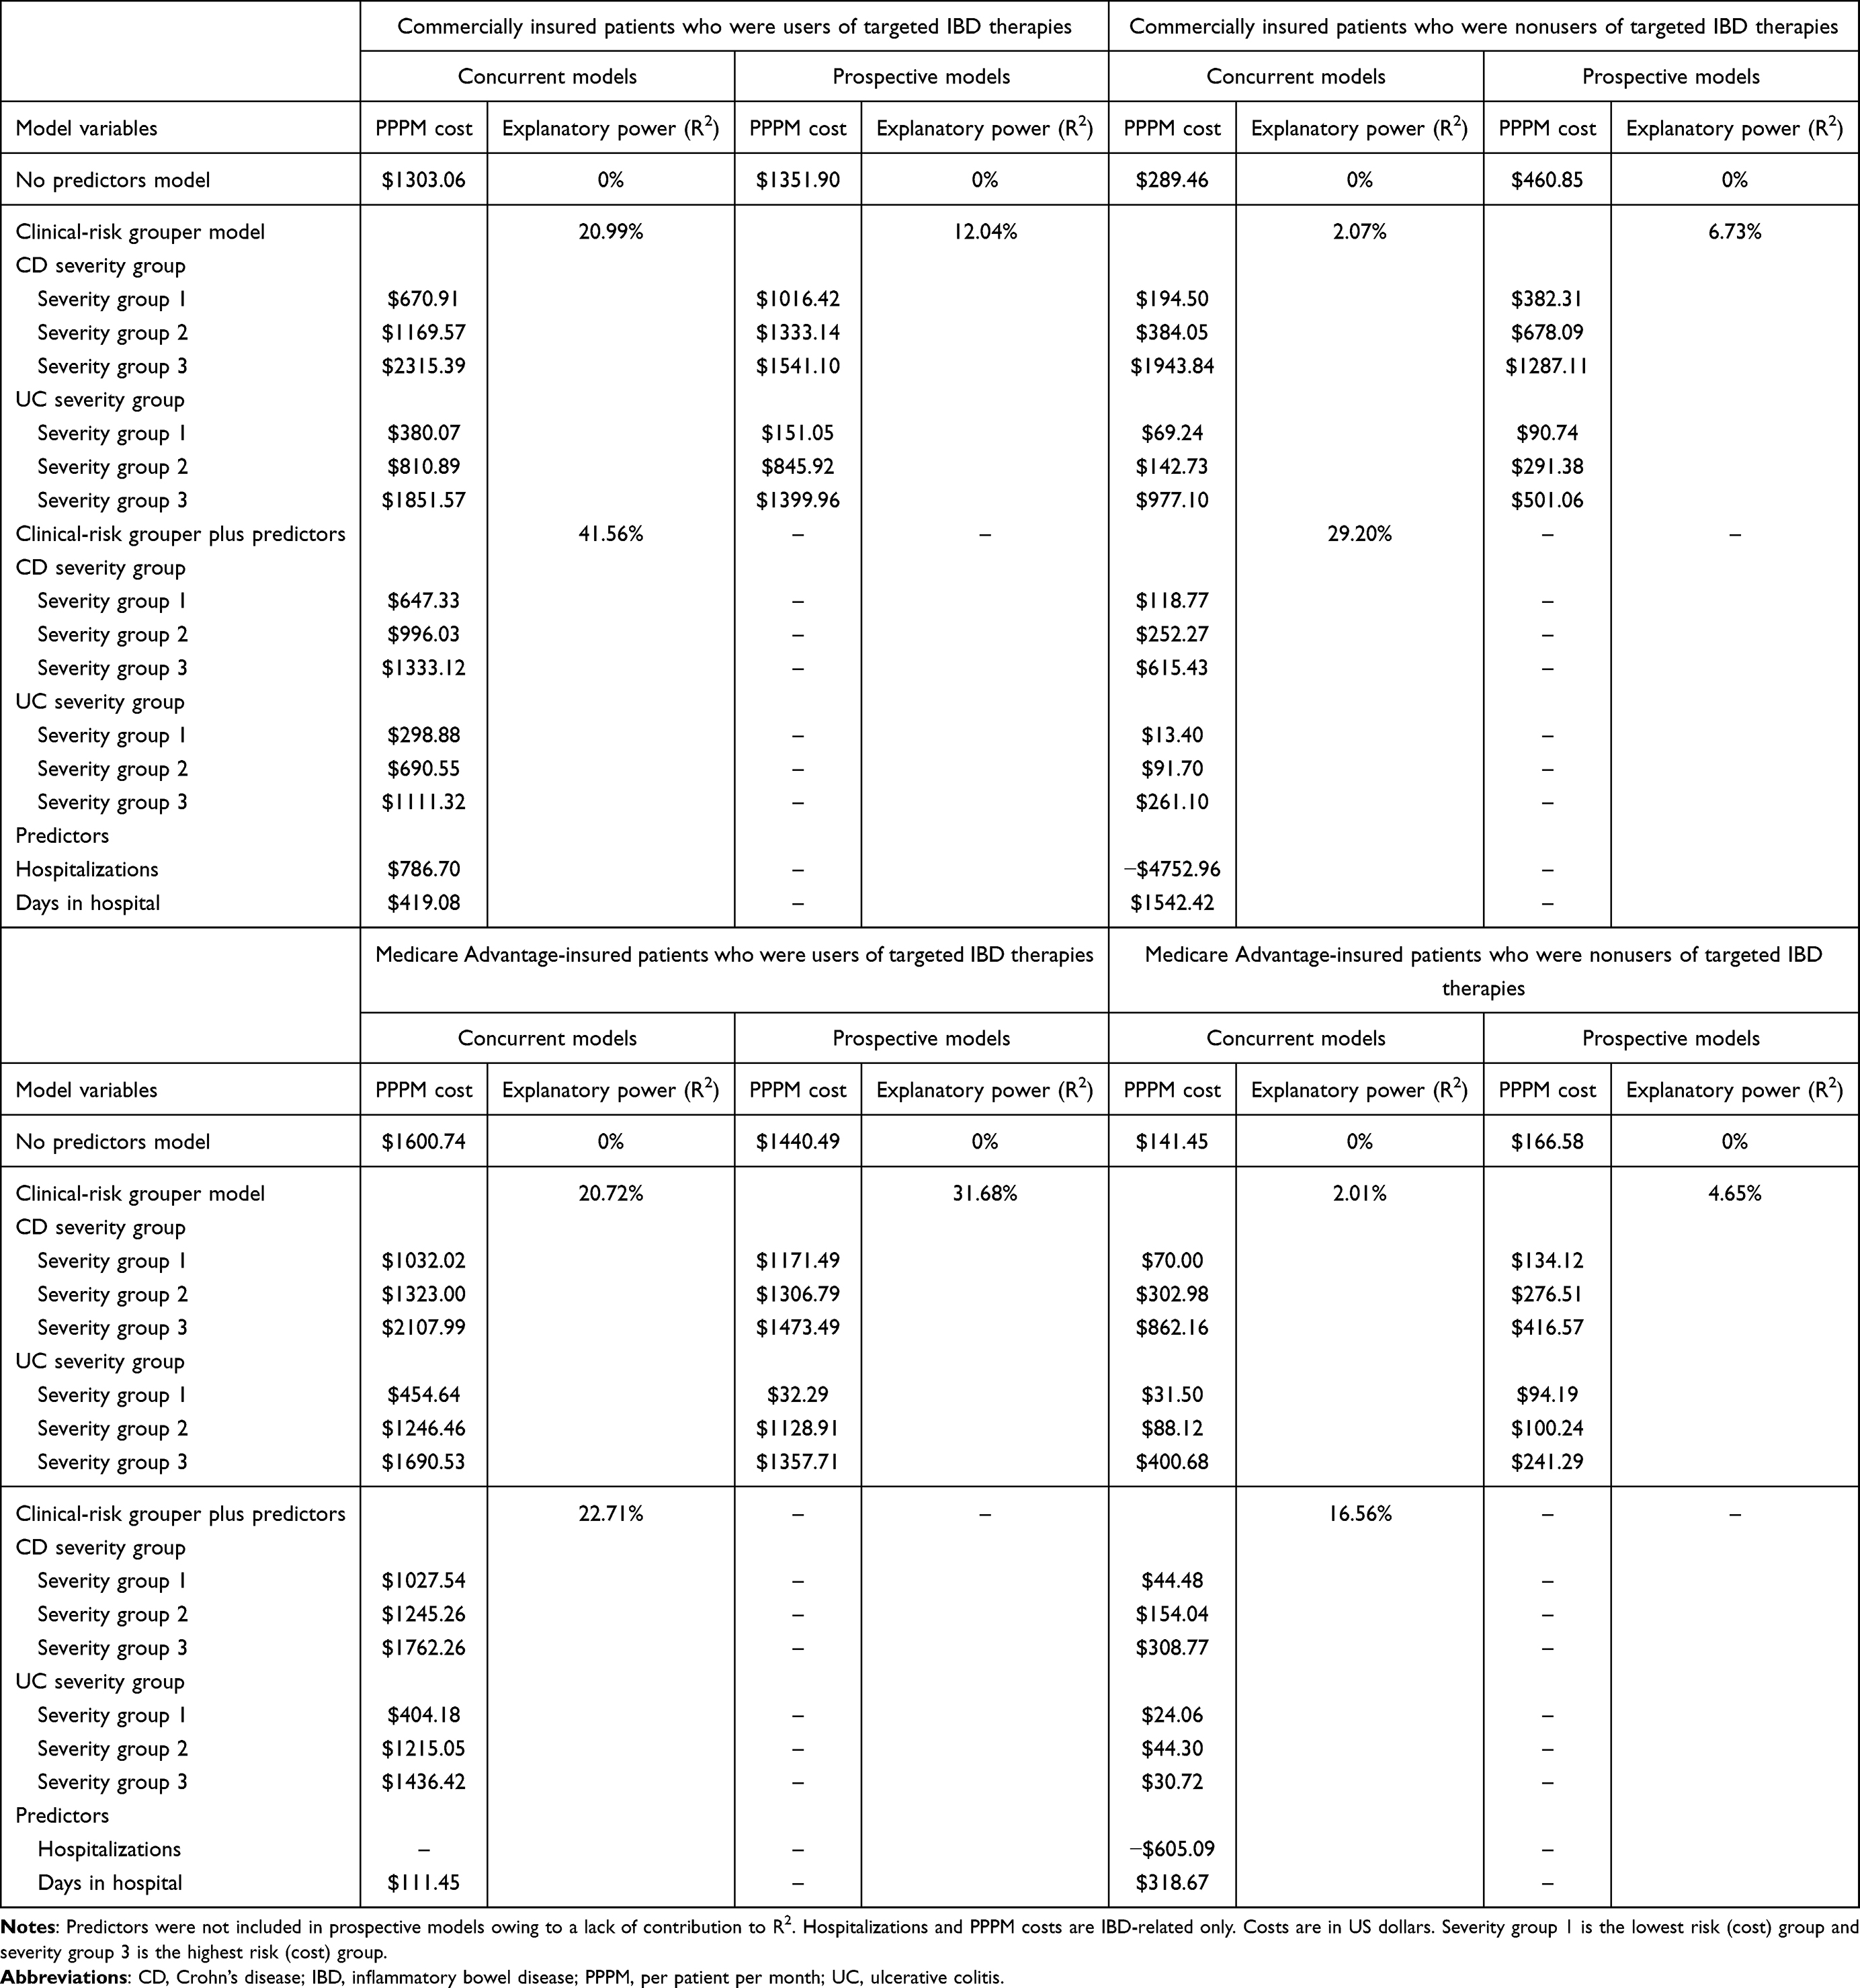 |
Table 3 Performance of Multivariable Concurrent and Prospective Linear Regression Models |
In the prospective models, the clinical-risk grouper explained 12.04% of the variance in costs of patients who were users of targeted IBD therapies and 6.73% of the variance of nonusers. None of the tested predictors improved model explanatory power beyond the variance explained by the clinical-risk grouper.
Model Performance in Medicare Advantage-Insured Patients
In the concurrent models, the clinical-risk grouper explained 20.72% and 2.01% of the variance in costs of patients who were users and nonusers of targeted IBD therapies, respectively (Table 3). Model explanatory power was increased with the inclusion of IBD-related hospitalizations (range, 0–7) and duration of IBD-related hospitalizations (range, 0–84 days) as additional predictors, giving final R2 values of 22.71% and 16.56% in users and nonusers of targeted IBD therapies, respectively. The addition of predictors preserved the clinical-risk grouper rankings in the patients who were users of targeted IBD therapies. In nonusers, expected costs in each severity group were similar and the risk distinction was lost.
In the prospective models, the clinical-risk grouper explained 31.68% of the variance in the outcome in patients who were users of targeted IBD therapies versus 4.65% in nonusers. None of the evaluated predictors improved model performance.
The Influence of Multiple Predictors on R2 in Concurrent Models
As previously described, only IBD-related hospitalizations (number and duration of stays) improved the explanatory power of the concurrent models beyond that of the clinical-risk grouper. Predictors routinely captured in claims databases and often used in risk-adjustment models, such as age, gender, number of IBD flares, IBD-related ER visits, or comorbidities, resulted only in minimal incremental increases in R2 (Figure 1).
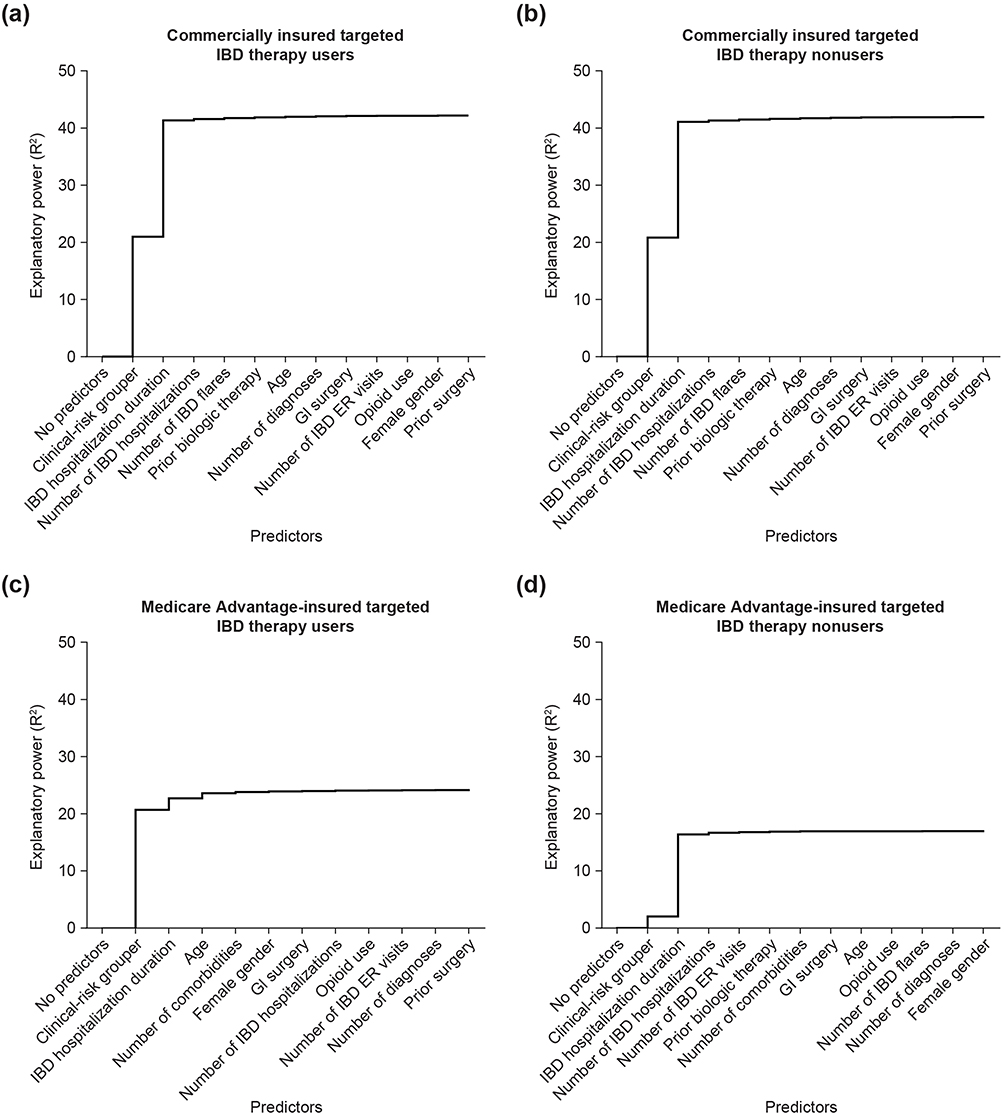 |
Figure 1 The impact of additional predictors on explanatory power (R2) in concurrent models for (a) commercially insured targeted IBD therapy users and (b) nonusers and for (c) Medicare Advantage-insured targeted IBD therapy users and (d) nonusers. The R2 value reported for the clinical-risk grouper predictor is the value for UC severity group 3. The sequence of predictors is based on contribution to R2. Abbreviations: ER, emergency room; GI, gastrointestinal; IBD, inflammatory bowel disease; UC, ulcerative colitis. |
Hypothetical Examples of Cost Prediction
In each model, the β-coefficients for each variable represent the associated PPPM IBD medical costs. These values can be converted into relative weights using the models’ mean overall PPPM cost. The relative weights can then be used to generate risk scores.
To illustrate how the risk scores can be used to risk-adjust costs, we consider two examples (Figure 2). Patient A is a commercially insured patient with a recent claim for CD of the large intestine with rectal bleeding. Patient A is prescribed a targeted IBD therapy and has never had IBD-related surgery. Patient A is assigned to CD severity group 2 based on their diagnosis, the weighting for which is 0.76. The absence of any other relevant risk factors means patient A’s risk-adjusted expected PPPM cost is $990.33, which is 0.76 times the mean overall PPPM costs of $1303.06.
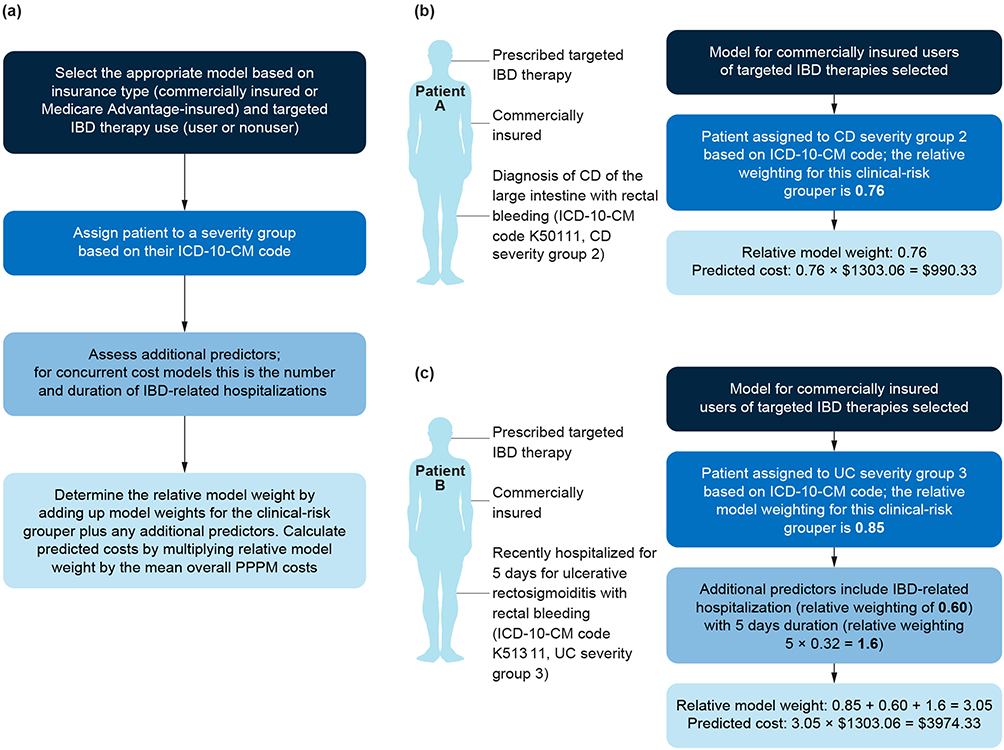 |
Figure 2 Hypothetical examples of cost prediction using the concurrent model for commercially insured targeted IBD therapy users with (a) instructions on how to select the appropriate model, determine the severity group, and calculate predicted costs, and a cost prediction example in (b) a patient with CD and (c) a patient with UC. Abbreviations: CD, Crohn’s disease; IBD, inflammatory bowel disease; ICD-10-CM, International Classification of Diseases, 10th Revision, Clinical Modification; PPPM, per patient per month; UC, ulcerative colitis. Notes: Bold and color formatting are used for emphasis and legibility, respectively. Formatting differences do not indicate significance. |
Patient B has UC and was recently hospitalized for 5 days for ulcerative rectosigmoiditis with rectal bleeding (UC severity group 3, weight 0.85). IBD-related hospitalization carries a weight of 0.60, and a weight of 0.32 is applied for each day spent in hospital. This gives a total risk score of 3.05, equating to expected risk-adjusted costs of $3974.33 (3.05 times the mean of $1303.06).
In the managed care setting, these model weights can be used to determine a patient’s expected costs using only the mean PPPM costs of the plan; no additional modeling is required.
Discussion
Herein, we describe the development of the first concurrent and prospective IBD-specific risk-adjustment models for commercially insured and Medicare Advantage-insured patients with CD and/or UC. Our models, which were developed and tested using the DCG-HCC methods and principles for risk-adjusted capitated payment systems,9–11 explained up to 41.56% of the variance in PPPM IBD-related medical costs, which demonstrates that financial risk can be explained using a simple diagnostic risk grouper. In comparison, the typical explanatory power of non-specific concurrent models ranges from 1.02% to 54.74%.26 Our models performed better in patients who were users of targeted IBD therapies than in nonusers; R2 values ranged from 2.01% to 6.73% for models with clinical-risk groupers alone in nonusers of targeted IBD therapies, suggesting limited predictive value in this population. The reason for this is unclear; however, it is possible that medical costs are more predictable in this population because the disease is controlled by targeted therapies. There may also be differences in healthcare utilization, clinical coding, or care patterns between users and nonusers.
In risk-adjustment models, greater explanatory power is typically observed with concurrent models than with prospective models.10,25 This is generally because major costly medical events are often unpredictable; indeed, prospective risk-adjustment models typically account for only 2–16% of the variance in prospective medical costs.25 However, in the Medicare Advantage-insured population, the clinical-risk grouper alone explained 31.68% of prospective costs in patients using targeted IBD therapies, implying that future medical costs are inherently more predictable in this population. None of the tested predictors improved the explanatory power of prospective models to a greater extent than the clinical-risk grouper alone. Although the incorporation of other clinical variables (eg, from electronic health records) may have further improved predictive power, our goal was to maximize real-world utility by creating parsimonious models using readily available administrative claims data and the fewest possible predictors.
In concurrent models, only the incidence and duration of IBD-related hospitalizations improved model predictive power beyond that of the clinical-risk grouper. The influence of hospitalizations on concurrent costs is to be expected given that the occurrence is a known costly event in the study year. These data suggest that the location and extent of disease that predominantly separate CD- and UC-specific ICD codes is an important determinant of concurrent medical expenditure in people with IBD. Consistent with previous studies, predicted IBD-related medical costs were higher in patients with CD than in patients with UC in all models;8 greater targeted IBD therapy and corticosteroid use, and more commonly experiencing disease flares, IBD-related hospitalization, and undergoing GI surgery, are likely to be contributing factors in the cost difference between patients with CD and UC.
The predictive power of the final concurrent models (ie, clinical-risk grouper plus predictors) were lower for Medicare Advantage-insured patients than for commercially insured patients. We speculate that the lower performance reflects differences in the patient populations (eg, demographics, disease characteristics), patterns of care, benefit design, and potentially coding practices. There also could have been more variability in the Medical Advantage-insured group, which could make prediction more difficult.
To the best of our knowledge, we present the first concurrent and prospective risk-adjustment models specifically developed for patients with IBD. We hope that these models will provide potential opportunities to improve patient care and better allocate health care resources to those in need, for example, by identifying patients who are likely to incur high future medical costs and who may benefit from case management intervention. As the global costs of treating IBD continue to rise, there is increasing interest in determining drivers of cost and ways to deliver affordable care.27 Our models may support these efforts by allowing risk adjustment of cost-based outcomes in real-world IBD studies, and by enabling capitated arrangements to ensure that providers are incentivized to prioritize preventive care.
Limitations
Several limitations should be considered when interpreting the results of this study. First, the study population is limited to commercially and Medicare Advantage-insured patients; the exclusion of other insurance types may affect the generalizability of these findings. As such, we do not advise using this model for other insurance types. We also recommend recalibration before implementation as predictive ability can be influenced by differences across systems. Second, the model is cross-sectional and does not incorporate longitudinal changes in disease severity or time-dependent variables, which could have improved the predictive accuracy of the model. Third, the concurrent models are sensitive to acute care costs and may underestimate the influence of other variables. Fourth, the use of de-identified data from a claims database means that not all relevant clinical information is routinely captured (eg, laboratory test results). Fifth, claims data are primarily collected for billing and administrative purposes, therefore, the accuracy and completeness of clinical information may vary, the allocation of primary and secondary ICD-diagnosis codes may be subject to bias from reimbursement policies, and medical conditions or procedures may be underreported or misclassified. Lastly, the robustness of the model has not been validated in an external data set.
Conclusions
Collectively, these results indicate that diagnosis-based clinical-risk groupers may provide a simple and effective means for estimating concurrent and prospective real-world IBD-related medical costs. Our model was developed using data from commercially insured and Medicare Advantage-insured patients, and demonstrated greater predictive power in users of targeted IBD therapy than in nonusers. The model has potential future utility for risk adjustment of IBD-related cost outcomes in real-world evidence studies, informing patient selection for disease state management programs, and enabling capitated arrangements with provider groups.
Abbreviations
CD, Crohn’s disease; DCG-HCC, Diagnostic Cost Group Hierarchical Condition Category; ER, emergency room; IBD, inflammatory bowel disease; ICD, International Classification of Diseases; ICD-10-CM, International Classification of Diseases, 10th Revision, Clinical Modification; PPPM, per patient per month; UC, ulcerative colitis.
Ethics Approval
All data from individual patients were deidentified and comply with the Health Insurance Portability and Accountability Act; therefore, no review by an institutional review board or informed consent was required per Title 45 of CFR, Part 46.101(b)(4).28
Acknowledgments
Medical writing support was provided by Kayleigh Dodd PhD of PharmaGenesis Cardiff, Cardiff, UK, and funded by Takeda Pharmaceuticals USA, Inc., in accordance with Good Publication Practice (GPP 2022) guidelines (www.ismpp.org/gpp-2022).
Author Contributions
All authors made a significant contribution to the work reported, whether that was in the conception, study design, execution, acquisition of data, analysis, and interpretation, or in all these areas; took part in drafting, revising, or critically reviewing the article; gave final approval of the version to be published; have agreed on the journal to which the article has been submitted; and agree to be accountable for all aspects of the work.
Funding
This study was funded by Takeda Pharmaceuticals USA, Inc.
Disclosure
Kellyn M Moran, Kiraat D Munshi, and Kyle D Null are employees of Takeda Pharmaceuticals USA, Inc. and have stock or stock options. Sarah S Hellems and Ian Smith are employees of Optum Advisory Services. The authors report no other conflicts of interest in this work.
References
1. Lewis JD, Parlett LE, Jonsson Funk ML, et al. Incidence, prevalence, and racial and ethnic distribution of inflammatory bowel disease in the United States. Gastroenterology. 2023;165(5):1197–13. doi:10.1053/j.gastro.2023.07.003
2. Agrawal M, Spencer EA, Colombel JF, Ungaro RC. Approach to the management of recently diagnosed inflammatory bowel disease patients: a user’s guide for adult and pediatric gastroenterologists. Gastroenterology. 2021;161(1):47–65. doi:10.1053/j.gastro.2021.04.063
3. Liverani E, Scaioli E, Digby RJ, Bellanova M, Belluzzi A. How to predict clinical relapse in inflammatory bowel disease patients. World J Gastroenterol. 2016;22(3):1017–1033. doi:10.3748/wjg.v22.i3.1017
4. Limsrivilai J, Stidham RW, Govani SM, Waljee AK, Huang W, Higgins PDR. Factors that predict high health care utilization and costs for patients with inflammatory bowel diseases. Clin Gastroenterol Hepatol. 2017;15(3):385–392. doi:10.1016/j.cgh.2016.09.012
5. Manceur AM, Ding Z, Muser E, et al. Burden of Crohn’s disease in the United States: long-term healthcare and work-loss related costs. J Med Econ. 2020;23(10):1092–1101. doi:10.1080/13696998.2020.1789649
6. Pilon D, Ding Z, Muser E, et al. Long-term direct and indirect costs of ulcerative colitis in a privately-insured United States population. Curr Med Res Opin. 2020;36(8):1285–1294. doi:10.1080/03007995.2020.1771293
7. Park KT, Colletti RB, Rubin DT, Sharma BK, Thompson A, Krueger A. Health insurance paid costs and drivers of costs for patients with Crohn’s disease in the United States. Am J Gastroenterol. 2016;111(1):15–23. doi:10.1038/ajg.2015.207
8. Kappelman MD, Rifas–Shiman SL, Porter CQ, et al. Direct health care costs of Crohn’s disease and ulcerative colitis in US children and adults. Gastroenterology. 2008;135(6):1907–1913. doi:10.1053/j.gastro.2008.09.012
9. Pope GC, Kautter J, Ellis RP, et al. Risk adjustment of Medicare capitation payments using the CMS-HCC model. Health Care Financ Rev. 2004;25(4):119–141.
10. Schone E, Brown R. Risk adjustment: what is the current state of the art and how can it be improved? Princeton, NJ: The Robert Wood Johnson Foundation; 2013. Available from: https://www.physicianprofiling.ch/ProfilingStateAndImprove2013Overview.pdf.
11. Kautter J, Pope GC, Ingber M, et al. The HHS-HCC risk adjustment model for individual and small group markets under the affordable care act. Medicare Medicaid Res Rev. 2014;4(3):mmrr2014–004–03–a03. doi:10.5600/mmrr2014-004-03-a03
12. Nguyen NH, Picetti D, Dulai PS, et al. Machine learning-based prediction models for diagnosis and prognosis in inflammatory bowel diseases: a systematic review. J Crohn’s Colitis. 2022;16(3):398–413. doi:10.1093/ecco-jcc/jjab155
13. Kulkarni C, Liu D, Fardeen T, et al. Artificial intelligence and machine learning technologies in ulcerative colitis. Ther Adv Gastroenterol. 2024;17:17562848241272001. doi:10.1177/17562848241272001
14. Nguyen NH, Patel S, Gabunilas J, et al. Simplified machine learning models can accurately identify high-need high-cost patients with inflammatory bowel disease. Clin Transl Gastroenterol. 2022;13(7):e00507. doi:10.14309/ctg.0000000000000507
15. Meenan RT, Goodman MJ, Fishman PA, Hornbrook MC, O’Keeffe-Rosetti MC, Bachman DJ. Using risk-adjustment models to identify high-cost risks. Med Care. 2003;41(11):1301–1312. doi:10.1097/01.MLR.0000094480.13057.75
16. Pope G, Ellis RP, Ash AS, et al. Diagnostic cost group hierarchical condition category models for medicare risk adjustment (Final report). Health Care Financing Administration; 2000. Available from: https://www.cms.gov/Research-Statistics-Data-and-Systems/Statistics-Trends-and-Reports/Reports/Downloads/Pope_2000_2.pdf.
17. Madden CW, Mackay BP, Skillman SM, Ciol M, Diehr PK. Risk adjusting capitation: applications in employed and disabled populations. Health Care Manag Sci. 2000;3(2):101–109. doi:10.1023/A:1019085122553
18. Manning WG. The logged dependent variable, heteroscedasticity, and the retransformation problem. J Health Econ. 1998;17(3):283–295. doi:10.1016/S0167-6296(98)00025-3
19. Powers CA, Meyer CM, Roebuck MC, Vaziri B. Predictive modeling of total healthcare costs using pharmacy claims data: a comparison of alternative econometric cost modeling techniques. Med Care. 2005;43(11):1065–1072. doi:10.1097/01.mlr.0000182408.54390.00
20. Duncan I. Healthcare Risk Adjustment and Predictive Modeling.
21. Pope GC, Ellis RP, Ash AS, et al. Principal inpatient diagnostic cost group model for medicare risk adjustment. Health Care Financ Rev. 2000;21(3):93–118.
22. Ingber MJ. Implementation of risk adjustment for medicare. Health Care Financ Rev. 2000;21(3):119–126.
23. Robst J, Levy JM, Ingber MJ. Diagnosis-based risk adjustment for medicare prescription drug plan payments. Health Care Financ Rev. 2007;28(4):15–30.
24. Winkelman R, Mehmud S. A comparative analysis of claims-based tools for health risk assessment. Society of Actuaries; 2007. Available from: https://www.soa.org/493888/globalassets/assets/files/research/projects/risk-assessmentc.pdf.
25. Cucciare MA, O’Donohue W. Predicting future healthcare costs: how well does risk-adjustment work? J Health Organ Manag. 2006;20(2–3):150–162. doi:10.1108/14777260610661547
26. Ellis RP, Pope GC, Iezzoni L, et al. Diagnosis-based risk adjustment for medicare capitation payments. Health Care Financ Rev. 1996;17(3):101–128.
27. Burisch J, Zhao M, Odes S, et al. The cost of inflammatory bowel disease in high-income settings: a lancet gastroenterology & hepatology commission. Lancet Gastroenterol Hepatol. 2023;8(5):458–492. doi:10.1016/S2468-1253(23)00003-1
28. Department of Health and Human Services. 45 CFR 46.104 – exempt research. Availabe from: https://www.ecfr.gov/current/title-45/part-46/section-46.104.
 © 2026 Takeda Pharmaceutical Company Limited. This work is published and licensed by Dove Medical Press Limited. The
full terms of this license are available at https://www.dovepress.com/terms
and incorporate the Creative Commons Attribution
- Non Commercial (unported, 4.0) License.
By accessing the work you hereby accept the Terms. Non-commercial uses of the work are permitted
without any further permission from Dove Medical Press Limited, provided the work is properly
attributed. For permission for commercial use of this work, please see paragraphs 4.2 and 5 of our Terms.
© 2026 Takeda Pharmaceutical Company Limited. This work is published and licensed by Dove Medical Press Limited. The
full terms of this license are available at https://www.dovepress.com/terms
and incorporate the Creative Commons Attribution
- Non Commercial (unported, 4.0) License.
By accessing the work you hereby accept the Terms. Non-commercial uses of the work are permitted
without any further permission from Dove Medical Press Limited, provided the work is properly
attributed. For permission for commercial use of this work, please see paragraphs 4.2 and 5 of our Terms.