Back to Journals » Nature and Science of Sleep » Volume 14
Performance of Four Commercial Wearable Sleep-Tracking Devices Tested Under Unrestricted Conditions at Home in Healthy Young Adults
Authors Chinoy ED ![]() , Cuellar JA, Jameson JT, Markwald RR
, Cuellar JA, Jameson JT, Markwald RR ![]()
Received 17 November 2021
Accepted for publication 21 February 2022
Published 22 March 2022 Volume 2022:14 Pages 493—516
DOI https://doi.org/10.2147/NSS.S348795
Checked for plagiarism Yes
Review by Single anonymous peer review
Peer reviewer comments 3
Editor who approved publication: Dr Sarah L Appleton
Evan D Chinoy,1,2 Joseph A Cuellar,1,2 Jason T Jameson,1,2 Rachel R Markwald1
1Sleep, Tactical Efficiency, and Endurance Laboratory, Warfighter Performance Department, Naval Health Research Center, San Diego, CA, USA; 2Leidos, Inc., San Diego, CA, USA
Correspondence: Rachel R Markwald, Sleep, Tactical Efficiency, and Endurance Laboratory, Warfighter Performance Department, Naval Health Research Center, 140 Sylvester Road, San Diego, CA, 92106, USA, Tel +1 619 767 4494, Email [email protected]
Purpose: Commercial wearable sleep-tracking devices are growing in popularity and in recent studies have performed well against gold standard sleep measurement techniques. However, most studies were conducted in controlled laboratory conditions. We therefore aimed to test the performance of devices under naturalistic unrestricted home sleep conditions.
Participants and Methods: Healthy young adults (n = 21; 12 women, 9 men; 29.0 ± 5.0 years, mean ± SD) slept at home under unrestricted conditions for 1 week using a set of commercial wearable sleep-tracking devices and completed daily sleep diaries. Devices included the Fatigue Science Readiband, Fitbit Inspire HR, Oura ring, and Polar Vantage V Titan. Participants also wore a research-grade actigraphy watch (Philips Respironics Actiwatch 2) for comparison. To assess performance, all devices were compared with a high performing mobile sleep electroencephalography headband device (Dreem 2). Analyses included epoch-by-epoch and sleep summary agreement comparisons.
Results: Devices accurately tracked sleep-wake summary metrics (ie, time in bed, total sleep time, sleep efficiency, sleep latency, wake after sleep onset) on most nights but performed best on nights with higher sleep efficiency. Epoch-by-epoch sensitivity (for sleep) and specificity (for wake), respectively, were as follows: Actiwatch (0.95, 0.35), Fatigue Science (0.94, 0.40), Fitbit (0.93, 0.45), Oura (0.94, 0.41), and Polar (0.96, 0.35). Sleep stage-tracking performance was mixed, with high variability.
Conclusion: As in previous studies, all devices were better at detecting sleep than wake, and most devices compared favorably to actigraphy in wake detection. Devices performed best on nights with more consolidated sleep patterns. Unrestricted sleep TIB differences were accurately tracked on most nights. High variability in sleep stage-tracking performance suggests that these devices, in their current form, are still best utilized for tracking sleep-wake outcomes and not sleep stages. Most commercial wearables exhibited promising performance for tracking sleep-wake in real-world conditions, further supporting their consideration as an alternative to actigraphy.
Keywords: validation, actigraphy, mobile EEG, consumer sleep technologies, habitual sleep
Introduction
Over the past decade, commercial sleep-tracking devices have become increasingly advanced in their technology and ubiquitous in their use across the population. Millions of new devices are sold each year, and estimates indicate that demand is increasing as the consumer sleep technology market grows rapidly into the billions of dollars.1 Beyond individual consumers, the sleep field has taken much interest in sleep-tracking technologies due to their potential for offering a relatively low-burden, low-cost, and reliable real-time sleep-tracking capability compared with standard sleep measurement techniques like polysomnography (PSG) and actigraphy. Major professional societies such as the American Academy of Sleep Medicine and Sleep Research Society have taken much interest in shaping the conversation around the present and future of sleep-tracking technologies – eg, how to evaluate device performance,2 and determining guidelines for whether to potentially use data from commercial sleep-tracking technologies in clinical sleep medicine practice.3,4 Encouragingly, many recent primary studies5–14 and reviews2,15–18 evaluating the performance of the newest commercial devices have demonstrated their improved sleep-tracking performance against many of the earliest device models released on the consumer market ~5-10 years ago.19–22 Several studies have even found that, compared with the gold-standard PSG, some commercial devices perform as well as or better than the current standard mobile sleep measurement methodology of research-grade actigraphy.6,7,10,11,13
Devices worn on the wrist (as a watch) or on the finger (as a ring) are some of the most popular types of wearables, as they offer the ability to track behavioral and physiological data from a convenient and comfortable location with virtually no requirements for prior training, time for setup, or need for manual input (ie, most devices track sleep automatically and passively and can be continuously used over several nights on a single battery charge).23–25 Although many popular sleep-tracking devices have been subjected to initial performance evaluations by researchers, the pace of such research lags behind the more rapid release of new device models onto the market each year. Thus, with the increasing demands from consumers and sleep researchers and clinicians for an accurate sleep-tracking capability, additional studies are needed to evaluate which wearable device models are best and what level of reliability to expect from their performance.24
Most device performance studies have been limited to healthy participants in controlled environments (eg, sleep lab) under fixed time in bed (TIB) conditions. Those types of studies are a necessary first step in the recommended device validation testing process.2,26–28 The next stage of testing is to confirm that the findings obtained under ideal conditions will generalize to the real-world conditions in which those devices are most often used. To this end, we aimed to evaluate the sleep-tracking validation performance of four commercial wearable devices under unrestricted home sleep conditions in healthy young adults.
Participants and Methods
Participants
A total of 21 healthy young adults (12 women, 9 men; 29.0 ± 5.0 years, mean ± SD) participated. Screening consisted of a self-report medical history questionnaire that assessed the following exclusion criteria: age <18 or >40 years, body mass index <18.5 or ≥30.0 kg/m2 (25.2 ± 2.9, mean ± SD), any diagnosed sleep, mental health, or other medical disorder, use of any illegal drugs or sleep medications (over-the-counter or prescription) in the previous month, current pregnancy, any physical or living condition affecting the ability to sleep uninterrupted, and any night shift work or travel >1 time zone within the previous two weeks.
The study protocol was approved by the Naval Health Research Center Institutional Review Board and was conducted in accordance with the Declaration of Helsinki. Participants provided informed consent prior to the study and were compensated with gift cards.
Study Protocol
Participants slept at home with a set of commercial sleep-tracking devices for 1 week. Sleep schedules were unrestricted (ie, participants could self-select to sleep at any time and duration over the study week). Though daytime sleep episodes and naps were allowed under these criteria, according to the sleep diaries and device data no participants chose to nap or sleep during the daytime. Thus, all sleep episodes evaluated in this study occurred at night. All devices were worn simultaneously during all sleep episodes. Within one hour after waking up, participants reported their bed and wake times using a digital sleep diary (based on the consensus sleep diary29) programmed on the data capture and management system app Smartabase (Fusion Sport; Milton, QLD, Australia) using a tablet computer (iPad; Apple Inc.; Cupertino, CA, USA). When not sleeping, participants were required to wear the set of devices as much as possible but could take devices off if needed at specified times, such as when needing to charge the device battery, when device(s) would interfere with their work duties, or while showering or engaged in other activities where devices could be submerged or damaged. Participants were instructed to report these device removal times using the Smartabase app.
Participants were allowed to engage in their habitual behaviors during the study week, including exercise and caffeine intake, and were required to report on these behaviors daily by using the Smartabase app. However, alcohol intake was not allowed during the study week. Researchers completed daily compliance checks online with the Smartabase app to ensure that participants were syncing the devices and that they completed their sleep diaries and other logs daily.
Commercial Sleep-Tracking Devices Tested
Four commercial sleep-tracking wearable devices were tested in the study: Fatigue Science Readiband (version 5; Fatigue Science; Vancouver, BC, Canada), Fitbit Inspire HR (Fitbit, Inc.; San Francisco, CA, USA), Oura ring (2nd generation; ŌURA Health Oy; Oulu, Finland), and Polar Vantage V Titan (Polar Electro Oy; Kempele, Finland). On the first study day, researchers confirmed that all devices could be worn comfortably and in accordance with each device’s instructions. The four wrist devices (including the actigraphy watch, described below) were worn in pairs on each wrist. The actigraphy watch and Polar Vantage V Titan were worn as a pair on one wrist (with the Polar always worn most proximal to the wrist), and the Fatigue Science Readiband and Fitbit Inspire HR were worn as a pair on the other wrist (with the Fitbit always worn most proximal to the wrist). Wrist placement for each pair of devices was counterbalanced between participants, with half assigned to wear each pair on either their dominant or non-dominant wrist at the beginning of the study. During the middle of the study (after the fourth study night), participants were instructed to switch the device pairs to the other wrist, thus allowing an approximately equal number of assessment nights for either the dominant or non-dominant wrist. Participants wore the Oura ring on their non-dominant ring finger during the entire study week. See Supplementary Materials for details on the device software and firmware versions.
Participants were instructed to sync the data from all commercial devices using their respective apps on the tablet each day, within an hour of waking up. All commercial devices tested had photoplethysmography (PPG) heart rate sensors except the Fatigue Science Readiband. Thus, in addition to the standard sleep-wake outputs, the sleep algorithms for the three devices with PPG heart rate sensors (Fitbit Inspire HR, Oura ring, and Polar Vantage V Titan) also included outputs for individual sleep stage classifications of light, deep, and rapid eye movement (REM) sleep.
Comparison Standard Sleep Methodologies
Actigraphy
To assess sleep-wake data with actigraphy, participants wore the Actiwatch 2 (Philips Respironics, Inc.; Murrysville, PA, USA), a research-grade wrist actigraphy watch device (hereafter referred to as “Actiwatch”). Like the commercial devices, participants wore the Actiwatch during all sleep episodes and during as much of their waking hours as possible. Actiwatch sleep and wake data were analyzed in 30-sec epochs using the medium sensitivity threshold with the software package Actiware (version 6.0.9; Philips Respironics, Inc.; Murrysville, PA, USA). The medium sensitivity threshold is recommended for actigraphy analysis with healthy young adults; therefore, the medium threshold results are the primary Actiwatch results presented in the main text. For comparison, Actiwatch results were also analyzed using the low and high sensitivity threshold settings in Actiware and are presented in the Supplemental Materials. The Actiwatch data were post-processed to analyze each sleep episode using the bed and wake times reported in the participants’ daily sleep diaries.
Mobile EEG Headband
The Dreem 2 (research version; Dreem; Paris, France), a high-performing wireless multi-channel dry mobile sleep electroencephalography (EEG) headband,30 was used as the primary reference standard of comparison to actigraphy and the commercial devices on sleep-wake and sleep stage outcomes (hereafter referred to as “Dreem”). In a performance validation study conducted by the company,30 Dreem was evaluated against PSG in a sample of healthy adults using the consensus scoring of 5 certified and experienced PSG scorers. Dreem was found to have high concordance for raw signal feature detection and relative EEG spectral band power with PSG, as well as low mean biases on sleep-wake summary outcomes, 83.5% overall scoring accuracy with PSG across 5 stages (ie, all sleep stages and wake), and 74.0% accuracy with PSG for wake epochs alone (ie, specificity). Comparatively, the consensus PSG scoring accuracy between the 5 scorers was 86.4% for 5-stage scoring and 82.5% for wake epochs; thus, the level of performance achieved with the Dreem compared with PSG was only slightly below the agreement among the experienced PSG scorers. Based on its demonstrated high performance with a similar demographic of healthy adults and its beneficial features for multi-night home sleep monitoring (eg, good comfort, ease of use, and ability to remotely export data each day), we determined that Dreem was a practical and appropriate alternative to PSG for use in the current multi-night home sleep study as the reference standard method for sleep scoring classification.
Dreem data were collected in 30-sec epochs from the Dreem app’s sleep scoring algorithm. The Dreem provides sleep stage scores of N1, N2, N3, and REM. For standardization of the non-REM stages to the commercial device stage classifications, N1 and N2 from Dreem were combined to form the light sleep stage and N3 was classified as deep sleep. For each sleep episode, participants were instructed to: (1) put on the Dreem headband a few minutes before getting into bed; (2) carry out the required calibration procedures and impedance check for signal quality using the Dreem app on the tablet; and (3) initiate the sleep episode recording manually, using the app at their self-selected bedtime. Participants were instructed to start the recording only at the top of a new clock minute (ie, zero seconds after the minute using the tablet’s clock for reference). After their final awakening in the morning, participants removed the Dreem headband and wirelessly synced the data with the app on the tablet. Unlike the Actiwatch and the commercial devices being tested, the Dreem was only worn during sleep episodes, and the participants were instructed to charge the headband’s battery between nights.
Device Data Export Procedures
Device data were exported from online portals set up by the device companies for researchers to manage participant accounts: Readi for the Fatigue Science Readiband, Oura Teams for the Oura ring, and Polar AccessLink API for the Polar Vantage V Titan. Fitbit, Inc. does not directly provide device data exports to researchers via the standard app or website accounts, therefore Fitbit Inspire HR data were exported via Fitabase (Small Steps Labs, LLC; San Diego, CA, USA), a licensed third-party data management platform.
Missing Data Procedures
All participants completed the 7 data collection nights, except for one who withdrew for a personal reason after completing 6 nights in the study. Therefore, across the 21 participants there were collectively 146 potential nights of sleep data. However, occasional issues occurred that affected the total amount of data included in the analyses.
For the commercial devices, the number and percentage of nights from each device that had no recorded sleep episode data were as follows: Fatigue Science Readiband (1, 0.7%), Fitbit Inspire HR (0, 0.0%), Oura ring (3, 2.1%), and Polar Vantage V Titan (5, 3.4%). Additionally, a few nights recorded by the Fitbit and Polar devices (12 and 11 nights [8.2% and 7.8%], respectively) had poor signal quality (likely from the PPG heart rate sensor) which caused those devices to revert to their binary sleep-wake algorithms instead of the current multi-sensor algorithms that output sleep stages. Those nights were removed from the final analyses of each device for the sleep-wake and sleep stage outcomes.
The Actiwatch recorded continuously over the study week, so all nights had usable sleep-wake Actiwatch data for analysis. The Dreem recordings were manually started and stopped by the participants on the Dreem app each night. Thus, a few issues occurred that caused missing Dreem data for the whole night or part of the night. In some cases, a night of data was not recorded or saved because of a malfunction with the Dreem headband or app, or due to participant user error (10 nights, 6.8%). In other cases, the headband EEG leads may have been accidentally displaced from shifting during part of the night and may have produced a poor quality signal, which caused the Dreem algorithm to score some epochs during the TIB as movement time (MT) (30 nights, 22.1%). When a night contained a total of >10 min scored as MT, the Dreem data for that night were removed from the final sleep summary analyses (20 nights, 14.7%). An additional 4 nights (2.9%) were excluded due to participant user or reporting errors resulting in the reported sleep diary TIB being >10 min longer than the Dreem recording duration.
Sleep summary data were included in the final analyses only when, according to the criteria listed above, there was a complete pair of usable data on the same night from both the device and the Dreem. Likewise, epoch-by-epoch (EBE) data were analyzed for only the included nights over the time-aligned epochs for the device and Dreem, and when they both had valid scores (eg, not an epoch of MT from the Dreem). If a device recorded sleep data outside the sleep diary’s TIB on a given night, the Dreem was not recording during those times and thus those device epochs did not contribute to the EBE analyses. Likewise, if a device started recording after the Dreem was started at bedtime (or if the device recording ended before the Dreem was ended at wake time), only the epochs while both the device and Dreem were concurrently being recorded were utilized for the EBE analyses. Epochs from each device and the Dreem were aligned by clock time according to the closest temporal alignment.
Statistical Analysis
Statistical outcomes followed the recommended standards for sleep-tracking device evaluation2 and were based on the open source R code of Menghini et al,28 with some minor customizations. The sample sizes for the sleep summary and EBE analyses were dictated by the availability of valid pairs of data between each device and reference. The final sleep summary sample sizes are shown in the respective tables for each outcome, and the total EBE sample sizes are shown in the EBE contingency tables (Table S1) in the Supplementary Materials.
The following sleep summary measures were calculated for the reference (Dreem or sleep diary), the Actiwatch, and each commercial device on each night: TIB (the total duration of a recorded sleep episode), total sleep time (TST; total duration of all sleep), sleep efficiency (SE; percentage of TST over the TIB), sleep onset latency (SOL; time taken to initially fall asleep), and wake after sleep onset (WASO; time awake in each sleep episode occurring after SOL). For the three devices that classify sleep stages, the total duration of light, deep, and REM sleep stages on each night were also compared with the Dreem. Summary sleep-wake and sleep stage data were taken from each device’s summary data export files; however, the Fitbit Inspire HR and Polar Vantage V Titan did not differentiate their wake output between that at the beginning versus middle of the night, therefore SOL and WASO for those two devices were calculated from the EBE data exports instead. TIB for the Actiwatch was set to the TIB reported in the sleep diary. Therefore, the Actiwatch TIB did not vary from the Dreem TIB and was not included in the TIB analyses.
For the sleep summary outcomes, Bland-Altman plots31 were generated to visualize discrepancies between the commercial devices and the reference (Dreem or sleep diary). In the Bland-Altman plots, differences in measurement were plotted against the mean of the two devices, along with reference lines that displayed the bias (the average difference between the device and reference) and the upper and lower 95% limits of agreement (two standard deviations from the bias). The plots, based on the Menghini et al28 framework, also permitted the visualization of proportional bias (ie, non-zero slope of the bias line, tested using linear regression methods that model the relationship between discrepancy size and mean measurement magnitude) and heteroscedasticity (ie, changes in variability across the measurement scale, tested using linear regression methods that model the standard deviation of the differences in terms of mean measurement size).28,32 P-values were considered statistically significant for p<0.05.
The following EBE agreement statistics were calculated for the analysis of all sleep versus wake epochs for each device and the Actiwatch on each night, in comparison to the temporally-aligned epochs as scored by Dreem: sensitivity (true positive rate; the proportion of Dreem sleep epochs that were correctly detected as sleep by the device), specificity (true negative rate; the proportion of Dreem wake epochs that were correctly detected as wake by the device), positive predictive value (PPV; proportion of device-scored sleep epochs that were Dreem-scored sleep), negative predictive value (NPV; proportion of device-scored wake epochs that were Dreem-scored wake), accuracy (proportion of all device sleep and wake epochs correctly detected as Dreem-scored sleep or wake), and the prevalence and bias adjusted kappa (PABAK; Cohen’s kappa weighted to account for the amount of inequality between the number of sleep and wake epochs). For the three devices that classify sleep stages, the EBE agreement statistics were also calculated for each stage versus the combination of all other classifications (eg, EBE agreement for light sleep was calculated as the light sleep epochs versus the combination of all wake, deep, and REM epochs, etc.). Because there are multiple classification possibilities with sleep stage analysis, the proportions of misclassification were also determined for each stage (eg, how often Dreem light sleep epochs were misclassified by a device as deep sleep, etc.). EBE results are presented in two ways: (1) all epochs, combining all individual epochs across all participants and nights, and (2) between nights, whereby EBE metrics were calculated for each night and then averaged across all nights (irrespective of participant).
Epoch durations for each device were either 30 or 60 sec. The Actiwatch, Fitbit Inspire HR, and Oura ring output sleep data in 30-sec epochs, which were directly matched with the Dreem which also outputs sleep data in 30-sec epochs. The Fatigue Science Readiband and Polar Vantage V Titan output sleep data in 60-sec epochs, which were divided into two 30-sec epochs and temporally aligned with the closest recorded Dreem epochs.
All preprocessing and statistical output were generated using the computing language R, version 4.0.5 (R Foundation, Vienna, Austria).
Results
Sleep-Wake Summary Agreement
Sleep-wake summary results are shown in Table 1 and corresponding Bland-Altman plots in Figures 1–5. Expanded sleep-wake summary results are presented in Supplementary Table S2.
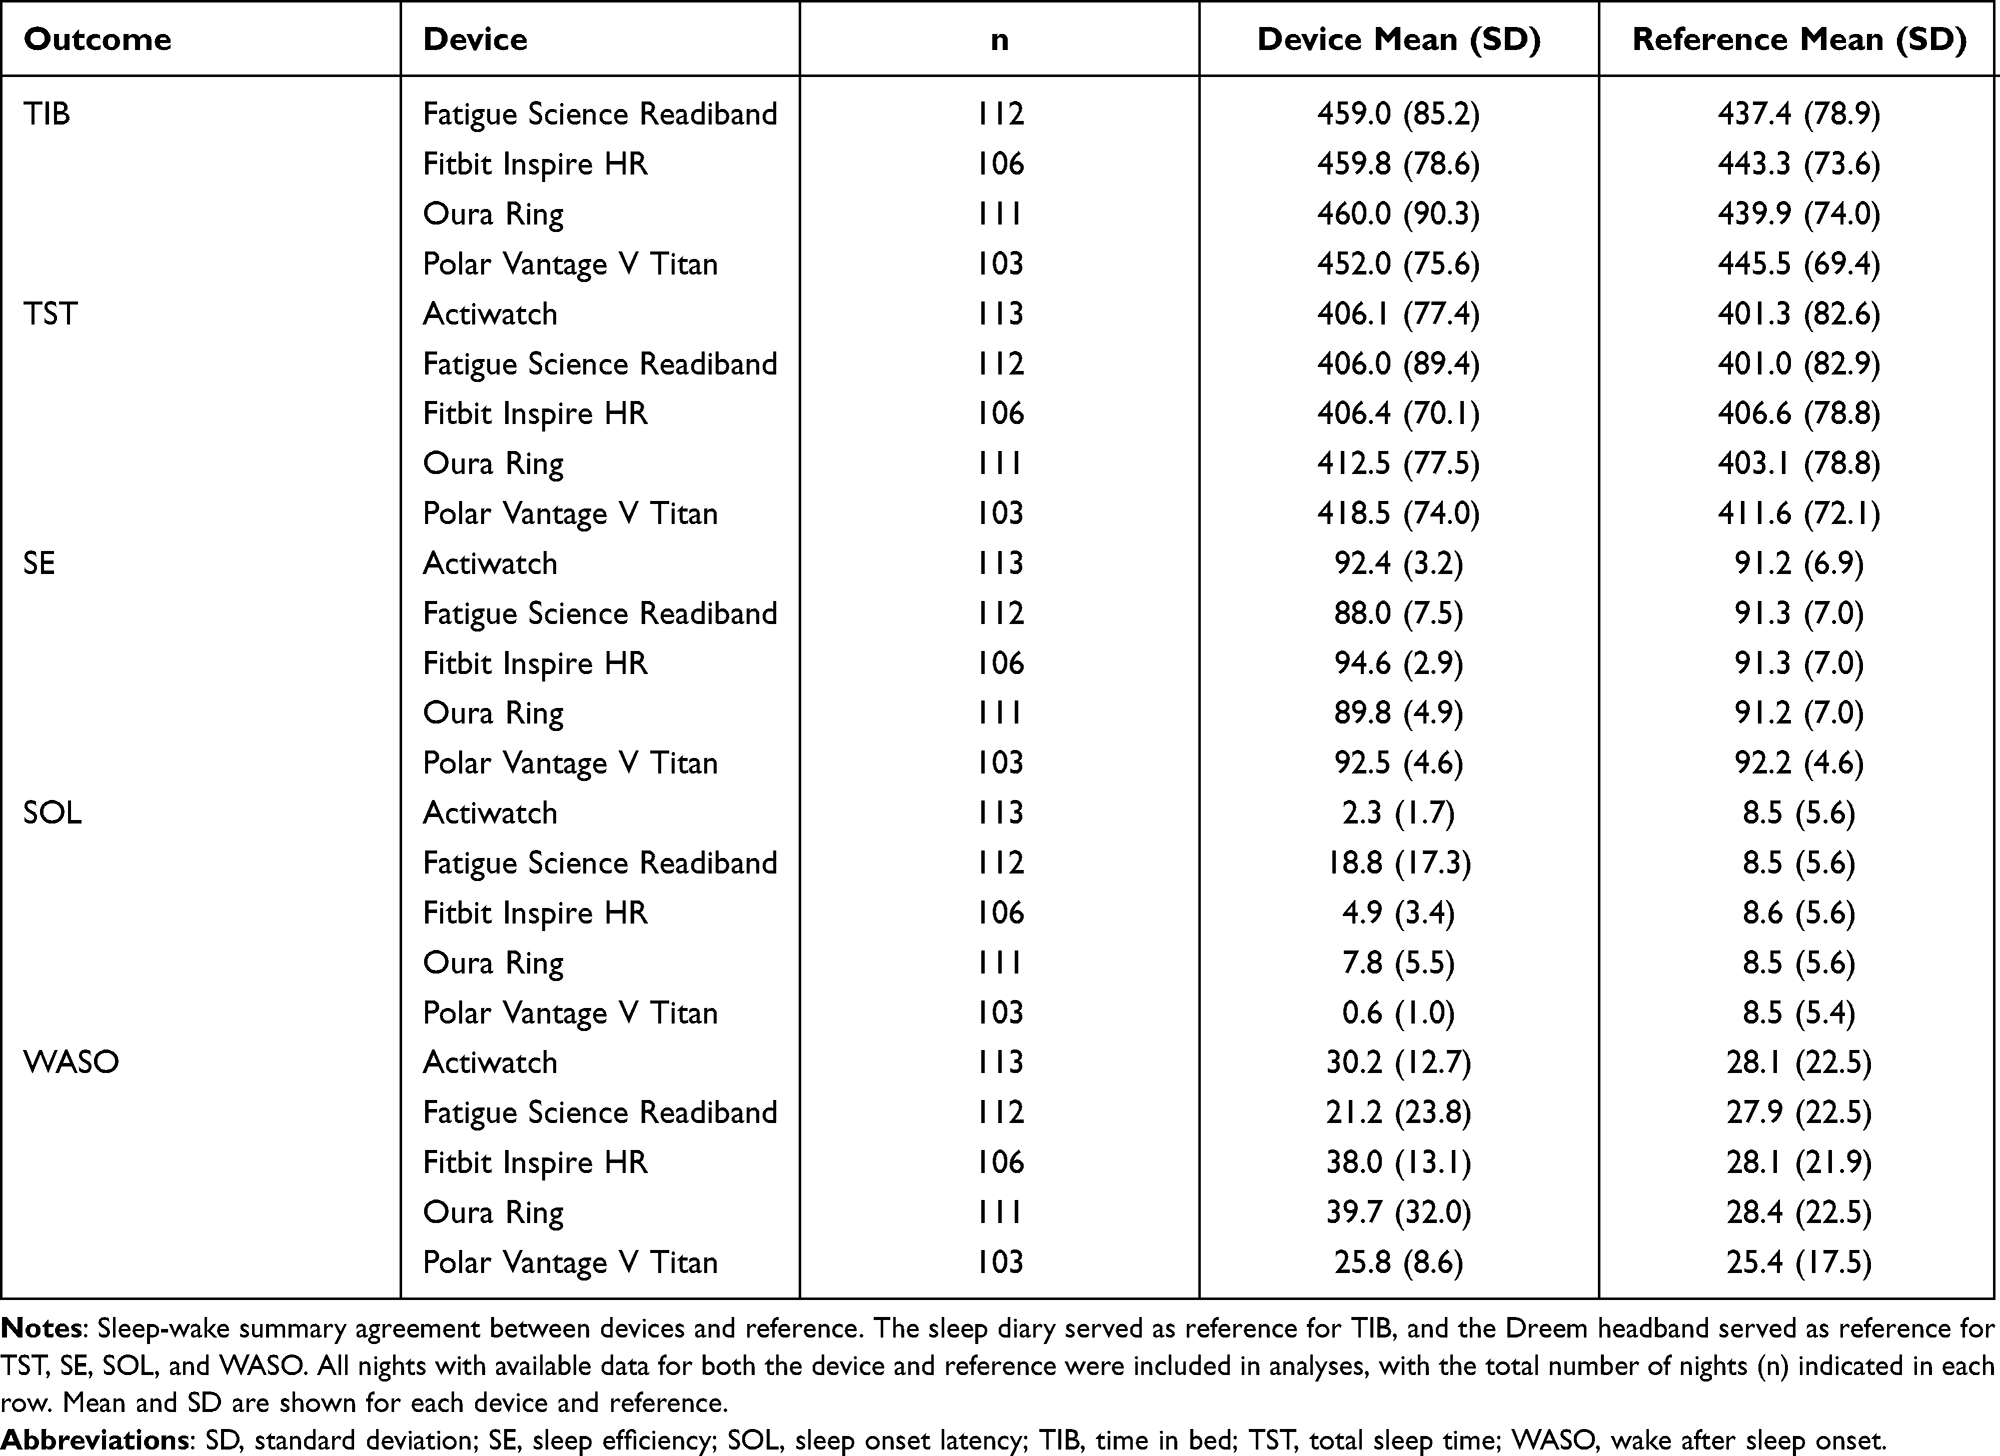 |
Table 1 Sleep-Wake Summary Agreement |
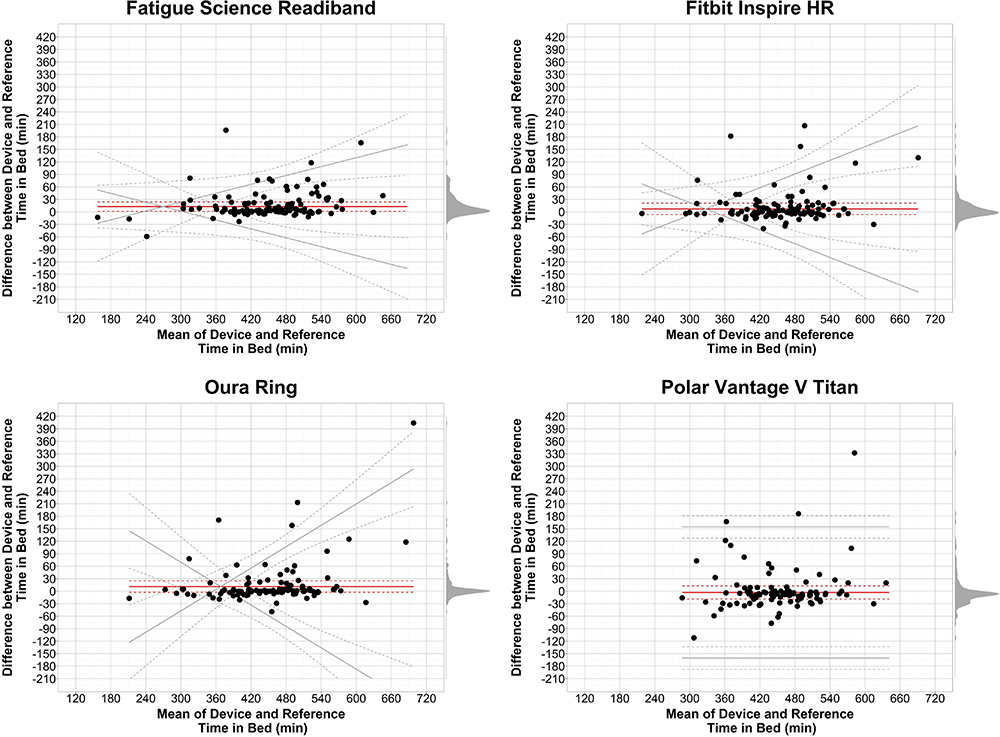 |
Figure 1 Bland-Altman plots: TIB. Abbreviation: TIB, time in bed. Notes: Plots depict the mean bias (solid red line) and upper and lower limits of agreement (solid gray lines) for deviation in TIB for the devices compared with the reference sleep diary. Black circles are individual nights. Dashed lines represent the 95% confidence intervals around the bias and limits of agreement lines. Gray shaded regions on the right y-axis are density plots showing the distribution of individual night biases. Zero on the y-axis represents no difference, with positive and negative y-axis values indicating an overestimation or underestimation, respectively, compared with the reference. Diagonal mean bias lines indicate significant proportional bias. Non-parallel limits of agreement lines indicate significant heteroscedasticity. |
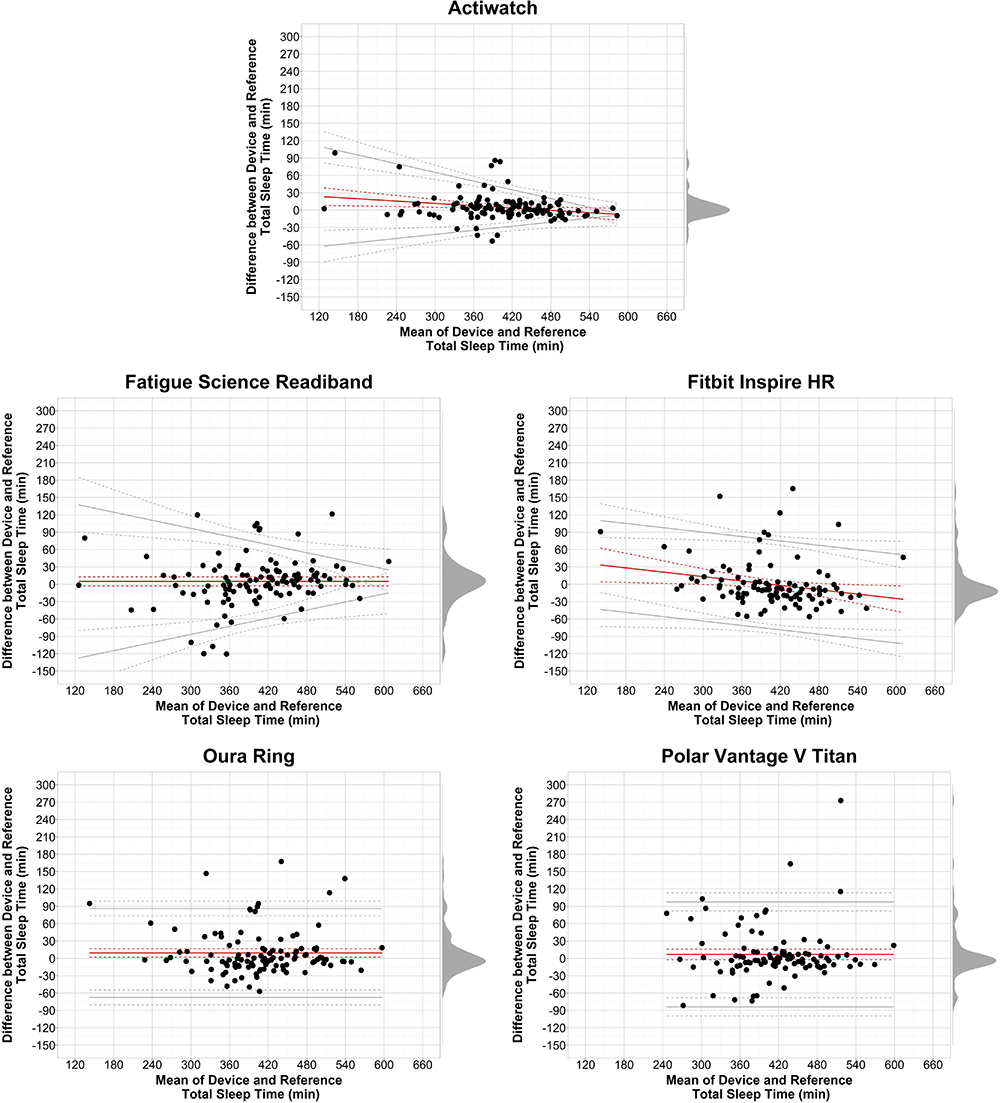 |
Figure 2 Bland-Altman plots: TST. Abbreviation: TST, total sleep time. Notes: Plots depict the mean bias (solid red line) and upper and lower limits of agreement (solid gray lines) for minutes of TST for the devices compared with the reference Dreem headband. See Figure 1 notes for additional figure details. |
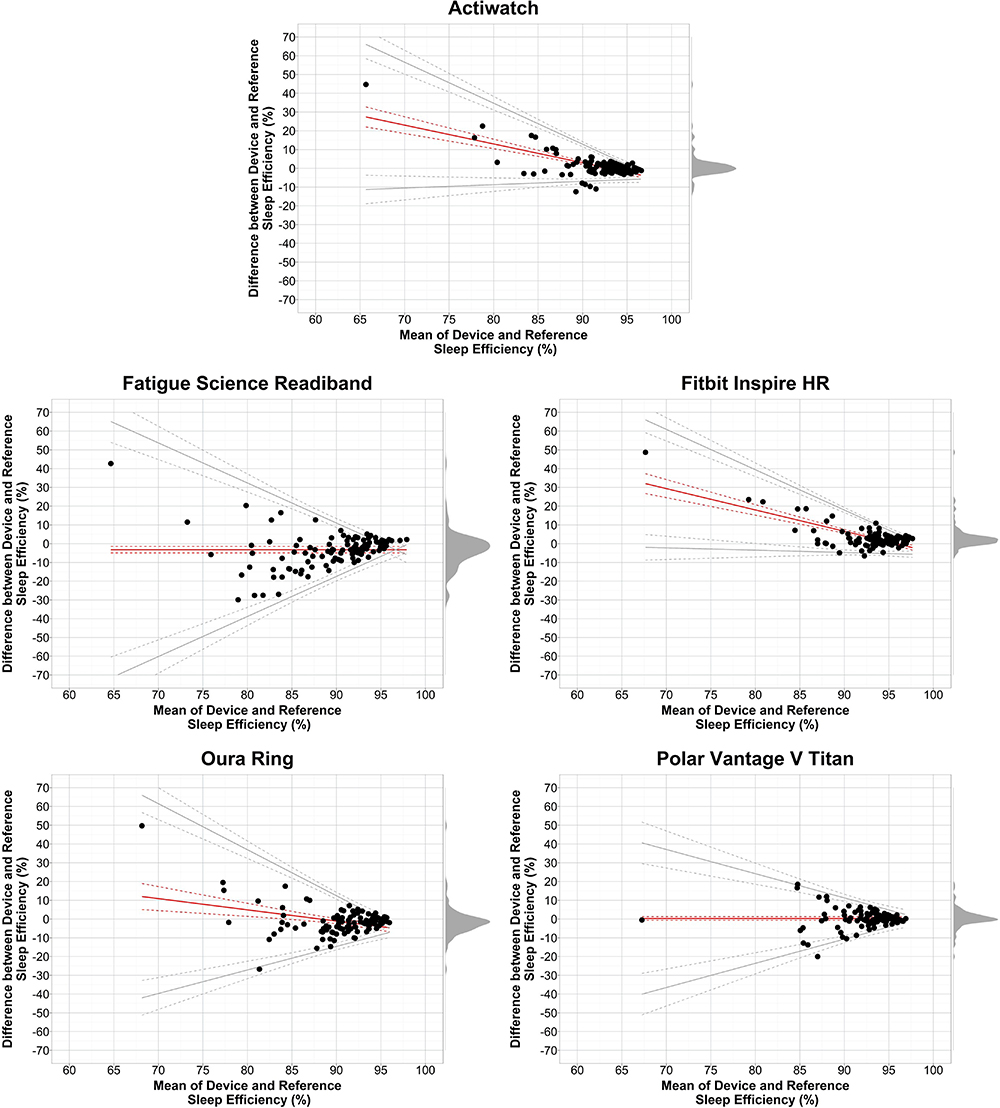 |
Figure 3 Bland-Altman plots: SE. Abbreviation: SE, sleep efficiency. Notes: Plots depict the mean bias (solid red line) and upper and lower limits of agreement (solid gray lines) for percentage of SE for the devices compared with the reference Dreem headband. See Figure 1 notes for additional figure details. |
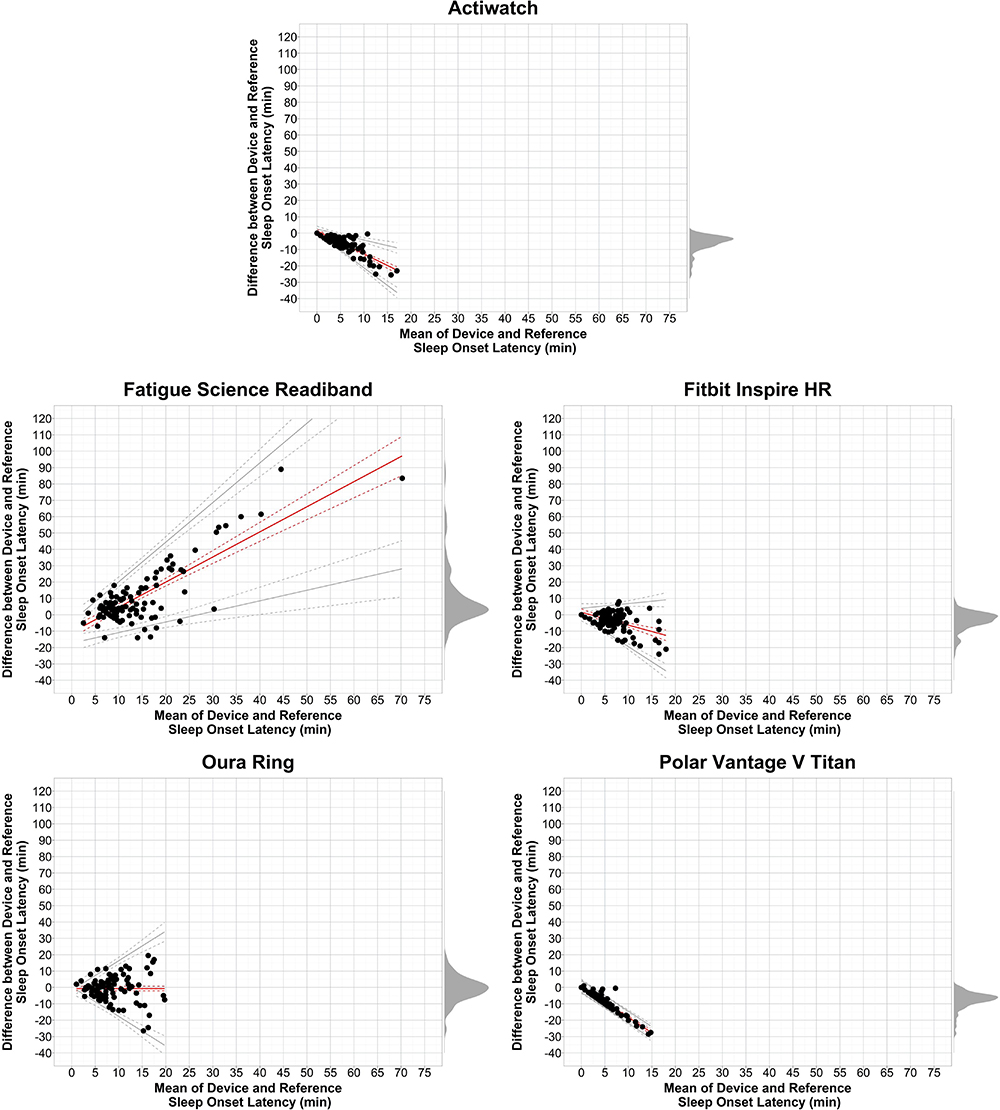 |
Figure 4 Bland-Altman plots: SOL. Abbreviation: SOL, sleep onset latency. Notes: Plots depict the mean bias (solid red line) and upper and lower limits of agreement (solid gray lines) for minutes of SOL for the devices compared with the reference Dreem headband. See Figure 1 notes for additional figure details. |
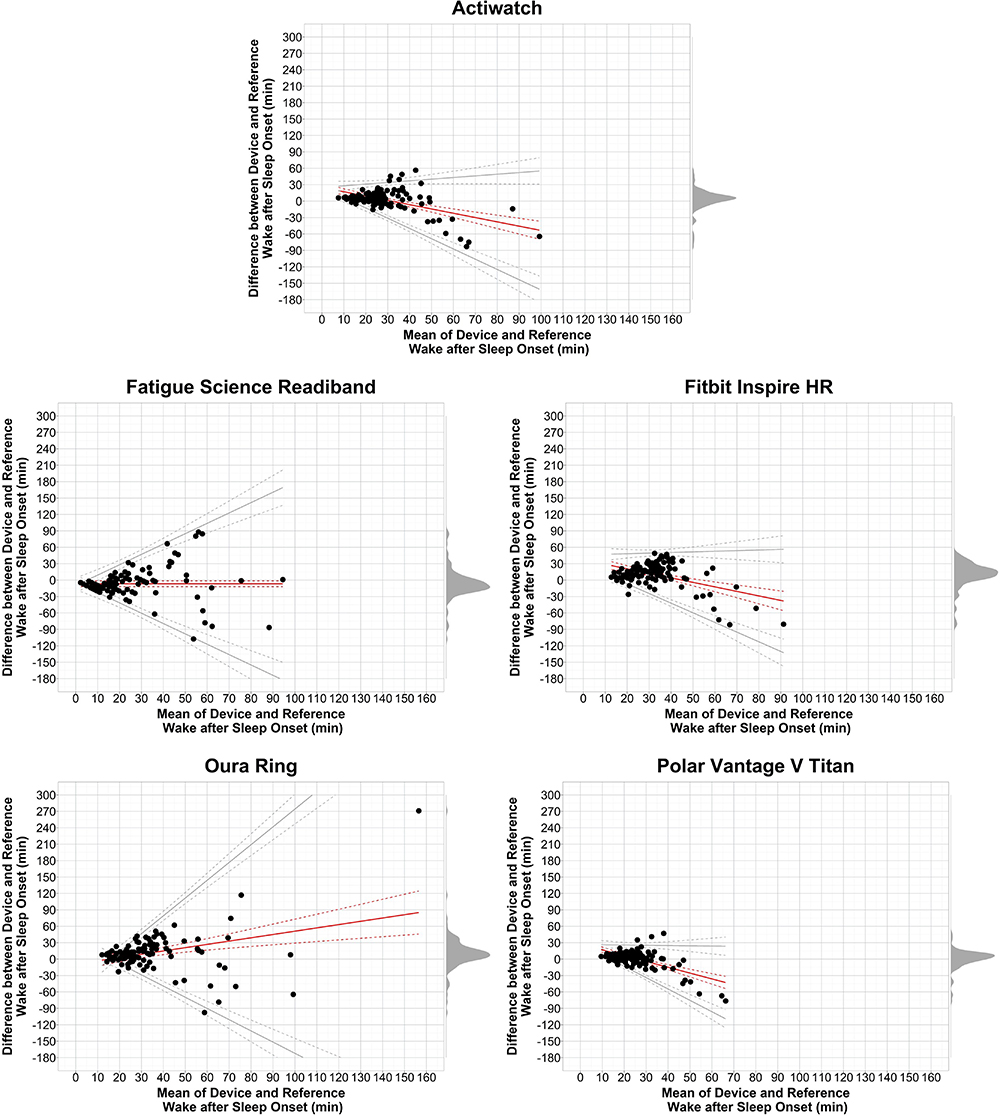 |
Figure 5 Bland-Altman plots: WASO. Abbreviation: WASO, wake after sleep onset. Notes: Plots depict the mean bias (solid red line) and upper and lower limits of agreement (solid gray lines) for minutes of WASO for the devices compared with the reference Dreem headband. See Figure 1 notes for additional figure details. |
For TIB (Table 1 and Figure 1), most nights for each device clustered around the mean bias line, which itself deviated little from 0. However, in each device, a small subset of nights exhibited biases larger than an hour. Mean biases were all low, near zero, and no devices exhibited proportional bias.
TST mean biases for the Actiwatch and all commercial devices were close to the Dreem-determined TST as indicated in Table 1 and Figure 2, with the majority of individual nights showing low bias (eg, <30 min) although some nights had larger biases. The individual night data indicate that no device had consistent under or over-estimation biases in TST, though the Actiwatch and Fitbit Inspire HR each had significant negative proportional mean biases (ie, mean bias decreased as TST increased).
The SE summary results (Table 1 and Figure 3) were similar to the TST results in that the majority of nights for the Actiwatch and all devices exhibited low SE biases versus Dreem. A clear pattern emerged across all devices of reduced variability as SE increased. Additionally, the Actiwatch, Fitbit Inspire HR, and Oura ring each exhibited significant negative proportional mean biases.
SOL (Table 1 and Figure 4) mean biases were low for all devices, and all except the Oura ring exhibited significant proportional bias (positive for Fatigue Science Readiband and negative for Actiwatch, Fitbit Inspire HR, and Polar Vantage V Titan). Individual night biases for all devices were lowest when SOL was also low. WASO (Table 1 and Figure 5) biases showed more variability but were also lowest when WASO was low. Proportional mean biases were significant for all devices except the Fatigue Science Readiband, with negative proportional biases for Actiwatch, Fitbit Inspire HR, and Polar Vantage V Titan and positive proportional bias for Oura ring.
Sleep Stage Summary Agreement
Sleep stage summary results are shown in Table 2 and corresponding Bland-Altman plots in Figures 6–8. Expanded sleep stage summary results are presented in Supplementary Table S3.
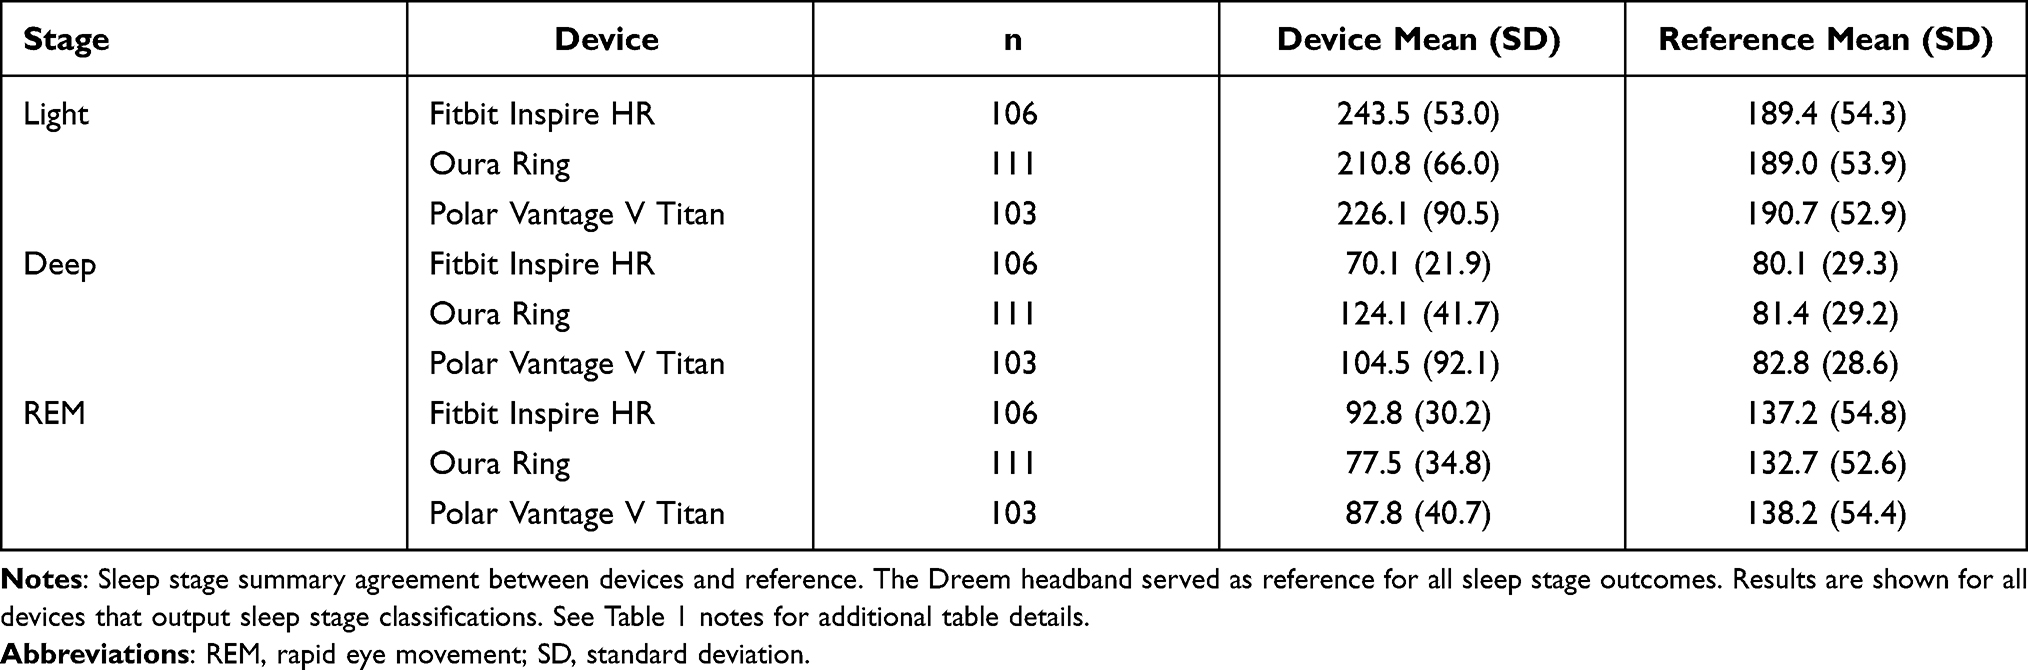 |
Table 2 Sleep Stage Summary Agreement |
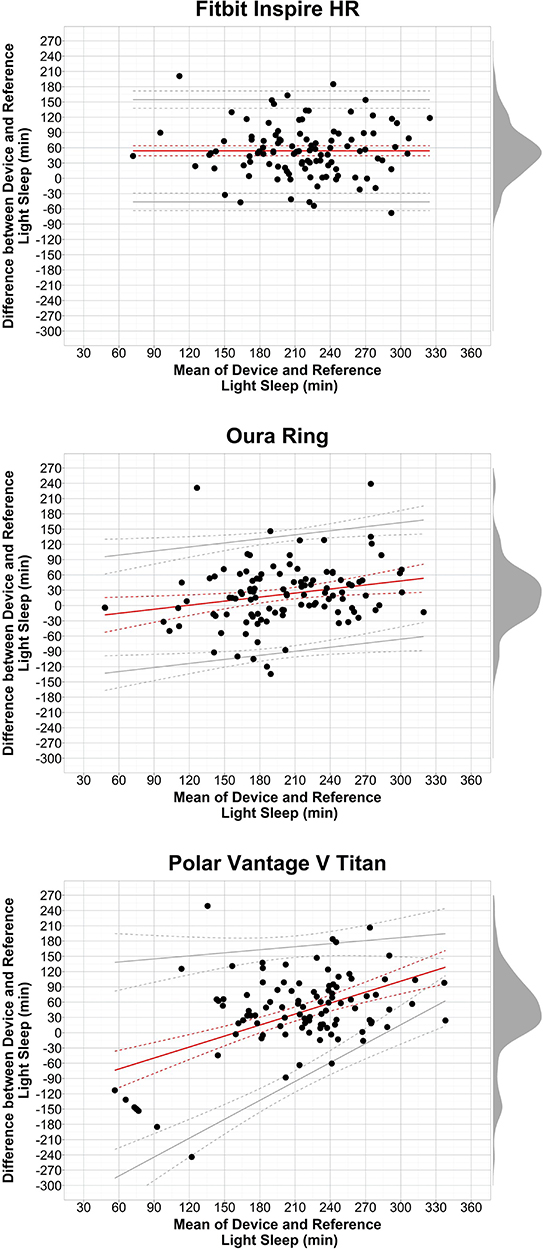 |
Figure 6 Bland-Altman plots: light sleep. Notes: Plots depict the mean bias (solid red line) and upper and lower limits of agreement (solid gray lines) for minutes of light sleep for the devices compared with the reference Dreem headband. See Figure 1 notes for additional figure details. |
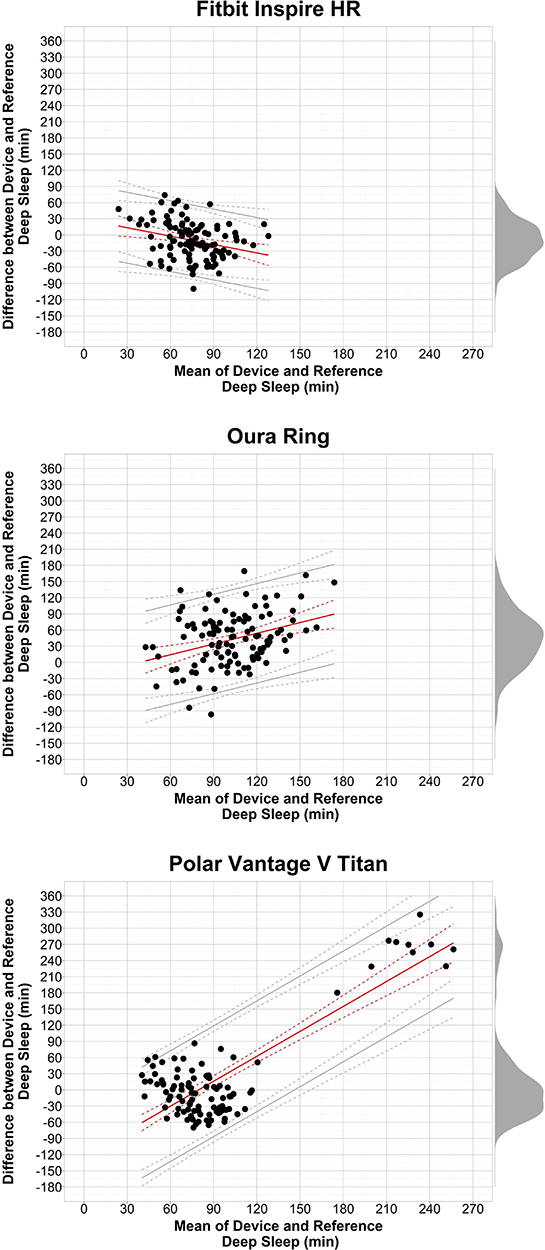 |
Figure 7 Bland-Altman plots: deep sleep. Notes: Plots depict the mean bias (solid red line) and upper and lower limits of agreement (solid gray lines) for minutes of deep sleep for the devices compared with the reference Dreem headband. See Figure 1 notes for additional figure details. |
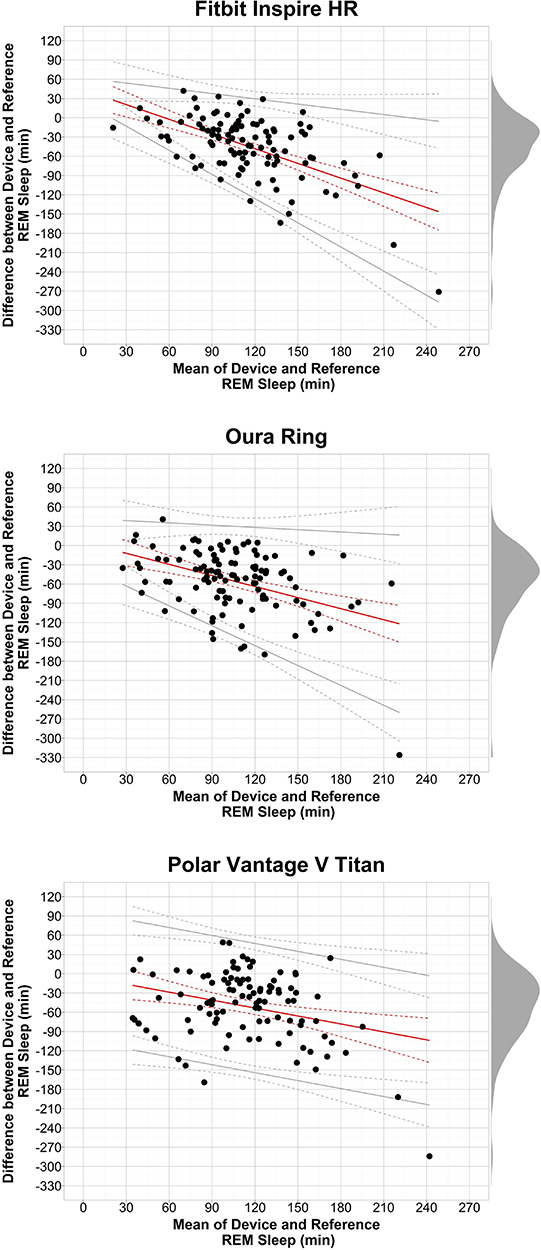 |
Figure 8 Bland-Altman plots: REM sleep. Abbreviation: REM, rapid eye movement. Notes: Plots depict the mean bias (solid red line) and upper and lower limits of agreement (solid gray lines) for minutes of REM sleep for the devices compared with the reference Dreem headband. See Figure 1 notes for additional figure details. |
In general, for the three devices that provide sleep stage classifications, the summary results and individual night biases for sleep stages were mixed and more variable than the sleep-wake outcomes. Light sleep (Table 2 and Figure 6) biases were variable and generally overestimated compared with Dreem, and there were significant positive proportional mean biases for the Oura ring and Polar Vantage V Titan. Deep sleep (Table 2 and Figure 7) biases were also highly variable for most nights, with Oura ring and Polar Vantage V Titan producing overestimates on many nights. Of note, the Polar Vantage V Titan had major overestimations on 10 nights (spread among 7 participants) due to it classifying all sleep as deep sleep only. Each device exhibited significant proportional mean biases for deep sleep, which was negative for the Fitbit Inspire HR but positive for the Oura ring and Polar Vantage V Titan. REM sleep (Table 2 and Figure 8) biases were also highly variable for each device, with the majority of nights producing underestimates versus Dreem and significant negative proportional mean biases.
EBE Sleep-Wake Agreement
EBE agreement outcomes for sleep versus wake epochs for each device were compared with Dreem and are shown in Table 3. Values were calculated in two ways: (1) All epochs combined across participants and nights, and (2) Between nights. Both calculations yielded similar means. For all epochs, sensitivity levels for Actiwatch and each device were very high with a small range (0.93–0.96), while specificity levels were all low to medium (0.35–0.45). Notably, the specificity level for each commercial device was higher than Actiwatch, except for the Polar Vantage V Titan which was similar to Actiwatch. To a large extent, the other EBE outcomes reflect the sensitivity and specificity results. Like sensitivity, accuracy and PPV values across devices were all high and in a narrow range, while NPV was low to medium like specificity. PABAK values were also similar with a narrow range of values across devices.
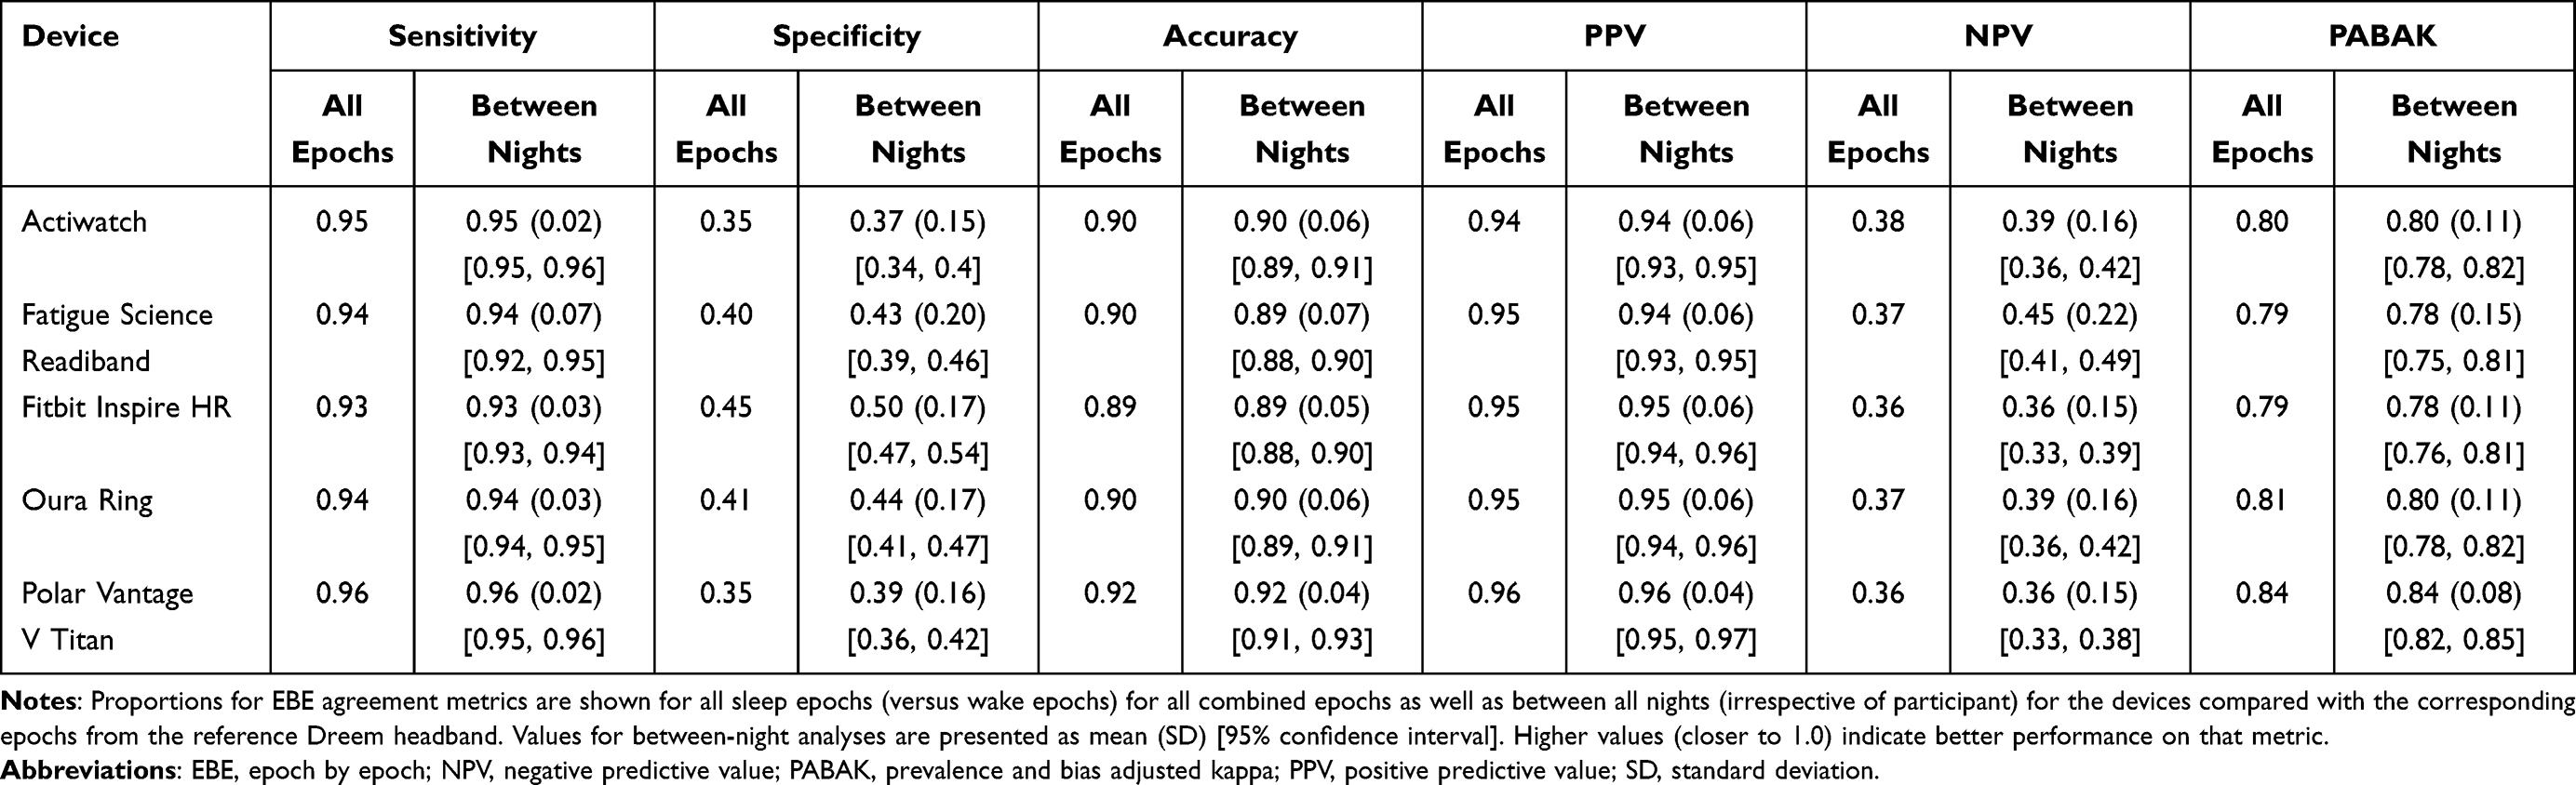 |
Table 3 EBE Sleep-Wake Agreement |
EBE Sleep Stage Agreement
EBE agreement for each sleep stage are shown in Table 4. Compared with the sleep-wake EBE results, the sleep stage EBE performance levels were mixed. For light sleep, sensitivity and specificity were at a medium level for all devices. For deep and REM sleep, specificity levels were high while sensitivity levels were low to medium, indicating that devices are generally better at detecting when a given epoch is a classification other than deep or REM sleep than when it is that stage. Values were within a narrow range across devices within all the other stage outcomes. Accuracy for each device was at a medium level for light sleep, but at medium to high levels for deep and REM. PPV levels were mostly at a medium level while NPVs were higher, especially for deep and REM. PABAK levels for light sleep were low for each device, but medium for deep and REM.
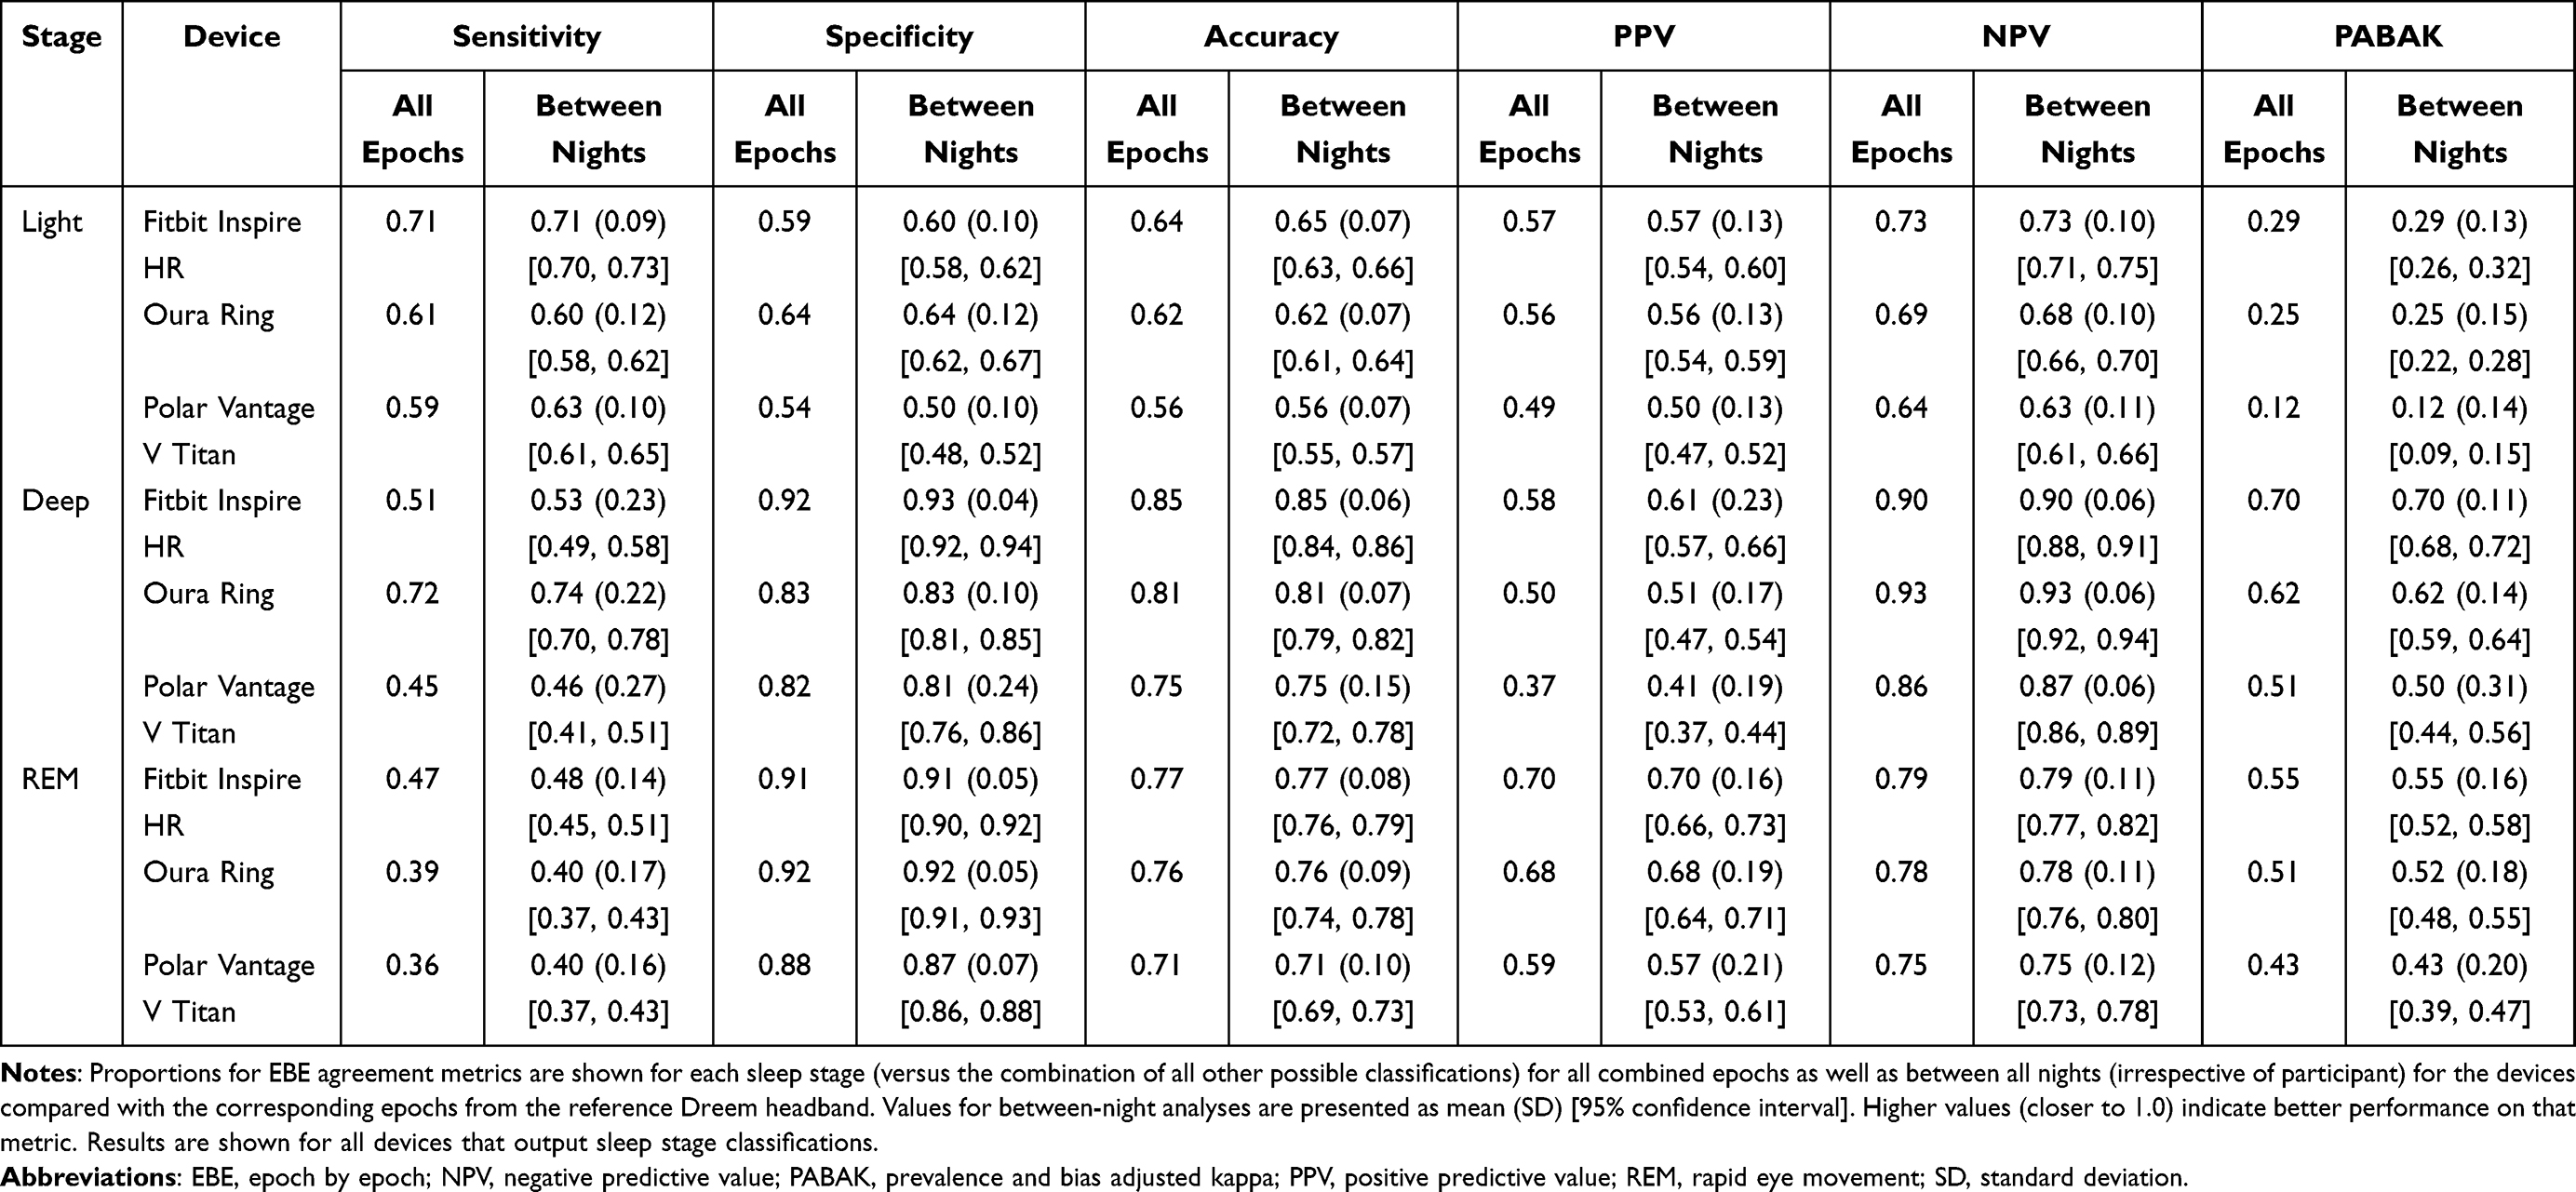 |
Table 4 EBE Sleep Stage Agreement |
EBE Sleep Stage Misclassification Errors
EBE sleep stage misclassifications were calculated in two ways: (1) Error rates for each device misclassifying each stage, given what the Dreem scored (Table 5A), and (2) Classification differences of what the Dreem scored, given what the device scored (Table 5B). The largest source of error for either error calculation was with light sleep epochs. Among wake, deep, and REM epochs as scored by the Dreem, the devices misclassified those epochs as light sleep between 24–47% of the time. Additionally, wake, deep, and REM epochs as scored by devices were misclassified and, according to the Dreem, should have been scored as light sleep 22–44% of the time. Epochs scored as light by devices were misclassified and should have been scored as REM 24–29% of the time. Another substantial misclassification occurred when devices scored REM sleep, according to the Dreem those epochs should have been scored as wake 28–30% of the time.
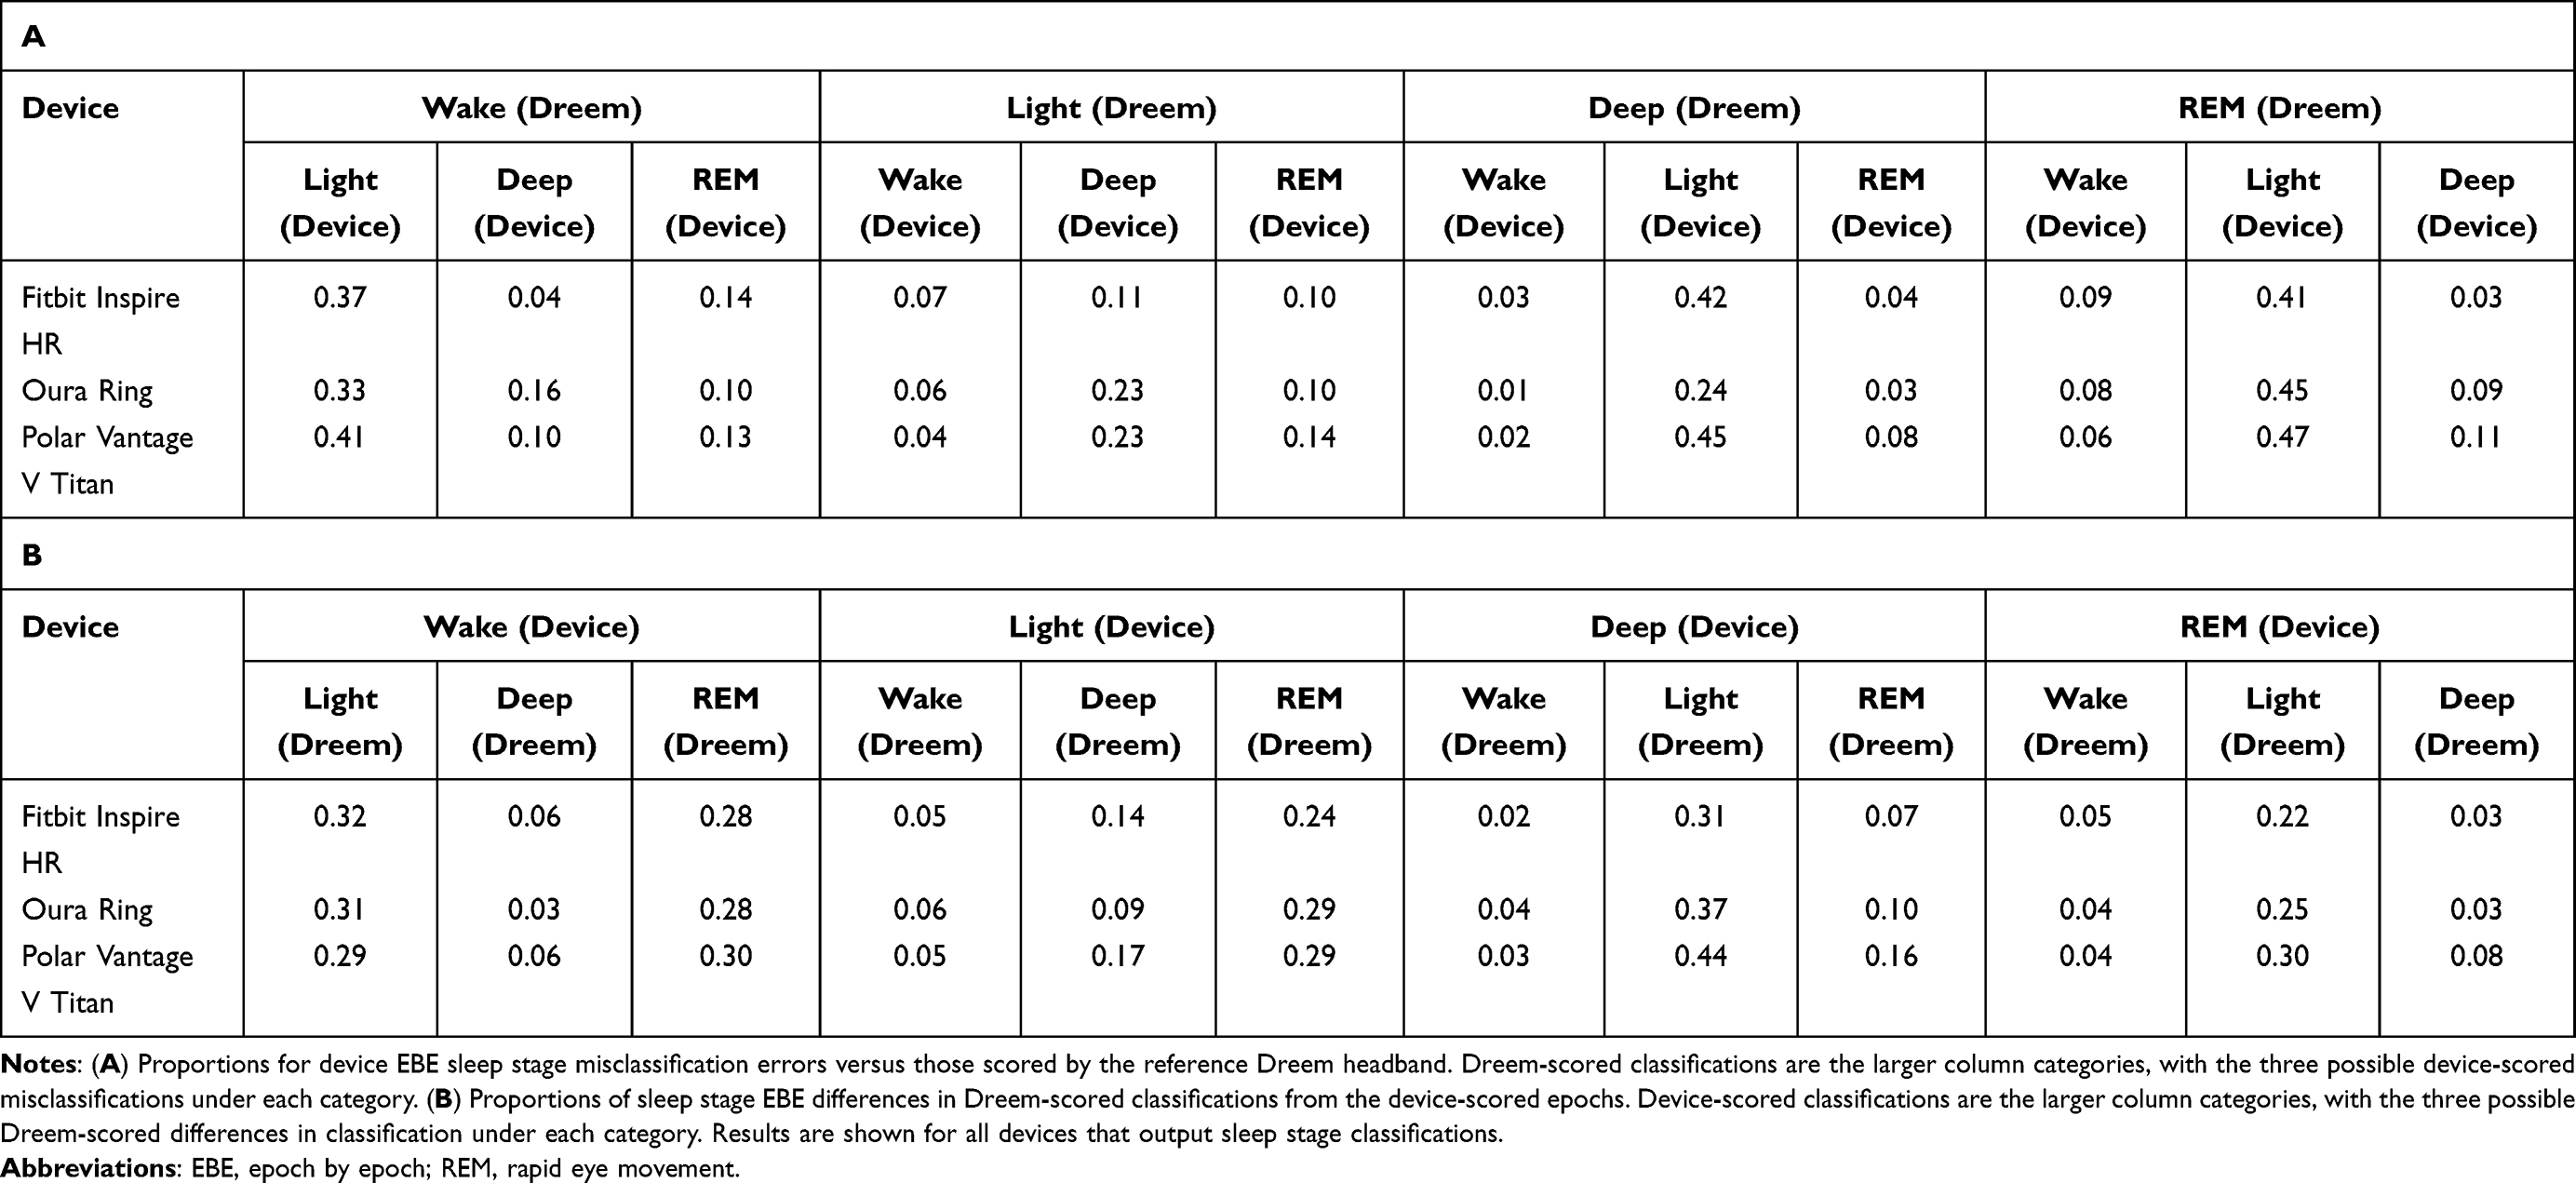 |
Table 5 EBE Sleep Stage Misclassification Errors |
Actiwatch Sensitivity Threshold Comparisons
Sleep-wake summary and EBE results for the Actiwatch analyzed with the low and high sensitivity thresholds are described in the text of the Supplementary Materials, with accompanying data presented in Supplementary Tables S4-S6 and depicted with Bland-Altman plots in Supplementary Figure S1. In general, the different sensitivity threshold settings exhibited mixed and opposite results for the sleep-wake detection capability of the Actiwatch compared with the recommended medium setting and the commercial devices. The low setting generally increased the amount of wake and decreased the amount of sleep classified across sleep episodes, and the high setting did the opposite. This corresponded to performance tradeoffs, resulting in the Actiwatch being more sensitive to wake or sleep with the low and high settings, respectively.
Discussion
In general, the four commercial wearable devices we tested had similar sleep-tracking performance during real-world unrestricted home sleep in healthy young adults. Like many prior studies, the commercial devices were better at detecting sleep than wake, indicated by the high sensitivity and low-to-medium specificity EBE levels. The specificity levels for most commercial devices were comparable to research-grade actigraphy, revealing a similar or possibly greater ability than actigraphy to detect wake. Sleep-wake summary outcomes including TIB, TST, SE, SOL, and WASO were accurately tracked with low bias on most nights, but were generally most accurate on nights with higher SE. A few nights still exhibited large biases for sleep summary outcomes, but the specific causes of such bias or variability remain to be determined. Sleep stages had greater bias and variability than the binary sleep-wake outcomes, suggesting that the ability of devices to track individual sleep stages is worse than their ability to track sleep-wake in general. Taken together, our findings suggest that the commercial wearable devices predominantly exhibited promising performance for tracking nighttime sleep-wake patterns in real-world unrestricted home conditions with healthy young adults.
Many of the findings in the present study are similar to those in previous studies with these and other sleep-tracking devices. High sensitivity and low-to-medium specificity were expected, as these are consistent findings among previous studies testing the agreement of EBE sleep-wake classifications with either research-grade actigraphy or commercial devices.2,7,27,33 With this expected weakness of the sleep-wake algorithms to under-detect wake epochs (and general acceptance of this limitation by researchers for mobile sleep assessments with actigraphy methods34), a useful interpretative benchmark for evaluating the performance of commercial devices is to consider their specificity levels in relation to those of actigraphy (ie, the Actiwatch). In this case, all four commercial devices performed at levels that were comparable to research-grade actigraphy. That the Fatigue Science Readiband, Fitbit Inspire HR, and Oura ring appeared to exceed the specificity of the Actiwatch (at the medium sensitivity threshold setting) by 5–10% is intriguing and in line with previous studies, but this result should be replicated before arriving at strong conclusions about potential superior performance of devices across other populations and settings. Between-night comparisons of specificity resulted in slightly higher specificity levels than when all epochs were analyzed, but this may be due in part to differences in TIB and/or the amount of wake epochs between nights. The low and high sensitivity threshold settings did result in altered EBE results for the Actiwatch, including higher specificity when the low setting was utilized. However, the low setting also came with tradeoffs, such as slightly reduced sensitivity and NPV and larger mean biases for most of the sleep-wake summary outcomes. This result suggests that, depending on the population and setting, the different actigraphy analysis settings may be warranted in some studies, but that the decision may result in performance tradeoffs. Most recent studies of newer models from major commercial device companies have yielded similar results for tracking sleep-wake summary measures such as TST, SE, SOL, and WASO, with comparable levels of accuracy and low bias on most nights.
In contrast, novel findings from the current study address the accuracy of commercial device algorithms for tracking unrestricted TIB in healthy young adults. Most previous device performance studies utilized designs with controlled lab conditions and fixed TIB (or allowing only a small TIB range). With the weeklong unrestricted home sleep design, we were able to gather data with wider distributions of TIB and clock times. We largely found that TIB was tracked accurately on most nights, however there were still considerable biases on several nights for each device. TIB bias and variability from the commercial devices may in part be due to participant activity levels around bedtime and wake time. The commercial devices utilize proprietary algorithms that track sleep automatically (which is a beneficial feature for low-burden, real-time sleep tracking), but such automatic algorithms may be impacted by a participant’s sedentary activity. For example, relaxing at night while awake in bed could cause automatic algorithms to start their sleep recording earlier than one’s actual bedtime. Actigraphy analyses were set to the reported TIB, as is standard procedure,34 and thus actigraphy would be less affected by sedentary activity surrounding the sleep episode compared with the commercial devices. Despite relying on automatic algorithms to start and end sleep recordings, the commercial devices still performed well on most nights in tracking TIB and other summary outcomes. TIB is a critical outcome for tracking sleep, because an inaccurate TIB will expand or restrict the sleep recording window and have downstream effects on the other sleep-wake outcomes. Additional studies should be conducted to examine device performance under conditions that better reflect the real-world variability in sleep schedules, such as in shift workers and under operational contexts that include different TIB durations and patterns such as shorter naps or split sleep schedules.
The predecessor Fitbit model to the Inspire HR, the Alta HR, has been compared directly to PSG by our group7 and others,10,11 and it displayed low levels of bias on summary and EBE performance that was also favorable to actigraphy. One study35 also examined the Fitbit Alta HR in insomnia patients at home for one week, finding that it displayed similar sleep-tracking ability as actigraphy (but did not test it against PSG or mobile EEG). Studies testing other recent Fitbit models found the Charge 3 was high-performing when tested against PSG in adolescents,12 and the Ionic performed among the best out of nine sleep-tracking devices tested at home versus mobile EEG in adults.14 Fitbit device models have been the focus of most device performance studies in the sleep field (likely due to their early entry as a major company in the emerging wearables market). Over the past 5–10 years, Fitbit has consistently improved their technology (eg, added a PPG heart rate sensor in newer models) and their sleep-tracking algorithm performance.16 To our knowledge, the current study is the first to examine sleep in the newer Inspire HR model from Fitbit, which we found performs like the more widely-tested Alta HR model as well as other recent models and may still be considered among the best sleep trackers tested.
The Oura ring showed overall high performance across sleep-wake summary and EBE outcomes in the current study. This result is consistent with findings from other recent performance studies that evaluated the Oura ring versus either PSG5,6,8,36 or mobile EEG.14 In the study with similar methods comparing Oura ring with mobile EEG at home,14 the Oura ring (along with Fitbit Ionic, referenced earlier) performed the best of nine commercial sleep-tracking devices tested. The current study tested the 2nd generation version of the Oura ring, although studies with the 1st generation8,36 Oura ring found good sleep-tracking performance along with the more recent studies of the 2nd generation ring5,14 despite methodological and sample demographic differences that may have resulted in higher EBE specificity levels reported in the other studies of the 2nd generation Oura ring. Thus, the ring form factor represents an alternative for high-performing sleep tracking along with the much more common wrist-worn devices.
We previously evaluated the Fatigue Science Readiband versus lab-controlled PSG, and found that it performed similar to or better than actigraphy on most sleep-wake outcomes.7 One other study also evaluated the Readiband under conditions similar to the current study (ie, at home versus mobile EEG), and found it generally performed well on most outcomes and ranked around the middle among nine sleep-tracking devices that also included the more high-performing Fitbit Ionic and Oura ring.14 The Readiband is not marketed as a direct-to-consumer device, rather it is typically marketed as part of a fatigue management platform with athletic teams and operational or shift working groups. The limited marketing of the Readiband may be among the reasons it has received less attention from consumers and researchers, despite the results from this study and prior studies suggesting it is a viable option for sleep-wake tracking and with longer battery life (~30 days) compared with the other devices tested (~4-7 days).
In general, the Polar Vantage V Titan exhibited mixed performance, with specificity that was similar to actigraphy but not as high as the other commercial devices. To our knowledge, the Vantage V Titan model from Polar has not been subjected to previous sleep-tracking performance testing, so it was unknown how it would perform relative to the other devices or a reference methodology. However, in a study of six commercial wearable devices versus actigraphy, a previous Polar device model (the A360) performed relatively poorly in its sleep-tracking performance.37 And compared with mobile EEG at home, another previous Polar model (the A370) had middling sleep-tracking performance among nine devices tested.14 One other area in which we found that the Polar Vantage V Titan performed worse than the other devices was in sleep stage tracking. Although no device performed particularly well at tracking sleep stages, on 10 nights (comprising ~10% of all nights tested and spread among 7 participants) the Polar classified all sleep that occurred as deep sleep. That outcome drastically biased the Polar’s sleep stage data on those nights and was a unique phenomenon among the devices in this study, and to our knowledge has not been reported in previous device studies. With several other commercial devices having been more thoroughly evaluated and with superior performance, it may be advisable to wait until Polar sleep-tracking algorithms have been updated and devices more thoroughly evaluated before selecting Polar devices for research purposes.
Sleep stage-tracking performance was mixed and highly variable compared with the binary sleep-wake outcomes. These results were expected given similar findings from our previous work7 and from others8,10–12,14 that tested sleep stage-tracking of various devices versus PSG. Most sensitivity levels for the three devices that output stage data were at a medium level, indicating that a device can only classify the correct stage for a given epoch around half the time. Although specificity levels for deep and REM sleep were high, there are three other possible classifications for a given epoch. Thus, a high specificity in the case of a sleep stage does not offer confidence in understanding how that epoch should be classified. Additionally, as in our prior study,7 we again found that light sleep was the most common stage for error, with Dreem-scored wake, deep, and REM epochs having a considerable chance of mistakenly being misclassified as light sleep (and vice versa). The other stage classifications were not as often mistaken with each other, except that all the devices also showed a high proportion for misclassifying wake as REM sleep. There may be room for future devices/algorithms to improve, though this may represent a type of ceiling effect on the ability of current algorithms to correctly classify sleep stages from wearables. Improved sleep stage-tracking will likely remain a challenge largely due to the established scoring rules for each stage being based primarily on EEG waveforms and phasic events38 that do not (or potentially cannot) correlate precisely with signals measured only from a device placed on the wrist or finger.
We believe this study has several notable strengths: (1) This is one of the first studies to test device performance with unrestricted home sleep schedules that reflect naturalistic variation in TIB, representing a step forward in understanding how the performance of commercial sleep-tracking devices compares with the more commonly utilized lab-controlled study designs; (2) Unlike most performance studies that test only a single sleep-tracking device, testing multiple devices simultaneously supported a higher throughput of devices tested and with multiple form factors (ie, wrist-worn and ring devices); (3) The weeklong study design using mobile EEG allowed us to collect up to 7 nights of high quality sleep data per participant, without the typical burdens placed on researchers and participants that are required with lab-controlled PSG procedures; (4) Testing commercial devices alongside a research-grade actigraph allowed a direct comparison with the mobile sleep assessment standard methodology of actigraphy and opens the results up to interpretation as to whether commercial devices may serve as an adequate future alternative to actigraphy in sleep research and medicine; (5) The testing procedures and analyses follow recently recommended standards2,28 for sleep-tracking device performance evaluation; and (6) This study was an independent investigation, without potential conflicts from the device companies.
Additionally, notable limitations of this study include the following: (1) Mobile EEG provides high quality sleep data that are relatively easier to collect in home settings, but it is not as accurate as traditional gold-standard PSG. Therefore, using the Dreem mobile EEG headband and its associated auto-scoring algorithm30 is a highly practical alternative as a mobile standard sleep assessment methodology, but is less precise than PSG in scoring sleep-wake and sleep stages; (2) Although most data were high quality and usable in the analyses, we experienced occasional data loss with the commercial devices and the Dreem headband due to user error, technological malfunctions, low signal quality, or other reasons. New technologies can be unpredictable and challenging to use without error, especially when used in remote settings outside the lab where researchers are not directly present. Having standardized methods and employing daily data and compliance checks helped ensure that data collection issues were minimized and resolved quickly; (3) EBE analyses relied on concurrent pairs of epochs between a device and Dreem. Therefore, device epochs that were recorded outside the actual TIB from the sleep diary/Dreem recording (which were likely to be wake epochs) and Dreem epochs recorded within the TIB when a device may not have been recording at the same time, were not able to be included in the EBE analyses; (4) Wearable devices with PPG sensors may be prone to error in heart rate-tracking accuracy due to demographic (eg, race, ethnicity) and physical differences in skin types (eg, skin tone, hair follicle density) between participants,39 which could have unknown effects on the sleep-tracking outcomes for the devices that use PPG sensors in this study. Such data were not collected in this study, however future studies should collect data on individual demographics and skin types to explore potential effects of those factors on wearable device sleep-tracking performance; (5) Like many previous device performance studies, the current study was restricted to healthy young adults without reported sleep disorders or other medical conditions. Thus, we observed relatively low variability in the amounts and patterns of wake within the sleep episodes, limiting the interpretation for how devices may perform in populations with sleep initiation or sleep maintenance issues that exhibit higher levels of SOL and WASO (and lower SE); (6) The consumer market has a high turnover rate of devices that track sleep. We chose to test device models from companies that are established in the wearables market, and that are widely used by the public or by operational and athletic communities that use such devices to track their health and behavior. It is possible that the specific device models used in the present study may not be available or supported by the device companies in a few years, however they are likely to be replaced by comparable device models using similar sensors and sleep-tracking algorithms. Thus, the results are most relevant for the specific models/algorithms but are nonetheless informative to the performance of sleep-tracking devices from these companies in general for years into the future; and (7) The focus of the present study was to report the basic performance evaluation metrics of the commercial devices versus mobile EEG and actigraphy. Further analyses between and within participants across nights as well as demographic comparisons, leveraging the full strengths of the diversity of participants and multi-night study design, are being prepared for inclusion in future publications.
Conclusion
These findings demonstrate that several commercial devices that track sleep in unrestricted home sleep conditions are promising alternatives to research-grade actigraphy. As a first step toward eventual validation, several of these devices (or very similar device models) were previously tested primarily under lab-controlled conditions and exhibited good performance compared with the gold standard PSG. The current study extends those findings by showing that sleep-tracking performance is largely similar under unrestricted home settings with naturalistic variation in sleep schedules, which further supports the potential for using commercial devices as a high-quality alternative to actigraphy for mobile sleep-wake assessments. Altering the sensitivity analysis thresholds may enhance the performance of actigraphy for certain performance domains, albeit with some performance tradeoffs, and researchers are advised to consider carefully the population and setting of their study when choosing device and analysis settings. As in prior studies, however, commercial devices exhibited more modest performance for sleep stage-tracking and were prone to higher levels of bias and variability compared with the sleep-wake outcomes. The recent advancements in sensor technology and ubiquitous use of wearable devices that track sleep and other relevant behavioral and physiological signals represents a promising future where personal health insights are gained with tools that possess several major strengths over current standard assessment methodologies (eg, lower burden, more widely available, more comfortable, less expensive, multi-functional, and multi-day tracking on a single charge). Given the potential importance of commercial wearables in sleep research and medicine, future studies are warranted to continue to assess the performance of these and other devices in broader settings and within more diverse populations of interest (eg, patients with sleep disorders, shift workers, and operational populations).
Abbreviations
EBE, epoch by epoch; EEG, electroencephalography; MT, movement time; NPV, negative predictive value; PABAK, prevalence and bias adjusted kappa; PPG, photoplethysmography; PPV, positive predictive value; PSG, polysomnography; REM, rapid eye movement; SD, standard deviation; SE, sleep efficiency; SOL, sleep onset latency; TIB, time in bed; TST, total sleep time; WASO, wake after sleep onset.
Disclaimer
I am a military service member or employee of the US Government. This work was prepared as part of my official duties. Title 17, U.S.C. §105 provides that copyright protection under this title is not available for any work of the US Government. Title 17, U.S.C. §101 defines a US Government work as work prepared by a military service member or employee of the US Government as part of that person’s official duties. Report No. 21-62 was supported by the Office of Naval Research, Code 34, under work unit no. N1701. The views expressed in this article reflect the results of research conducted by the authors and do not necessarily reflect the official policy or position of the Department of the Navy, Department of Defense, nor the US Government. The study protocol was approved by the Naval Health Research Center Institutional Review Board in compliance with all applicable federal regulations governing the protection of human subjects. Research data were derived from an approved Naval Health Research Center Institutional Review Board protocol, number NHRC.2017.0008.
Acknowledgments
This research was funded by the Office of Naval Research, Code 34. The authors wish to thank the study participants.
Disclosure
Evan D Chinoy, Joseph A Cuellar, and Jason T Jameson are employees of Leidos, Inc. The authors report no potential conflicts of interest in this work. None of the authors have any relationships related to the companies whose devices were evaluated in the study, nor were any companies involved in any stage of the research.
References
1. IndustryARC. Wearable Sleep trackers market: industry analysis, market size, share, trends, growth and forecast 2021-2026; 2021. Available from: https://www.industryarc.com/Report/19669/wearable-sleep-trackers-market.html.
2. Depner CM, Cheng PC, Devine JK, et al. Wearable technologies for developing sleep and circadian biomarkers: a summary of workshop discussions. Sleep. 2020;43(2):847. doi:10.1093/sleep/zsz254
3. Khosla S, Deak MC, Gault D, et al. Consumer Sleep Technology: an American Academy of Sleep Medicine Position Statement. J Clin Sleep Med. 2018;14(5):877–880. doi:10.5664/jcsm.7128
4. Schutte-Rodin S, Deak M, Khosla S, et al. Evaluating consumer and clinical sleep technologies: an American Academy of Sleep Medicine update. J Clin Sleep Med. 2021. doi:10.5664/jcsm.9580
5. Altini M, Kinnunen H. The Promise of Sleep: a Multi-Sensor Approach for Accurate Sleep Stage Detection Using the Oura Ring. Sensors. 2021;21(13):4302. doi:10.3390/s21134302
6. Chee NI, Ghorbani S, Golkashani HA, Leong RL, Ong JL, Chee MW. Multi-Night Validation of a Sleep Tracking Ring in Adolescents Compared with a Research Actigraph and Polysomnography. Nat Sci Sleep. 2021;13:177–190. doi:10.2147/NSS.S286070
7. Chinoy ED, Cuellar JA, Huwa KE, et al. Performance of seven consumer sleep-tracking devices compared with polysomnography. Sleep. 2021;44(5):zsaa291. doi:10.1093/sleep/zsaa291
8. de Zambotti M, Rosas L, Colrain IM, Baker FC. The Sleep of the Ring: comparison of the ŌURA Sleep Tracker Against Polysomnography. Behav Sleep Med. 2017;1–15. doi:10.1080/15402002.2017.1300587
9. de Zambotti M, Goldstone A, Claudatos S, Colrain IM, Baker FC. A validation study of Fitbit Charge 2TM compared with polysomnography in adults. Chronobiol Int. 2018;35(4):465–476. doi:10.1080/07420528.2017.1413578
10. Kahawage P, Jumabhoy R, Hamill K, de Zambotti M, Drummond SPA. Validity, potential clinical utility, and comparison of consumer and research-grade activity trackers in Insomnia Disorder I: in-lab validation against polysomnography. J Sleep Res. 2020;29(1):e12931. doi:10.1111/jsr.12931
11. Lee XK, Chee NIYN, Ong JL, et al. Validation of a Consumer Sleep Wearable Device With Actigraphy and Polysomnography in Adolescents Across Sleep Opportunity Manipulations. J Clin Sleep Med. 2019;15(9):1337–1346. doi:10.5664/jcsm.7932
12. Menghini L, Yuksel D, Goldstone A, Baker FC, de Zambotti M. Performance of Fitbit Charge 3 against polysomnography in measuring sleep in adolescent boys and girls. Chronobiol Int. 2021;38(7):1010–1022. doi:10.1080/07420528.2021.1903481
13. Miller DJ, Roach GD, Lastella M, et al. A Validation Study of a Commercial Wearable Device to Automatically Detect and Estimate Sleep. Biosensors. 2021;11(6):185. doi:10.3390/bios11060185
14. Stone JD, Rentz LE, Forsey J, et al. Evaluations of Commercial Sleep Technologies for Objective Monitoring During Routine Sleeping Conditions. Nat Sci Sleep. 2020;12:821–842. doi:10.2147/NSS.S270705
15. de Zambotti M, Cellini N, Goldstone A, Colrain IM, Baker FC. Wearable Sleep Technology in Clinical and Research Settings. Med Sci Sports Exerc. 2019;51(7):1538–1557. doi:10.1249/MSS.0000000000001947
16. Haghayegh S, Khoshnevis S, Smolensky MH, Diller KR, Castriotta RJ. Accuracy of Wristband Fitbit Models in Assessing Sleep: systematic Review and Meta-Analysis. J Med Internet Res. 2019;21(11):e16273. doi:10.2196/16273
17. Scott H, Lack L, Lovato N. A systematic review of the accuracy of sleep wearable devices for estimating sleep onset. Sleep Med Rev. 2020;49:101227. doi:10.1016/j.smrv.2019.101227
18. Lujan MR, Perez-Pozuelo I, Grandner MA. Past, Present, and Future of Multisensory Wearable Technology to Monitor Sleep and Circadian Rhythms. Front Digit Health. 2021;3:721919. doi:10.3389/fdgth.2021.721919
19. Lee J, Finkelstein J. Consumer sleep tracking devices: a critical review. Stud Health Technol Inform. 2015;210:458–460.
20. Markwald RR, Bessman SC, Reini SA, Drummond SPA. Performance of a Portable Sleep Monitoring Device in Individuals with High Versus Low Sleep Efficiency. J Clin Sleep Med. 2016;12(1):95–103. doi:10.5664/jcsm.5404
21. Meltzer LJ, Hiruma LS, Avis K, Montgomery-Downs H, Valentin J. Comparison of a Commercial Accelerometer with Polysomnography and Actigraphy in Children and Adolescents. Sleep. 2015;38(8):1323–1330. doi:10.5665/sleep.4918
22. Montgomery-Downs HE, Insana SP, Bond JA. Movement toward a novel activity monitoring device. Sleep Breath. 2012;16(3):913–917. doi:10.1007/s11325-011-0585-y
23. de Zambotti M, Cellini N, Menghini L, Sarlo M, Baker FC. Sensors Capabilities, Performance, and Use of Consumer Sleep Technology. Sleep Med Clin. 2020;15(1):1–30. doi:10.1016/j.jsmc.2019.11.003
24. Goldstein C. Current and Future Roles of Consumer Sleep Technologies in Sleep Medicine. Sleep Med Clin. 2020;15(3):391–408. doi:10.1016/j.jsmc.2020.05.001
25. Rentz LE, Ulman HK, Galster SM. Deconstructing Commercial Wearable Technology: contributions toward Accurate and Free-Living Monitoring of Sleep. Sensors. 2021;21(15):5071. doi:10.3390/s21155071
26. Goldstein CA, Depner C. Miles to go before we sleep … a step toward transparent evaluation of consumer sleep tracking devices. Sleep. 2021;44(2):zsab020. doi:10.1093/sleep/zsab020
27. Grandner MA, Rosenberger ME. Chapter 12 - Actigraphic sleep tracking and wearables: historical context, scientific applications and guidelines, limitations, and considerations for commercial sleep devices. In: Grandner MA editor. Sleep and Health. Academic Press; 2019:147–157. doi:10.1016/B978-0-12-815373-4.00012-5.
28. Menghini L, Cellini N, Goldstone A, Baker FC, de Zambotti M. A standardized framework for testing the performance of sleep-tracking technology: step-by-step guidelines and open-source code. Sleep. 2021;44(2):zsaa170. doi:10.1093/sleep/zsaa170
29. Carney CE, Buysse DJ, Ancoli-Israel S, et al. The Consensus Sleep Diary: standardizing Prospective Sleep Self-Monitoring. Sleep. 2012;35(2):287–302. doi:10.5665/sleep.1642
30. Arnal PJ, Thorey V, Debellemaniere E, et al. The Dreem Headband compared to polysomnography for electroencephalographic signal acquisition and sleep staging. Sleep. 2020;43(11):zsaa097. doi:10.1093/sleep/zsaa097
31. Bland JM, Altman DG. Statistical methods for assessing agreement between two methods of clinical measurement. Lancet. 1986;1(8476):307–310.
32. Bland JM, Altman DG. Measuring agreement in method comparison studies. Stat Methods Med Res. 1999;8(2):135–160. doi:10.1177/096228029900800204
33. Marino M, Li Y, Rueschman MN, et al. Measuring sleep: accuracy, sensitivity, and specificity of wrist actigraphy compared to polysomnography. Sleep. 2013;36(11):1747–1755. doi:10.5665/sleep.3142
34. Ancoli-Israel S, Cole R, Alessi C, Chambers M, Moorcroft W, Pollak CP. The role of actigraphy in the study of sleep and circadian rhythms. Sleep. 2003;26(3):342–392. doi:10.1093/sleep/26.3.342
35. Hamill K, Jumabhoy R, Kahawage P, de Zambotti M, Walters EM, Drummond SPA. Validity, potential clinical utility and comparison of a consumer activity tracker and a research-grade activity tracker in insomnia disorder II: outside the laboratory. J Sleep Res. 2020;29(1):e12944. doi:10.1111/jsr.12944
36. Roberts DM, Schade MM, Mathew GM, Gartenberg D, Buxton OM. Detecting sleep using heart rate and motion data from multisensor consumer-grade wearables, relative to wrist actigraphy and polysomnography. Sleep. 2020;43(7):zsaa045. doi:10.1093/sleep/zsaa045
37. Kubala AG, Barone Gibbs B, Buysse DJ, Patel SR, Hall MH, Kline CE. Field-based Measurement of Sleep: agreement between Six Commercial Activity Monitors and a Validated Accelerometer. Behav Sleep Med. 2020;18(5):637–652. doi:10.1080/15402002.2019.1651316
38. Berry RB, Brooks R, Gamaldo CE, et al. The AASM Manual for the Scoring of Sleep and Associated Events: rules, Terminology, and Technical Specifications. Version 2.2. Am Acad Sleep Med. 2015;1:34.
39. Colvonen PJ, DeYoung PN, Bosompra NOA, Owens RL. Limiting racial disparities and bias for wearable devices in health science research. Sleep. 2020;43(10):987. doi:10.1093/sleep/zsaa159
 © 2022 The Author(s). This work is published and licensed by Dove Medical Press Limited. The
full terms of this license are available at https://www.dovepress.com/terms
and incorporate the Creative Commons Attribution
- Non Commercial (unported, 3.0) License.
By accessing the work you hereby accept the Terms. Non-commercial uses of the work are permitted
without any further permission from Dove Medical Press Limited, provided the work is properly
attributed. For permission for commercial use of this work, please see paragraphs 4.2 and 5 of our Terms.
© 2022 The Author(s). This work is published and licensed by Dove Medical Press Limited. The
full terms of this license are available at https://www.dovepress.com/terms
and incorporate the Creative Commons Attribution
- Non Commercial (unported, 3.0) License.
By accessing the work you hereby accept the Terms. Non-commercial uses of the work are permitted
without any further permission from Dove Medical Press Limited, provided the work is properly
attributed. For permission for commercial use of this work, please see paragraphs 4.2 and 5 of our Terms.