Back to Journals » Cancer Management and Research » Volume 11
Pathological nodal staging score for rectal cancer patients treated with radical surgery with or without neoadjuvant therapy: a postoperative decision tool
Authors Dai W, Li Y, Wu Z ![]() , Feng Y, Cai S
, Feng Y, Cai S ![]() , Xu Y, Li Q, Cai G
, Xu Y, Li Q, Cai G
Received 26 March 2018
Accepted for publication 9 July 2018
Published 7 January 2019 Volume 2019:11 Pages 537—546
DOI https://doi.org/10.2147/CMAR.S169309
Checked for plagiarism Yes
Review by Single anonymous peer review
Peer reviewer comments 3
Editor who approved publication: Professor Harikrishna Nakshatri
Weixing Dai,1,2,* Yaqi Li,1,2,* Zhenyu Wu,3,* Yang Feng,1,2 Sanjun Cai,1,2 Ye Xu,1,2 Qingguo Li,1,2 Guoxiang Cai1,2
1Department of Colorectal Surgery, Fudan University Shanghai Cancer Center, Shanghai 200032, China; 2Department of Oncology, Shanghai Medical College, Fudan University, Shanghai 200032, China; 3Department of Biostatistics, School of Public Health Safety, Ministry of Education, Fudan University, Shanghai 200032, China
*These authors contributed equally to this work
Background: Lymph node status can predict the prognosis of patients with rectal cancer treated with surgery. Thus, we sought to establish a standard for the minimum number of lymph nodes (LNs) examined in patients with rectal cancer by evaluating the probability that pathologically negative LNs prove positive during surgery.
Patients and methods: We extracted information of 31,853 patients with stage I–III rectal carcinoma registered between 2004 and 2013 from the Surveillance, Epidemiology, and End Results database and divided them into two groups: the first group was SURG, including patients receiving surgery directly and the other group was NEO, encompassing those underwent neoadjuvant therapy. Using a beta-binomial model, we developed nodal staging score (NSS) based on pT/ypT stage and the number of LNs retrieved.
Results: In both cohorts, the false-negative rate was estimated to be 16% when 12 LNs were examined, but it dropped to 10% when 20 LNs were evaluated. In the SURG cohort, to rule out 90% possibility of false staging, 3, 7, 28, and 32 LNs would be necessarily examined in patients with pT1–4 disease, respectively. While in the NEO cohort, 4, 7, 12, and 16 LNs would be included for examination in patients with ypT1–4 disease to guarantee an NSS of 90%.
Conclusion: By determining whether a rectal cancer patient with negative LNs was appropriately staged, the NSS model we developed in this study may assist in tailoring postoperative management.
Keywords: nodal staging score, rectal cancer, lymph node, neoadjuvant therapy, beta-binomial model
Background
Rectal cancer (RC) is a disease with an estimated incidence of 39,220 cases in the US in 2016,1 and in China, its incidence has rapidly increased by 4.2% for male and by 3.2% for female over the past 10 years.2 For early-stage RC, transanal excision or transabdominal resection with total mesolectal excision with or without adjuvant chemotherapy is sufficient. While for locally advanced RC (T3–4 and/or node positive), the standard management includes neoadjuvant therapy followed by surgical resection with total mesolectal excision and adjuvant chemotherapy.
Pathological findings after resection, including the depth of tumor penetration within the rectal wall (pT or ypT stage) and lymph node (LN) metastasis and other parameters, determine prognosis of patients with RC. All patients with LN metastasis are recommended by National Comprehensive Cancer Network Guidelines for adjuvant chemotherapy.3 A meta-analysis of randomized trials on postoperative adjuvant therapy for resectable RC has shown a 17% improvement in overall survival and a 25% improvement in disease-free survival.4 Thus, adequate LN retrieval and accurate pathological assessment are crucial for patients’ care. Stage migration caused by false-negative node might prevent patients from receiving potentially effective adjuvant therapy.
To reduce stage migration, many experts have proposed to evaluate the minimum number of LNs in colorectal cancer samples. Since 2001, the American Joint Committee on Cancer recommended examining 12 LNs in the surgical specimen of colorectal cancer for adequate staging.5–7 In addition, some studies pointed out that neoadjuvant therapy subsequently decreased the LN yield, but it is not clear in terms of the association between LN yield and survival outcomes in these patients.8–10
Recently, a beta-binomial model of great clinical significance has been applied to estimate the probability of correct staging in various cancer patients with negative LNs.11–17 Shariat et al used the beta-binomial model and developed clinical (preoperative) nodal staging score (NSS) to estimate the sensitivity of pathologic nodal staging in bladder cancer and found that the probability of missing a positive LN decreased with an increasing number of nodes examined.13 Recently, the same method was applied on prostate cancer and the result suggested that if one to six nodes in cT1 and six to eight nodes in cT2 tumors were examined, the probability that a patient has LN metastasis would be up to 90%.15 More recently, this model was even used in thyroid cancer to find out how many LNs are enough for assessing the adequacy of LN yield.17 Since the probability can work as a function of the number of LNs examined and the T stage, we developed models using similar approaches with large samples to calculate the probability. It is to be noted that a model for RC patients who underwent neoadjuvant therapy was especially built to investigate the minimum LN yield to confirm the true prevalence of node-negative disease. This model may help to identify patients who benefit little from postoperative adjuvant chemotherapy, thus tailoring treatment modalities to patients with locally advanced RC.
Patients and methods
Patients
The Surveillance, Epidemiology, and End Results (SEER) program is an authoritative platform of the National Cancer Institute and provides information of cancer incidence and survival from cancer registries which represent about 28% of the population in the US. We identified 327,755 patients with stage I–III primary rectal carcinoma diagnosed and excised between 2004 and 2013 (Figure 1). The exclusion criteria were 1) patients with no LNs examined or reported, 2) patients with unknown number of positive LNs, and 3) patients who received intraoperative radiation or unknown radiation sequence. Therefore, 31,853 patients were finally included in the study cohort and were divided into SURG and NEO groups with 17,425 and 14,428 patients, respectively.
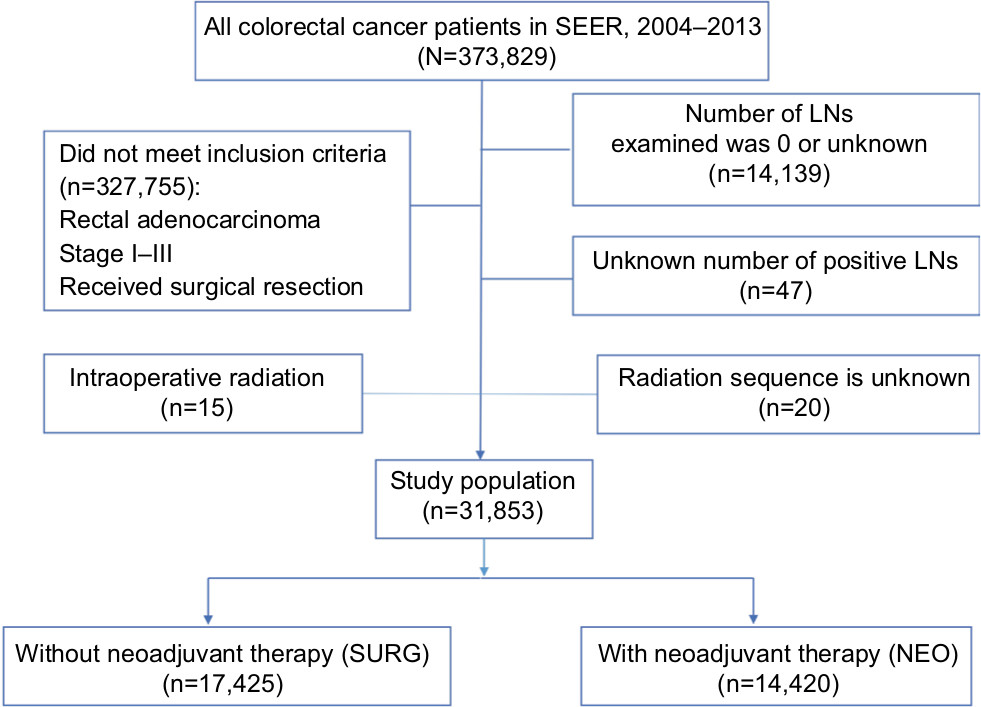 | Figure 1 Flowchart of patients’ screening. Abbreviations: LN, lymph node; SEER, Surveillance, Epidemiology, and End Results. |
Statistical analysis
The methods we adopted are similar to those in previous works.11–17 Briefly, this study focused on the probability that patients with pathologically negative LNs are inappropriately staged. Though the true nodal status is unascertainable, information from node-positive patients can evaluate whether the number of examined LNs and negative ones is efficient to certify the true node status. Consider patients with a large number of examined LNs and a small number of positive LNs (k). If inadequate number of LNs were examined, patients could have been incorrectly diagnosed node negative. For those with a small number of LNs examined and a large k, there is a little chance of missing positive LNs. Hence, the information of nodal positive patients can be used to evaluate the potential positive nodal in negative patients.
The probability of positive LNs in patients with pathologically negative ones can be obtained by computing the probability of missing positive LNs (sensitivity), the prevalence of positive LNs, or the NSS from sensitivity and prevalence.
Probability of missing a positive node
Probability of missing a positive LN (1−sensitivity), namely, the false-negative rate, is unavoidable in pathological examination. It hinges on the number of LNs examined rather than patients’ characteristics. Considering the heterogeneity of LN metastasis in different patients, a beta-binomial model was thus adopted. There are three assumptions: 1) no positive LN was incorrectly diagnosed by pathologists; 2) all the LNs have the same probability of involvement; and 3) no variation of sensitivity between node-positive patients and those with negative LNs.
Estimation of prevalence of nodal disease
The prevalence observed is always underestimated, thus it necessitates adjustment for false negative. False negative represents an error in which the pathological examination improperly indicates no presence of positive lymph node, when in reality it is present.. The adjustment requires invoking Assumption 1 and estimating #FNk as a function of k:
| (1) |
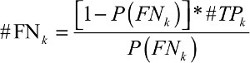
In the above equation, k represents the number of positive LNs and #TPk refers to the number of true-positive LNs. To obtain prevalence, further calculation is needed with the following formula:
| (2) |
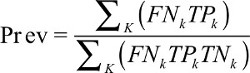
pT/ypT stage stratifies the prevalence estimates; but to avoid cumbersome expression, it is not manifested in the above formula.
Nodal staging score
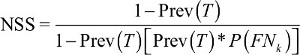
NSS, the probability of pathologically negative LNs proving to be true, can be used to assess whether staging is adequate.
| (3) |
Confidence intervals
Creating 2,000 boot-strap samples and having the estimation process replicated can assess the precision of the reported estimates.18 The 2.5th and 97.5th quartiles were chosen as the lower and upper limits of the 95% CIs, respectively, for the corresponding estimates.
Validation
The predictive probabilities did not involve the follow-up information of these patients. We divided the NSS into four quartile subgroups and constructed survival curves stratified by the pT/ypT stage.
Ethics approval
This study was based on SEER dataset which is publicly accessible, and we have been permitted for the research purpose. It did not include interaction with humans or use personal identifying information. The informed consent was not required for this research.
Results
Basic characteristics of patients
Descriptive characteristics of patients are summarized in Table 1. Of 31,853 eligible patients for modeling, 18,870 (59.2%) were node positive; thus, they were analyzed for the estimates of #FNk. The other 9,983 patients with pN0 or ypN0 disease were analyzed for the estimates of #TPk. Age, tumor size, T stage, LN yield, and differentiation grade were associated with node positivity vs node negativity.
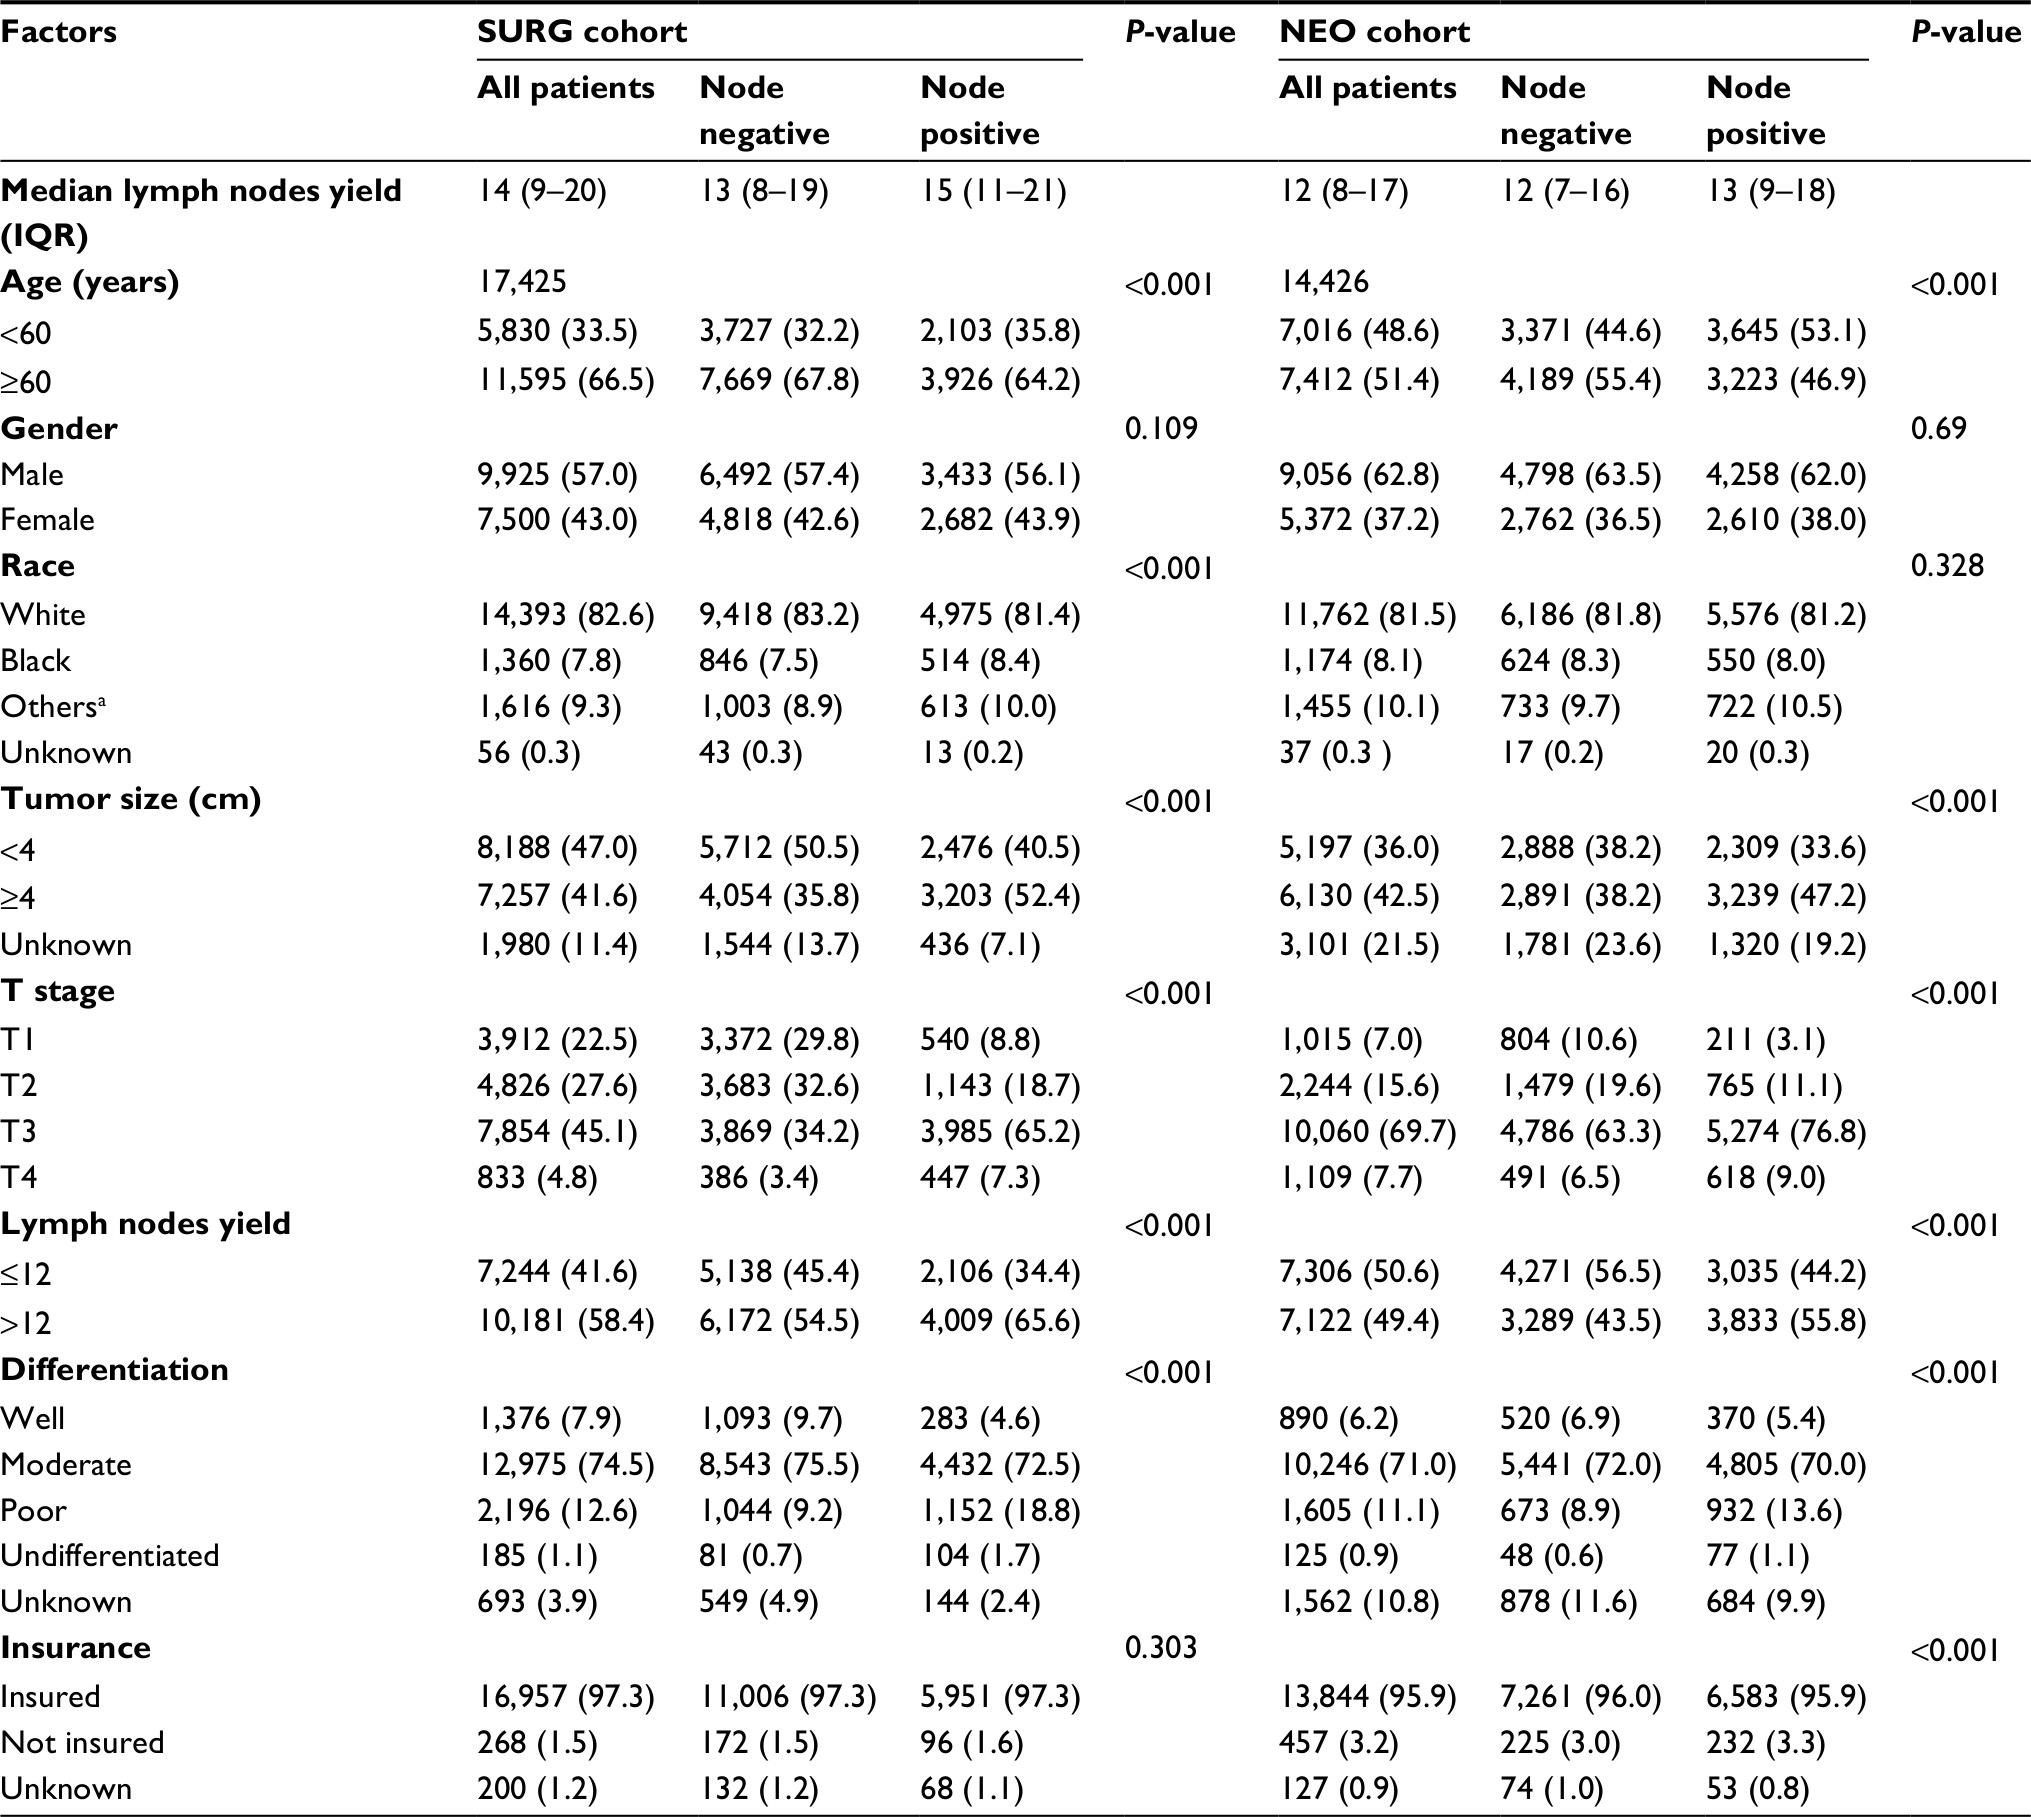 | Table 1 Baseline patient clinicopathologic characteristics Notes: aIncluding American Indian/AK Native, Asian/Pacific Islander. Chi-squared test for categorical variables and independent t-test for continuous variables. Numbers in parentheses represent the component ratio of specific variable in the whole patients. Abbreviation: IQR, interquartile range; AK Alaska. |
Nodal staging score for RC patients without neoadjuvant therapy
The average number of LNs examined was 14 and 64.9% patients in SURG turned out node negative. α and β, the parameters of the beta-binomial model, were 1.17 (95% CI, 1.12–1.22) and 3.25 (95% CI, 3.04–3.49), respectively. Presented in Figure 2 is the probability of missing positive LNs, and it is found to decrease as the number of LNs evaluated increases (Figure 2). The probabilities of false-negative LN resection were 75.3%, 34.9%, 23.8%, 19.4%, 16.2%, 9.4%, and <5% for 1, 5, 8, 10, 12, 20, and >35 LNs examined, respectively.
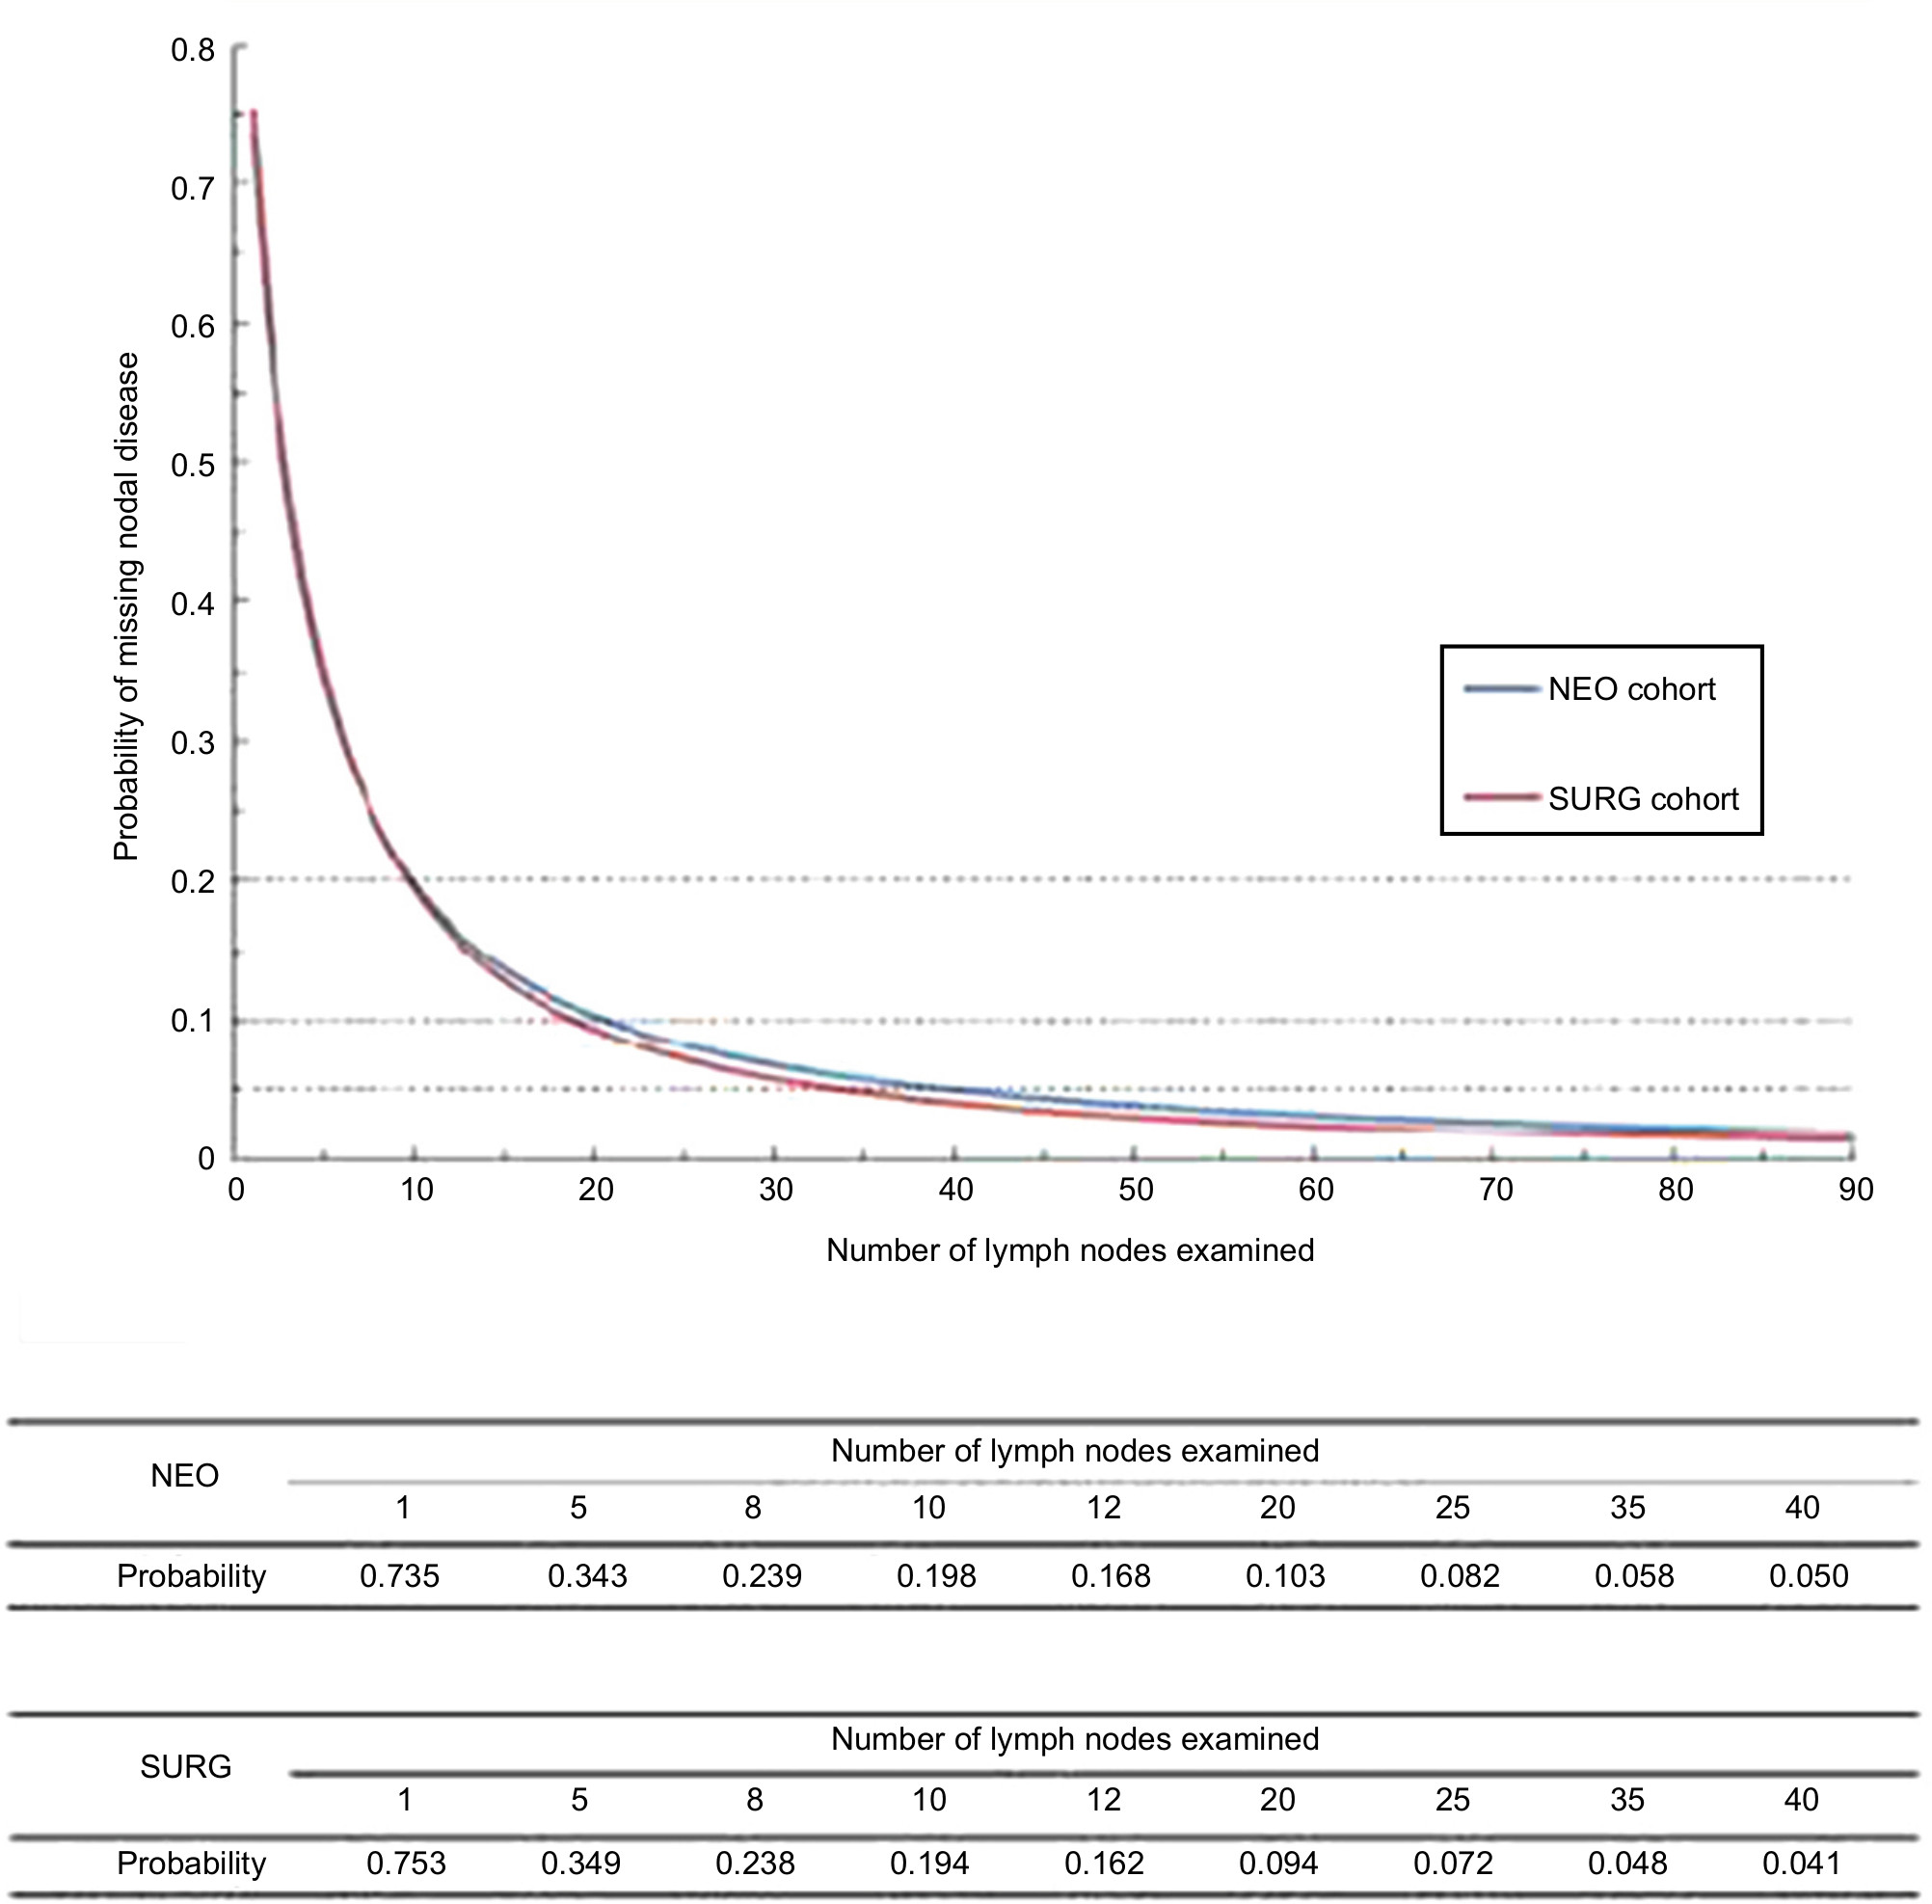 | Figure 2 Probability of missing nodal disease as a function of number of lymph nodes examined in a patient with truly lymph-positive disease for both SURG and NEO cohorts. |
The prevalence of nodal disease was 33.9% and the corrected prevalence was 41.5% (Table 2). False-negative LN underestimated prevalence, which existed across all pT stages and increased with the extension of pT stage. Also, 63.2% patients with pT4 stage RC are estimated to have nodal metastasis with a prevalence of 52.0%. The results of NSS are presented in Figure 3A. If 12 LNs were harvested, the true node-negative rate was 96.6% for pT1 patients, 93.6% for pT2, 80.2% for pT3, and only 77.6% for pT4 patients. With three and seven LNs, respectively, examined, those with pT1 and pT2 diseases are 90% likely to receive a correct pathological diagnosis. To achieve the same accuracy, patients with pT3 and pT4 diseases need to have 28 and >32 LNs evaluated, respectively.
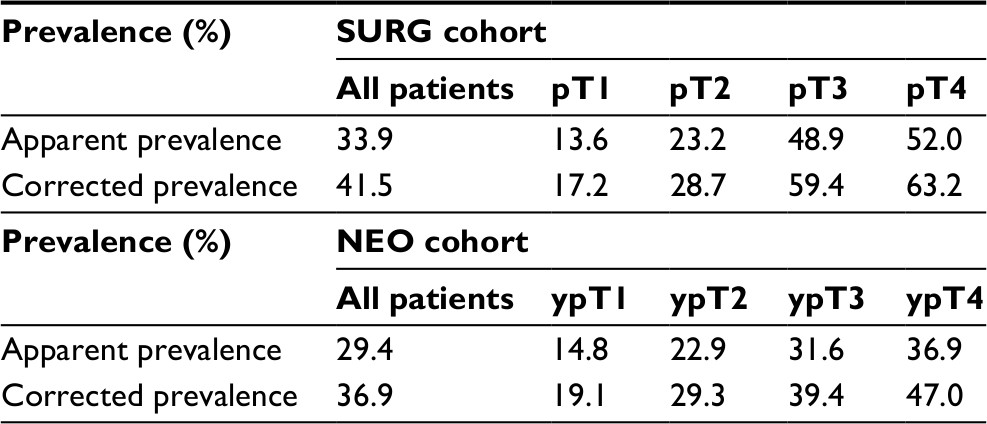 | Table 2 Apparent and corrected prevalence of nodal disease |
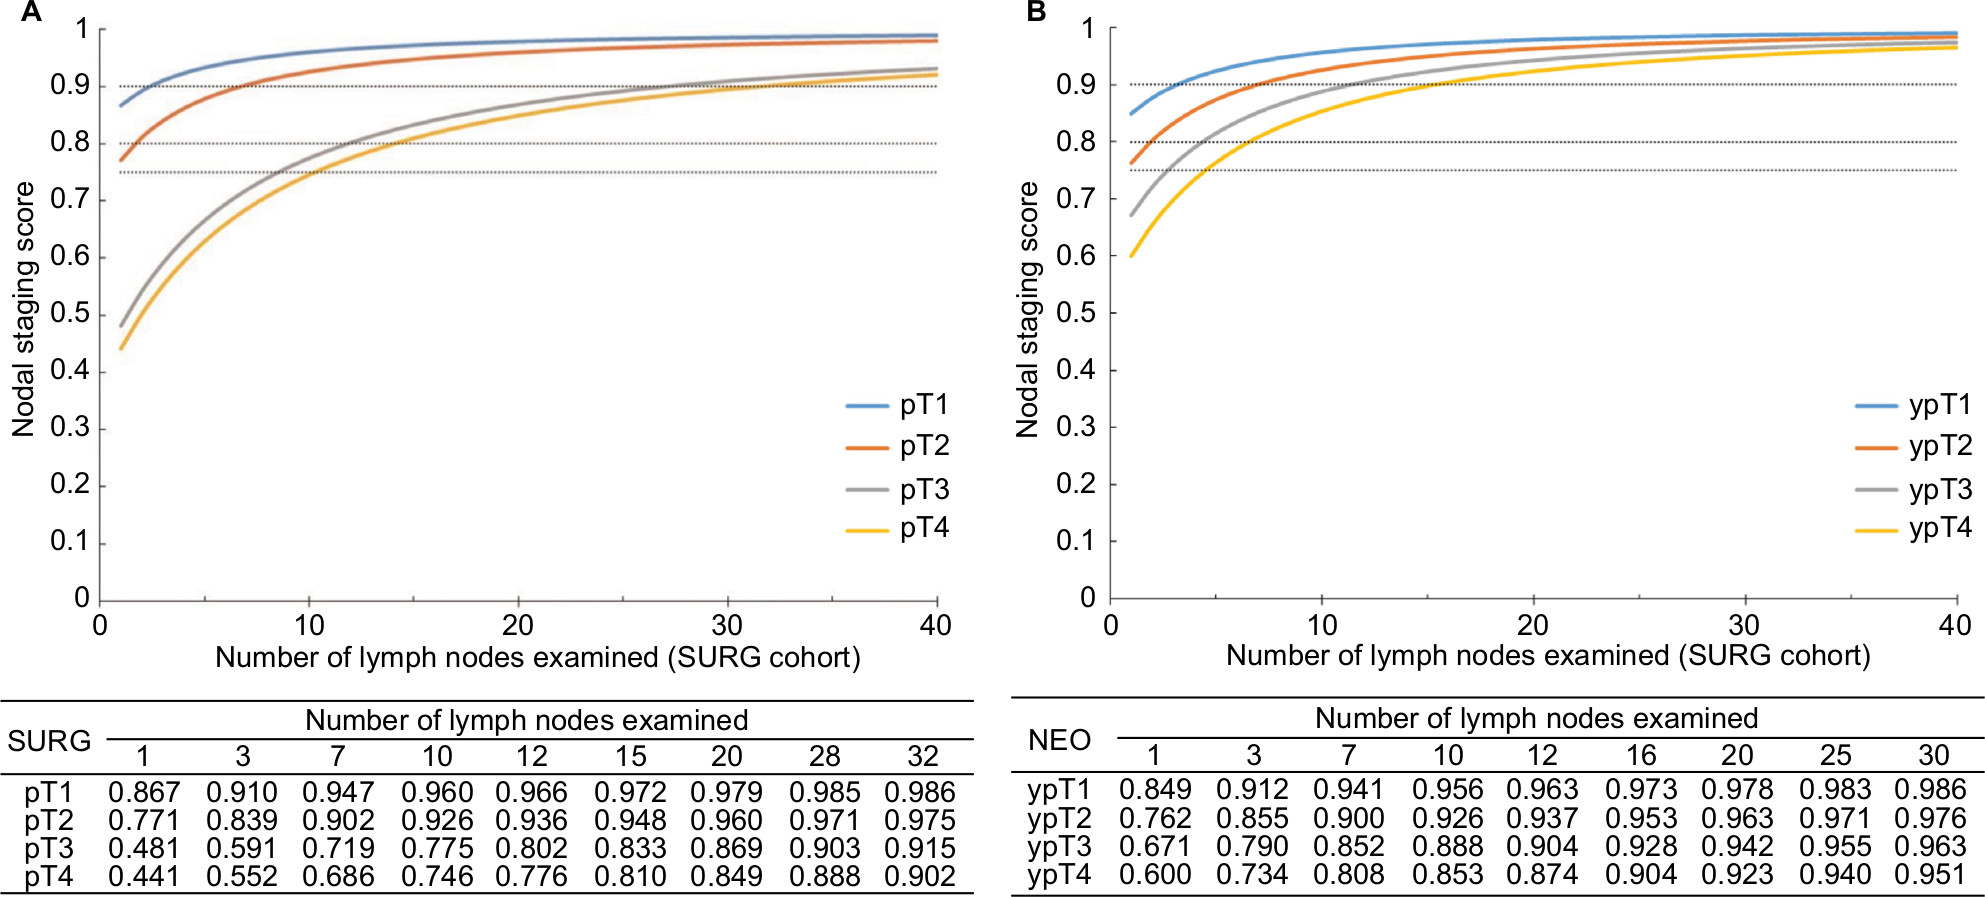 | Figure 3 Probability of truly node-negative disease as a function of number of nodes examined on the basis of pathological tumor stage for patients in SURG cohort (A) and NEO cohort (B). |
The estimates of survival probability are presented in Figure 4. There is no statistical significance between the four cancer-specific survival (CSS) curves in pT2 disease (P=0.28). However, the four curves are statistically different among pT1, pT3, and pT4 diseases (P<0.01).
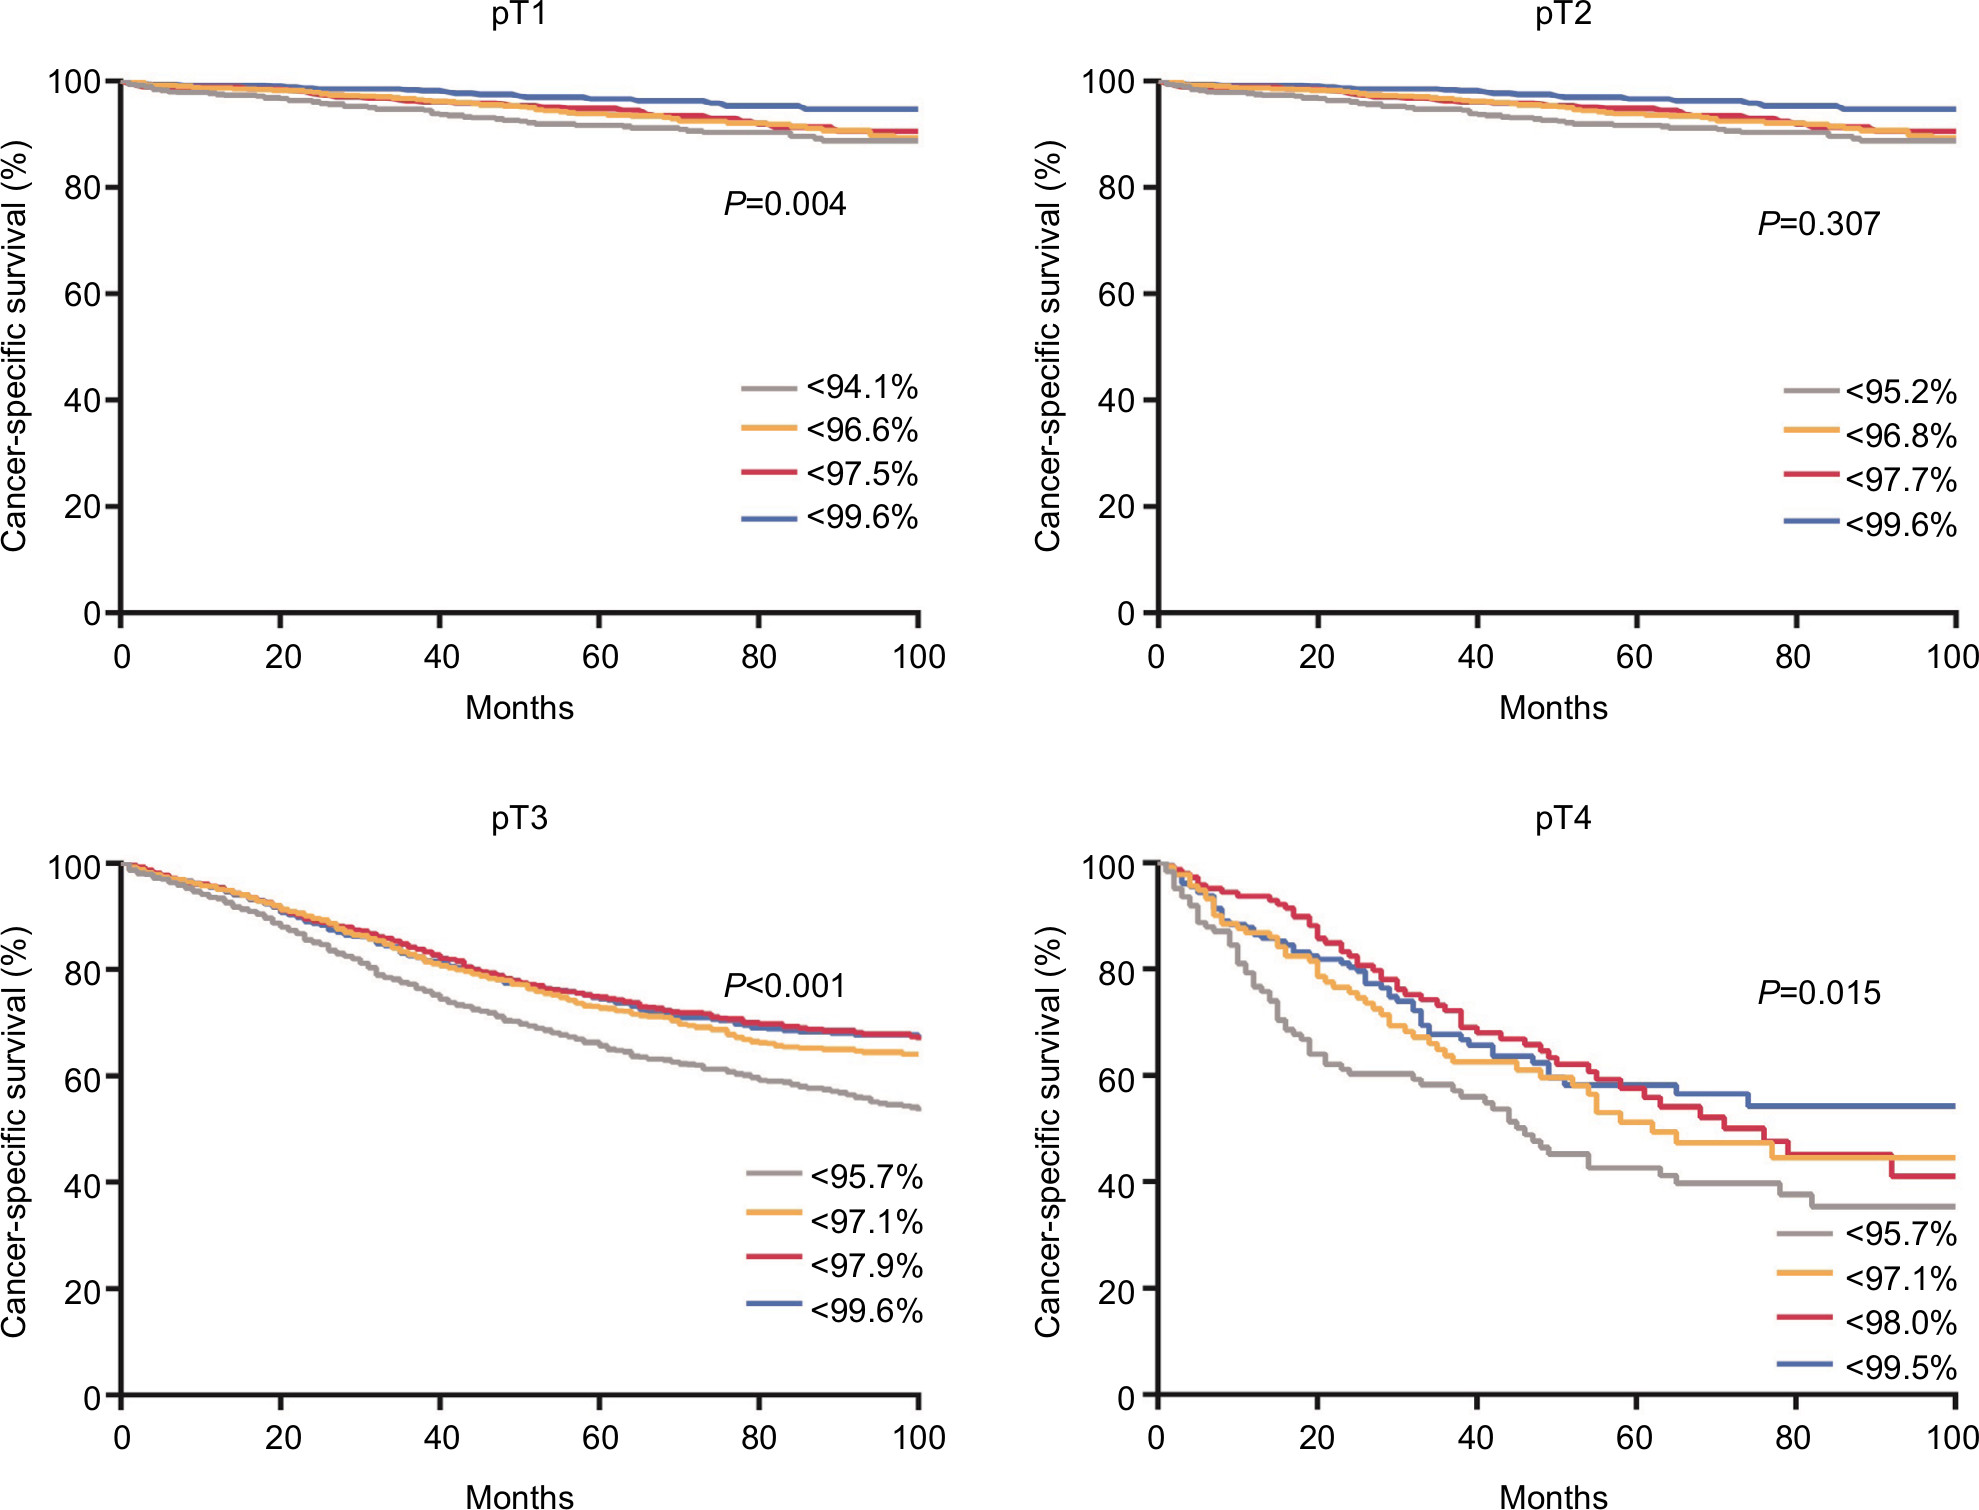 | Figure 4 Survival probabilities as a function of the quartiles of the predictive values stratified by pT stage for patients in the SURG cohort. Note: The quartiles were 0.941, 0.966, and 0.975 for pT1; 0.952, 0.968, and 0.996 for pT2; 0.957, 0.971, and 0.979 for pT3; and 0.957, 0.971, and 0.980 for pT4. |
Nodal staging score for RC patients with neoadjuvant therapy
In the NEO group, the average number of LNs examined was 12 and 52.4% patients were node-negative. α and β, the parameters of the beta-binomial model, were 1.38 (95% CI, 1.30–1.47) and 4.20 (95% CI, 3.84–4.59), respectively. As shown in Figure 2, the probability of missing positive LNs also dropped with increase in the number of LNs examined. The probabilities of excising false-negative LNs were 73.5%, 34.3%, 23.9%, 19.8%, 16.8%, 10.3%, and <5% for 1, 5, 8, 10, 12, 20, and >40 LNs examined, respectively.
The apparent prevalence of nodal disease was 29.4%, while the corrected prevalence was 36.9%, which were significantly lower than that in the SURG cohort (Table 2). Nodal staging scores of patients receiving neoadjuvant therapy are presented in Figure 3B. If 12 LNs were retrieved, the proportion for true node-negative disease was 96.3% for ypT1 patients, 93.7% for ypT2, 90.5% for ypT3, and 87.4% for ypT4 patients. When patients with ypT1 and ypT2 diseases have four and seven LNs examined, respectively, they will have a 90% possibility for correct diagnosis by pathologists. Nevertheless, patients with ypT3 and ypT4 diseases need to have 12 and over 16 LNs evaluated, respectively, to achieve the same accuracy.
Figure 5 indicates that there is no significant difference in CSS between the quartiles of NSS with ypT1, ypT3, and ypT4 tumors (P>0.05 for each of them), while the survival curves are separate only for ypT2 tumors (P=0.03).
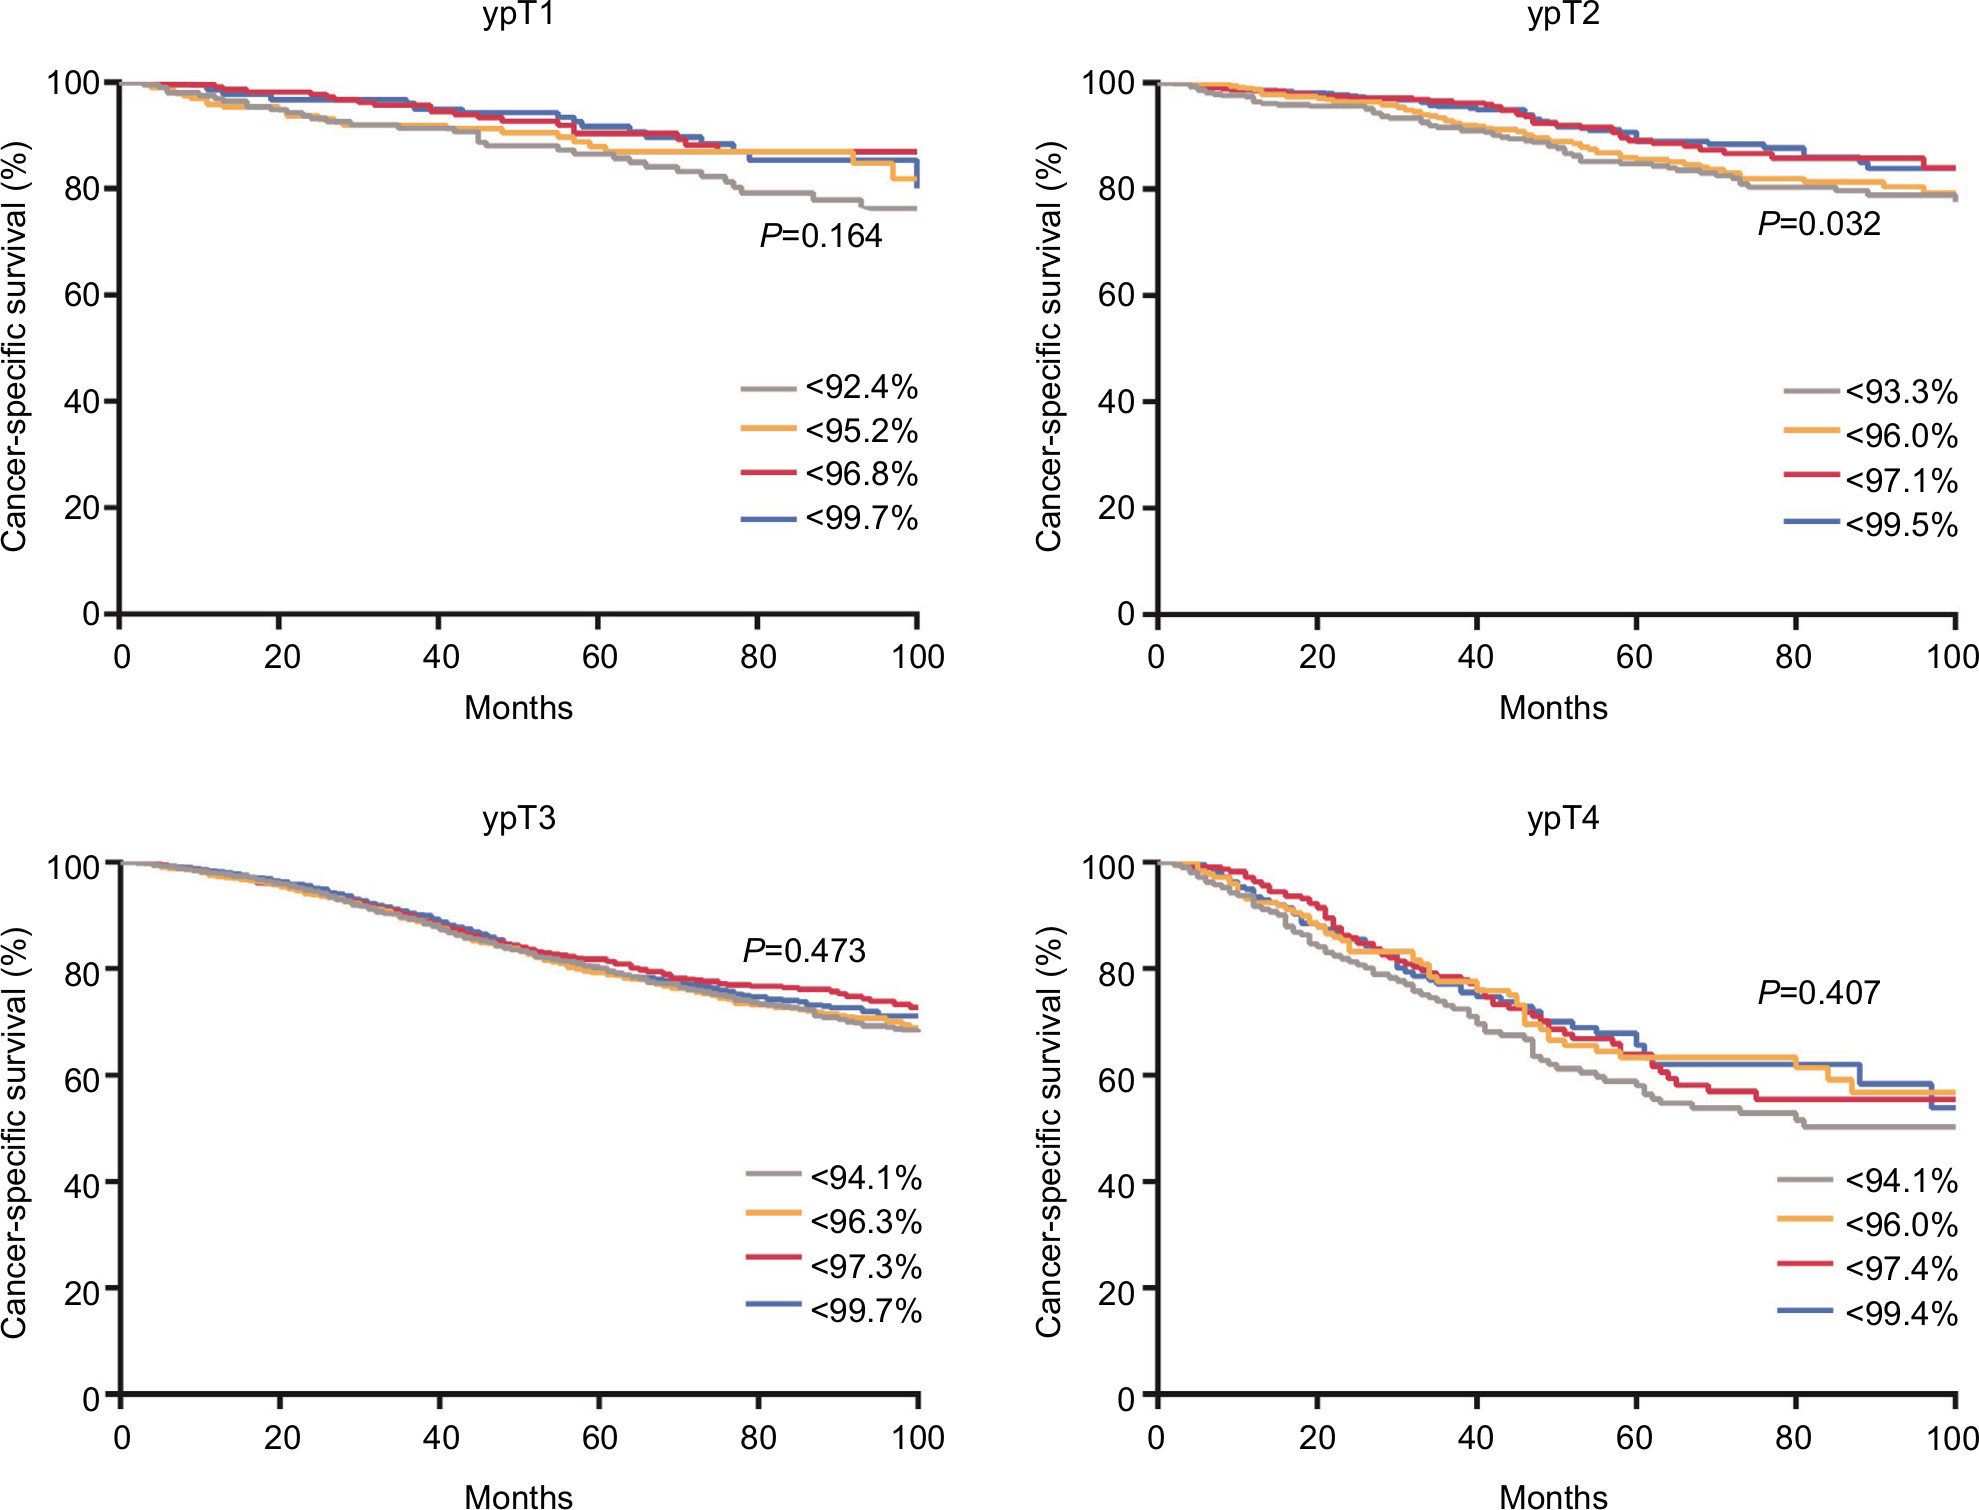 | Figure 5 Survival probabilities as a function of the quartiles of the predictive values stratified by ypT stage for patients in NEO cohort. Note: The quartiles were 0.924, 0.952, and 0.968 for ypT1; 0.933, 0.960, and 0.971 for ypT2; 0.941, 0.963, and 0.973 for ypT3; and 0.941, 0.960, and 0.974 for ypT4. |
Discussion
Nodal staging can predict the recurrence and survival of RC after radical resection. However, limited number of LNs examined will increase the possibility of understaging, which makes the postoperative management and surveillance difficult. Therefore, a series of studies have been performed, confirming that the number of LNs examined could dramatically impact patients’ prognosis. Recommendations for the minimum number of LNs examined vary from 10 to 23, yet no consensus has been reached.
In the present study, we found that NSS can accurately predict the real pN/ypN stage based on pT/ypT stage and the LNs examined. The probability of missing positive LNs decreases with increase in the number of LNs examined. Of note, to achieve a 90% NSS in the SURG cohort, patients with pT3 and pT4 diseases need to have 28 and 32 LNs examined, respectively. Our previous research based on SEER database indicated that RC patients at stages IIB and IIC present a poorer prognosis compared with patients at stage IIIA.19 We further investigated the prognosis of RC patients stratified by neoadjuvant therapy in our SEER database, which showed that pT4N0/ypT4N0 patients presented much worse CSS compared with stage IIIA and pT3N0/ypT3N0 patients (Figure S1). Up to 93.1% of RC patients at pT4 did not have enough nodes examined to guarantee true node-negative disease. Therefore, we speculate nearly all pT4 patients who had not undergone neoadjuvant therapy have been understaged and deserve highly intense adjuvant chemotherapy and close follow-up.
It is to be pointed out that preoperative radiation reduces the number of evaluable nodes.20,21 The requirement for the retrieval of nodes for patients who have received neoadjuvant therapy should be distinct from that for patients who underwent surgery directly. Furthermore, strategies of adjuvant therapy should also be tailored for patients after neoadjuvant therapy. In order to provide guidance for clinic, we specifically did separate analysis in patients of NEO cohort and found that two lesser nodes (13.3 vs 15.5, P<0.001) were examined compared with patients in the SURG cohort, while up to 35.3% of patients in the NEO group had <12 LNs examined. To achieve an NSS of 90%, only 12 nodes need to be examined for ypT3 and 16 nodes need to be examined for ypT4. A previous study using SEER database indicated that overall survival improved with increasing number of nodes examined for RC after neoadjuvant therapy.22 Therefore, a more reasonable cutoff value to guarantee true ypN0 is needed to avoid understaging. On the other hand, adjuvant chemotherapy is currently recommended by the National Comprehensive Cancer Network guidelines for all RC patients who have received neoadjuvant therapy, regardless of the surgical pathology results. However, several studies have questioned the need of adjuvant chemotherapy for ypN0 patients, especially for those with ypT0–2.23,24 Our model may help to identify the real subset of ypT1–2N0 patients who can avoid excessive treatment of adjuvant chemotherapy.
Strengths and limitations
NSS has several advantages. It reflects the probability of true node-negative disease. Its results are easy to grasp, due to which patients can make treatment decisions more easily. Unlike other models where accuracy improves dramatically after exceeding a certain threshold, our model reveals with the addition of LNs examined, the accuracy steadily improves. T stage can reflect how deep the original disease penetrates into the rectal wall, which is also linked with LNs involvement. Combining T stage with the number of LNs examined, our tool can predict the true nodal stage individually. What is more, it helps to individualize follow-up plans and treatment decisions. Actually, apart from tumor T stage, many inherent features of LNs, such as size and morphology, were also the possible factors reflecting LN metastasis.25–27 Previous results suggested that larger node size and spherical node were associated with higher positive rate. Therefore, future models can be improved by incorporating more valuable factors.
However, our study does have some limitations. First, it is retrospectively designed. Second, our model is mainly based on three assumptions. One of the assumptions is that there are no false positives: once an involved node is harvested, it will invariably be classified as positive second. Another assumption of the model is the use of the beta-binomial model, which is considered standard in the analysis of hierarchical binary data. The most controversial assumption is that nodes within a patient have the same probability of being involved, which implies that the number of examined nodes, regardless of location or other specific information, is the only factor that determines whether a truly node-positive patient will be misclassified as a node-negative patient. Although it seems impossible to hold, several studies support this argument by suggesting a lack of orderly progression in mesenteric LN metastasis. A recent study found no discrepancy in the incidence of LN metastasis among the anterior, bilateral, and posterior regions of the mesorectum.28 Besides, another study reported 47% sentinel LNs turned out negative in patients with positive LNs.29 Finally, the applicability of NSS in all manners of clinical situations should be externally validated. There is no established standard for true LN status; therefore, this model needs further validation so that it can be used to identify patients with high risk of missing negative LNs in diagnosis.
Conclusion
Based on the T stage and the number of LNs examined, NSS can evaluate the probability that negative LNs pathologically diagnosed are truly negative. Our recommendation is that the standard number of LNs examined be based on the expected accuracy for different pT/ypT stages. By determining whether a node-negative RC patient is adequately staged, NSS may help to identify those who need intensive adjuvant chemotherapy, to make follow-up plans for those without neoadjuvant therapy, and to screen among those receiving neoadjuvant therapy who benefit little from postoperative chemotherapy.
Data sharing statement
Any request of data and material may be sent to the corresponding author.
Acknowledgments
We appreciate the SEER program for making the database publicly available. This work was supported by the National Natural Science Foundation of China (grant no. 81572351).
Author contributions
Conception and design: Weixing Dai. Financial support: Guoxiang Cai, Ye Xu. Collection and assembly of data: Qingguo Li. Statistical analysis: Zhenyu Wu, Yang Feng. Manuscript writing: Yaqi Li. Final approval of manuscript: Gouxiang Cai, Qingguo Li. All authors contributed to data analysis, drafting or revising the article, gave final approval of the version to be published, and agree to be accountable for all aspects of the work.
Disclosure
The authors report no conflicts of interest in this work.
References
Siegel RL, Miller KD, Jemal A. Cancer statistics, 2016. CA Cancer J Clin. 2016;66(1):7–30. | ||
Chen W, Zheng R, Baade PD, et al. Cancer statistics in China, 2015. CA Cancer J Clin. 2016;66(2):115–132. | ||
Network. NCC. NCCN Guidelines Version 2.2016. 2016. | ||
Petersen SH, Harling H, Kirkeby LT, Wille-Jørgensen P, Mocellin S. Postoperative adjuvant chemotherapy in rectal cancer operated for cure. Cochrane Database Syst Rev. 2012;3(3):CD0040708. | ||
Nelson H, Petrelli N, Carlin A, et al. Guidelines 2000 for colon and rectal cancer surgery. J Natl Cancer Inst. 2001;93(8):583–596. | ||
American Joint Committee on Cancer. AJCC Cancer Staging Manual. 6th ed. New York, NY: Springer; 2002:113–124. | ||
Compton CC, Greene FL. The staging of colorectal cancer: 2004 and beyond. CA Cancer J Clin. 2004;54(6):295–308. | ||
de Campos-Lobato LF, Stocchi L, de Sousa JB, et al. Less than 12 nodes in the surgical specimen after total mesorectal excision following neoadjuvant chemoradiation: it means more than you think! Ann Surg Oncol. 2013;20(11):3398–3406. | ||
Govindarajan A, Gönen M, Weiser MR, et al. Challenging the feasibility and clinical significance of current guidelines on lymph node examination in rectal cancer in the era of neoadjuvant therapy. J Clin Oncol. 2011;29(34):4568–4573. | ||
Rullier A, Laurent C, Capdepont M, et al. Lymph nodes after preoperative chemoradiotherapy for rectal carcinoma: number, status, and impact on survival. Am J Surg Pathol. 2008;32(1):45–50. | ||
Kluth LA, Abdollah F, Xylinas E, et al. Pathologic nodal staging scores in patients treated with radical prostatectomy: a postoperative decision tool. Eur Urol. 2014;66(3):439–446. | ||
Ku JH, Kim HH, Kwak C. Nodal staging score: a tool for survival prediction of node-negative bladder cancer. Urol Oncol. 2013;31(8):1731–1736. | ||
Shariat SF, Ehdaie B, Rink M, et al. Clinical nodal staging scores for bladder cancer: a proposal for preoperative risk assessment. Eur Urol. 2012;61(2):237–242. | ||
Shariat SF, Rink M, Ehdaie B, et al. Pathologic nodal staging score for bladder cancer: a decision tool for adjuvant therapy after radical cystectomy. Eur Urol. 2013;63(2):371–378. | ||
Kluth LA, Abdollah F, Xylinas E, et al. Clinical nodal staging scores for prostate cancer: a proposal for preoperative risk assessment. Br J Cancer. 2014;111(2):213–219. | ||
Gönen M, Schrag D, Weiser MR. Nodal staging score: a tool to assess adequate staging of node-negative colon cancer. J Clin Oncol. 2009;27(36):6166–6171. | ||
Robinson TJ, Thomas S, Dinan MA, et al. How many lymph nodes are enough? Assessing the adequacy of lymph node yield for papillary thyroid cancer. J Clin Oncol. 2016;34(28):3434–3439. | ||
Efron B, Tibshirani R. An Introduction to the Bootstrap. London: Chapman and Hall; 1994. | ||
Huang B, Mo S, Zhu L, Xu T, Cai G. The survival and clinicopathological differences between patients with stage IIIA and stage II rectal cancer: an analysis of 12,036 patients in the SEER database. Oncotarget. 2016;7(48):79787–79796. | ||
Wichmann MW, Müller C, Meyer G, et al. Effect of preoperative radiochemotherapy on lymph node retrieval after resection of rectal cancer. Arch Surg. 2002;137(2):206–210. | ||
Baxter NN, Morris AM, Rothenberger DA, Tepper JE. Impact of preoperative radiation for rectal cancer on subsequent lymph node evaluation: a population-based analysis. Int J Radiat Oncol Biol Phys. 2005;61(2):426–431. | ||
Li Q, Zhuo C, Liang L, et al. Lymph node count after preoperative radiotherapy is an independently prognostic factor for pathologically lymph node-negative patients with rectal cancer. Medicine. 2015;94(3):e395. | ||
Kiran RP, Kirat HT, Burgess AN, et al. Is adjuvant chemotherapy really needed after curative surgery for rectal cancer patients who are node-negative after neoadjuvant chemoradiotherapy? Ann Surg Oncol. 2012;19(4):1206–1212. | ||
Govindarajan A, Reidy D, Weiser MR, et al. Recurrence rates and prognostic factors in ypN0 rectal cancer after neoadjuvant chemoradiation and total mesorectal excision. Ann Surg Oncol. 2011;18(13):3666–3672. | ||
Tanaka T, Nozawa H, Kawai K, et al. Lymph node size on computed tomography images is a predictive indicator for lymph node metastasis in patients with colorectal neuroendocrine tumors. In Vivo. 2017;31(5):1011–1017. | ||
Choi J, Oh SN, Yeo DM, et al. Computed tomography and magnetic resonance imaging evaluation of lymph node metastasis in early colorectal cancer. World J Gastroenterol. 2015;21(2):556–562. | ||
Langhans L, Bilde A, Charabi B, Therkildsen MH, von Buchwald C. Evaluation of sentinel lymph node size and shape as a predictor of occult metastasis in patients with squamous cell carcinoma of the oral cavity. Eur Arch Otorhinolaryngol. 2013;270(1):249–254. | ||
Yao YF, Wang L, Liu YQ, Li JY, Gu J. Lymph node distribution and pattern of metastases in the mesorectum following total mesorectal excision using the modified fat clearing technique. J Clin Pathol. 2011;64(12):1073–1077. | ||
Finan KR, Lewis JS, Winslow E, Mutch MG, Birnbaum EH, Fleshman JW. Ex vivo sentinel lymph node mapping in patients undergoing proctectomy for rectal cancer. Dis Colon Rectum. 2010;53(3):243–250. |
Supplementary material
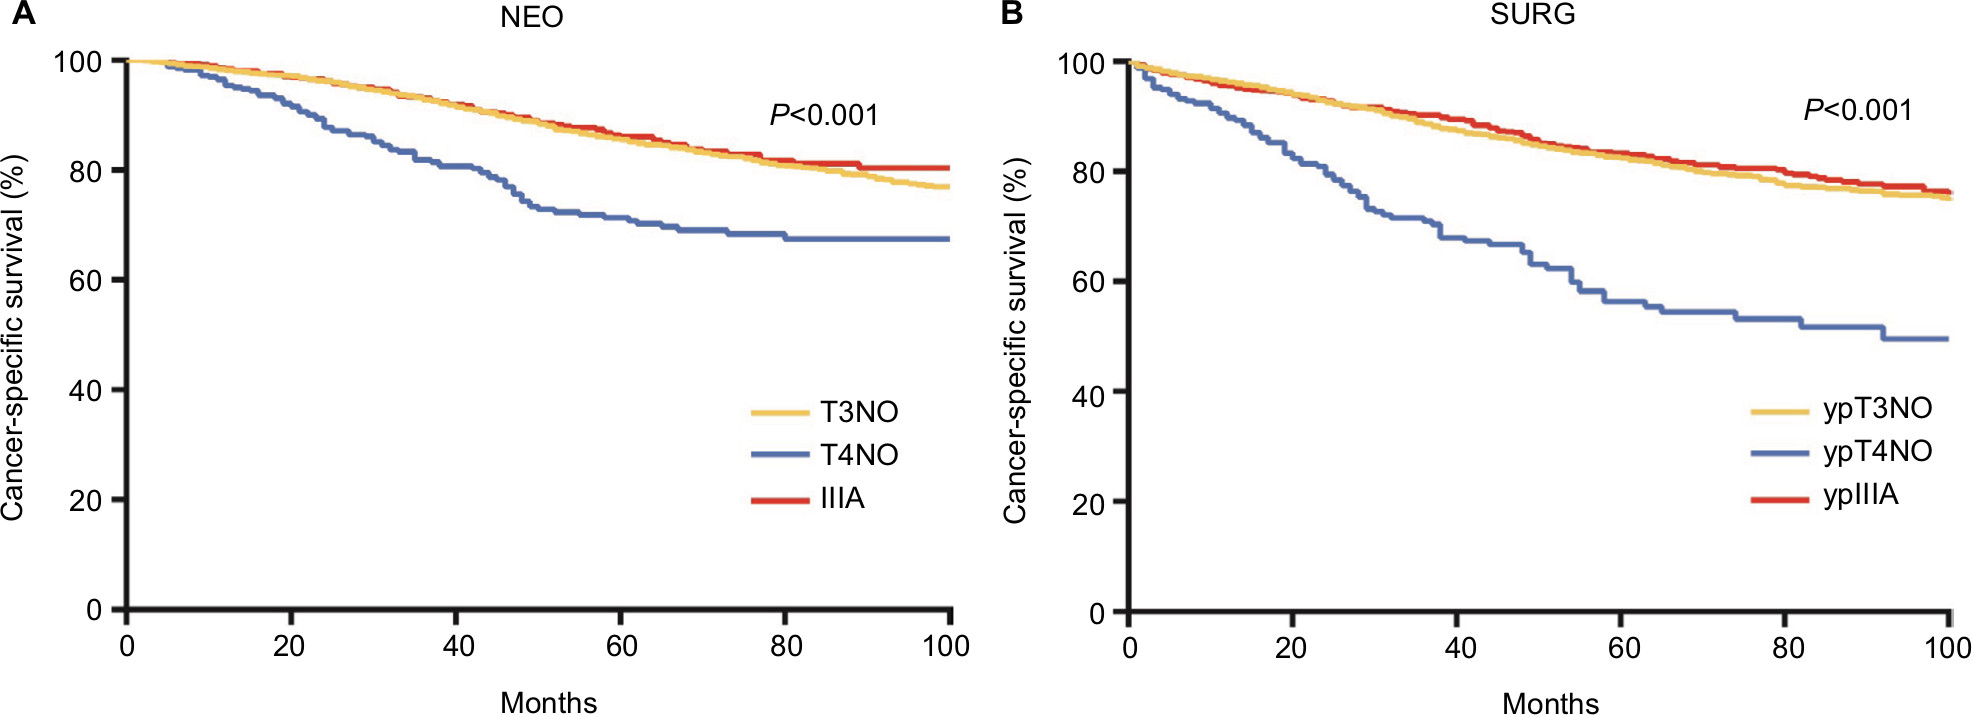 | Figure S1 Cancer-specific survival analysis of pT4N0/ypT4N0 patients compared with patients at stage IIIA and pT3N0/ypT3N0 in both SURG (A) and NEO (B) cohorts. |
 © 2019 The Author(s). This work is published and licensed by Dove Medical Press Limited. The
full terms of this license are available at https://www.dovepress.com/terms
and incorporate the Creative Commons Attribution
- Non Commercial (unported, 3.0) License.
By accessing the work you hereby accept the Terms. Non-commercial uses of the work are permitted
without any further permission from Dove Medical Press Limited, provided the work is properly
attributed. For permission for commercial use of this work, please see paragraphs 4.2 and 5 of our Terms.
© 2019 The Author(s). This work is published and licensed by Dove Medical Press Limited. The
full terms of this license are available at https://www.dovepress.com/terms
and incorporate the Creative Commons Attribution
- Non Commercial (unported, 3.0) License.
By accessing the work you hereby accept the Terms. Non-commercial uses of the work are permitted
without any further permission from Dove Medical Press Limited, provided the work is properly
attributed. For permission for commercial use of this work, please see paragraphs 4.2 and 5 of our Terms.