Back to Journals » Nature and Science of Sleep » Volume 18

Patch-Type Heart Rate Variability Analysis with Artificial Intelligence for Detection of Obstructive Sleep Apnea
Authors Hsu YS ![]() , Lin YC, Kuo YE, Chou CH, Chou MC, Chang Y, Jacobowitz O
, Lin YC, Kuo YE, Chou CH, Chou MC, Chang Y, Jacobowitz O ![]() , Lin CM, Lo SC
, Lin CM, Lo SC ![]() , Kuo TBJ
, Kuo TBJ ![]() , Yang CCH
, Yang CCH
Received 24 September 2025
Accepted for publication 16 January 2026
Published 5 February 2026 Volume 2026:18 568569
DOI https://doi.org/10.2147/NSS.S568569
Checked for plagiarism Yes
Review by Single anonymous peer review
Peer reviewer comments 2
Editor who approved publication: Dr Marco Veneruso
Ying-Shuo Hsu,1– 4 Yu-Cheng Lin,1 Yu-En Kuo,1,2 Cheng-Han Chou,4 Mei-Chun Chou,5 Yi Chang,6 Ofer Jacobowitz,7 Chia-Mo Lin,8– 10 Shih-Chieh Lo,1,11 Terry BJ Kuo,1,2,12– 14 Cheryl CH Yang1,2,12,13
1Institute of Brain Science, National Yang Ming Chiao Tung University, Taipei, Taiwan; 2Sleep Research Center, National Yang Ming Chiao Tung University, Taipei, Taiwan; 3Department of Otolaryngology, Shin Kong Wu-Ho-Su Memorial Hospital, Taipei, Taiwan; 4School of Medicine, Fu Jen Catholic University, New Taipei City, Taiwan; 5Department of Emergency Medicine, Fu Jen Catholic University Hospital, New Taipei City, Taiwan; 6Department of Anesthesiology, Shin Kong Wu Ho-Su Memorial Hospital, Taipei, Taiwan; 7Sleep Department, ENT and Allergy Associates, New York, NY, USA; 8Division of Chest Medicine, Shin Kong Wu Ho-Su Memorial Hospital, Taipei City, Taiwan; 9Department of Chemistry, Fu Jen Catholic University, New Taipei City, Taiwan; 10Graduate Institute of Biomedical and Pharmaceutical Science, Fu Jen Catholic University, New Taipei City, Taiwan; 11Leading Dental Group, Taipei, Taiwan; 12Brain Research Center, National Yang Ming Chiao Tung University, Taipei, Taiwan; 13Department of Education and Research, Taipei City Hospital, Taipei, Taiwan; 14Clinical Research Center, Taoyuan Psychiatric Center Ministry of Health and Welfare, Taoyuan, Taiwan
Correspondence: Terry BJ Kuo, Institute of Brain Science, National Yang Ming Chiao Tung University, No. 155, Section 2, Linong Street, Beitou District, Taipei, Taiwan, Email [email protected] Cheryl CH Yang, Institute of Brain Science, National Yang Ming Chiao Tung University, No. 155, Section 2, Linong Street, Beitou District, Taipei, Taiwan, Email [email protected]
Background: Obstructive sleep apnea (OSA) affects millions in Taiwan, but common screening tools, such as oximeters and ApneaLink®, may reduce sleep quality and have limited accuracy.
Methods: We enrolled 277 adults with self- or family-observed snoring. All underwent home sleep apnea testing (HSAT) via ApneaLink® and simultaneous overnight monitoring with a patch-type heart rate variability (HRV) analyzer. After strict data quality control, 86 subjects remained. HRV indices from ECG signals were processed using time-, frequency-, and nonlinear-domain analyses. An artificial intelligence (AI) model, incorporating a novel Cardiovascular Hypopnea Index (CVHI), was developed using leave-one-out validation.
Results: The AI model achieved 81.4% accuracy, outperforming demographic-based (73%) and previous ECG-based (70.6%) screening. At an apnea–hypopnea index (AHI) cutoff of 15, it showed strong classification for moderate-to-severe OSA (AUC > 0.8).
Conclusion: The patch-type HRV analyzer with AI analysis provides accurate, low-interference OSA screening, suitable for large-scale clinical and home use.
Keywords: home sleep testing, autonomic nervous system function, patch type heart rate analyzer
Introduction
OSA is a sleep disorder characterized by upper airway collapse or obstruction during sleep, resulting in episodes of apnea and poor sleep quality. Patients with OSA may present with a variety of symptoms and clinical signs, including loud and persistent snoring, gasping or choking during sleep, excessive daytime sleepiness, morning headaches, difficulty concentrating, irritability, and restless sleep patterns.1 In addition, OSA is associated with numerous comorbidities and complications. Studies have demonstrated that individuals with OSA are at increased risk for hypertension, cardiovascular diseases (including heart disease and stroke), type 2 diabetes, and even sudden cardiac death.2–6
The estimated prevalence of OSA was high. Benjafield et al further estimated that approximately 425 million adults worldwide suffer from moderate to severe OSA,7 indicating that OSA is becoming increasingly prevalent in modern society.
Despite its high prevalence and significant public health implications, OSA remains a widely underdiagnosed condition. Studies have shown that a large proportion of individuals with OSA are unaware of their condition. In the United States, it is estimated that approximately 82% of men and 93% of women with OSA remain undiagnosed.8
Diagnosing OSA itself is challenging, and monitoring treatment efficacy is even more difficult. While therapeutic options such as continuous positive airway pressure (CPAP), oral appliances, and surgery are available, long-term adherence and efficacy monitoring remain challenging. Specifically, statistics indicate that fewer than half of the patients who undergo surgery for OSA return for follow-up evaluation, thereby impeding the ability to assess the effectiveness of treatment interventions. As such, the development of a convenient and accurate follow-up tool is crucial.
Our laboratory is currently focused on developing a patch-type HRV analyzer as a potential hardware solution for OSA monitoring, and key progress has been made in this area. However, to enhance the clinical utility of this device, the primary objective of this study is to develop a dedicated AI algorithm tailored to the HRV patch for the screening and monitoring of treatment outcomes in patients with OSA.
Polysomnography (PSG) is the gold standard for evaluating OSA. PSG is an 8-hour, laboratory-based sleep study conducted under standardized scoring criteria for OSA- related respiratory events.9 However, PSG must be conducted in a hospital setting, which is time-consuming and requires expensive equipment. This limits its practicality for large-scale diagnosis of OSA. Therefore, there is a need for convenient and cost- effective home-based sleep testing methods.
Home Sleep Apnea Testing (HSAT) typically involves monitoring 4 to 7 physiological signals, including airflow (via thermistors and nasal pressure sensors), respiratory effort (using inductive plethysmography), and oxygen saturation, to assess sleep-disordered breathing and assist in diagnosing OSA.10
Although HSAT offers high convenience for many patients, it is primarily suited for preliminary screening and diagnostic confirmation in patients deemed high-risk for OSA based on sleep history.11
With advances in technology, ECG, which was previously limited to medical institutions, has evolved into portable and wearable devices suitable for home use. Furthermore, measurement techniques have shifted from complex multi-lead systems to simplified single-lead monitoring to enhance user convenience and compliance. Currently, wearable ECG devices are widely used for home or continuous 24-hour monitoring and recording. Among these, patch-type devices offer greater wearer comfort and adherence, thereby improving feasibility and willingness to use.
Previous studies have indicated that ECG signals recorded overnight can be used to quantify the cyclic variation of heart rate (CVHR), a concept introduced by Guilleminault et al, which can serve as a screening method for OSA.12 Observational studies found that during OSA episodes, patients typically exhibit a gradual decrease in heart rate, followed by a sudden increase upon resumption of breathing. The advantage of this method lies in its ability to provide non-invasive and comfortable sleep monitoring. When used with modern single-lead ECG devices, it becomes particularly well-suited for multi- day continuous recordings and long-term physiological sleep assessments. However, earlier algorithms relied on restricted feature sets. For instance, the Cyclic Variation of Heart Rate (CVHR), introduced by Guilleminault et al12 is a specific ECG feature that has shown limited utility and cannot accurately represent the severity and frequency of OSA on its own. Similarly, cardiopulmonary coupling, developed by Thomas et al,13–15 is based on a single ECG-derived characteristic. As such, it is unable to fully capture the comprehensive information embedded in the ECG signal and, likewise, lacks the precision to adequately reflect the severity and occurrence frequency of OSA.
Moreover, based on our previous research, patch-type HRV devices combined with tri-axial accelerometers can also be applied to screen for OSA. By synchronously recording heart rate and body position changes, diagnostic accuracy can be improved.16 Using this approach, the accuracy for detecting moderate to severe OSA was approximately 70.6%. This technology enables long-duration data collection—up to one week—without significant discomfort to the user. An additional benefit is the ability to capture more sleep time in the lateral position. This is particularly advantageous for severe OSA patients, as sleep in the laboratory setting typically involves extended supine positioning, and the presence of multiple sensor wires may interfere with sleep quality and natural sleep behavior.17
Although this method has demonstrated a reasonable screening accuracy in past studies, its performance is still limited. Many individuals screened using this method later presented with significantly different diagnostic results upon further hospital evaluation. The discrepancy may be due to the overly simplistic nature of the current metrics used in the screening algorithm. Therefore, to enhance the utility and accuracy of the patch-type HRV analyzer for OSA screening and triage, it is necessary to incorporate more parameters into the computation. Given the increased complexity of calculations, the application of modern AI methods is required to identify the most representative and reliable composite indicators for OSA.
Currently, patch-type HRV analyzers have been applied in various other medical fields, including investigations of vasomotor activity and baroreflex sensitivity in the sleep–wake cycle, monitoring responses to food image stimuli, analyzing autonomic responses during reading, and evaluating sleep quality and sleep onset in children with OSA.18–21
ECG signals can be used to calculate the R-R interval (RRI) time series through analytical software. From these signals, time-domain (mean, standard deviation, root mean square of successive differences, etc)., frequency-domain (total power, high- frequency, and low-frequency components), and nonlinear (entropy, multiscale entropy, detrended fluctuation analysis, etc). HRV indices can be extracted.22,23
However, no prior studies have integrated these indicators using AI techniques to improve OSA diagnostic accuracy.
Therefore, this study will utilize HRV indices recorded and calculated from a patch-type HRV analyzer, combined with AI methods, to identify the most accurate predictive model for OSA screening. This approach aims to enable convenient, standalone screening and post-treatment follow-up of OSA using wearable HRV devices in the future.
Materials and Methods
This study recruited patients who sought medical evaluation and consultation due to snoring. To identify and stratify the severity of sleep-disordered breathing, the ApneaLink® device (ResMed, Sydney, Australia) (Figure 1) was employed as a home sleep testing tool for the screening of OSA. The device provides information including the AHI, number of desaturation and respiratory events, and the lowest oxygen saturation level during sleep. This device is widely used in the clinical assessment of patients with OSA and is regarded as a reference standard for screening. Simultaneously, a patch-type HRV analyzer (Figure 2) was used to monitor overnight physiological signals. This device was developed by Professors Terry B J Kuo and Cheryl C H Yang at National Yang Ming Chiao Tung University (certified by the Ministry of Health and Welfare, Medical Device License No. 004896). It simultaneously records ECG signals and data from a 3-axis accelerometer and calculates HRV–related indices. The internal structure of the analyzer has been continuously optimized in our laboratory. It includes an SD card and Bluetooth module for data transmission (block diagram shown in Figure 3). The device is affixed to the subject’s chest skin and is capable of continuously recording for up to 24 hours, providing data on HRV trends and physical activity status throughout the night.
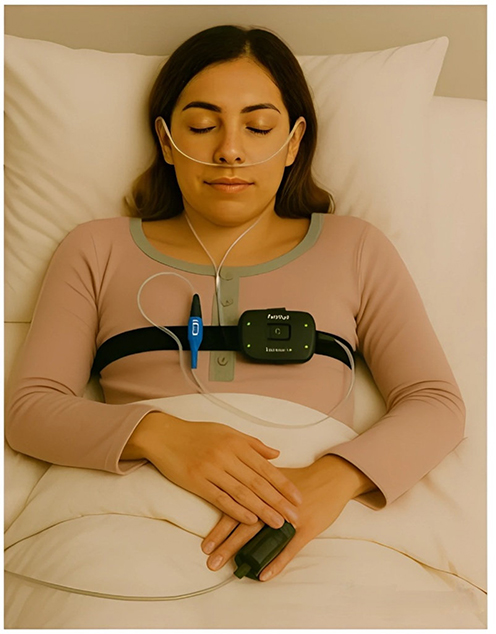 |
Figure 1 ApneaLink home sleep apnea testing device. The device is capable of measuring blood oxygen saturation, nasal airflow, thoracic movements, heart rate, and sleep posture during sleep, allowing for the calculation of the AHI. Image generated by ChatGPT (OpenAI, San Francisco, CA, USA). |
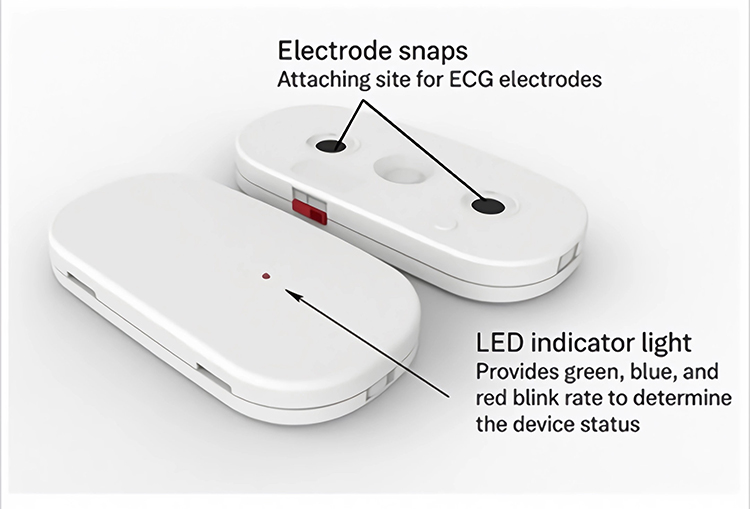 |
Figure 2 External appearance of the HRV Patch. The device was developed by Professors Terry B J Kuo and Cheryl C H Yang at National Yang Ming Chiao Tung University (certified by the Ministry of Health and Welfare, Medical Device License No. 004896). |
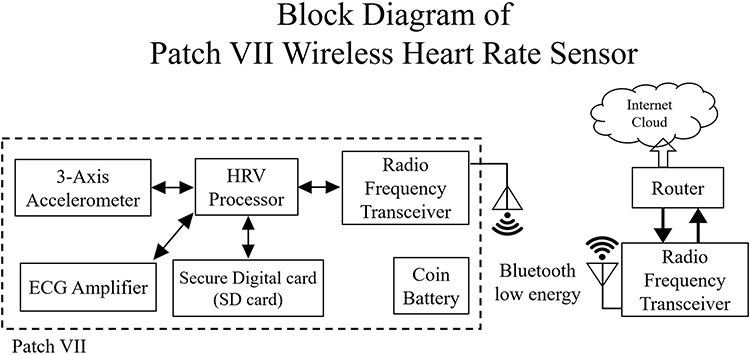 |
Figure 3 Block diagram of the 7th-generation HRV patch system. |
The parameters obtained from the home sleep apnea test and the patch-type HRV analyzer were analyzed and compared. In addition, AI methods were applied to these data to develop models for identifying and stratifying the severity of OSA in patients (Figure 4).
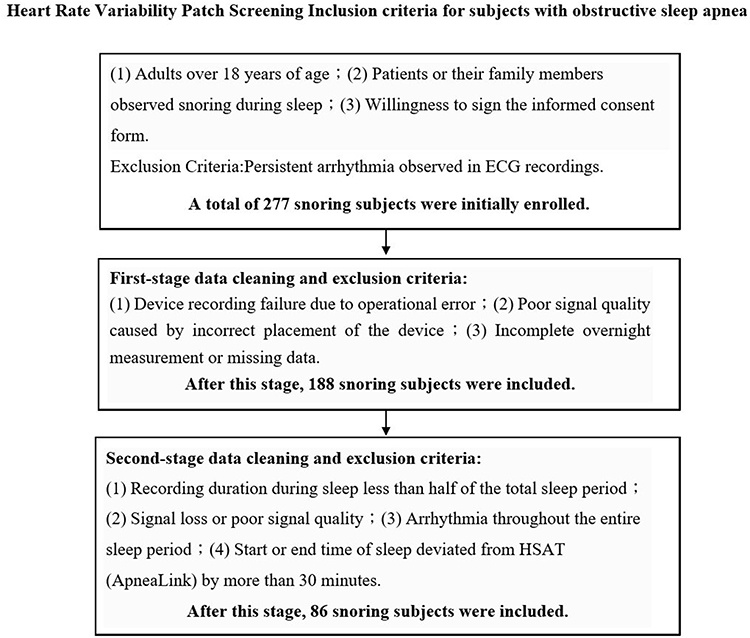 |
Figure 4 Inclusion criteria for participants in the patch-type HRV analyzer screening for OSA. |
The inclusion criteria for this study were as follows:
1. Adult patients aged over 18 years.
2. Presence of snoring during sleep, either self-reported or observed by family members.
The exclusion criterion was:
Presence of persistent cardiac arrhythmia observed on the ECG recording.
A total of 277 participants were initially enrolled for data analysis. However, as this study involved home-based testing, the participants’ usage conditions and compliance could not be fully controlled. Factors such as improper device operation, incorrect device placement leading to poor signal quality, incomplete overnight recordings, or missing data resulted in a need for data cleaning and exclusion. After applying these exclusion criteria, data from 188 participants were deemed valid and included in the final analysis.
All collected measurements and recording data were reviewed to verify their validity. Initially, participant demographic data, completeness of questionnaires, sleep onset time, total sleep duration, and recording quality were examined. For data recorded by the HSAT device, completeness of both raw data and generated reports was assessed. Data from the patch-type HRV analyzer were evaluated using the following criteria: (1) ECG and HRV data covering less than half of the sleep period (eg, only 1–2 hours recorded); (2) erroneous RRI data accounting for half or more of the sleep period (defined as RRI values outside the mean ± 2 standard deviations); (3) exclusion of recordings with persistent arrhythmias during the entire sleep period; (4) exclusion of recordings where sleep duration or start and end times recorded by the HRV patch and HSAT differed significantly (discrepancy exceeding 30 minutes); (5) exclusion of recordings with signal loss or poor quality during sleep. After applying these criteria to ensure data integrity and reliability, HRV indices were usable for 86 participants.
The ECG signals recorded by the HRV patch were used to derive R-R interval time series and to quantify time-domain and frequency-domain HRV indices via laboratory software. Time-domain indices included the mean of normal-to-normal (N-N) intervals, the standard deviation of N-N intervals (SDNN), and the root mean square of successive differences (RMSSD). Frequency-domain indices included total power (0.0033–0.4 Hz), very low frequency (VLF) power (0.0033–0.04 Hz), low frequency (LF) power (0.04–0.15 Hz), normalized LF power (LF%), high frequency (HF) power (0.15–0.4 Hz), and the LF/HF ratio. Time-series values across the night were further summarized using the median, standard deviation, and the 65th and 35th percentiles, resulting in 40 HRV indices per participant.
Additionally, the HRV patch also captured ECG R and S wave amplitudes, which were used alongside RRI data for further analysis. Erroneous beats were excluded (RRI values outside the mean ± 2 SD). For time-domain analysis, a 10-minute window with 50% overlap (ie, every 5 minutes) was applied. Statistical methods, geometric triangular measures, second-order difference plots, N–N difference techniques, and multiscale Poincaré analysis were used.
For frequency-domain analysis, abnormal values were excluded, and the remaining unevenly sampled RRI time series was resampled to an evenly spaced signal at 4 Hz using linear interpolation. Each windowed segment was then demeaned and multiplied by a Hamming window prior to spectral estimation and subsequently analyzed using the fast Fourier transform (FFT). In addition to traditional indices (TP, VLF, LF, HF, LF%, HF%, LF/HF), spectral entropy, skewness, and kurtosis were used to quantify spectral concentration and complexity. Multiscale entropy (MSE), detrended fluctuation analysis (DFA), and probability density functions (PDF) were also applied. The time series were summarized using median, standard deviation, and 65th and 15th percentiles, resulting in 375 HRV-related indices per participant (Table 1).
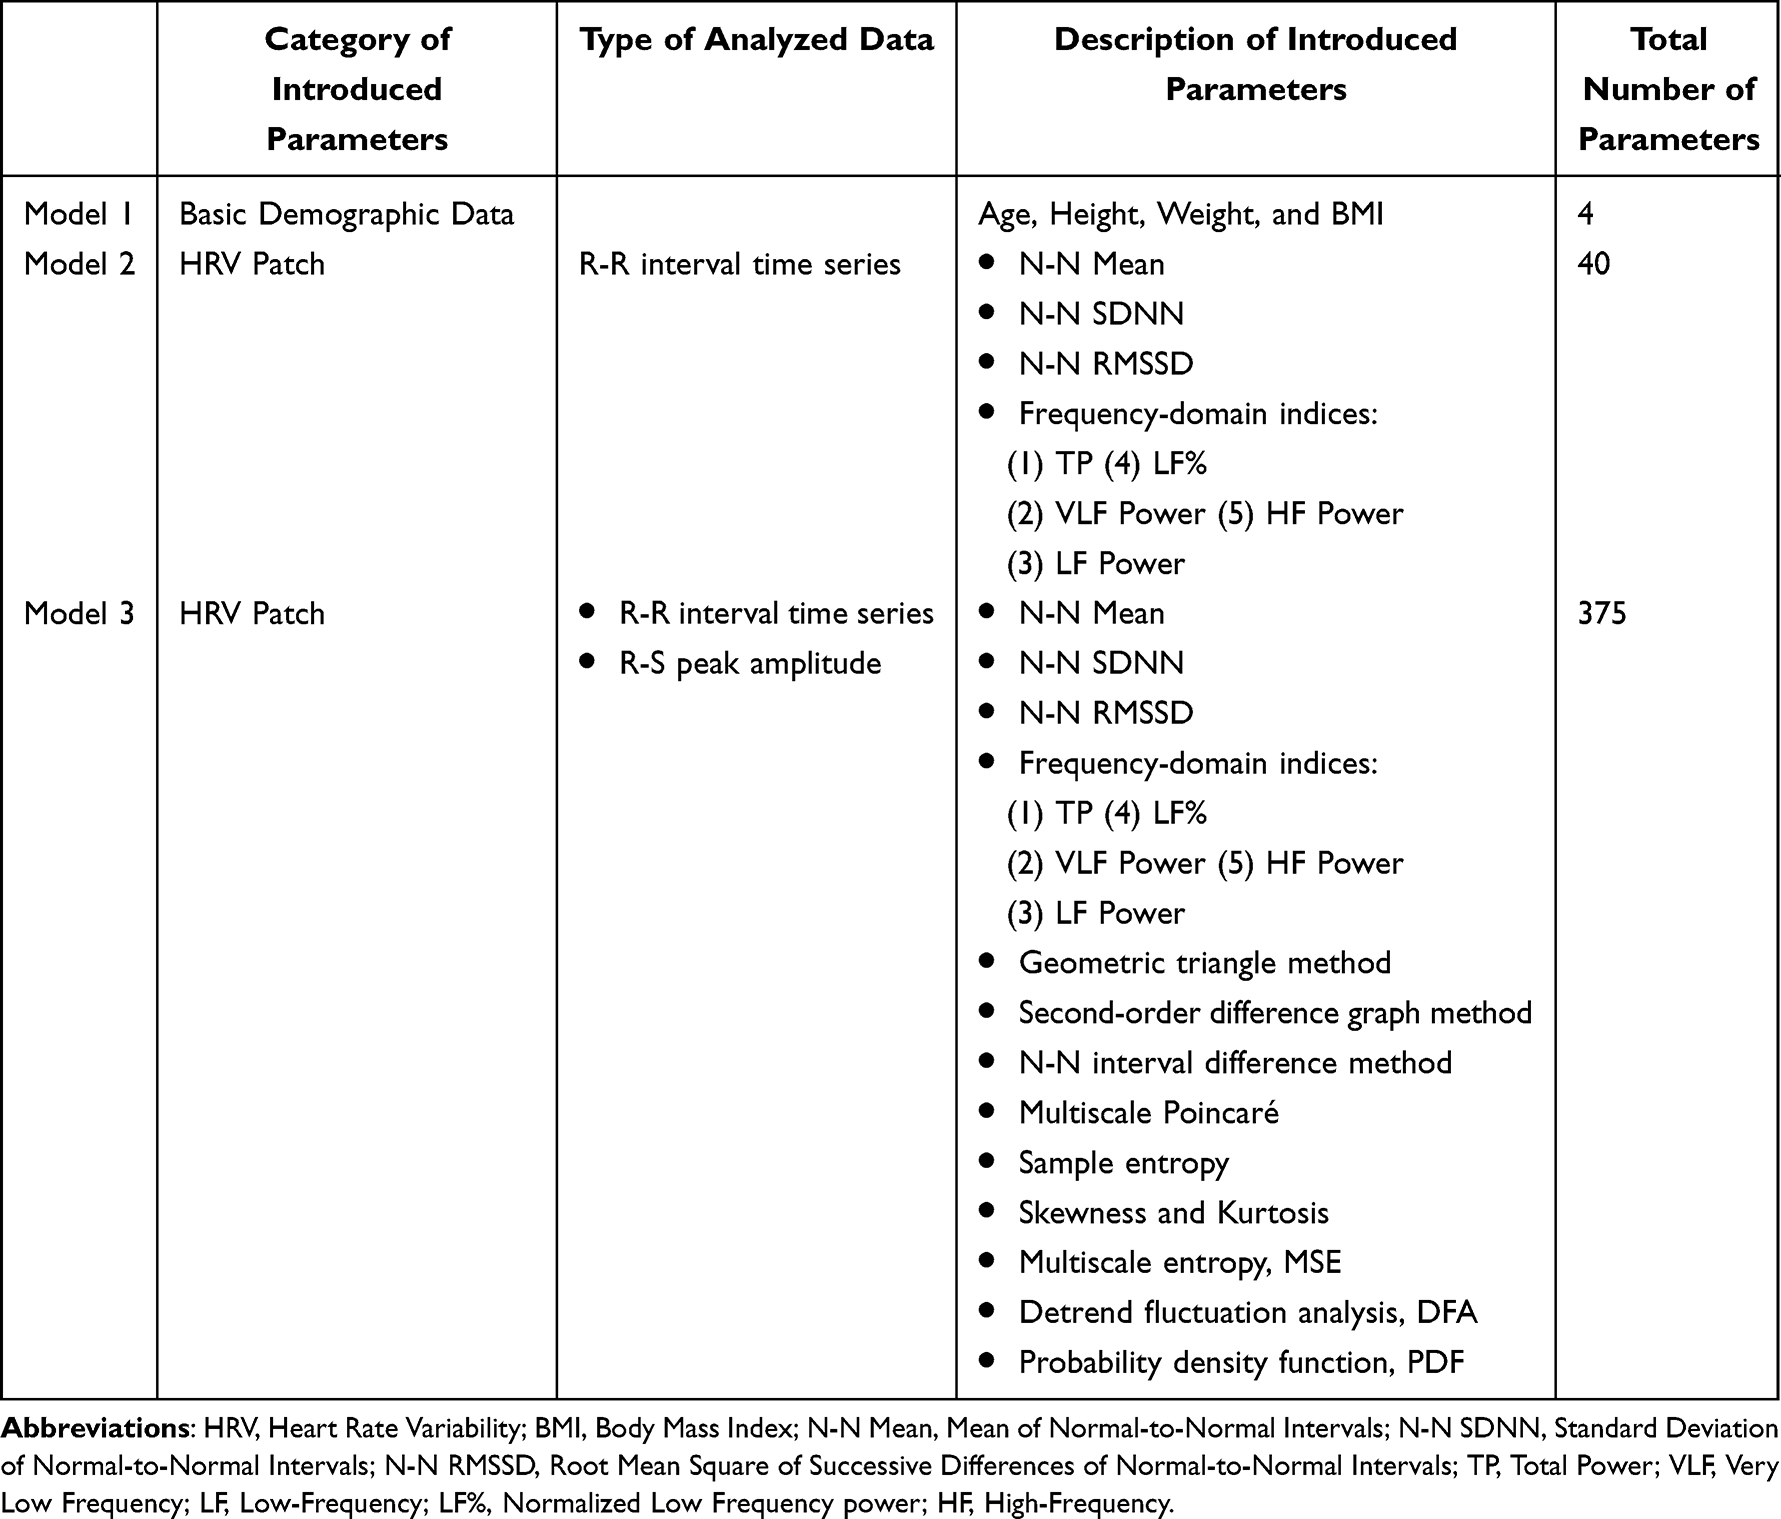 |
Table 1 Optimization Process of the Subject Screening Model for OSA Using a Patch-Type HRV Analyzer |
Data analysis was conducted in three parts for each participant: (1) basic demographics (age, height, weight, BMI); (2) time- and frequency-domain indices derived from lab software; (3) time-, frequency-, and nonlinear indices based on RRI and ECG R- S amplitude data.24–26 The AHI calculated from HSAT was used to classify OSA severity into three categories: AHI > 5 (mild), AHI > 15 (moderate), and AHI > 30 (severe). A multivariate regression model was built, and a leave-one-out (LOO) approach was used where one participant was reserved as the test set and the remaining data for model training. To strictly prevent data leakage and overfitting, the feature selection and model training processes were performed exclusively within the training set of each LOOCV iteration. Specifically, in each fold (N-1 subjects), we performed feature scaling (z-score normalization) and stepwise variable selection to identify the optimal predictors. The held-out test subject was strictly excluded from these preprocessing and training steps. This process was repeated 86 times to generate unbiased predictions for every participant. Given the high-dimensional feature space relative to the sample size, we prioritized model parsimony to ensure robustness. Instead of retaining a large number of features, we restricted the multivariate linear regression model to include only the top four most significant features identified through the stepwise selection process. This deliberate dimensionality reduction serves to minimize multicollinearity and enhance the clinical interpretability of the CVHI. The optimized threshold values were selected, and the performance of the model was evaluated using the ROC curve and confusion matrix. Key statistics included area under the curve (AUC), optimal cutoff, sensitivity, specificity, accuracy, and precision.
The ROC curve and its corresponding AUC illustrate a model’s ability to distinguish between classes at various decision thresholds. The x-axis represents the false positive rate (FPR), while the y-axis shows the true positive rate (TPR). By plotting the FPR against the TPR for various thresholds, the ROC curve offers a visual representation of the model’s discriminative power.
AUC, which ranges from 0 to 1, reflects the model’s overall ability to discriminate between positive and negative classes. An AUC of 1.0 indicates perfect classification, while an AUC of 0.5 suggests no better than random chance. An AUC below 0.5 implies the model performs worse than random guessing. An AUC between 0.7 and 0.9 is considered good, while an AUC above 0.9 indicates excellent performance.
All analyses and calculations were conducted using MATLAB software (MathWorks, Natick, Massachusetts, USA). The study was conducted in accordance with the Declaration of Helsinki.
Results
In this study, we developed three models. Model 1 was based on basic demographic parameters including age, height, weight, and body mass index (BMI). Model 2 further utilized time-domain and frequency-domain HRV parameters quantified through laboratory software. Model 3 incorporated analysis of time-domain, frequency-domain, and nonlinear indices derived from the RRI time series and R-S peak amplitude of the ECG.
In this study, multiple linear regression analysis within a machine learning framework was applied. From the initial set of variables—4 parameters in Model 1, 40 parameters in Model 2, and 275 parameters in Model 3—the features and regression coefficients most strongly associated with mild, moderate-to-severe, and severe OSA were identified.
To avoid overfitting and multicollinearity, we employed leave-one-out cross- validation (LOOCV) for model tuning. Given the sample size of 86 participants, LOOCV allowed for robust model evaluation by maximizing the use of available data. Ultimately, Model 1 yielded 4 regression coefficients, while Models 2 and 3 each identified 4 key predictive features with corresponding coefficients.
Model 1 equation:

Model 2 equation:

Where:
x1 = Median of heart rate mean (Mean)
x2 = Median of heart rate standard deviation (SD)
x3 = Median of RMSSD
x4 = Median of total power (TP)
Model 3 equation:

Where:
x1 = Median kurtosis of R-S amplitude (Kurtosis of R-S Amplitude, median)
x2 = Median heart rate modulation rate
x3 = 65th percentile of VLF
x4 = Median heart rate complexity (Entropy)
Each model ultimately incorporated four parameters with their respective regression coefficients.
Those three models were evaluated using the ROC receiver operating characteristic curve, and the AUC. As shown in Figures 5–7, the ROC curves illustrate the model’s ability to differentiate between cases with and without mild OSA (AHI ≥ 5), moderate OSA (AHI ≥ 15), and severe OSA (AHI ≥ 30). The AUC values and optimal cutoff points for these three classifications are presented in Tables 2–4.
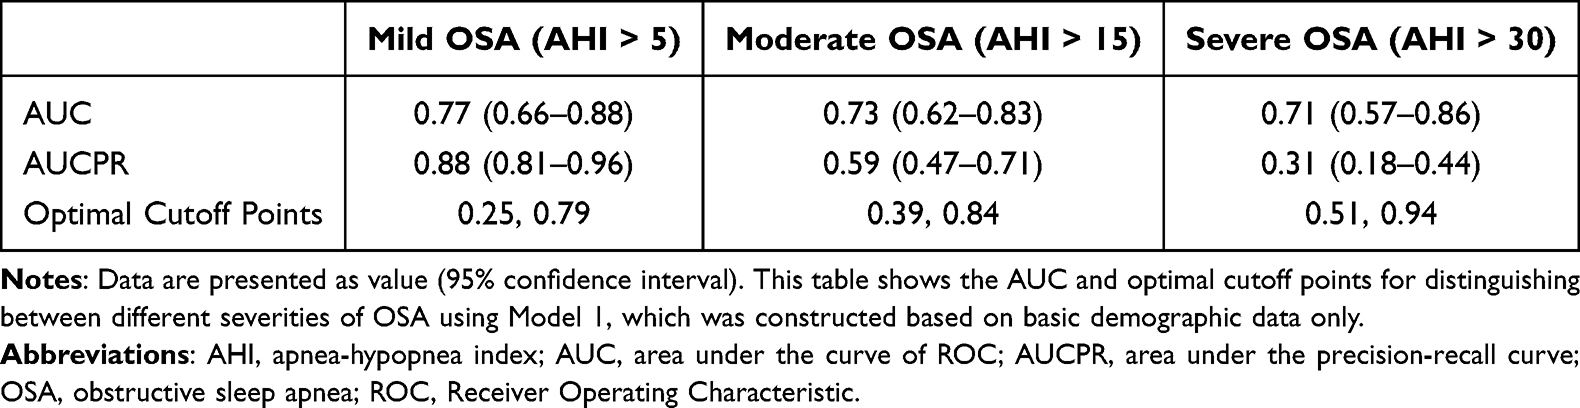 |
Table 2 AUC, AUCPR, and Optimal Cutoff Points for Model 1 with 95% Confidence Intervals |
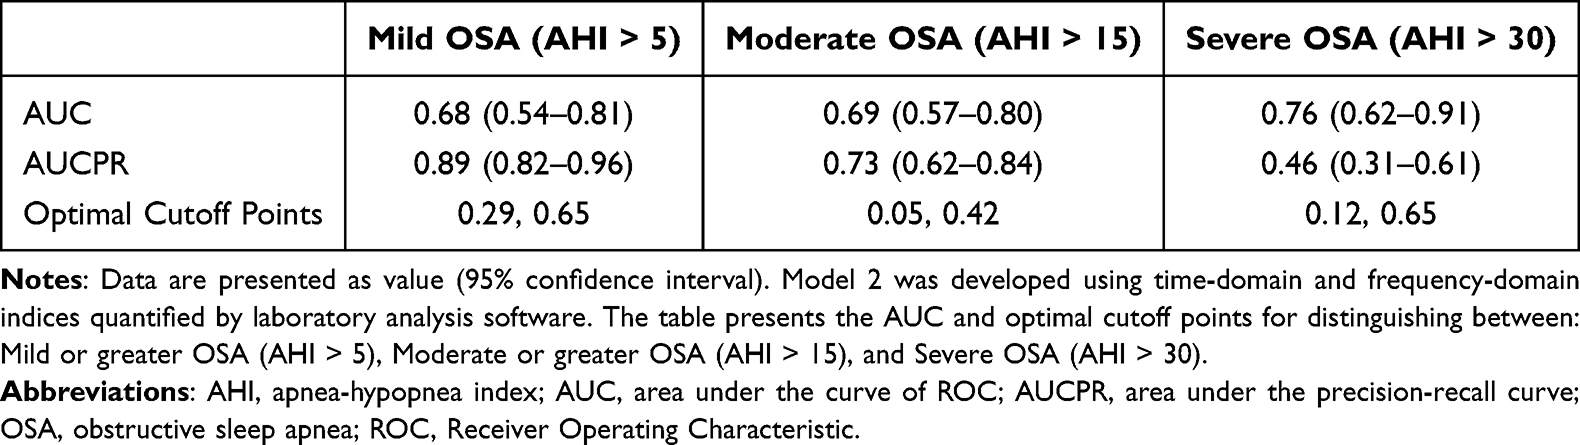 |
Table 3 AUC, AUCPR, and Optimal Cutoff Points for Model 2 with 95% Confidence Intervals |
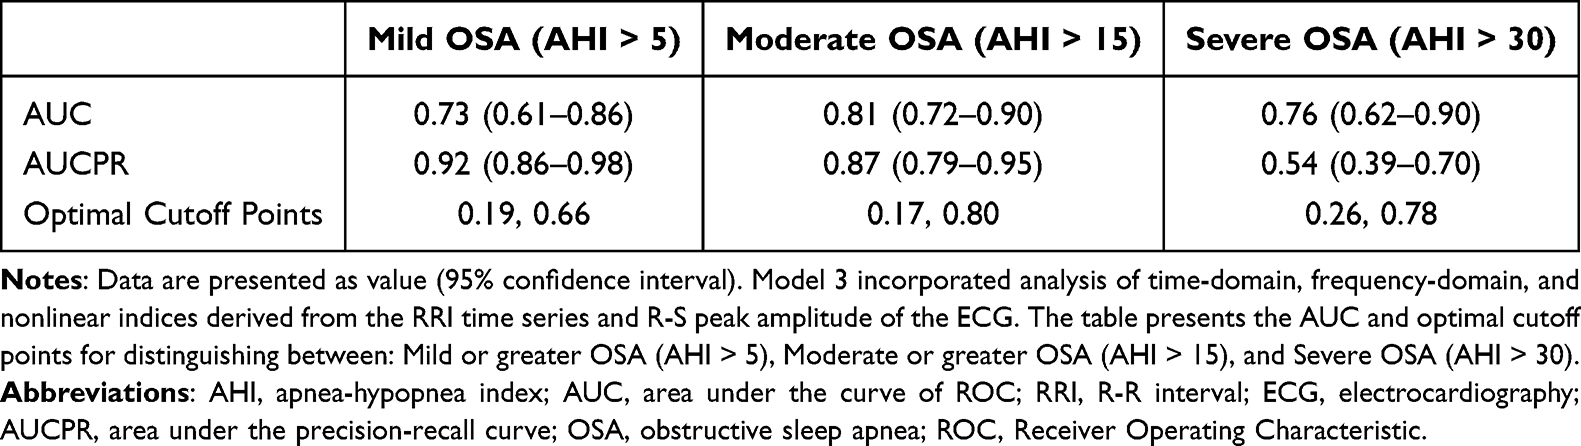 |
Table 4 AUC, AUCPR, and Optimal Cutoff Points for Model 3 with 95% Confidence Intervals |
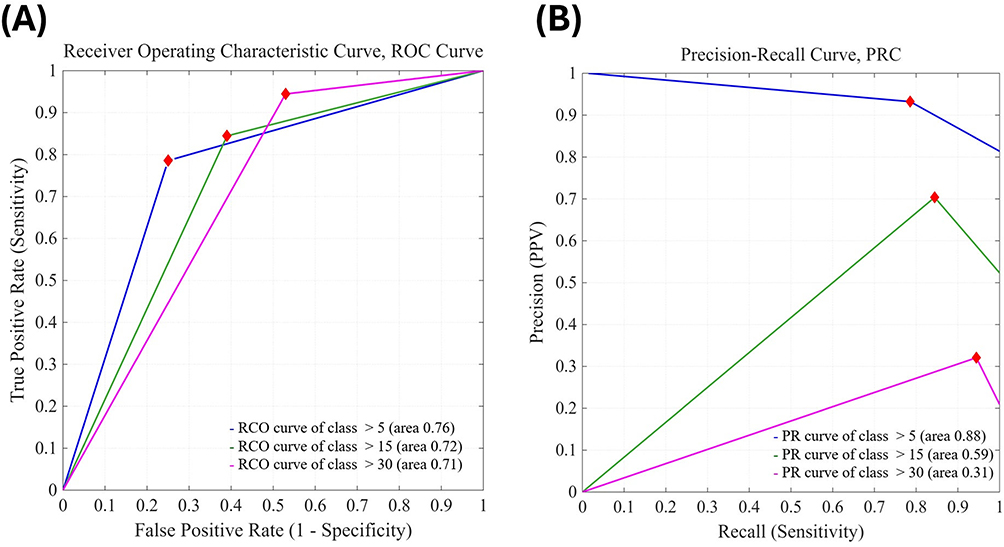 |
Figure 5 Receiver Operating Characteristic (ROC) curves and Precision-Recall Curves (PRC) of Model 1. (A) ROC curves. (B) Precision-Recall curves. The model is based on basic physiological parameters for distinguishing between presence or absence of mild or greater OSA (AHI > 5), presence or absence of moderate or greater OSA (AHI > 15), and presence or absence of severe OSA (AHI > 30). |
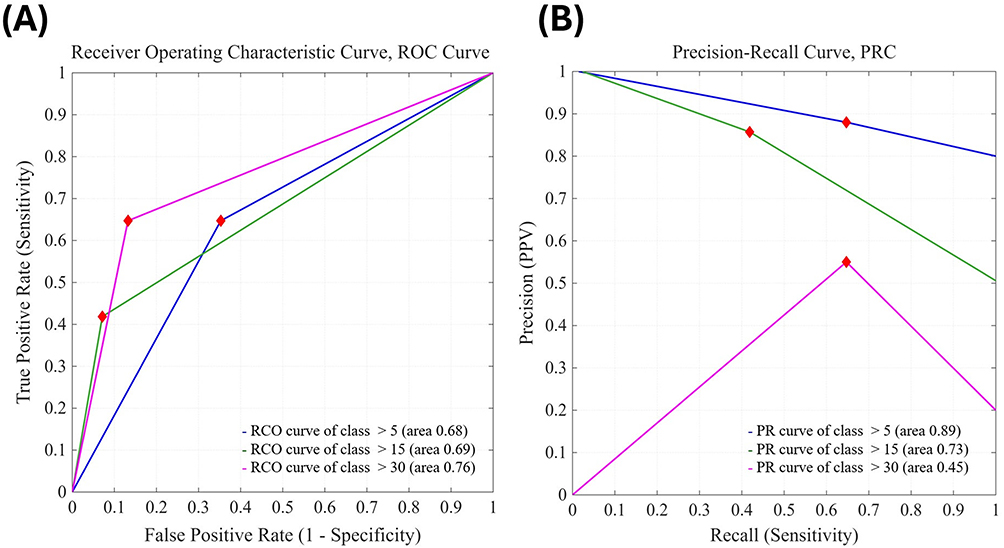 |
Figure 6 Receiver Operating Characteristic (ROC) curves and Precision-Recall Curves (PRC) of Model 2. (A) ROC curves. (B) Precision-Recall curves. This model uses HRV parameters derived from the time series of heartbeats and R-R intervals recorded by the HRV patch to distinguish presence or absence of mild or greater OSA (AHI > 5), moderate or greater OSA (AHI > 15), and severe OSA (AHI > 30). |
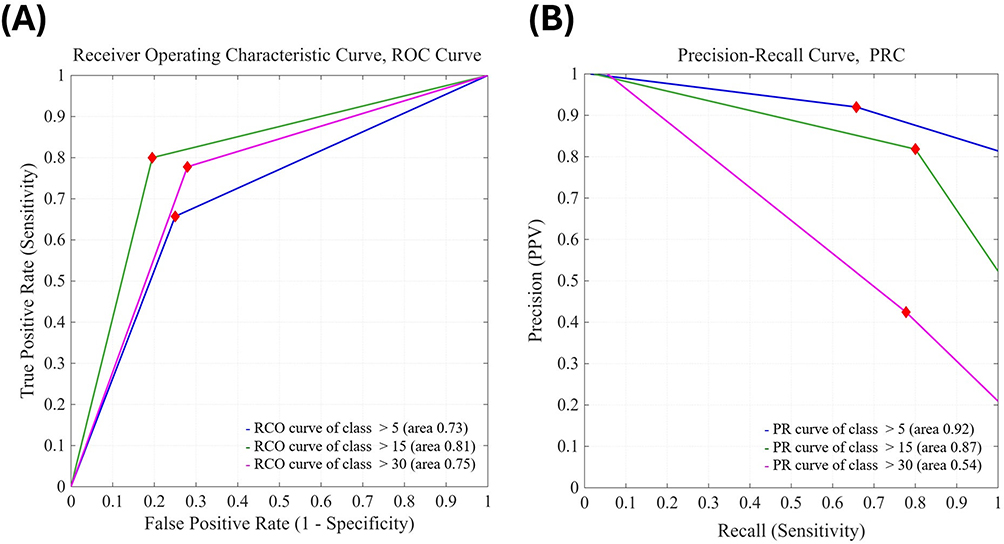 |
Figure 7 Receiver Operating Characteristic (ROC) curves and Precision-Recall Curves (PRC) of Model 3. (A) ROC curves. (B) Precision-Recall curves. This model uses HRV parameters derived from the time series of heartbeats, R-R intervals, and R-to-S wave amplitudes recorded by the HRV patch to distinguish presence or absence of mild or greater OSA (AHI > 5), moderate or greater OSA (AHI > 15), and severe OSA (AHI > 30). |
To assess the performance of the three models, we employed the confusion matrix, with a reference example shown in Figure 8 and the analytical results of the model displayed in Figures 9–11. The model’s sensitivity, specificity, accuracy, precision, and optimal threshold values are summarized in Tables 5–7.
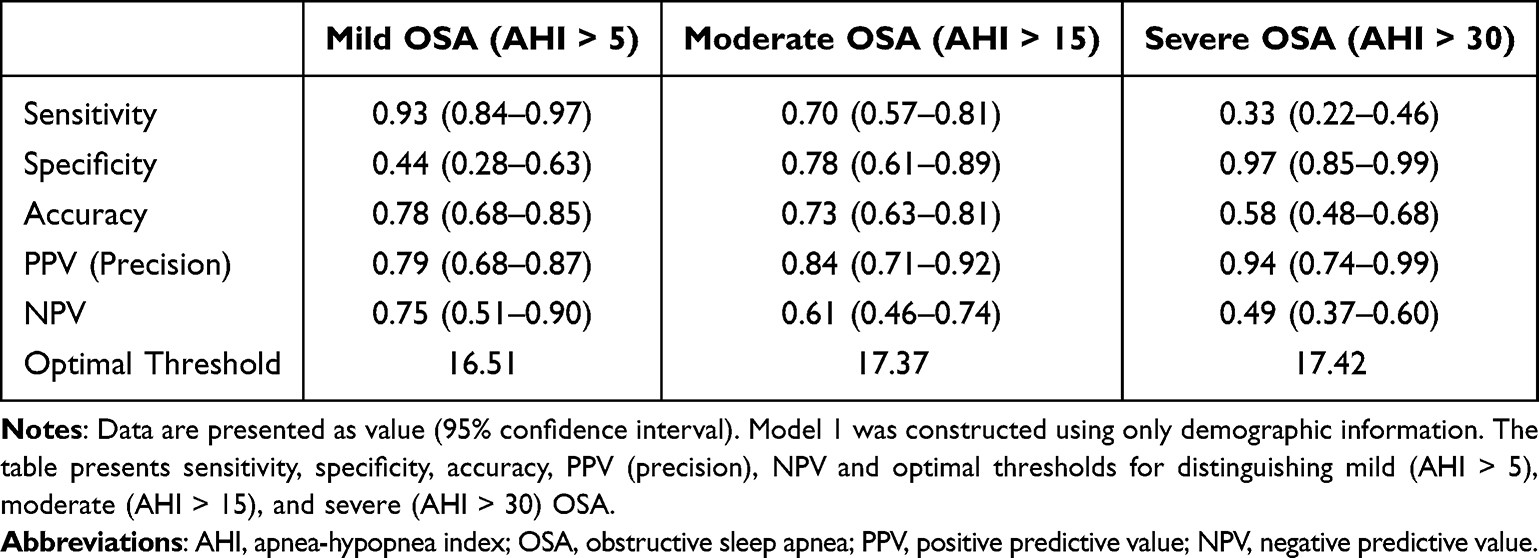 |
Table 5 Sensitivity, Specificity, Accuracy, PPV (Precision), NPV, and Optimal Threshold of Model 1 with 95% Confidence Intervals |
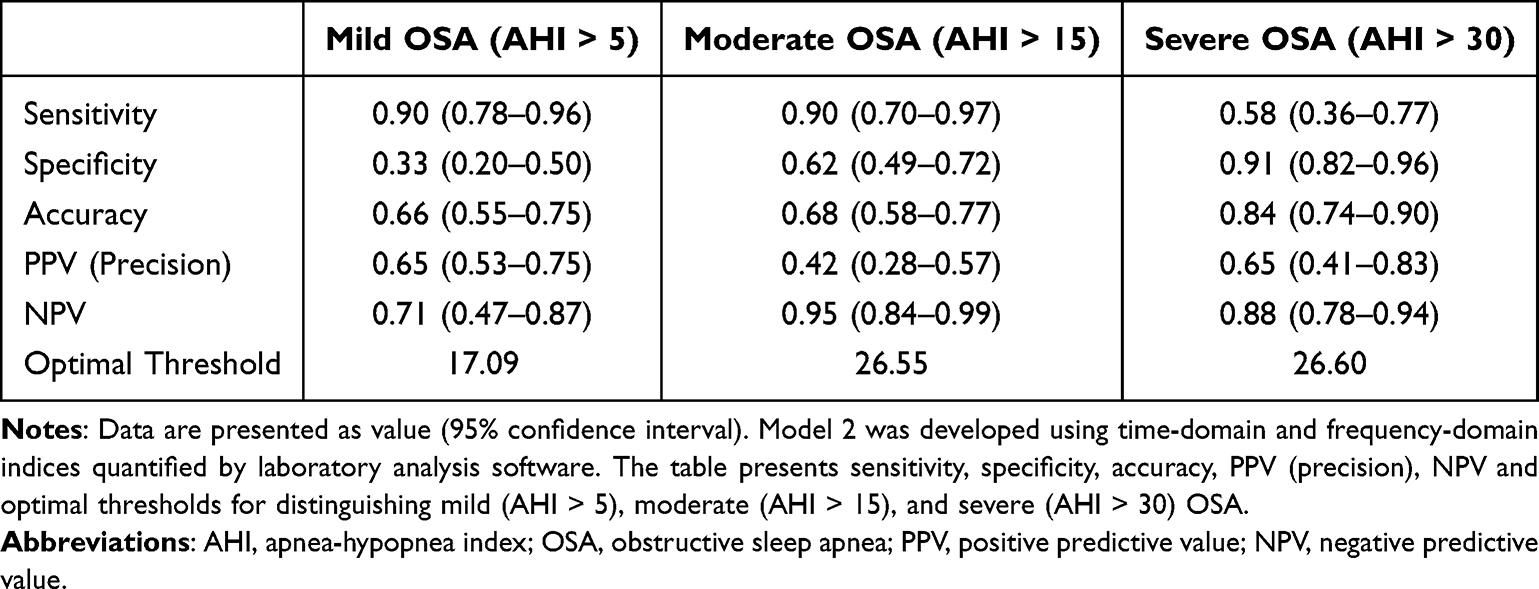 |
Table 6 Sensitivity, Specificity, Accuracy, PPV (Precision), NPV, and Optimal Threshold of Model 2 with 95% Confidence Intervals |
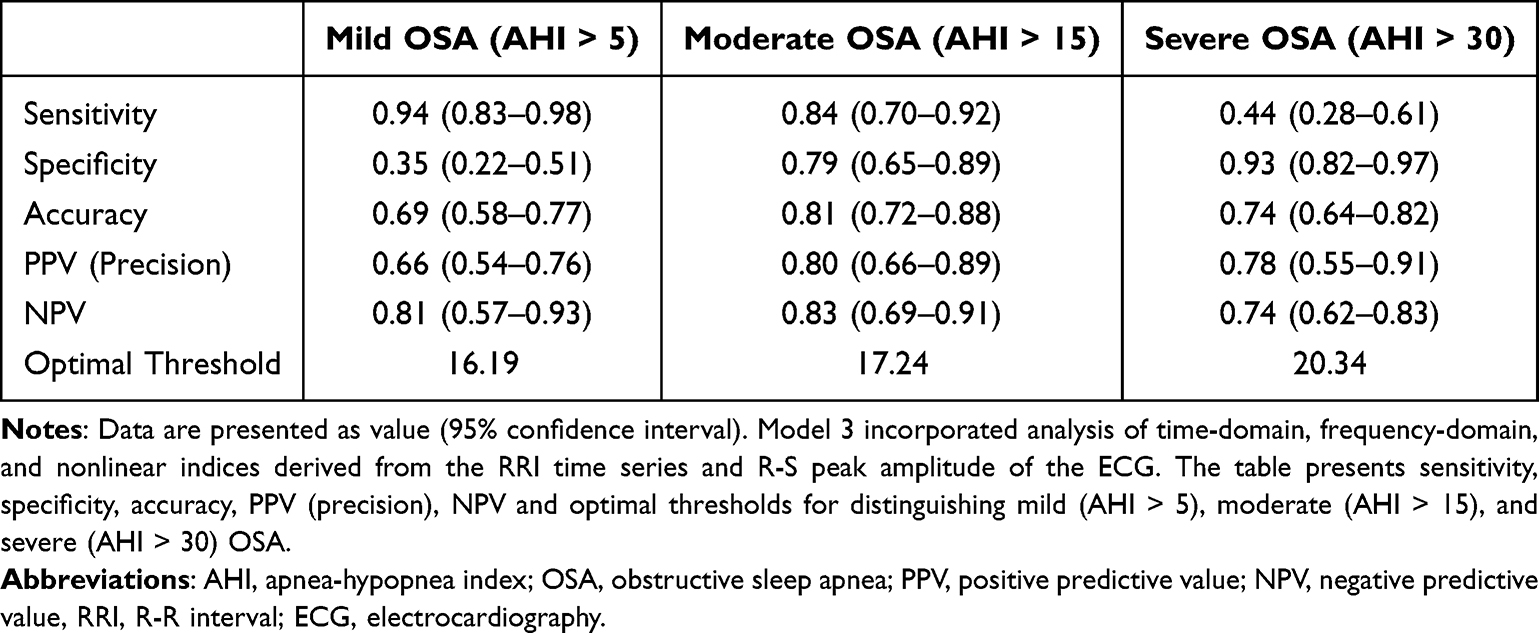 |
Table 7 Sensitivity, Specificity, Accuracy, PPV (Precision), NPV, and Optimal Threshold of Model 3 with 95% Confidence Intervals |
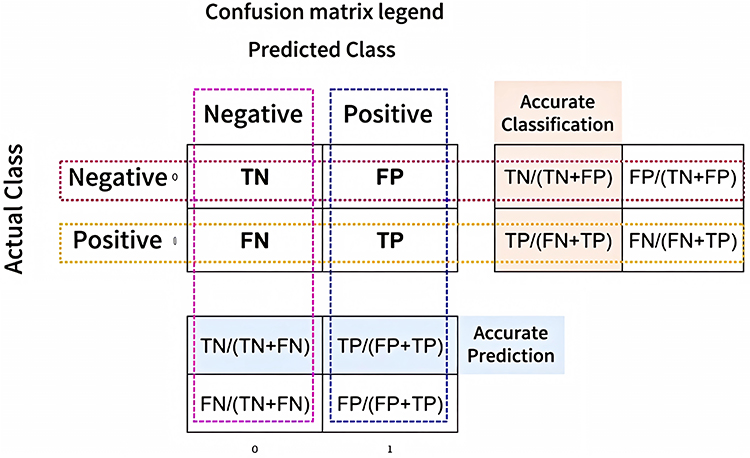 |
Figure 8 Confusion matrix legend. |
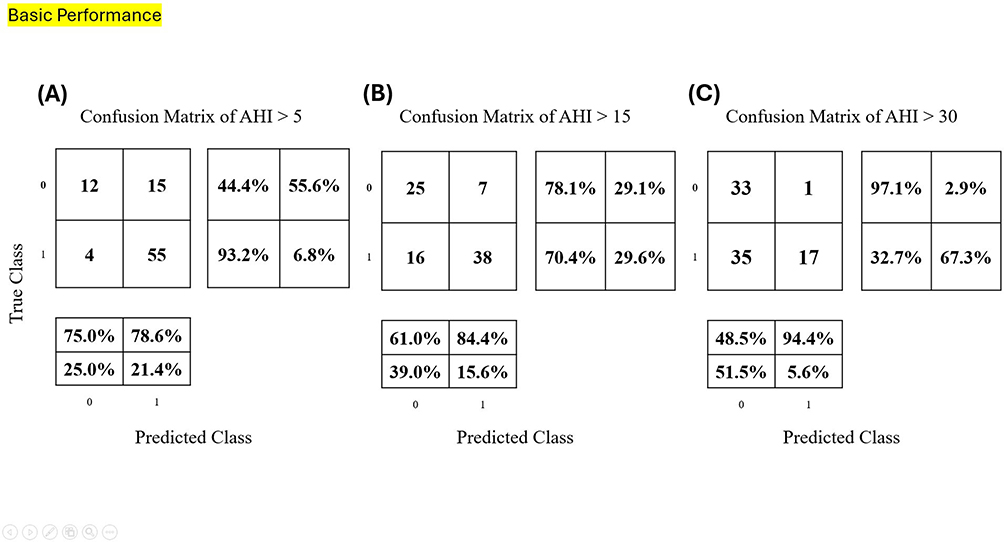 |
Figure 9 Confusion matrices of Model 1. (A) AHI > 5. (B) AHI > 15. (C) AHI > 30. |
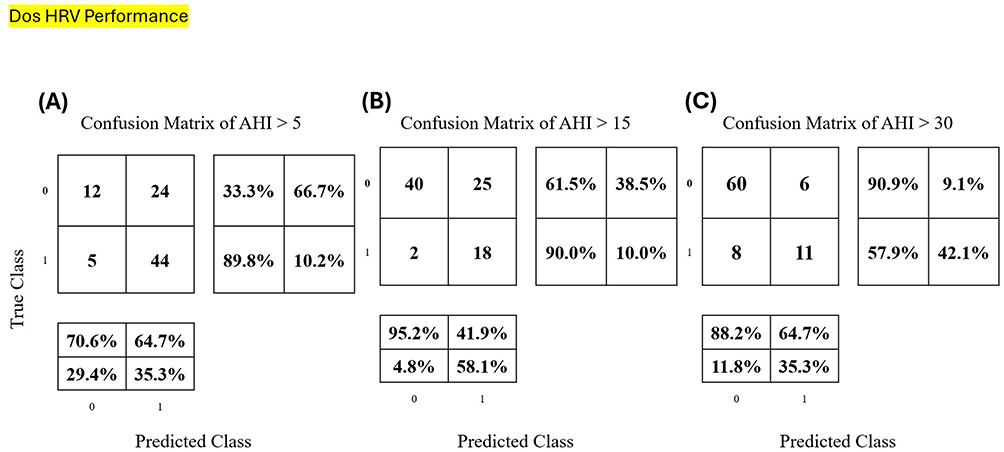 |
Figure 10 Confusion matrices of Model 2. (A) AHI > 5. (B) AHI > 15. (C) AHI > 30. |
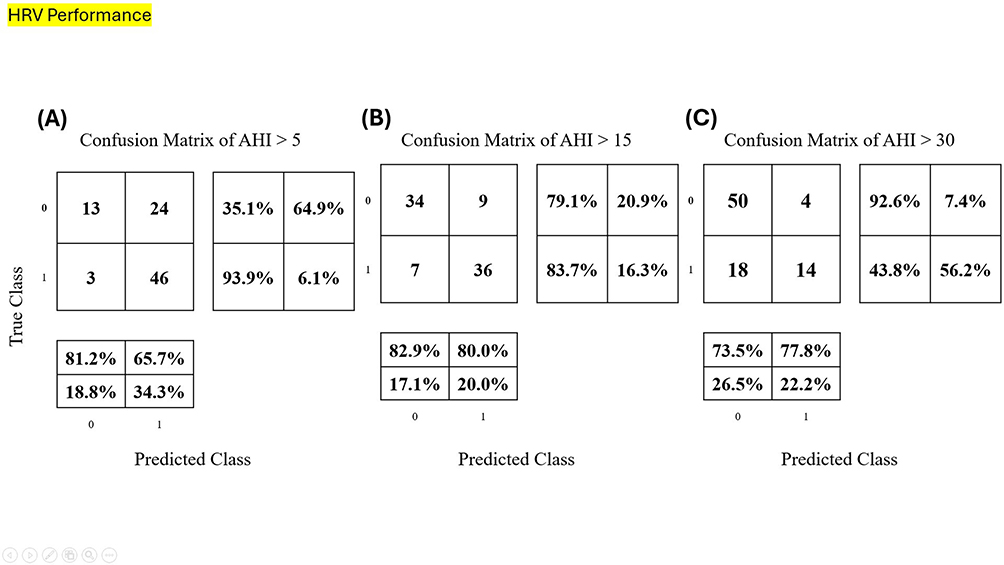 |
Figure 11 Confusion matrices of Model 3. (A) AHI > 5. (B) AHI > 15. (C) AHI > 30. |
According to the Receiver Operating Characteristic (ROC) analysis of Model 1, it was observed that using only the basic demographic parameters (age, height, weight, and BMI) achieved AUC of 0.76 in identifying the presence or absence of mild OSA (AHI ≥ 5). The predictive accuracies for mild, moderate, and severe OSA were 0.78, 0.73, and 0.58, respectively. Model 2 demonstrated superior discriminatory capability in identifying severe OSA (ROC curve of class > 30, area = 0.83). The predictive accuracies for identifying mild, moderate, and severe OSA using Model 2 were 0.66, 0.68, and 0.84, respectively. In Model 3 we further analyzed time-domain, frequency-domain, and nonlinear parameters derived from the RRI time series and the R-S peak amplitude of the ECG waveform. These features were used to construct a new multi-dimensional predictive model. For AHI = 5, the sensitivity was 0.94, accuracy was 0.69, and AUC was approximately 0.73. For AHI = 15, sensitivity reached 0.84, accuracy was 0.81, and AUC was 0.81. For AHI = 30, the sensitivity was 0.44, accuracy was 0.74, and AUC was 0.76. According to the ROC analysis, this newly developed multi-parametric indicator exhibited the best discriminative performance for identifying moderate to severe OSA (ROC curve of class > 15, area = 0.81). However, it also demonstrated acceptable performance in distinguishing mild OSA and severe OSA cases (ROC curve of class > 5, area = 0.73; ROC curve of class > 30, area = 0.76). The predictive accuracies for mild, moderate, and severe OSA using Model 3 were 0.69, 0.81, and 0.74, respectively.
Given its superior performance, the new indicator developed in Model 3 was designated the CVHI. The components of CVHI include: Kurtosis of R-S amplitude (median), Heart rate modulation rate (median), VLF power at the 65th percentile, and Heart rate complexity (entropy) (median). Designating these components as x1 through x4 respectively, the formula for CVHI is as follows:
CVHI = 20.68 + 6.90×x1 + 0.98×x2 – 0.22×x3 + 1.24×x4.
A comparative summary of model performance stratified by OSA severity is presented in Tables 8–10. The R2 values were 0.11, 0.18, and 0.28 for Models 1, 2 and 3 respectively. Prediction accuracies for differentiating mild OSA (AHI > 5) were 0.78, 0.66, and 0.69 for Models 1, 2, and 3 respectively. Prediction accuracies for moderate-to-severe OSA (AHI > 15) were 0.73, 0.68, and 0.81 for Models 1, 2, and 3 respectively. Prediction accuracies for severe OSA (AHI > 30) were 0.58, 0.84, 0.74 for Models 1, 2, and 3 respectively (See Tables 8–10 for detailed results).
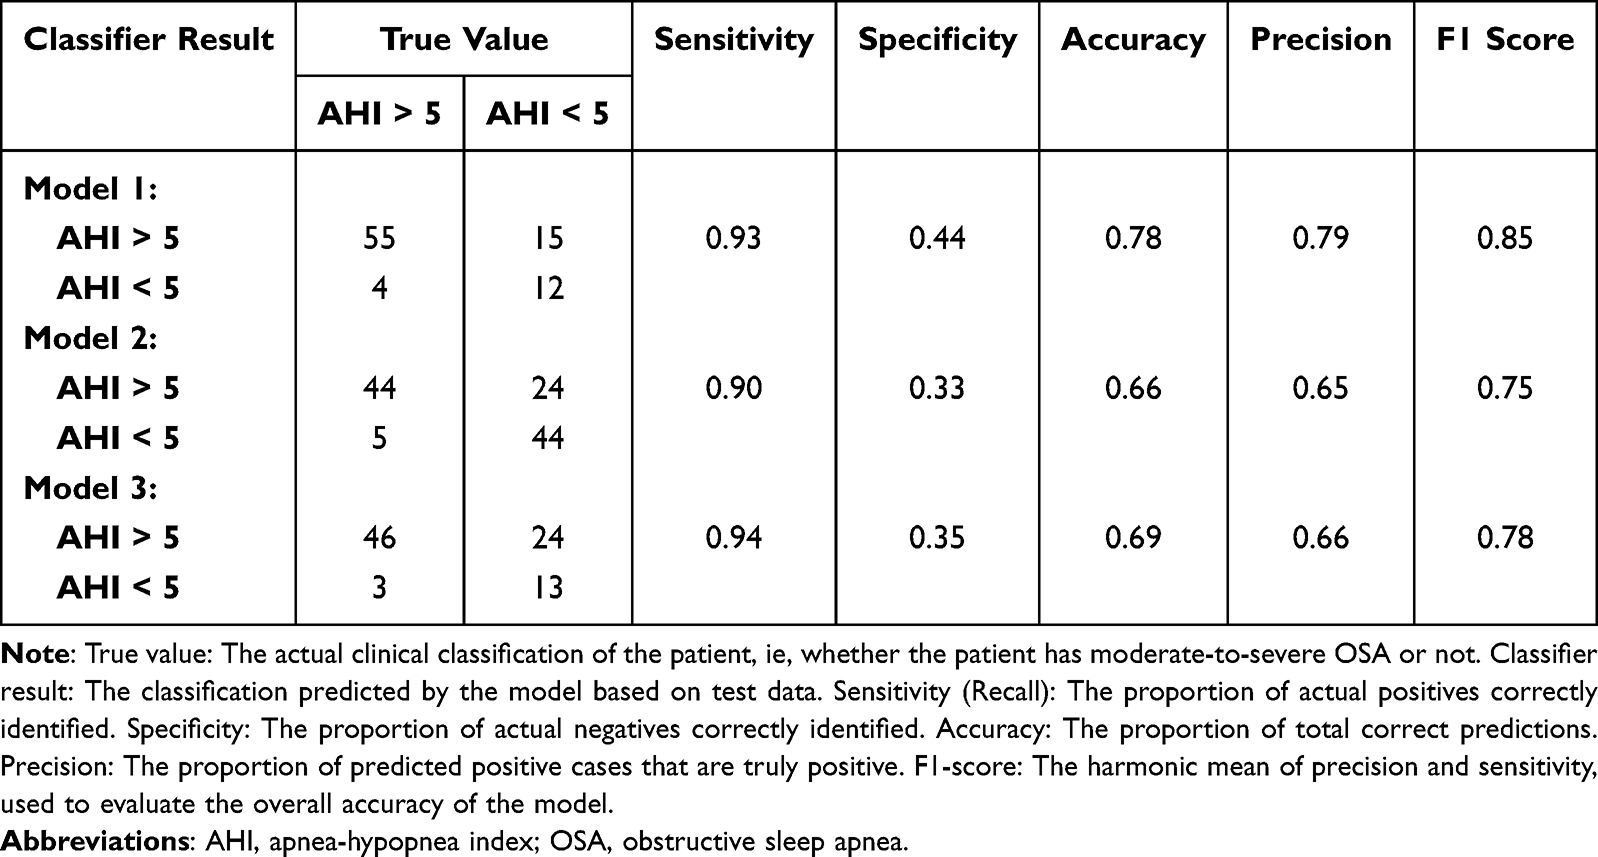 |
Table 8 Confusion Matrix Data and Performance Metrics of Each Model for Classification of Mild OSA |
 |
Table 9 Confusion Matrix Data and Performance Metrics of Each Model for Classification of Moderate-to-Severe OSA |
 |
Table 10 Confusion Matrix Data and Performance Metrics of Each Model for Classification of Severe OSA |
Discussion
Sleep study technologies have evolved over time, transitioning from in-hospital polysomnography to home-based testing, and gradually incorporating artificial intelligence and wearable devices. Traditional PSG, introduced in the mid-20th century, remains the gold standard for diagnosing OSA. However, due to its high cost and inconvenience, HSAT has emerged as an alternative.
With advances in medical technology, unattended full PSG (Type 2, ≥7 channels) can offer diagnostic accuracy close to that of in-lab studies, making it suitable for screening moderate-to-severe OSA patients.27 Simplified home sleep tests (Type 3, 3–6 channels) further improve convenience, and although their diagnostic accuracy is slightly lower, they remain effective for OSA screening.28 However, these devices often utilize multiple wires and sensors, which can cause discomfort and restrict mobility, making them less suitable for longitudinal or multi-day monitoring. In recent years, single-channel devices (Type 4), such as oximeters, ECG patches, and wearable rings, have gained popularity due to their high portability and low cost, making them a favored option for preliminary screening (see Table 11).29
 |
Table 11 Evolution of Sleep Study Modalities |
Moreover, the integration of AI has significantly improved the precision of sleep data analysis. When combined with wireless wearable technologies (eg, smartwatches, rings), AI enables scalable remote monitoring and personalized sleep health management.30 These advancements are shifting OSA diagnosis away from hospital-based methods toward more efficient and convenient individual monitoring. Future directions aim to further integrate AI and telemedicine to enhance diagnostic accuracy and expand access to OSA screening services.
ECG patches are lightweight, wearable devices used to continuously monitor HRV and detect abnormalities related to OSA. These devices are typically compact (approx. 5 cm × 3 cm, ~1 oz), facilitating prolonged wear. The DOMII ECG patch13–15 and the Rooti Care ECG Patch16,17 provide standard ECG monitoring and HRV analysis. In contrast, the Wegene HRV Analyzer used in this study incorporates an advanced OSA screening algorithm to enhance analytical capabilities.
Regarding regulatory status, the DOMII ECG patch has been certified by both the Taiwan Food and Drug Administration (TFDA) and the US Food and Drug Administration (FDA), with an OSA screening accuracy ranging from 68.1% to 85.1%.31 The Rooti Care ECG Patch is water-resistant, adheres well, and has extended battery life, yielding a moderate-to-severe OSA screening accuracy of approximately 70.2%.16 The Wegene HRV Analyzer, leveraging machine learning algorithms, achieved an accuracy of 81.4% in this study.
However, since ECG patches can only monitor cardiac signals and not respiratory patterns directly, their overall accuracy remains inferior to traditional multi-channel PSG. Both the DOMII ECG patch and Rooti Care ECG Patch thus have limitations as standalone clinical tools for OSA. Although the Wegene HRV Analyzer improves accuracy via algorithmic enhancement, its reliance on a single physiological signal still necessitates the integration of additional biosensors for reliable detection.
From a cost and accessibility perspective, the DOMII ECG patch is more expensive due to regulatory compliance, the Rooti Care ECG Patch is more affordable for preliminary screening, and the Wegene HRV Analyzer, though analytically advanced, is not yet mass-produced and may be better suited for precise monitoring scenarios. In conclusion, while ECG patches offer practical and portable HRV monitoring, their use in OSA screening is limited without concurrent multimodal physiological monitoring (see Table 12).
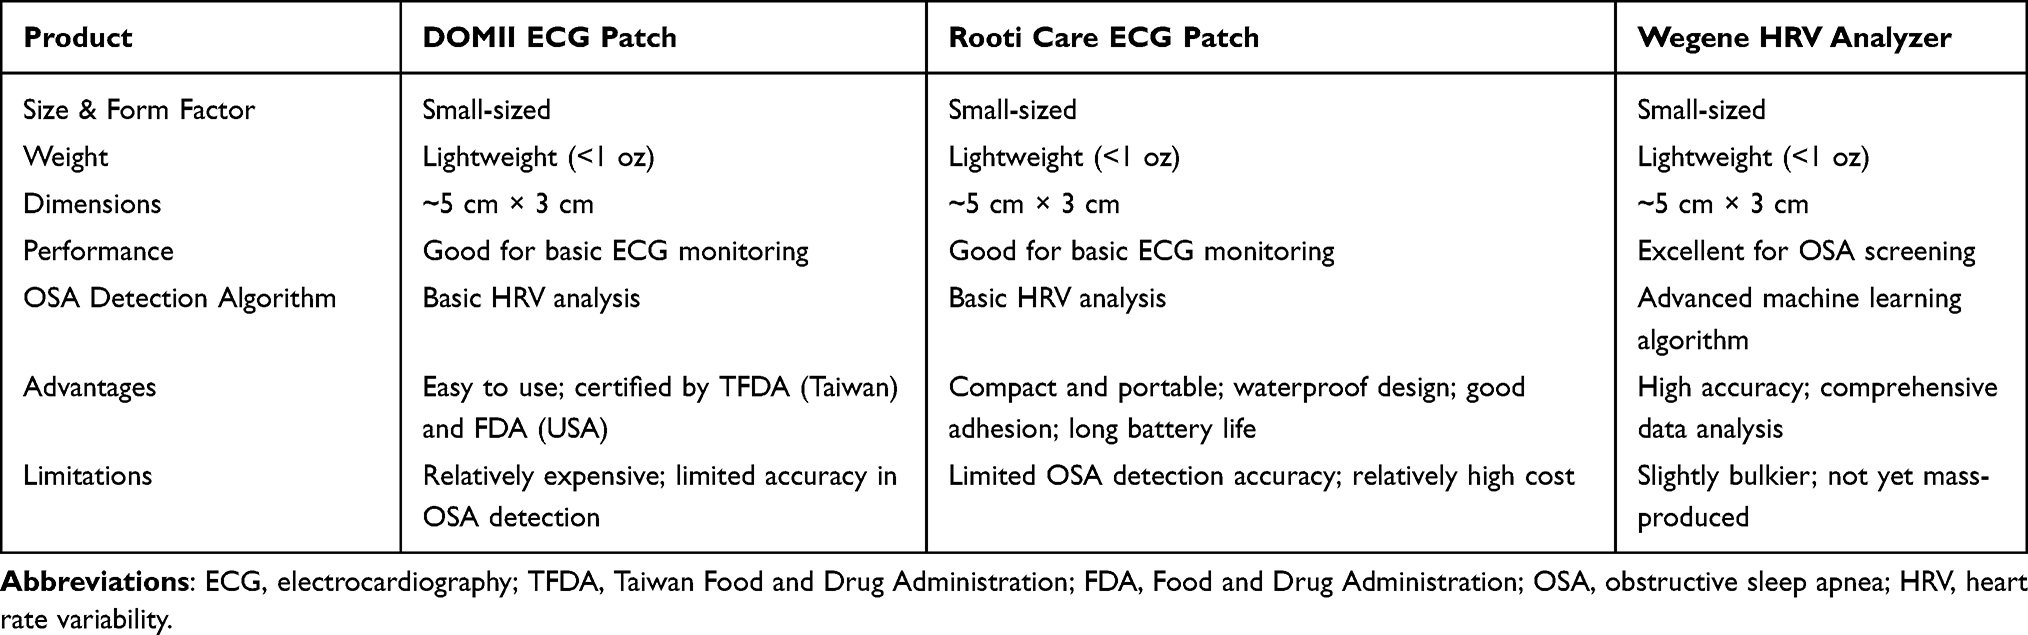 |
Table 12 Comparison of ECG Patch Devices |
According to our literature review, this is the first study to apply artificial intelligence to analyze HRV, R-R interval timing, and signal amplitude for screening OSA. We found that incorporating these features significantly improves the accuracy of OSA screening. When training an AI model using only age, sex, and BMI, the predictive accuracy for moderate-to-severe OSA was 73.3%. However, after including a wide range of HRV indicators such as R-R interval timing and amplitude, the accuracy increased to 81.4%. A key distinction of our approach lies in the comprehensive nature of feature integration. Traditional metrics like CVHR12 and cardiopulmonary coupling13–15 are derived from singular ECG features. Consequently, they are limited in their ability to comprehensively represent the full spectrum of ECG information, making it difficult to accurately quantify OSA severity and event frequency. In contrast, our CVHI considers the complete range of feature information provided by the ECG signal. By employing AI to identify the optimal combination of features that best characterize the frequency and severity of OSA, the CVHI achieves a significantly more accurate screening performance. We termed this new predictive metric the CVHI, which not only allows for more accurate OSA screening but also enables us to quantify the systemic impact of OSA on the cardiovascular and autonomic nervous systems.
The components constituting the CVHI in this study include the median kurtosis of the ECG R-S amplitude, median heart rate modulation rate, 65th percentile of VLF HRV power, and the median heart rate complexity (entropy). The kurtosis of the R-S amplitude reflects the shape of the respiratory signal amplitude distribution. A higher kurtosis indicates fewer outliers and less sudden variation in heartbeats, which may correlate with OSA. The VLF component of HRV (0.0033–0.04 Hz) is associated with physiological processes such as sympathetic regulation, thermoregulation, and endocrine activity, which have also been linked to chronic stress and cardiovascular risk, and thus possibly to OSA. The heart rate modulation rate measures the degree of heartbeat fluctuation— greater variability may reflect increased risk of OSA. The median heart rate complexity quantifies the nonlinear dynamics of R-R intervals. Higher complexity represents better autonomic regulation, while reduced complexity is often associated with aging or cardiovascular risk, which may also relate to OSA.
Although these indicators yielded the best predictive performance in our sample, the feature set may change with the accumulation of more data in the future. Nevertheless, our findings suggest that nonlinear HRV metrics hold predictive and monitoring value for OSA patients.
We developed three AI models in total. Model 1 included only basic demographic features. Model 2 incorporated 40 parameters from the HRV patch device. Model 3 included 375 parameters and ultimately demonstrated the highest accuracy. The major difference in Model 3 was the inclusion of ECG amplitude features and the application of both linear and nonlinear analyses. Model 2 performed worse, possibly because it included limited variables such as the median of mean heart rate, standard deviation (SD), RMSSD), and total power (TP). Model 3’s improved performance is likely due to its more diverse data inputs, especially the ECG amplitude.
The amplitude of heartbeats can fluctuate with respiratory effort. In clinical manifestations of OSA, respiratory airflow into the thoracic cavity is restricted during airway obstruction, which reduces thoracic excursion. In previous research,16 we developed the Chest Effort Index (CEI) using triaxial accelerometer data and found it associated with AHI scores. When combined with HRV data, CEI predicted moderate-to- severe OSA with approximately 70.6% accuracy. In this study, incorporating ECG amplitude-related features and AI-based analysis improved the predictive accuracy for moderate-to-severe OSA to 81.4%.
We used LOOCV to train and test the AI models, ensuring robustness and generalizability by maximizing data utilization. In the future, collecting more patient data could further improve model performance. We currently only used a multivariate regression model, but future studies may explore additional machine learning algorithms for enhanced performance.
According to Jeng-Wen Chen,32 an accuracy rate of 57.55% was achieved when classifying OSA using a public dataset containing 5300 ECG recordings. While our dataset is smaller, our AI model trained on selected HRV features yielded better results. This suggests promising prospects for future application as the dataset grows.
This study has several limitations that merit explicit acknowledgement. First, the final sample size was relatively small due to participant attrition, and the single-center recruitment restricts the immediate generalizability of our findings. Second, the clinical reference standard used was HSAT. While HSAT facilitates faster patient recruitment compared to in-lab PSG, it lacks electroencephalography (EEG) monitoring and cannot confirm whether the patient is truly asleep, potentially leading to the misclassification of sleep events. Additionally, as participants conducted the HSAT at home, incorrect device usage or positioning could lead to inaccurate sleep time data or poor signal quality. This contributed to substantial data loss and a large discrepancy between the number of enrolled participants and those with usable data for analysis. Regarding the potential concern about device-developer conflicts, we have included a statement clarifying that there are no conflicts of interest (COIs) associated with this study.
To address these constraints—particularly the geographic and demographic restrictions—future research pathways will focus on multi-center validation across diverse ethnic groups and regions. We plan to establish international collaborations to test the applicability of the CVHI model in non-Taiwanese populations, which is essential to verify external validity. Furthermore, enhanced patient education in future studies could improve data accuracy and accelerate data collection.
Regarding clinical utility, the CVHI model demonstrates high sensitivity (0.94 for AHI > 5) and a robust negative predictive value, positioning it as an effective rule-out triage tool. This allows for the exclusion of low-risk individuals, thereby optimizing medical resources. Conversely, for moderate-to-severe OSA (AHI > 15), the model’s strong discrimination (AUC = 0.81) supports its use in ruling in patients who require immediate intervention or confirmatory PSG. Furthermore, given the wearable nature of the patch-type device, it is particularly suitable for long-term follow-up monitoring, such as assessing the efficacy of CPAP treatment or tracking weight-loss interventions in a home setting.
Conclusion
In this study, we developed a new indicator—CVHI—using a patch-type HRV analyzer, which achieved high accuracy in screening for moderate-to-severe OSA. Using an AHI cutoff of 15, the CVHI demonstrated a sensitivity of approximately 83.7%, an accuracy of 81.4%, and an area under the ROC curve (AUC) of approximately 0.81. This performance represents a marked improvement over models trained solely on demographic features such as age, sex, and BMI, which achieved only 73% accuracy. Additionally, it outperforms previous methods utilizing a combination of ECG patches and triaxial accelerometers for screening moderate-to-severe OSA, which had an accuracy of 70.6%.
Institutional Review Board Statement
This study was approved by the Institutional Review Board of Shin Kong Wu Ho-Su Memorial Hospital (approval numbers: 20221213R 20231104R and 20240813R). Informed consent was obtained from all subjects involved in the study.
Abbreviations
OSA, Obstructive sleep apnea; HRV, heart rate variability; ECG, electrocardiography; AI, artificial intelligence; CVHI, cardiovascular hypopnea index; AHI, apnea-hypopnea index; CPAP, continuous positive airway pressure; PSG, polysomnography; HSAT, home sleep apnea testing; CVHR, cyclic variation of heart rate; RRI, R-R interval; SDNN, N-N intervals; RMSSD, root mean square of successive differences; VLF, very low frequency; LF, low frequency; LF%, normalized LF power; HF, high frequency; FFT, fast Fourier transform; MSE, multiscale entropy; DFA, detrended fluctuation analysis; PDF, probability density functions; BMI, body mass index TP total power; LOO, leave-one-out; AUC, area under the curve; FPR, false positive rate; TPR, true positive rate; LOOCV, leave-one-out cross-validation; SD, standard deviation; ROC, receiver operating characteristic; TFDA, Taiwan Food and Drug Administration; FDA (U.S.), Food and Drug Administration; CEI, Chest Effort Index; EEG, electroencephalograph; PRC, precision-recall curves.
Data Sharing Statement
The ethics committee does not restrict data sharing. The datasets used and/or analyzed during the current study are available from the corresponding author on reasonable request.
Acknowledgments
The authors would like to thank the funders: Shin Kong Wu Ho-Su Memorial Hospital, National Yang Ming Chiao Tung University and National Science and Technology Council.
Author Contributions
Ying-Shuo Hsu: Conceptualization, Methodology, Formal analysis, Writing - original draft, Writing - review & editing. Yu-Cheng Lin: Conceptualization, Writing - review & editing. Yu-En Kuo: Conceptualization, Writing - review & editing. Cheng-Han Chou: Conceptualization, Writing - review & editing. Mei-Chun Chou: Conceptualization, Writing - review & editing. Yi Chang: Conceptualization, Writing - review & editing. Ofer Jacobowitz: Conceptualization, Writing - review & editing. Chia-Mo Lin: Conceptualization, Writing - review & editing. Shih-Chieh Lo: Conceptualization, Writing - review & editing. Terry B J Kuo: Conceptualization, Methodology, Formal analysis, Writing - original draft, Writing - review & editing, Supervision, Project administration. Cheryl C H Yang: Conceptualization, Methodology, Formal analysis, Writing - original draft, Writing - review & editing, Supervision, Project administration. All authors gave final approval of the version to be published; have agreed on the journal to which the article has been submitted; and agree to be accountable for all aspects of the work.
Funding
This work was supported by the National Science and Technology Council (NSTC), Taiwan [Grant No. 2024NSTCADR003]; and Shin Kong Wu Ho-Su Memorial Hospital [Grant No. 2024SKHADR027, Grant No. 2025SKHADR024]. We gratefully acknowledge their support.
Disclosure
Professor Ofer Jacobowitz reports personal fees from Livanova PLC, personal fees from Nyxoah Medical, personal fees from Lunair medical, personal fees from Apnimed, personal fees from zsquare medical, personal fees from aerin medical, during the conduct of the study. The author(s) report no other conflicts of interest in this work. The artificial intelligence models and data analyses in this study were implemented using MATLAB software (MathWorks, Natick, Massachusetts, U.S.A.). Furthermore, ChatGPT (OpenAI, San Francisco, CA, USA) and Gemini (Google LLC, Mountain View, CA, USA) were used exclusively for English language editing and proofreading to ensure grammatical accuracy. The authors reviewed and edited the content as needed and take full responsibility for the content of the publication.
References
1. Epstein LJ. Clinical guideline for the evaluation, management and long-term care of obstructive sleep apnea in adults. J Clin Sleep Med. 2009;5:263–19.
2. Yaggi HK, Concato J, Kernan WN, et al. Obstructive sleep apnea as a risk factor for stroke and death. N Engl J Med. 2005;353:2034–2041. doi:10.1056/NEJMoa043104
3. Gami AS, Olson EJ, Shen WK, et al. Obstructive sleep apnea and the risk of sudden cardiac death: a longitudinal study of 10,701 adults. J Am Coll Cardiol. 2013;62:610–616. doi:10.1016/j.jacc.2013.04.080
4. Peppard PE, Young T, Palta M, Skatrud J. Prospective study of the association between sleep-disordered breathing and hypertension. N Engl J Med. 2000;342:1378–1384. doi:10.1056/NEJM200005113421901
5. Reichmuth KJ, Austin D, Skatrud JB, Young T. Association of sleep apnea and type II diabetes: a population-based study. Am J Respir Crit Care Med. 2005;172:1590–1595. doi:10.1164/rccm.200504-637OC
6. Engleman HM, Douglas NJ. Sleep. 4: sleepiness, cognitive function, and quality of life in obstructive sleep apnoea/hypopnoea syndrome. Thorax. 2004;59:618–622. doi:10.1136/thx.2003.015867
7. Benjafield AV, Ayas NT, Eastwood PR, et al. Estimation of the global prevalence and burden of obstructive sleep apnoea: a literature-based analysis. Lancet Respir Med. 2019;7:687–698. doi:10.1016/S2213-2600(19)30198-5
8. Young T, Evans L, Finn L, Palta M. Estimation of the clinically diagnosed proportion of sleep apnea syndrome in middle-aged men and women. Sleep. 1997;20:705–706. doi:10.1093/sleep/20.9.705
9. Berry RB, Budhiraja R, Gottlieb DJ, et al. Rules for scoring respiratory events in sleep: update of the 2007 AASM manual for the scoring of sleep and associated events. deliberations of the sleep apnea definitions task force of the American academy of sleep medicine. J Clin Sleep Med. 2012;8:597–619. doi:10.5664/jcsm.2172
10. Kapur VK, Auckley DH, Chowdhuri S, et al. Clinical practice guideline for diagnostic testing for adult obstructive sleep apnea: an American academy of sleep medicine clinical practice guideline. J Clin Sleep Med. 2017;13:479–504. doi:10.5664/jcsm.6506
11. Collop NA, Anderson WM, Boehlecke B, et al. Clinical guidelines for the use of unattended portable monitors in the diagnosis of obstructive sleep apnea in adult patients. J Clin Sleep Med. 2007;3:737–747.
12. Guilleminault C, Connolly S, Winkle R, Melvin K, Tilkian A. Cyclical variation of the heart rate in sleep apnoea syndrome. Mechanisms, and usefulness of 24 h electrocardiography as a screening technique. Lancet. 1984;1:126–131. doi:10.1016/S0140-6736(84)90062-X
13. Thomas RJ, Mietus JE, Peng C-K, Goldberger AL. An electrocardiogram-based technique to assess cardiopulmonary coupling during sleep. Sleep. 2005;28:1151–1161. doi:10.1093/sleep/28.9.1151
14. Thomas RJ, Mietus JE, Peng C-K, et al. Relationship between delta power and the electrocardiogram-derived cardiopulmonary spectrogram: possible implications for assessing the effectiveness of sleep. Sleep Med. 2014;15:125–131. doi:10.1016/j.sleep.2013.10.002
15. Thomas RJ, Wood C, Bianchi MT. Cardiopulmonary coupling spectrogram as an ambulatory clinical biomarker of sleep stability and quality in health, sleep apnea and insomnia. Sleep. 2017. doi:10.1093/sleep/zsx196
16. Hsu Y-S, Chen T-Y, Wu D, et al. Screening of obstructive sleep apnea in patients who snore using a patch-type device with electrocardiogram and 3-axis accelerometer. J Clin Sleep Med. 2020;16:1149–1160. doi:10.5664/jcsm.8462
17. Liu W-T, Lin S-Y, Tsai C-Y, et al. Comparison of hospital-based and home-based obstructive sleep apnoea severity measurements with a single-lead electrocardiogram patch. Sensors. 2021;21:8097. doi:10.3390/s21238097
18. Yeh C-H, Kuo TBJ, Li J-Y, et al. Effects of age and sex on vasomotor activity and baroreflex sensitivity during the sleep-wake cycle. Sci Rep. 2022;12:22424. doi:10.1038/s41598-022-26440-3
19. Chang J-C, Huang W-L, Liu C-Y, et al. Heart rate variability reactivity to food image stimuli is associated with body mass index. Appl Psychophysiol Biofeedback. 2021;46:271–277. doi:10.1007/s10484-021-09514-2
20. Huang W-L, Liao S-C, Tu Y-K, et al. Autonomic reactivity during reading of a somatic distress script in patients with somatic symptom disorder. J Psychosom Res. 2019;123:109729. doi:10.1016/j.jpsychores.2019.05.007
21. Lee L-A, Chuang -H-H, Hsieh H-S, et al. Using sleep heart rate variability to investigate the sleep quality in children with obstructive sleep apnea. Front Public Health. 2023;11:1103085. doi:10.3389/fpubh.2023.1103085
22. Karaoğuz MR, Yurtseven E, Aslan G, et al. The quality of ECG data acquisition, and diagnostic performance of a novel adhesive patch for ambulatory cardiac rhythm monitoring in arrhythmia detection. J Electrocardiol. 2019;54:28–35. doi:10.1016/j.jelectrocard.2019.02.012
23. Huang J-Y, Liao P-L, Chang H-P, Su P-H. Association of sleep patterns and respiratory disturbance index with physiological parameters in pediatric patients with self-perceived short stature. Diagnostics. 2024;14:1675. doi:10.3390/diagnostics14151675
24. TaghiBeyglou B, Kamal T, Almeida F, Yadollahi A. Statistical analysis of distribution-based spectral features of low-sampled snoring vibrations in predicting treatment outcomes in obstructive sleep apnea.
25. Rueda-Calixto M, et al. Detection of sleep apnea based on ECG recording, pulse, and heart rate variability. 2024.
26. Chen L. Automatic detection of obstructive sleep apnea through nonlinear dynamics of single-lead ECG signals. Appl Intell. 2025;55:102.
27. Lachance CC, Bailey S. At-home polysomnography versus in-clinic polysomnography for sleep disorders. Can J Health Technol. 2023;3.
28. El Shayeb M, Topfer L-A, Stafinski T, Pawluk L, Menon D. Diagnostic accuracy of level 3 portable sleep tests versus level 1 polysomnography for sleep-disordered breathing: a systematic review and meta-analysis. Can Med Assoc J. 2014;186:E25–E51. doi:10.1503/cmaj.130952
29. Duarte M, Pereira-Rodrigues P, Ferreira-Santos D. The role of novel digital clinical tools in the screening or diagnosis of obstructive sleep apnea: systematic review. J Med Internet Res. 2023;25:e47735. doi:10.2196/47735
30. Chakrabarti S, Biswas N, Jones LD, Kesari S, Ashili S. Smart consumer wearables as digital diagnostic tools: a review. Diagnostics. 2022;12:2110. doi:10.3390/diagnostics12092110
31. Magnusdottir S, Hilmisson H. Ambulatory screening tool for sleep apnea: analyzing a single-lead electrocardiogram signal (ECG). Sleep Breath. 2018;22:421–429. doi:10.1007/s11325-017-1566-6
32. Chen J-W. A signal segmentation‐free model for electrocardiogram‐based obstructive sleep apnea severity classification. Adv Intell Syst. 2023;2200275. doi:10.1002/aisy.202200275
 © 2026 The Author(s). This work is published and licensed by Dove Medical Press Limited. The
full terms of this license are available at https://www.dovepress.com/terms
and incorporate the Creative Commons Attribution
- Non Commercial (unported, 4.0) License.
By accessing the work you hereby accept the Terms. Non-commercial uses of the work are permitted
without any further permission from Dove Medical Press Limited, provided the work is properly
attributed. For permission for commercial use of this work, please see paragraphs 4.2 and 5 of our Terms.
© 2026 The Author(s). This work is published and licensed by Dove Medical Press Limited. The
full terms of this license are available at https://www.dovepress.com/terms
and incorporate the Creative Commons Attribution
- Non Commercial (unported, 4.0) License.
By accessing the work you hereby accept the Terms. Non-commercial uses of the work are permitted
without any further permission from Dove Medical Press Limited, provided the work is properly
attributed. For permission for commercial use of this work, please see paragraphs 4.2 and 5 of our Terms.