")
Back to Journals » International Journal of General Medicine » Volume 16
Pan-Cancer Analysis and Validation of Opioid-Related Receptors Reveals the Immunotherapeutic Value of Toll-Like Receptor 4
Authors Wu S, Chen J, Huang E , Zhang Y
Received 14 August 2023
Accepted for publication 6 November 2023
Published 24 November 2023 Volume 2023:16 Pages 5527—5548
DOI https://doi.org/10.2147/IJGM.S434076
Checked for plagiarism Yes
Review by Single anonymous peer review
Peer reviewer comments 2
Editor who approved publication: Dr Scott Fraser
Shaoping Wu,1 Junnan Chen,1 Enmin Huang,2– 4 Yongfa Zhang1
1Department of Anesthesiology, the Second Affiliated Hospital, Shantou University Medical College, Shantou, Guangdong, People’s Republic of China; 2Biomedical Innovation Center, the Sixth Affiliated Hospital, Sun Yat-sen University, Guangzhou, Guangdong, People’s Republic of China; 3Department of Gastroenterological Surgery and Hernia Center, the Sixth Affiliated Hospital, Sun Yat-sen University, Guangzhou, Guangdong, People’s Republic of China; 4Guangdong Provincial Key Laboratory of Colorectal and Pelvic Floor Diseases, the Sixth Affiliated Hospital, Sun Yat-sen University, Guangzhou, Guangdong, People’s Republic of China
Correspondence: Enmin Huang; Yongfa Zhang, Email [email protected]; [email protected]
Introduction: The relationship between the expression of opioid-associated receptors and cancer outcomes is complex and varies among studies.
Methods: This study focused on six opioid-related receptors (OPRM1, OPRD1, OPRK1, OPRL1, OGFR, and TLR4) and their impact on cancer patient survival. Bioinformatics analysis was conducted on 33 cancer types from The Cancer Genome Atlas database to examine their expression, clinical correlations, mechanisms in the tumor microenvironment, and potential for immunotherapy. Due to significantly lower expression of OPRM1, OPRD1, and OPRK1 compared to OGFR and TLR4, the analysis concentrated on the latter two genes.
Results: OGFR was highly expressed in 16 tumor types, while TLR4 showed low expression in 13. Validation from external samples, the Gene Expression Omnibus, and the Human Protein Atlas supported these findings. The diagnostic value of these two genes was demonstrated using the Genotype-Tissue Expression database. Univariate Cox regression models and Kaplan-Meier curves confirmed OGFR’s impact on prognosis in a cancer type-specific manner, while high TLR4 expression was associated with a favorable prognosis. Analysis of the tumor microenvironment using a deconvolution algorithm linked OGFR to CD8+ T cells and TLR4 to macrophages. Single-cell datasets further validated this correlation. In 25 immune checkpoint blockade treatment cohorts, TLR4 expression showed promise as an immunotherapy efficacy predictor in non-small cell lung cancer, urothelial carcinoma, and melanoma.
Conclusion: In a pan-cancer analysis of 33 tissues, OGFR was consistently highly expressed, while TLR4 had low expression. Both genes have diagnostic and prognostic significance and are linked to immune cells in the tumor microenvironment. TLR4 has potential as an immunotherapeutic response marker.
Keywords: opioid-related receptors, pan-cancer analysis, immune checkpoint blockade therapy, TLR4, OGFR, prognosis, macrophage, CD8+ T cell
Introduction
The potential role of opioids used in oncology patients has been controversial. Epidemiological and retrospective studies have demonstrated that lower opioid doses and regional anesthesia (epidural, intrathecal, or paravertebral) for breast,1 colon,2 or melanoma3 are linked to lower rates of cancer recurrence, while general anesthesia with high opioid doses is linked to higher rates of cancer recurrence.4–6 However, unfavorable and contrasting results have been reported by studies on colorectal7 and esophageal squamous cell carcinomas.8 In a high-quality prospective trial on breast cancer, Sessler and colleagues9 discovered that regional anesthesia (propofol + paravertebral block) was not better than general anesthesia (sevoflurane + opioids) in preventing disease recurrence after radical surgery. However, a stratified analysis based on molecular typing was not performed, and this may have limited the explanatory power of this result, as triple-negative breast cancers were later observed to be associated with improved recurrence free survival with intraoperative opioid dosing.10 This suggests that the effects of opioids are dependent on the molecular contexts of tumors.11 Therefore, the modulatory effect of opioids may vary depending on the genetic and molecular backgrounds of tumors.
In preclinical models, differences in tumor recurrence rates attributable to opioids may result from their direct or indirect effects on tumor cell growth and metastasis. The direct mechanisms include stimulation of tumor cell proliferation and invasion and inhibition of apoptosis.12 The indirect mechanisms include immunosuppression.11 Opioid receptors are predominantly found in central and peripheral neuronal tissues; however, cancer cells can express these receptors differently from non-cancerous tissues and can stimulate opioid-associated tumorigenic processes.13,14 Several studies conducted within the past decade have found an association between opioid receptor gene expression levels and the outcomes of specific cancer types.15,16 This implies that at the molecular level, the activation or antagonism of extra-neural opioid receptors may have an impact on tumor endpoints, and the expression levels of opioid receptors in tumor tissue evidently modulate this relationship.10,17
Given the controversial results of previous studies, which may be due in part to differences in methodology, species, dose, and timing of administration,10 we conducted a comprehensive transcriptomic data-based study of the role of opioid-related receptors in pan-cancer. We hypothesized that the expression of opioid-related receptors in tumor tissue is predictive of the prognosis of tumor patients, immune status of the microenvironment, and efficacy of immunotherapy. The four classical opioid receptors, which are OPRM1, OPRD1, OPRK1, and OPRL1, are included (from https://www.guidetopharmacology.org/), as well as OGFR and TLR4, which are known to bind to opioids and are independently associated with survival outcomes of tumor patients.10 We evaluated the expressions and activities of these genes in 33 types of tumors from The Cancer Genome Atlas (TCGA) database, followed by a focused analysis of OGFR and TLR4 related to clinical correlation, potential mechanisms of tumor modulation, and immunotherapeutic implications.
Methods
Data Collection and Quantitative Real-Time PCR (RT-qPCR)
Genomic, somatic mutation-related, and clinicopathological information on tumor tissues was obtained from TCGA database (https://portal.gdc.cancer.gov/) using the University of California Santa Cruz Xena browser (https://xena.ucsc.edu) and the Genotype-Tissue Expression (GTEx) database (https://www.gtexportal.org). The final TCGA dataset included 15,776 samples of 33 cancer types and normal tissues. In addition, we searched 18 datasets from the Gene Expression Omnibus (GEO) database (https://www.ncbi.nlm.nih.gov/geo) for validation. These datasets were GSE10927, GSE13507, GSE93601, GSE26566, GSE68468, GSE53625, GSE108474, GSE13601, GSE40435, GSE53757, GSE26574, GSE89377, GSE75037, GSE67061, GSE18520, GSE32688, GSE87211, and GSE26899. See Table S1 for more information on the GEO datasets used in this study.
We collected 145 pairs of samples (50 of colon adenocarcinoma [COAD], 30 of esophageal squamous cell cancer [ESCA], 35 of liver hepatocellular carcinoma [LIHC], and 30 of lung adenocarcinoma [LUAD]) from the Sixth Affiliated Hospital of Sun Yat-Sen University. Each sample contained paired tumors and adjacent normal tissues. The study was approved by the Ethics Committees of the Sixth Affiliated Hospital of Sun Yat-Sen University (No. 2021ZSLYEC-064).
TLR4 differential expression between cancer tissues and matching normal tissues was investigated by RT-qPCR. In brief, total RNA from the frozen tissues was extracted using TRIzol reagent (Invitrogen, USA), and then using a PrimeScript RT reagent Kit (TaKaRa), we reverse-transcribed the total RNA into cDNA. Next, using TB Green® Premix Ex Taq (TaKaRa) and GAPDH as the endogenous control, we detected the mRNA expression of TLR4 by using the 2−ΔΔCT method. The primers used in this study were as follows: TLR4 forward 5′-AGACCTGTCCCTGAACCCTAT-3′ and reverse 5′-CGATGGACTTCTAAACCAGCCA-3′; GAPDH forward 5′- GCTCTCTGCTCCTCCTGTTC-3′ and reverse 5′- ACGACCAAATCCGTTGACTC-3′.
Levels of Expression of Opioid-Related Receptors in Normal and Tumor Tissues in Patients with Pan-Cancer Using TCGA, GEO, and Human Protein Atlas (HPA) Databases
Given that certain levels of expressions and activities of genes in tumor tissues are necessary for biological function,10 we used two methods to screen for candidate genes from the list of six opioid-related receptor genes (OPRM1, OPRD1, OPRK1, OPRL1, OGFR, and TLR4). The “limma” package in R (version 4.2.2) and the internal reference gene GAPDH were used to determine whether the opioid-related receptor genes were sufficiently expressed in tumor tissues. Secondly, the “GSVA” package was used to estimate the activity of each gene in the samples for each cancer type. The package first used the Pearson correlation test to construct a list of 100 genes co-expressed with the target gene. Subsequently, these gene sets were mapped to a predefined gene set using the single sample gene set enrichment analysis; the cumulative density function was derived using the Gaussian algorithm; and the expression statistics of the gene sets were aggregated into enrichment scores, called activity scores, for individual samples.18 Higher scores were associated with greater gene activity. The expression and activity of OGFR and TLR4 passed the screening stage and their differential expression in normal and tumor tissues of pan-cancer was assessed using the TCGA database. This was followed by independent validations at the mRNA level using multiple GEO datasets and the protein level using the HPA database.
DNA Promoter Methylation Analysis
The UALCAN online database (http://ualcan.path.uab.edu/) was used to evaluate the promoter methylation of the DNA of OGFR in pan-cancer to investigate the potential upstream signaling sources of OGFR. In addition, we employed the DNMIVD database (http://119.3.41.228/dnmivd/index/) to validate our findings. DNMIVD stands as a comprehensive annotation and interactive visualization resource for DNA methylation profiles across diverse human cancer contexts. This valuable resource is constructed utilizing high-throughput microarray data sourced from the TCGA and GEO datasets.
Clinical Correlation of OGFR and TLR4
The levels of expression of OGFR and TLR4 were evaluated for different age groups, gender, and stages of pan-cancer. Receiver operating characteristic (ROC) curves and areas under the curves (AUCs) based on the data for normal donor samples from the GTEx database were used to evaluate the diagnostic value of two genes for pan-cancer. This part of the analysis was carried out using the online software Xiantao Academic (https://www.xiantao.love/), which has a built-in “pROC” package. Univariate Cox regression with the hazard rate (HR) and the Kaplan-Meier (K-M) method with the Log rank test were used to assess the overall survival, disease-free survival (DFS), disease-specific survival (DSS), and progression-free survival (PFS) of the TCGA pan-cancer cohort. This part of the analysis was conducted using the “survival” package.
Functional Enrichment Analysis
To further investigate the signaling pathways associated with OGFR and TLR4, we obtained the differential pathways of the low and high expression groups for the two genes in pan-cancer from the Kyoto Encyclopedia of Genes and Genomes database and performed gene set enrichment analysis (GSEA). Statistical significance was denoted by corrected false discovery rates (FDRs) of < 0.05 and absolute log2 fold changes of ≥ 1. The c5.go.v7.4.symbols and c2.cp.kegg.v7.4.symbols were used as the annotation reference sets for gene ontology (GO) and Kyoto encyclopedia of genes and genomes (KEGG) pathway analysis, respectively. The top 5 signaling pathways with the highest normalized enrichment scores (NESs) were visualized using the “enrichplot” package. This part of the enrichment analysis was conducted using the “org.Hs.eg.db” package. In addition, we used the CancerSEA (http://biocc.hrbmu.edu.cn/CancerSEA/) database to investigate the functional statuses of two genes. This database contains the data of 41,900 single cells from 25 cancer tissues and summarizes the functional statuses of 14 types of cancer cells.
Correlations Between Tumor Microenvironment and OGFR and TLR4
The ESTIMATE package19 is a tool to assess the degree of stromal and immune cell infiltration in the tumor microenvironment, and it was used to calculate the stromal and immune scores for each sample; the higher the score, the higher the corresponding cell infiltration for that sample. The correlations between expression levels of OGFR and TLR4 and stromal or immune scores were evaluated, with correlation coefficients of ≥ 0.4 and p-values of < 0.01 as thresholds. Subsequently, the contents of the 22 tumor-infiltrating immune cells were estimated for each tumor sample using the CIBERSORT package based on the deconvolution algorithm20 and tested for correlation with the two genes, with parameters set to a correlation coefficient ≥ 0.4 and a p-value < 0.001. Finally, the single-cell levels of expressions of OGFR and TLR4 in the tumor microenvironment were verified using the single-cell portal (https://singlecell.broadinstitute.org/) and scRNASeqDB database (https://bioinfo.uth.edu/scrnaseqdb/).
Potential Immunotherapeutic Implication of OGFR and TLR4
The expression of immune inhibitors, tumor mutation burden (TMB), and microsatellite instability (MSI) are strongly associated with immune treatment response, and we evaluated the correlations between the expression levels of OGFR and TLR4 and these indicators. The relationships between the two genes and immune inhibitors were investigated using the TISIDB online database (http://cis.hku.hk/TISIDB/index.php). TMB was defined as the total number of errors in somatic gene coding, base substitution, gene insertions, or deletions detected in every million bases. To determine the TMB for each case, the total number of mutations counted was divided by the exome size (38 Mb was utilized as the exome size). MSI scores for each TCGA cancer case from previously published studies.21 The results were visualized using the “fmsb” package. Finally, we evaluated the expressions of two genes in the response and non-response groups of 25 clinical studies on anti-PD-1, anti-PDL1, and anti-CTLA4 immunotherapy to assess whether the two genes could predict the efficacy of immunotherapy. This analysis was carried out using the online database ICBatlas (http://bioinfo.life.hust.edu.cn/ICBatlas/) and visualized using the online tool SangerBox (http://vip.sangerbox.com/login.html).
Connectivity Map (CMap) Analysis
CMap (https://clue.io/)22,23 serves as an internet-based repository, capable of scrutinizing disease-specific gene expression patterns and identifying comparable or contrasting effects of small molecule compounds. The connectivity between a query signature and a perturbagen in a specific cell line is measured using a connectivity score (tau), which ranges from +100 to −100. The median tau score is a numerical value that summarizes the connectivity score between a query signature and a perturbagen across different cell lines. Signatures with a high positive connectivity score are considered to be positively connected, while those with a high negative score are considered to be negatively connected. The “query” tool of CMap was used to search out the anti-TLR4/OGFR chemical compounds, the heatmap was plotted to show the top 10 compounds.
Statistical Analysis
R software (version 4.2.2) was used to conduct all statistical analyses in this study. The Student’s t-test or the Wilcoxon rank-sum test was employed to assess continuous variables. When comparing data among three or more groups, ANOVA was used to calculate the P-value, if applicable. When the data does not satisfy the Gaussian distribution, use the Mann–Whitney test. Chi-squared or Fisher’s exact test was used to compare the categorical clinicopathological characteristics. Pearson correlation analysis was used for the correlation analysis. Statistical significance was denoted by p-values of less than 0.05 or 0.01. The statistical analysis methods were carried out following established and validated procedures.24–26
Results
Expressions and Activities of TLR4 and OGFR in Tumor Tissues Meet the Requirements for Further Analysis
Figure 1 illustrates the work flow of this study. Table S2 displays the abbreviation list of 33 cancers from the TCGA. Using GAPDH as an internal reference, we first evaluated the expressions of six opioid-related receptor gene mRNAs in 33 tumor tissues (Figures 2A-D and S1A-C and Table S3). The levels of expression of four classical receptors, OPRM1, OPRD1, OPRK1 and OPRL1, were low; on average, they were 1–2 orders of magnitude lower than those of GAPDH, OGFR, and TLR4 (Table S3). These low expressions are consistent with previous observations on triple-negative breast cancer10 and pan-cancer tissues.27 In addition, the gene activity scores (Figures S1D-F) for OPRD1, OPRK1, and OPRL1 in tumor tissues calculated using the ssGSEA method were lower than those for GAPDH (Figure 2E), OGFR (Figure 2F), and TLR4 (Figure 2G); on the other hand, the expression of OPRM1 was too low to evaluate the activity. Given that certain levels of expression and activity of a gene in tumor tissues is necessary for biological function, these results imply that OPRM1, OPRD1, OPRK1, and OPRL1 may not play an important regulatory function in tumor tissues. To ensure that the subsequent analysis was more robust, we maintained only the OGFR and TLR4 genes for further analysis.
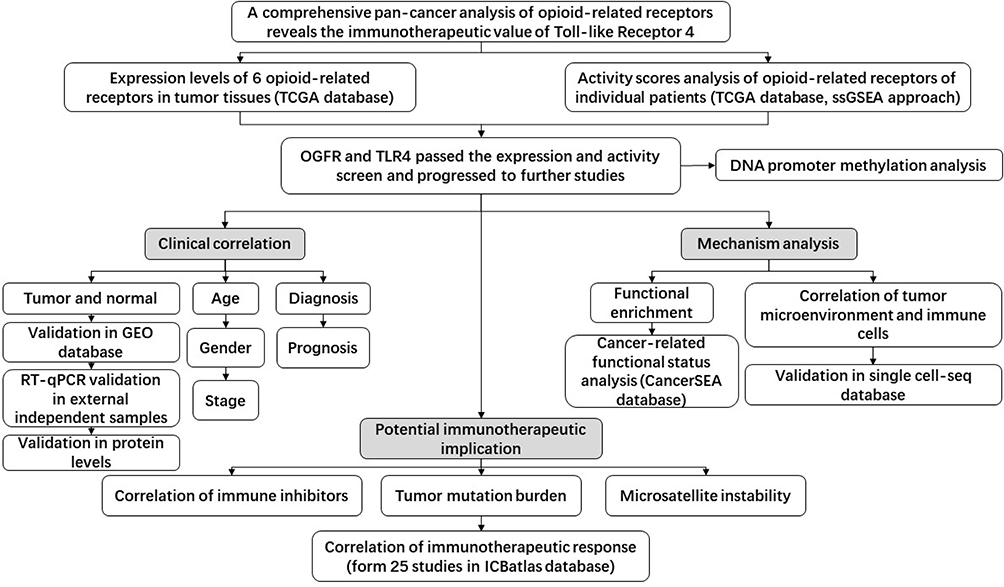 |
Figure 1 Workflow of the study. Abbreviations: TCGA, The Cancer Genome Atlas; ssGSEA, single sample gene set enrichment analysis; GEO, Gene Expression Omnibus; RT-qPCR, quantitative real-time PCR. |
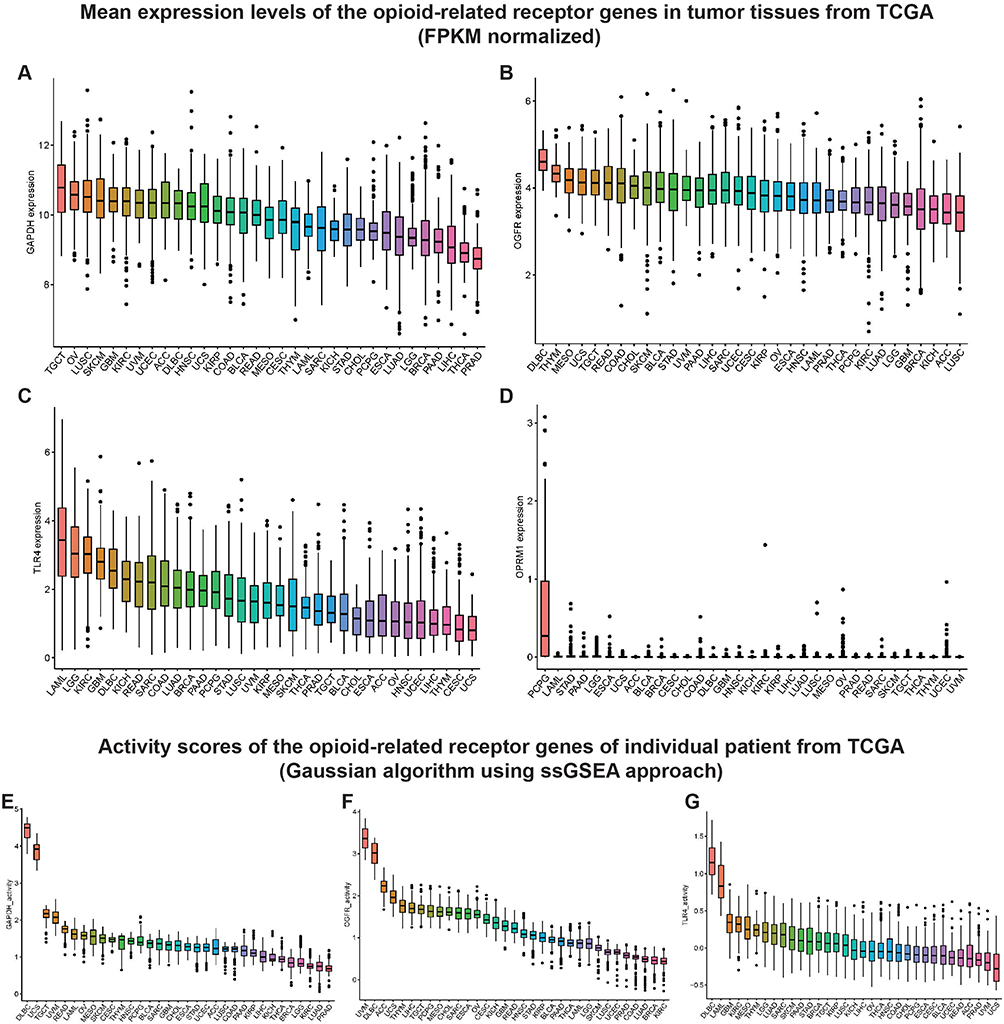 |
Figure 2 Mean expression levels and activity scores of the opioid-related receptor genes in TCGA pan-cancer samples. Notes: Mean expression levels of (A) GAPDH, (B) OGFR, (C) TLR4, and (D) OPRM1 in TCGA pan-cancer tumor tissues. The mRNA expression levels (FPKM normalized) of OGFR, TLR4, and OPRM1 were individually assessed in 33 tumor tissues. GAPDH was used as a reference gene here to provide a clear reference point for the mRNA expression levels of each opioid-related receptor. Mean activity scores of (E) GAPDH, (F) OGFR, and (G) TLR4 in TCGA pan-cancer tumor tissues. Higher scores are associated with increased gene activity. Similarly, GAPDH was used as an internal reference gene to visually assess the activity levels of various opioid-related receptors. TCGA, The Cancer Genome Atlas. |
Differential Expressions of OGFR Were Found in Cancerous and Normal Tissues in 17 Cancer Types and TLR4 in 15
As shown in Figure 3A, OGFR was highly expressed in 16 cancer tissues (BLCA, BRCA, CHOL, COAD, ESCA, HNSC, KICH, KIRC, KIRP, LIHC, PCPG, PRAD, READ, SARC, STAD, and THCA) and lowly expressed in only LUSC. In contrast, TLR4 was only highly expressed in GBM and KIRP tumor tissues; its expressions in the other 13 tumor tissues (BLCA, BRCA, CESC, CHOL, KICH, KIRP, LIHC, LUAD, LUSC, PAAD, PRAD, THCA, and UCEC) (Figure 3B) were low. The expressions of the two genes were independently validated using the GEO datasets (Figures 3C-J and S2A-J).
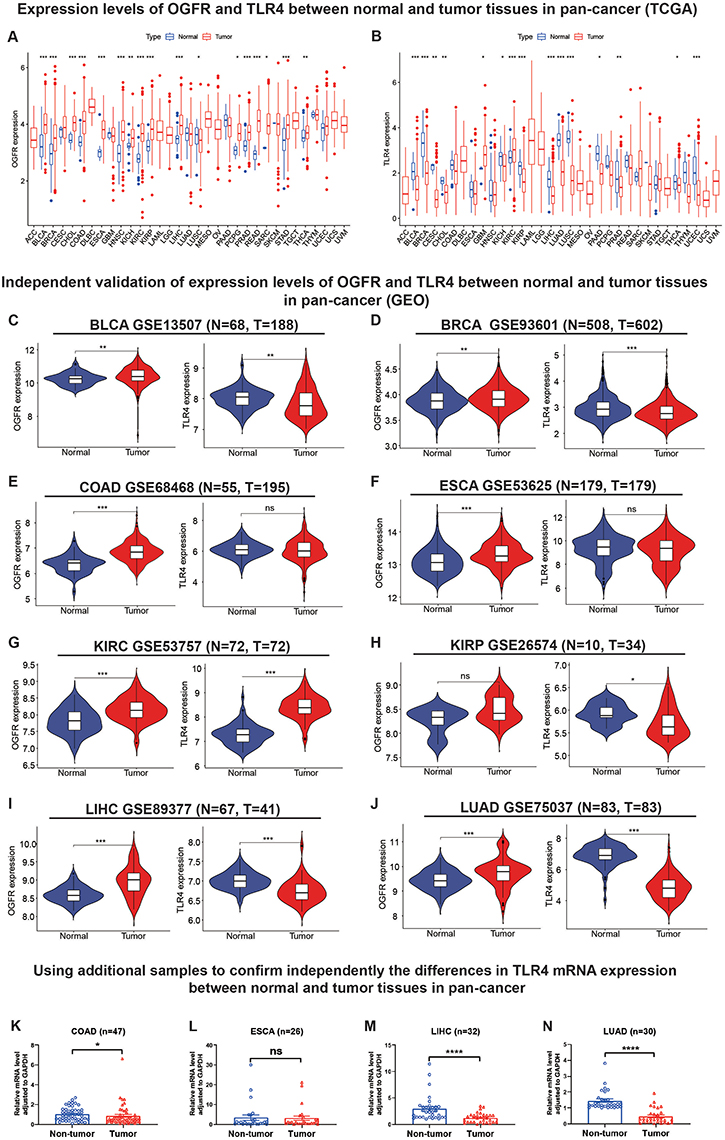 |
Figure 3 Analysis and independent validation of mRNA expression levels of OGFR and TLR4 in normal and tumor tissues in pan-cancers from TCGA, GEO databases and external samples. Abbreviation: ns, not significant; TCGA, The Cancer Genome Atlas; GEO, Gene Expression Omnibus. Notes: Expression levels of (A) OGFR and (B) TLR4 in normal and tumor tissues in TCGA pan-cancer. Expression levels of OGFR and TLR4 in (C) BLCA, (D) BRCA, (E) COAD, (F) ESCA, (G) KIRC, (H) KIRP, (I) LIHC, and (J) LUAD databases from GEO. The mRNA expression levels were normalized by FPKM methods. The mRNA expression of the TLR4 gene was verified by qRT-PCR in (K) 47 pairs of COAD samples, (L) 26 pairs of ESCA samples, (M) 32 pairs of LIHC samples, and (N) 30 pairs of LUAD samples (samples after exclusion of outliers). Comparisons between groups were made using the Mann–Whitney test, and data were presented using means±standard errors (SEM). *p<0.05, **p<0.01, ***p<0.001, ****p<0.0001. |
In addition, we detected TLR4 expression by RT-qPCR in samples obtained from our institution in order to further validate the TLR4 mRNA expression in external samples. The results revealed that TLR4 expression was significantly higher in normal tissues than in tumor tissues (COAD [p<0.05], ESCA [p<0.0001], and LUAD [p<0.0001], Figure 3K-N) after excluding outliers (3 pairs in COAD samples, 4 pairs in ESCA samples, and 3 pairs in LIHC samples, respectively. Detailed exclusion samples can be found in the raw data attached to this paper). The next representative immunohistochemical images of the HPA database demonstrated a difference in expression from the protein level (Figure 4A-X). This implies that OGFR may be a risk gene in most cancers, while TLR4 is a protective gene.
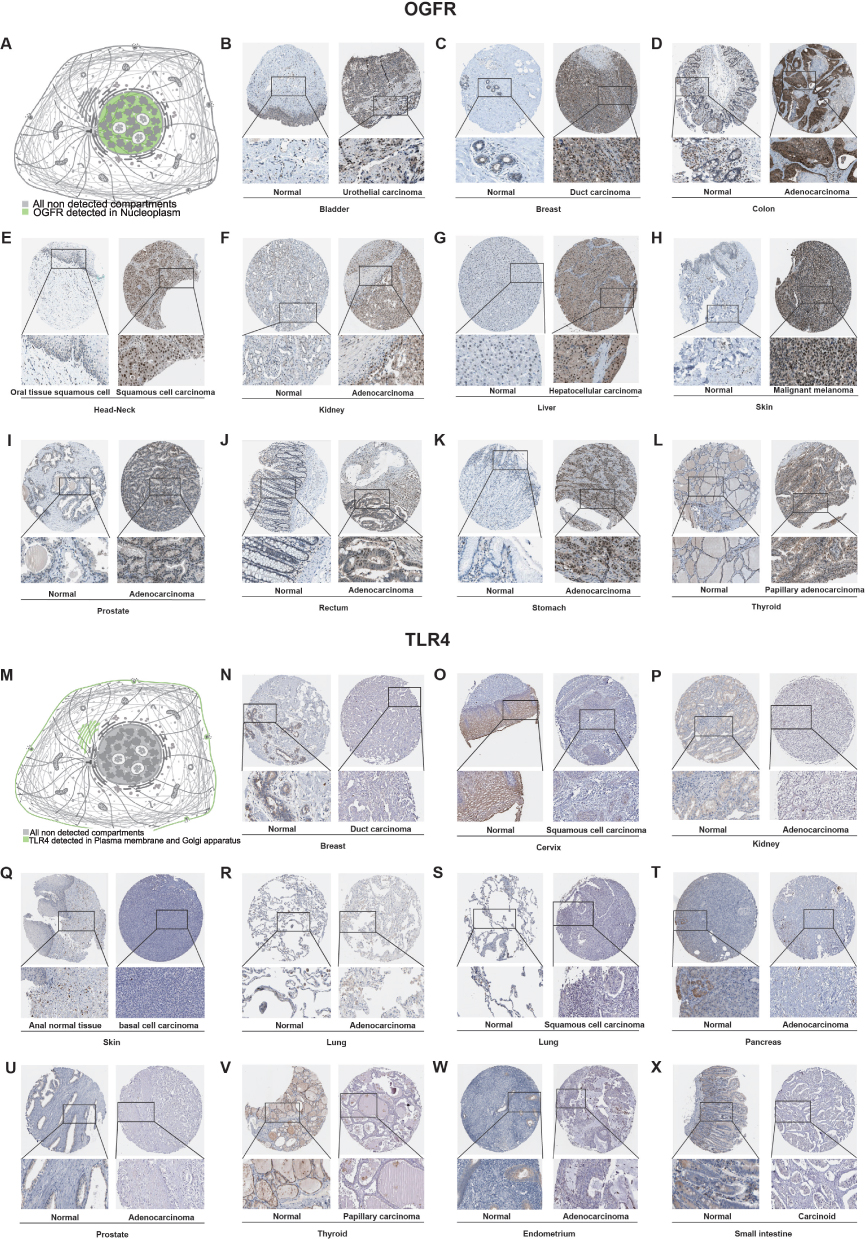 |
Figure 4 Representative immunohistochemistry images showing the levels of protein expressions by (A–L) OGFR and (M–X) TLR4 in normal and tumor tissues in pan-cancers from the HPA database. Abbreviation: HPA, Human Protein Atlas. |
DNA Promoter Methylation Levels Suggest the Source of Upstream Activation Signals for OGFR
To explain the aberrant expressions of OGFR and TLR4 in tumors, we searched the UALCAN database for evidence of upstream DNA promoters. However, the TLR4 gene could not be evaluated because lack of data in the UALCAN database. Promoter hypomethylation levels of OGFR were observed in BLCA, CHOL, COAD, ESCA, HNSC, KIRC, and STAD, whereas hypermethylation levels were noted in LUSC, PRAD, and UCEC, with normal tissue serving as a reference (Figure S3A-V). Furthermore, we corroborated OGFR DNA methylation patterns using the DNMIVD database. This analysis revealed that BLCA, COAD, ESCA, HNSC, KIRC, and STAD exhibited hypomethylation of OGFR DNA, whereas LUSC and PRAD exhibited hypermethylation. These findings align closely with the results obtained from the UALCAN database (Figure S4A-J). These observations help shed light on why OGFR is highly expressed in many cancer tissues.
OGFR and TLR4 Have Moderate Diagnostic Values for Pan-Cancer
A clinical correlation analysis stratified by age, sex, and disease stage (Figure S5A-F) showed that the expression of OGFR increased with disease progression, while that of TLR4 reduced. This was consistent with the observation that OGFR is a risk gene while TLR4 is a protective gene.
Using normal tissue samples from the GTEx database as a reference, we evaluated the diagnostic values of OGFR and TLR4 (Figures 5A, B and S6A, B). We found that OGFR in DLBC, KIRC, KIRP, LUAD, LUSC, OV, PAAD, STAD, TGCT, and THCA and TLR4 in ACC, BLCA, BRCA, CESC, GBM, GBMLGG, LAML, LGG, LUAD, LUSC, OV, PAAD, PRAD, READ, STAD, TGCT, THCA, THYM, UCEC, and UCS had more than moderate diagnostic values (AUC>0.7) (Figure 5A and B).
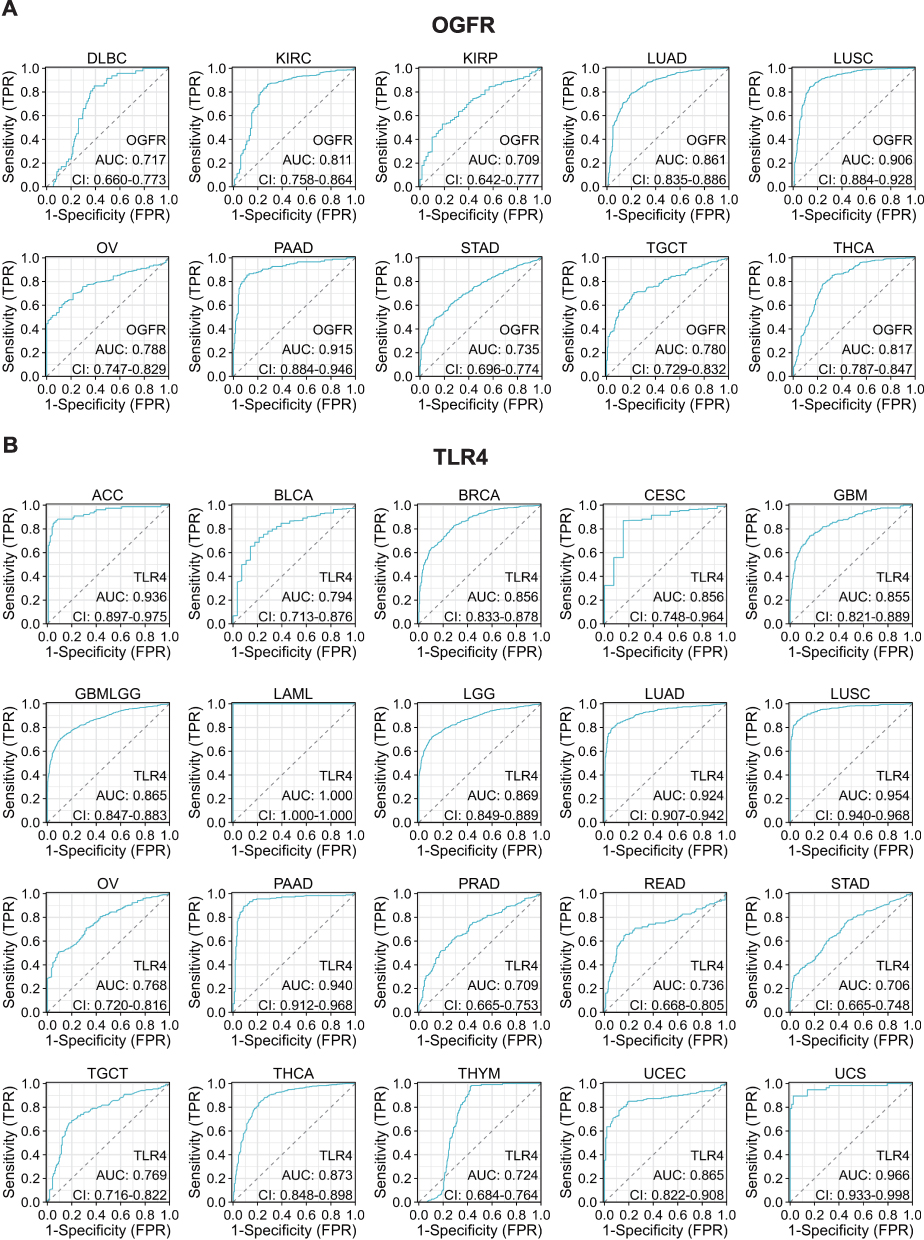 |
Figure 5 Representative ROC curve (AUC > 0.7) for (A) OGFR and (B) TLR4 in pan-cancer (using GTEx normal samples as reference). Abbreviations: ROC, receiver operating characteristic; AUC, area under the curve; GTEx, genotype-tissue expression project; CI, confidence interval; TPR, true positive rate; FPR, false positive rate. |
Patients with High TLR4 Expressions Have Better Prognoses and OGFR is Cancer-Specific
As shown in Figure 6A, a univariate cox regression model suggested that high OGFR expression was associated with a better prognosis for BLCA (HR=0.721, 95% confidence interval (CI): 0.556–0.935, p=0.014), MESO (HR= 0.508, 95% CI: 0.279–0.923, p=0.026), and SKCM (HR= 0.716, 95% CI: 0.575–0.891, p=0.003) but a worse prognosis for LAML (HR=1.889, 95% CI: 1.268–2.814, p=0.002) and LGG (HR=1.874, 95% CI: 1.263–2.779, p=0.002). These results were validated using K-M curves (Figure 6B-F). Patients with high TLR4 expression usually have a better prognosis (Figure 6G), and this can be observed for ACC (HR=0.475, 95% CI: 0.255–0.886, p=0.019), KIRC (HR=0.712, 95% CI: 0.591–0.857, p<0.001), LUAD (HR=0.834, 95% CI: 0.7–0.995, p=0.043), SKCM (HR=0.763, 95% CI: 0.662–0.88, p<0.001), and UCEC (HR=0.663, 95% CI: 0.492–0.893, p=0.007), meanwhile confirmed by K-M curves (Figures 6H-L). The TGCT, despite the opposite trend, has too large a confidence interval (95% CI: 1.866–230.811) and is not considered to be informative. The same trend can be observed for DFS, DSS, and PFS (Figure S7A-F); OGFR affects prognosis in a cancer type-dependent manner, while high TLR4 expression leads to a good prognosis.
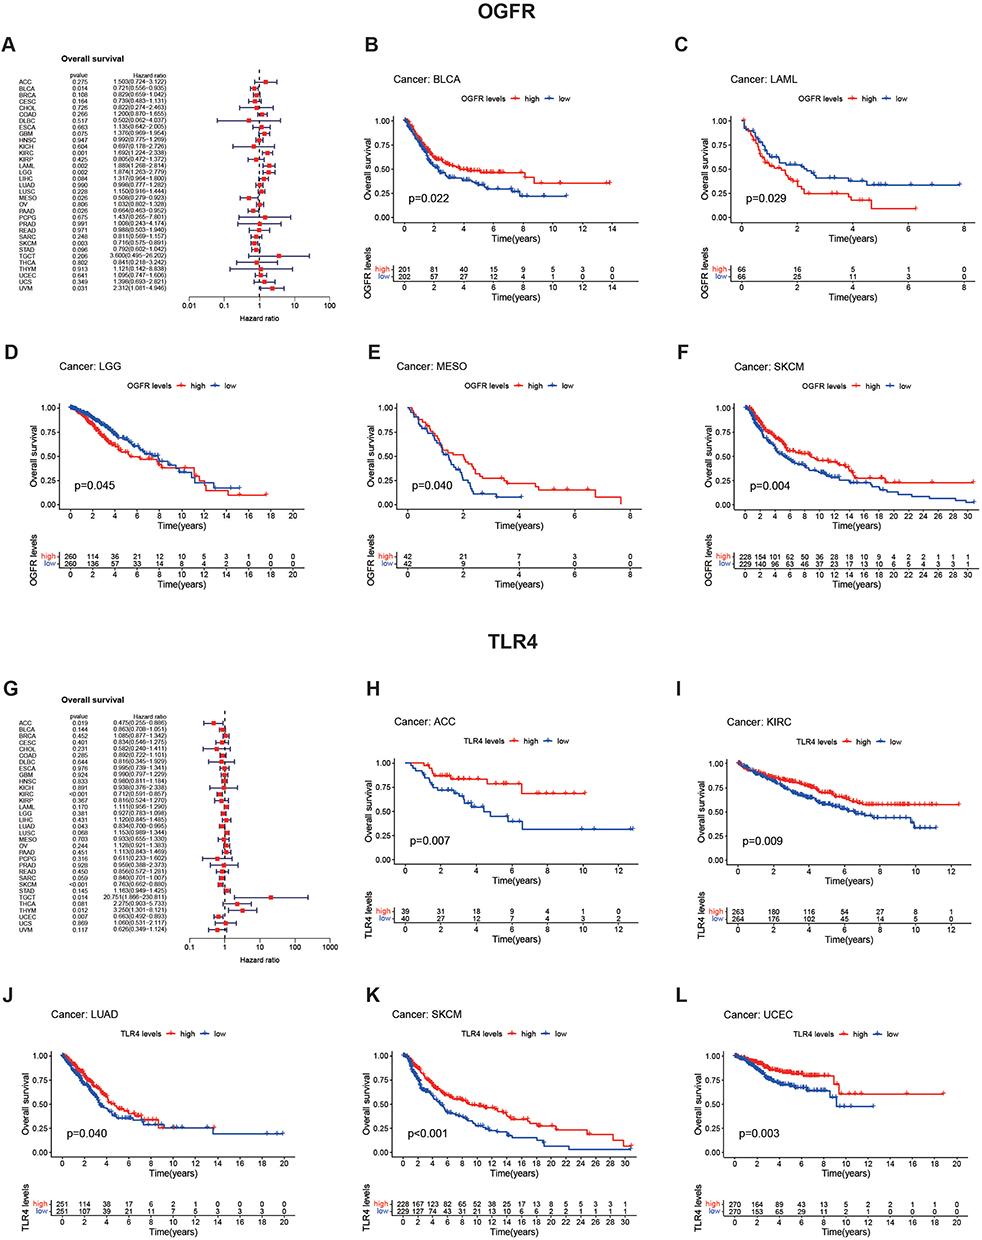 |
Figure 6 Analysis of prognostic values of OGFR and TLR4 in pan-cancer (TCGA) using forest and K-M plots. Notes: Univariate Cox regression with hazard rate (HR) was used to investigate the prognostic values of (A) OGFR and (G) TLR4 expression levels. P-values of < 0.05 indicated that the proportional hazards assumption was not violated. The genetic risk is expressed using the hazard ratio and 95% confidence interval. K-M curves were used to validate the findings of the forest plot for (B–F) OGFR and (H–L) TLR4 in variable tumor types. The Log rank test result was statistically significant with a p-value of 0.05. |
Functional Enrichment Studies Show Strong Correlations Between OGFR and TLR4 Expressions and Immune Response
The functional enrichment analysis of the two representative cancer types, SKCM and BLCA, is shown in Figure 7A-H and Table S4. For SKCM, GO analysis revealed that the group with high OGFR expression showed enriched adaptive immune response (NES=2.212, p-value=0.011, FDR q-value=0.388) and T-cell activation (NES=2.099, p-value=0.011, FDR q-value=0. 388), while the KEGG analysis revealed a predominant enrichment of antigen processing and presentation (NES=2.02, p-value=0.014, FDR q-value=0.111) and cytokine-cytokine receptor interaction (NES=1.962, p-value=0.012, FDR q-value=0.111). Similarly, associations between the expressions of the two genes and the immune response were observed in the high OGFR expression group for BLCA and the high TLR4 expression group for both SKCM and BLCA (Figures 7B-H). In addition, OGFR expression was strongly associated with the differentiation of retinoblastoma (RB) tumors and negatively associated with DNA repair in RB and uveal melanoma (Figure S8A). TLR4 was associated with angiogenesis and negatively associated with cell cycle and DNA damage in RB (Figure S8B).
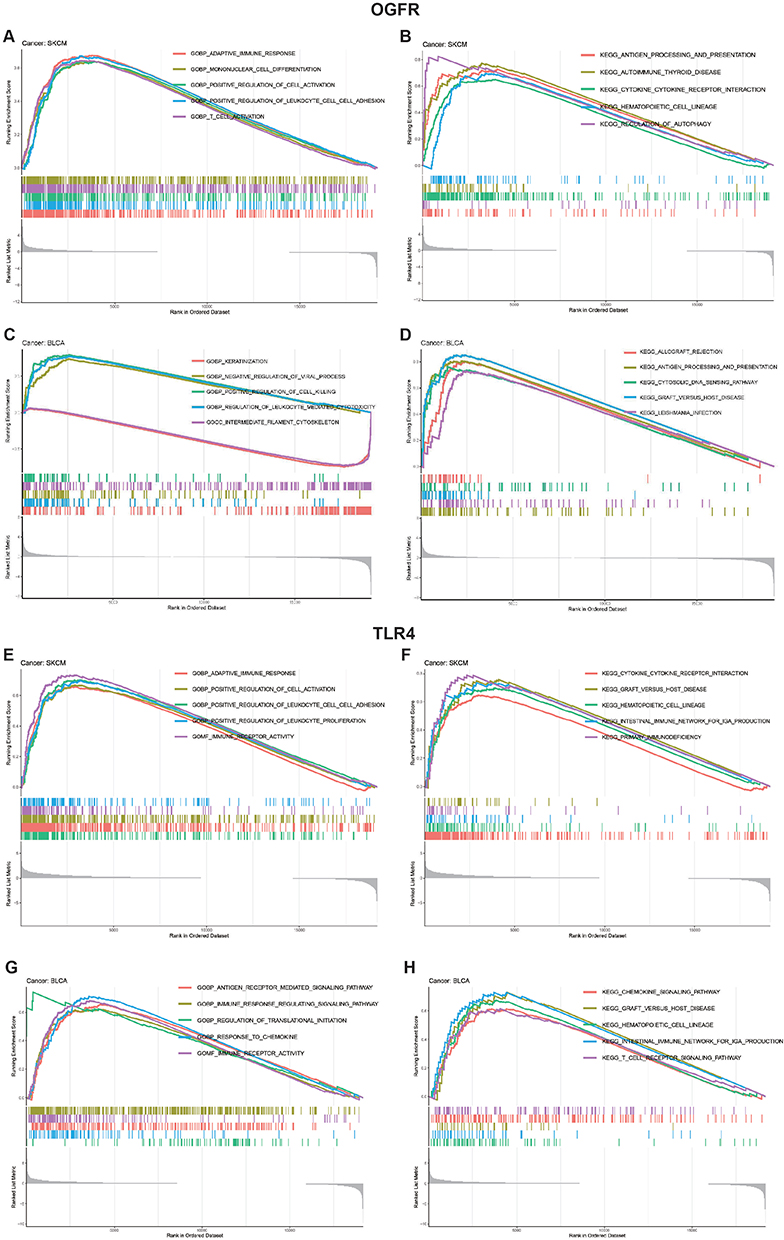 |
Figure 7 GO and KEGG functional enrichment analyses of (A–D) OGFR and (E–H) TLR4 in TCGA skin cutaneous melanoma (SKCM) and bladder urothelial carcinoma (BLCA). Note: For each panel, the pathways marked on the left were enriched in the high-target gene expression group, while the pathways marked on the right were enriched in the low-target gene expression group. |
Tumor Microenvironment Analysis Revealed That OGFR Was Associated with CD8+ T Cells, Whereas TLR4 Was Associated with Macrophages
Similar to the findings of the functional enrichment analysis, Figure 8 shows that OGFR and TLR4 expressions are positively correlated with the immune scores of different tumor types. The correlation coefficients of OGFR expression and the immune scores of CESC, HNSC, LAML, and SARC were greater than 0.4 (Figure 8A-D); OGFR expression levels were mainly positively correlated with the infiltration intensity of CD8+ T cells (Figure 8E-H). The correlation coefficients of TLR4 expression and the immune scores of CHOL, LUAD, LUSC, and OV were greater than 0.7 (Figure 8I-L); TLR4 expression was mainly associated with macrophages of LAML and THYM (Figure 8M-P). To verify this correlation, we used an online single-cell database to investigate the expressions of these two genes in the cell sub-population (Figure 9A-J). OGFR expression is more diffuse and can be expressed in tumor cells and monocytes or macrophages in the melanoma tumor microenvironment (Figure 9B); dendritic cells (DCs), CD8+ T cells, and tumor-associated macrophages in renal cell carcinoma (Figure 9D); and fibroblasts and PLZF+ (ZBTB16) T cells in colon cancer (Figure 9E). TLR4, on the other hand, was more consistent and expressed in macrophages in all tumor microenvironments (Figures 9F-J). These findings based on single-cell sequencing data support those for bulk sequencing using the deconvolution algorithm in the CIBERSORT package, particularly the finding that there is a strong correlation between the expressions of macrophages and TLR4.
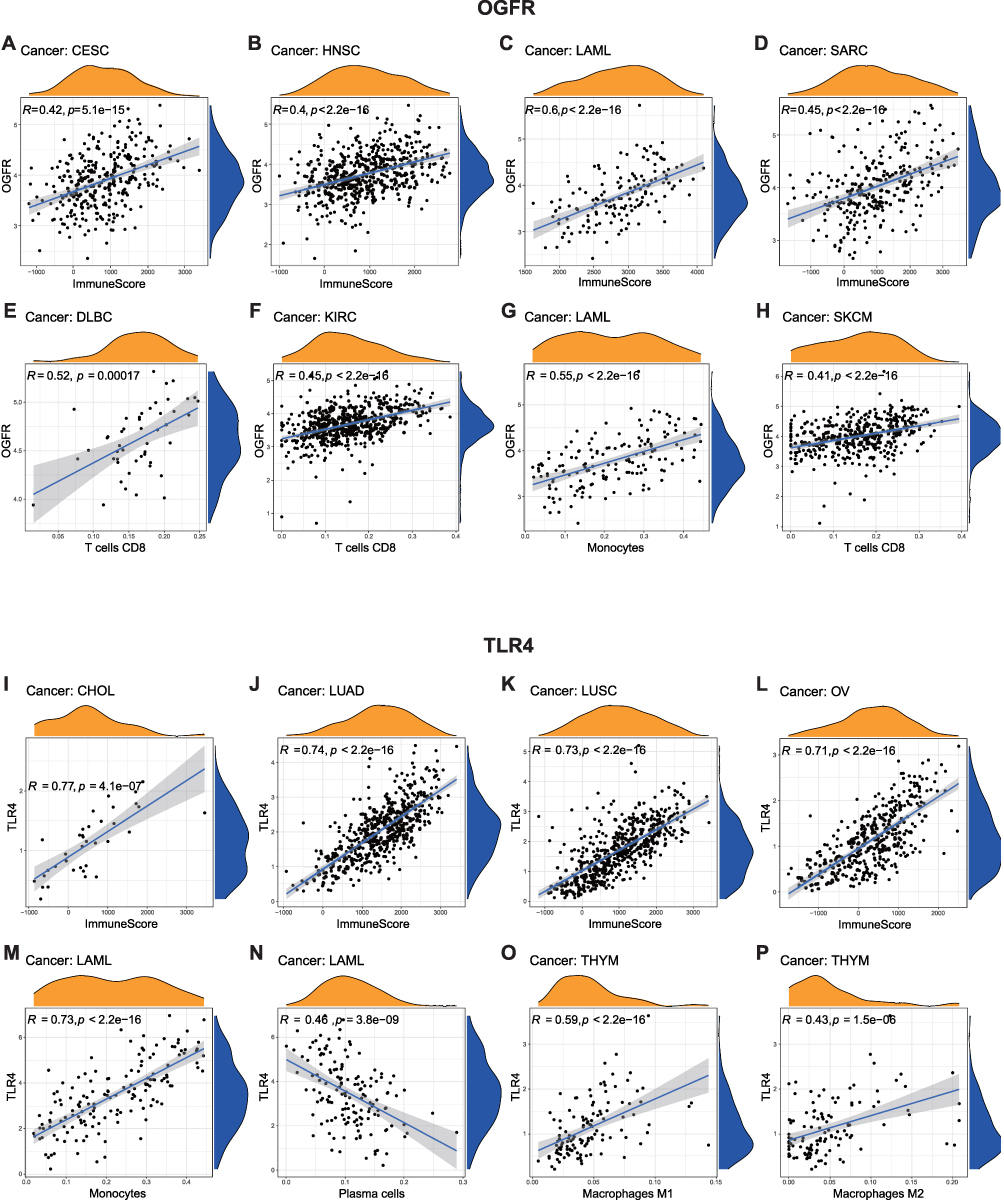 |
Figure 8 Correlations between (A–H) OGFR and (I–P) TLR4 expressions and the ESTIMATE score and immune cell infiltration. Notes: The ESTIMATE score includes the stromal score (indicates the presence of stromal cells in tumor tissues) and the immune score (represents the infiltration of immune cells in tumor tissues). The correlation between the expression levels of OGFR and TLR4 and stromal or immune scores were assessed. A higher correlation coefficient (R-value) indicates a stronger association between OGFR or TLR4 expression and stromal or immune cell infiltration in the respective samples. The CIBERSORT algorithm was employed to compute the relationship between the expression of OGFR and TLR4 and the extent of infiltration by various types of immune cells. Similarly, a higher R-value indicates a stronger correlation between the gene and a specific type of immune cell in the corresponding tumor tissue. The correlations were plotted if R>0.4 and p<0.05. |
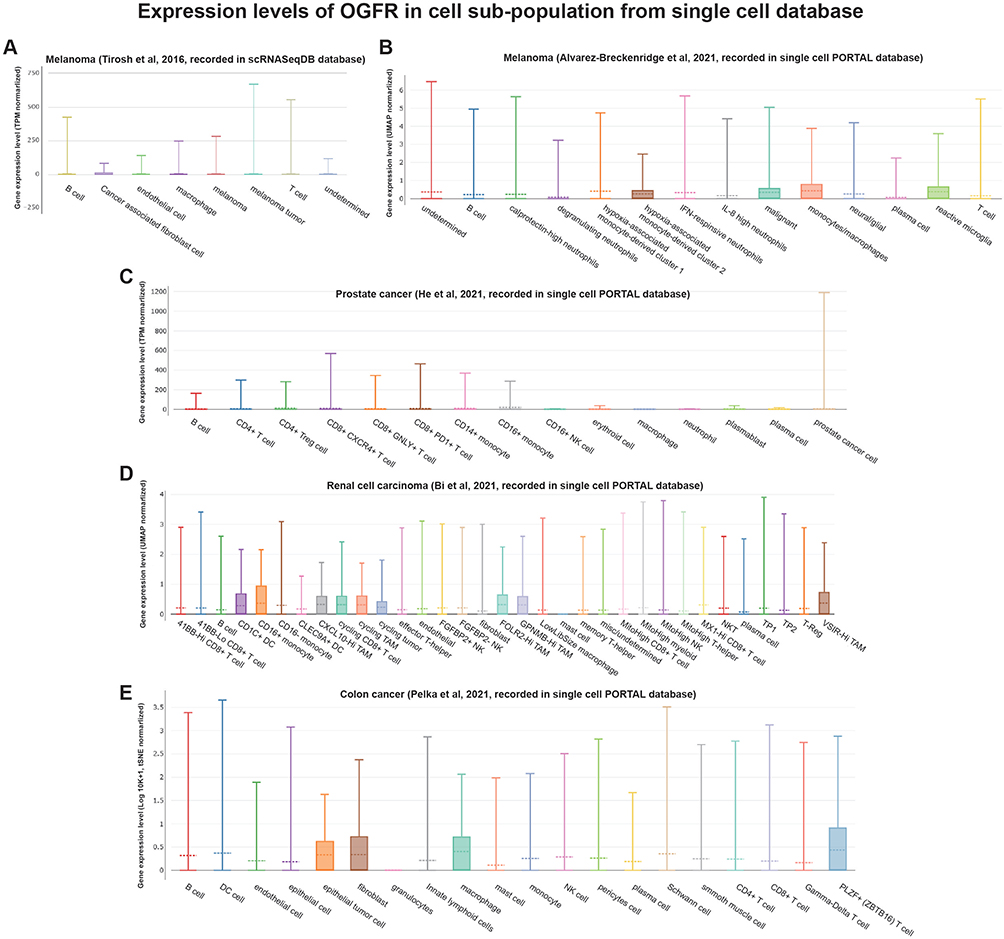 |
Figure 9 Continued. |
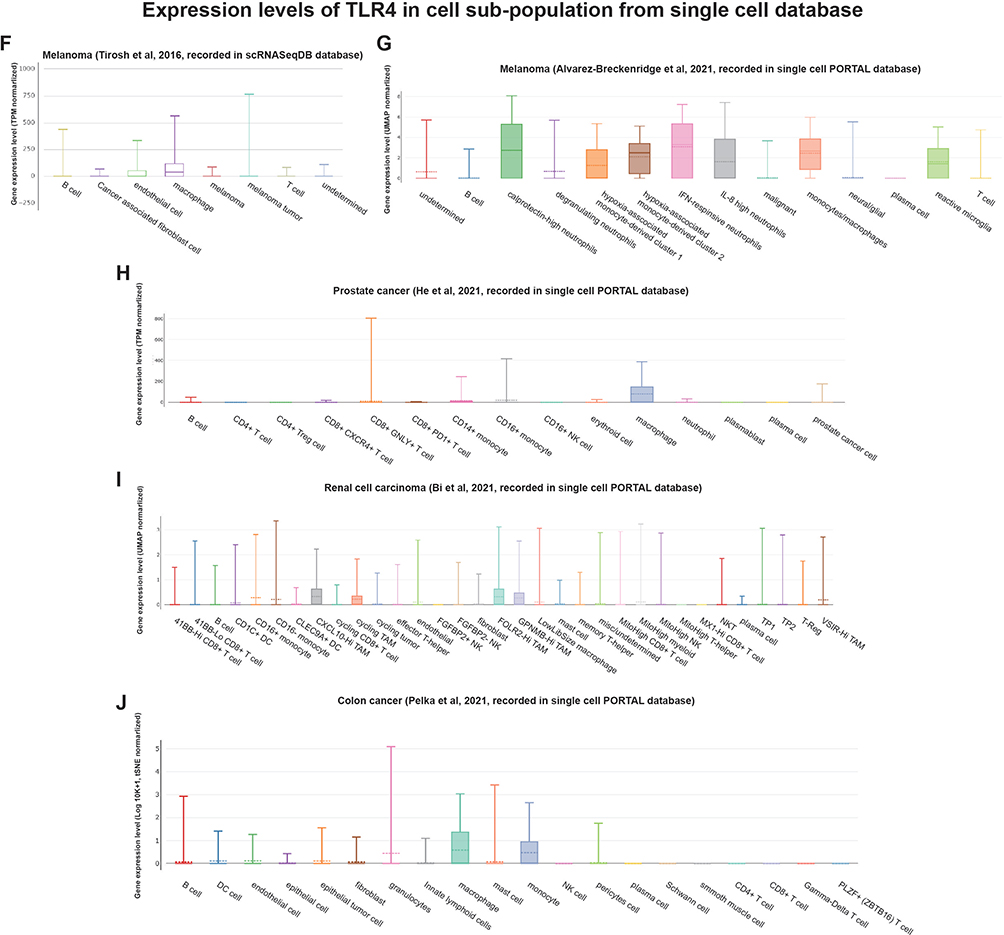 |
Figure 9 Single-cell RNA-Seq databases were used to investigate the levels of expression of (A–E) OGFR and (F–J) TLR4 in the cell sub-population of the tumor microenvironment. Abbreviations: TPM, transcripts per million; UMAP, uniform manifold approximation and projection; tSNE, t-distributed stochastic neighbor embedding. |
TLR4 Expression Potentially Predicts Immunotherapy Efficacy for Non-Small Cell Lung Cancer, Urothelial Carcinoma, and Melanoma
Using the TISIDB database, we found that OGFR expression was negatively correlated with the immune checkpoint CD274 expression in KIRP and positively correlated with CTLA4 expression in TGCT (Figure 10A). The expression of OGFR was also significantly correlated with the TMBs for BRCA, CESC, ESCA, LAML, LGG, LIHC, PAAD, PRAD, STAD, and THCA (Figure 10B) and the MSI scores for BLCA, CESC, COAD, DLBC, HNSC, KIRP, LGG, LUAD, LUSC, PRAD, TGCT, and THCA (Figure 10C). The expressions of TLR4, CD274, and CTLA4 were positively correlated in KIRC and OV (Figure 10D). TLR4 expression was also significantly correlated with the TMBs of ACC, BLCA, BRCA, CHOL, DLBC, HNSC, LAML, LGG, LIHC, LUAD, LUSC, MESO, OV, PAAD, PRAD, STAD, TGCT, THCA, THYM, and UVM (Figure 10E) and the MSI scores for DLBC, HNSC, KIRP, LGG, LIHC, LUAD, LUSC, PRAD, READ, SKCM, STAD, TGCT, THCA, and UCS (Figure 10F). As shown in Figure 10G, differential expressions of TLR4 were observed in the responder and non-responder groups in three independent cohorts. In responders with melanoma (SRP150548) and non-small cell lung cancer (SRP183455), TLR4 expression was high; in contrast, TLR4 expression was low in urothelial carcinoma (IMvigor210). The online database ICBatlas also provides a response score for each gene for use in determining the fold change and universality of differentially expressed genes at the dataset or cancer type level, allowing users to understand the extent of gene impact on immune checkpoint blockade (ICB) response more intuitively.28 The degree of gene effect on ICB response was positively correlated with the absolute response score, and genes with a positive response score were upregulated in responders, which contributed to a good prognosis.28 Therefore, we evaluated the response score for TLR4 and compared it with the top 20 gene response scores at two levels: the dataset and cancer type levels (Table S5). OGFR cannot be evaluated because no data are available. As shown in Table S5, the TLR4 response scores reached 3.829 for both levels of comparison, which were comparable to those for the top 20 response genes, indicating the potential of TLR4 as a predictive biomarker of immunotherapy response.
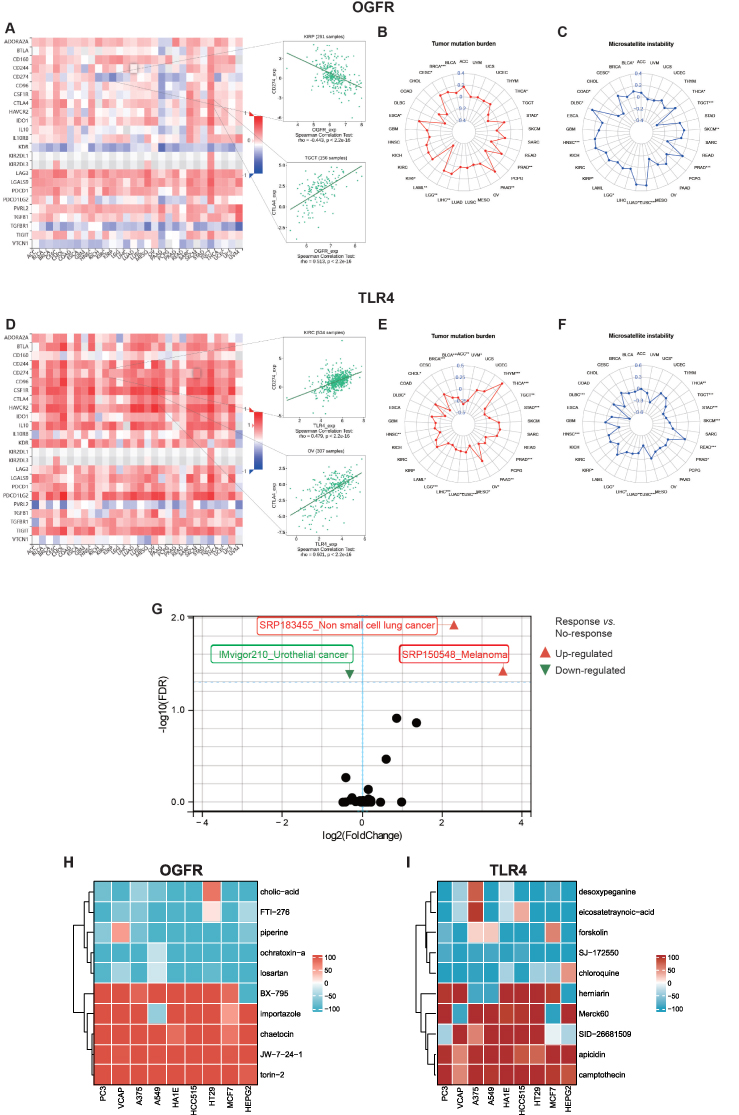 |
Figure 10 The potential immunotherapeutic implication of OGFR and TLR4. Notes: The correlations between the expressions of (A) OGFR and (D) TLR4 and immune inhibitors. Red indicates a positive correlation whereas blue indicates a negative correlation. The top 2 strongest associations were displayed via dotplots. Radar plots represented the relationships between OGFR (B and C) and TLR4 (E and F) expressions and tumor mutation burden and microsatellite instability, respectively. The numbers are correlation coefficients, with negative values in the inner circle indicating negative correlation and positive values in the outer circle indicating positive correlation. Higher absolute values indicate a stronger correlation. *p<0.05, **p<0.01, ***p<0.001. (G) The scatter plot shows the levels of expression of TLR4 in the responder and non-responder groups in 25 immunotherapy cohorts. Points in triangles or circles represent each clinical cohort, and p-values of < 0.05 after FDR correction denote statistical significance. Heatmaps of small molecule compounds targeting (H) OGFR and (I) TLR4 obtained from the Connectivity Map (CMap). Gene function modulation was assessed using the median tau score, ranging from −100 to +100. Higher scores signify enhanced gene function due to small molecule drugs in tumor cell lines, while lower scores indicate inhibition. Stronger promotion effects are denoted by redder color blocks, and stronger inhibition effects by bluer ones. |
CMap Analysis
We initiated our study by utilizing the GEPIA2 database to extract the top 100 genes closely associated with OGFR and TLR4, as outlined in Tables S6 and 7. Subsequently, we performed a comprehensive CMap analysis aimed at identifying potential small molecule compounds capable of reversing the expression patterns linked to TLR4 and OGFR. Notably, we presented the top 5 drugs/molecules exhibiting the most robust negative correlation and the top 5 drugs/molecules with the most pronounced positive correlation. For OGFR, this included ochratoxin-a, piperine, losartan, cholic-acid, FTI-276, JW-7-24-1, BX-795, importazole, torin-2, and chaetocin (Table S8). In the case of TLR4, the list comprised desoxypeganine, eicosatetraynoic-acid, forskolin, SJ-172550, chloroquine, herniarin, apicidin, camptothecin, SID-26681509, and Merck60 (Table S9). Additionally, we visually represented the impact of the top 10 small molecule compounds across 9 distinct tumor cell lines through a heatmap (Figures 10H-I). These intriguing findings warrant further investigation to ascertain the therapeutic potential of these drugs and molecules.
Discussion
The main findings of this study can be summarized as follows. First, the expressions and activities of the three canonical opioid receptors OPRM1, OPRD1, and OPRK1 and the opioid receptor-like receptor OPRL1 were relatively low in pan-cancer tumor tissues. On the other hand, the levels of expression and activities of the endogenous opioid-related receptors OGFR and TLR4 were higher; this expression and activity pattern may be a direct pathway for the biological effects of opioids in tumor tissues. Second, OGFR and TLR4 genes have diagnostic and prognostic values, but these vary with the tumor types. Third, the expressions of OGFR and TLR4 are associated with immune response; TLR4 may be concentrated in macrophages in the tumor microenvironment, and it can be used as a predictive biomarker for ICB efficacy in non-small cell lung cancer, urothelial carcinoma, and melanoma. This may serve as partial evidence that opioids directly influence the immune response. To our knowledge, this is the first study to focus on the direct association of tumor opioid-related receptors with immune responses in the tumor microenvironment through the integration of multiple public genetic databases.
Opioids are still the main drugs for the induction and intraoperative maintenance of anesthesia and postoperative analgesia.27 However, they can elicit a range of undesired consequences, including the inhibition of both cellular and humoral immune functions in humans, increase in angiogenesis, and promotion of tumor growth in rodents.9 Opioids are known to act indirectly on the nervous system, leading to the release of biogenic amines.11 They also activate the hypothalamic-pituitary-adrenal axis, leading to the release of glucocorticoids.29 In combination, the above effects weaken innate immunity by inhibiting NK cell cytotoxicity. The direct effects on immune function may be through opioid receptors, such as mu-opioid receptors (OPRM1 transcription product) or opioid-related receptors expressed by immune cells.30 The anti-tumor immune response involving these immune cells plays a critical role in controlling and eradicating cancer cells in individuals who have or are developing cancer.11 Thus, opioid and tumor opioid receptor interactions and their effect on tumor immunity have garnered marked interest among surgical oncology researchers.5 However, a large number of studies have yielded inconsistent results, which may be due, but not limited, to the following. First, opioids have central and peripheral effects or direct and indirect effects on tumor tissue, and confounding factors are numerous. This makes it difficult to investigate the perioperative relationship involving opioids, opioid receptors, and immunosuppression. Second, a significant part of the current evidence comes from experimental in vitro and in vivo models, with clinical evidence mostly limited to retrospective observational studies or post hoc analyses of randomized controlled trials originally designed to assess non-cancer outcomes,30 while the evidence from prospective studies with positive results is limited.10 Third, it is not sufficient to assess classical opioid receptors alone. It has recently been observed that some effects of opioids are not mediated by classical opioid receptors; they are also mediated by opioid-related receptors such as OGFR and TLR4.11,17,31 In response to the heterogeneity in these studies, a recent review critically assessed the currently available data from preclinical studies on the effects of morphine on tumor growth and metastasis, attempted to elucidate the parameters that may explain these differences, and discussed some of the essential criteria that preclinical models should meet to address this issue in a future clinically relevant setting.32 This suggests that the conclusion that opioids worsen cancer survival through their immunosuppressive effects is too general or too simplistic, as their effects may vary with cancer type.30 This necessitated the use of large sample datasets in public databases. On one hand, this would allow a more objective assessment of the molecular backgrounds of human patients with tumors for direct evidence of opioid effects in the tumor microenvironment; on the other hand, we focused only on the direct targets of opioid effects, which are the known opioid receptors, on tumor cells and the tumor microenvironment. The use of large validated databases such as TCGA and GTEx is effective27 for mapping the genetic footprint of opioid receptors in tumor cells.
Previously, Belltall and colleagues evaluated the expressions of 5 opioid-related receptors (OPRM1, OPRD1, OPRL1, OGFR, and TLR4) in 12 solid tumor types using the TCGA database.27 Similarly, they found that OPRM1, OPRD1, and OPRL1 expressions were low in tumor tissues. In addition, the expression of OGFR was high in most tumors (Odds Ratio (OR) [95% CI]: 2.39 [2.05–2.78]), while that of TLR4 was low (OR [95% CI]: 0.29 [0.26–0.32]).33 However, they did not find associations between the expressions of these genes and tumor prognosis. This is different from the findings of the present study, probably because they used a mixed Cox model that included age, cancer stage, and the expressions of OPRM1, OPRK1, OPRD1, OGFR, and TLR4 as covariables.33 This model is relatively comprehensive; however, the use of multiple parameters necessitates an increase in the sample size, which would otherwise limit the statistical power of the model.33 And the influence of other confounding factors not included in the analysis, such as type of surgery, pathologic stage, opioid agonist or antagonist administration, and other important molecular pathways that may also be involved in the effect of opioids on cancer growth. As mentioned in their paper, these parameters may have an effect on the association between opioid receptor expression and long-term cancer outcomes.33 Our study focused on assessing the relationship between opioid-related receptors and the tumor microenvironment, particularly the immune response. Therefore, a univariate Cox regression analysis and a K-M model were used for the prognostic analysis, which showed correlations between OGFR and TLR4 expressions and the prognosis of several tumors. These were validated using DFS, DSS, and PFS and confirmed in the subsequent tumor microenvironment analysis. We evaluated the relationships between receptors and immune cells using a deconvolution algorithm and bulk sequencing data and validated this relationship using available single cell sequencing data. Subsequently, we found a correlation between the expressions of TLR4 and macrophages and extrapolated the results for the immunotherapeutic response. The present study expanded the understanding that opioid-related receptors regulate tumor immune responses.
The expressions of classical opioid receptors were predominantly low in tumor tissues. This appears to be in contrast with the findings of several previous studies on the OPRM1 gene34–36 known to regulate tumor development and immune response, but there are reasons for this inconsistency. The OPRM1 gene expression is dependent on immune cell activation, as OPRM1 expression in T cells is non‐constitutive, and this may account for the discrepancy.11 In activated human T cells, OPRM1 mRNA increases to approximately 1% of neuronal levels and can produce functional μ-receptors in T cells.37 Several extracellular signals, including the cytokines IL-1, IL-4, IL-6, TNF, and IFN-γ, control OPRM1 gene transcription and cell surface opioid receptor expression in immune cells.11,38,39 In contrast with the OPRM1, which is subject to an expression pattern of induced reactivation, TLR4 tends to have a certain pre-existing expression abundance in tissues because this receptor is associated with innate immune system activation.40 These findings are supported by the current study; we discovered that the expression of TLR4 was lower in tumor tissues than in normal tissues (Figure 3), implying an immunosuppressed microenvironment in tumor tissues, which leads to a poor outcome (Figures 6 and S6). In the current evidence, a pre-existing immune response in the tumor microenvironment tends to have an effect of immunotherapy.41 Therefore, TLR4 expression can also be used to predict the effect of immunotherapy (Figure 10G).
The human OGFR gene consists of seven exons and six introns and encodes a 677-amino-acid protein localized to the nuclear membrane.42 Its ligand, OGF, is located in the cytoplasm. The binding of OGF and OGFR leads to translocation in the nucleus and plays a role in regulating cell growth and immune function.43 Several preclinical and clinical studies have shown that modulating the natural OGF-OGFR regulatory network represents a new non-toxic and highly effective approach to tumor therapy.43,44 The present study found a high expression of OGFR in several tumor tissues, which provides a rationale for the use of OGF as part of adjuvant therapy for cancer. Several factors contribute to gene expression, encompassing miRNA alterations and DNA methylation. In the context of breast cancer, Gangga Anuraga et al elucidated the regulatory role of hsa-miR-1236-3p, hsa-miR-4264, and hsa-miR-6839-3p on NEK2 expression.45 Meanwhile, Chen Xing et al established a positive association between CDCA3 promoter methylation and mRNA expression and further identified the prognostic significance of CDCA3-cg25700897 and CDCA3-cg09936970 methylation for PAAD patients using MethSurv.46,47 It’s noteworthy that OGFR DNA methylation might also play a prognostic role, although our paper did not explore this aspect.
TLR4 is localized on the cell membrane and is an important member of the Toll-like receptor family.48 TLR4 initiates downstream by sensing pathogen-associated molecular patterns and damage-associated molecular patterns signaling cascades that lead to the release of various types of cytokines and chemokines and the maturation of immune cells, playing a key role in the activation of innate and adaptive immune responses.49 Following the activation of TLR4 expressed by antigen-presenting cells such as macrophages and DCs, a wide range of pro-inflammatory substances, such as TNF-α, are produced, which induce DC maturation and migration, leading to T helper 1 lymphocyte proliferation.50 DC maturation is essential for the cross-presentation of tumor antigens to specific CD8+ T cells.51 TNF-α is also a key effector molecule for CD8+ T cells and NK cells.52 T helper 1 lymphocyte and cytotoxic CD8+ T cell responses are considered key factors that are necessary to achieve antitumor effects.53 The antitumor activity of TLR agonists was first reported as early as the 18th century when bacterial infections had the potential to inhibit cancer progression.54 TLR4 agonists, such as the BCG vaccine, imiquimod, and lipid monophosphate A, have been approved by the FDA for immunotherapy of superficial migratory cell carcinoma of the bladder and basal cell carcinoma and adjuvant use with vaccines for HPV-associated cervical cancer.55 More TLR4 agonists are currently in various stages of clinical trials.48 Thus, TLR4-based immunotherapy shows great promise for cancer treatment. To our knowledge, TLR4 has not been previously reported as a marker of immunotherapeutic response in ICB, and our results expand the knowledge in this area. Potential drug candidates influencing gene expression can be discerned through the analysis of the cMAP database. For instance, Chih-Yang Wang et al uncovered Fulvestrant’s efficacy in treating breast cancer via CMAP analysis.56 In our investigation, some of the small molecule compounds identified through CMAP analysis have garnered FDA approval, including chloroquine, while several others remain under research development. Nevertheless, these small molecule compounds offer valuable guidance for our future endeavors in tumor therapy research.
We should acknowledge some limitations of the study. First, there may be differences in baseline characteristics from GTEx and TCGA. Second, we evaluated the most common opioid receptor genes. However, other molecular pathways may also contribute to the effects of opioids on cancer development, given the wide range of physiological effects of opioids. Finally, our study was not validated in vivo, which is the focus of our future work.
Conclusion
We found that the expression of OGFR was high, while that of TLR4 was low in 33 pan-cancer tissues depending on the primary tumor analyzed. Both genes have diagnostic and prognostic values, and they are closely related to the immune cells in the tumor microenvironment. TLR4 is expressed in macrophages. While prospective experimental validation is needed, TLR4 can potentially serve as an ICB efficacy response marker. However, the mechanism of action of opioids (including endogenous and exogenous opioids) and their involvement with the OGFR and TLR4 pathways that lead to the development, progression, and prognosis of tumors need further study.
Abbreviations
OPRL1, opioid receptor-like 1; NK, natural killer; TCGA, The Cancer Genome Atlas; GTEx, Genotype-Tissue Expression; GEO, Gene Expression Omnibus; COAD, colon adenocarcinoma; ESCA, esophageal squamous cell cancer; LIHC, liver hepatocellular carcinoma; LUAD, lung adenocarcinoma; HPA, Human Protein Atlas; ROC, receiver operating characteristic; AUC, areas under the curve; HR, hazard rate; K-M, Kaplan-Meier; DFS, disease-free survival; DSS, disease-specific survival; PFS, progression-free survival; GSEA, gene set enrichment analysis; FDR, false discovery rate; GO, gene ontology; KEGG, Kyoto encyclopedia of genes and genome; NES, normalized enrichment score; TMB, tumor mutation burden; MSI, microsatellite instability; CI, confidence interval; RB, retinoblastoma; DCs, dendritic cells; ICB, immune checkpoint blockade.
Data Sharing Statement
Publicly available datasets were analyzed in this study. TCGA and GTEx data can be found here: (UCSC) Xena browser (https://xena.ucsc.edu/,) and the Genotype-Tissue Expression (GTEx) database (https://www.gtexportal.org/home/-index.html). GSE10927, GSE13507, GSE93601, GSE26566, GSE68468, GSE53625, GSE108474, GSE13601, GSE40435, GSE53757, GSE26574, GSE89377, GSE75037, GSE67061, GSE18520, GSE32688, GSE87211, and GSE26899 datasets were obtained from the GEO database (https://www.ncbi.nlm.nih.gov/geo). The original contributions presented in the study are included in the article. Further inquiries can be directed to the corresponding authors.
Ethics Approval and Consent to Participate
The study was conducted in accordance with the Declaration of Helsinki (as revised in 2013). The study was approved by the Research Ethics Committee of the Sixth Affiliated Hospital of Sun Yat-sen University (No. 2021ZSLYEC-064). Written informed consent was obtained from all participants.
Acknowledgments
We thank Sangerbox tools and Xiantao Academic Tools for providing online analysis tools for our bioinformatics analysis. We would like to express our sincere gratitude to Dr Haosheng Zheng for his bioinformatics analysis and chart production in the revised manuscript.
Funding
This work was supported by a grant from the Natural Science Foundation of Guangdong Province (No.2018A030313069). The funding agency was not involved in the study design, data collection, analysis and interpretation, or manuscript writing.
Disclosure
The authors declare that they have no competing interests.
References
1. Cronin-Fenton D. Opioids and breast cancer recurrence. Curr Opin Support Palliat Care. 2019;13(2):88–93. doi:10.1097/SPC.0000000000000426
2. Szczepaniak A, Fichna J, Zielińska M. Opioids in Cancer Development, Progression and Metastasis: focus on Colorectal Cancer. Curr Treat Options Oncol. 2020;21(1):6. doi:10.1007/s11864-019-0699-1
3. Vaseghi G, Ghasemi A, Laher I, et al. Morphine upregulates Toll-like receptor 4 expression and promotes melanomas in mice. Immunopharmacol Immunotoxicol. 2022;1–8.
4. Oh TK, Jeon JH, Lee JM, et al. Association of high-dose postoperative opioids with recurrence risk in esophageal squamous cell carcinoma: reinterpreting ERAS protocols for long-term oncologic surgery outcomes. Dis Esophagus. 2017;30(10):1–8. doi:10.1093/dote/dox074
5. Kim R. Effects of surgery and anesthetic choice on immunosuppression and cancer recurrence. J Transl Med. 2018;16(1):8. doi:10.1186/s12967-018-1389-7
6. Kim R. Anesthetic technique and cancer recurrence in oncologic surgery: unraveling the puzzle. Cancer Metastasis Rev. 2017;36(1):159–177. doi:10.1007/s10555-016-9647-8
7. Tai YH, Wu HL, Chang WK, et al. Intraoperative Fentanyl Consumption Does Not Impact Cancer Recurrence or Overall Survival after Curative Colorectal Cancer Resection. Sci Rep. 2017;7:10816. doi:10.1038/s41598-017-11460-1
8. Du KN, Feng L, Newhouse A, et al. Effects of Intraoperative Opioid Use on Recurrence-Free and Overall Survival in Patients With Esophageal Adenocarcinoma and Squamous Cell Carcinoma. Anesth Analg. 2018;127(1):210–216. doi:10.1213/ANE.0000000000003428
9. Sessler DI, Pei L, Huang Y, et al. Recurrence of breast cancer after regional or general anaesthesia: a randomised controlled trial. Lancet. 2019;394(10211):1807–1815. doi:10.1016/S0140-6736(19)32313-X
10. Montagna G, Gupta HV, Hannum M, et al. Intraoperative opioids are associated with improved recurrence-free survival in triple-negative breast cancer. Br J Anaesth. 2021;126(2):367–376. doi:10.1016/j.bja.2020.10.021
11. Boland JW, Pockley AG. Influence of opioids on immune function in patients with cancer pain: from bench to bedside. Br J Pharmacol. 2018;175(14):2726–2736. doi:10.1111/bph.13903
12. Kim R, Kawai A, Wakisaka M, et al. Current Status and Prospects of Anesthesia and Breast Cancer: does Anesthetic Technique Affect Recurrence and Survival Rates in Breast Cancer Surgery? Front Oncol. 2022;12:795864. doi:10.3389/fonc.2022.795864
13. Ma Y, Ren Z, Ma S, et al. Morphine enhances renal cell carcinoma aggressiveness through promotes survivin level. Ren Fail. 2017;39(1):258–264. doi:10.1080/0886022X.2016.1256322
14. Chen D, Chen Y, Yan Y, et al. Down-regulation of the tumour suppressor κ-opioid receptor predicts poor prognosis in hepatocellular carcinoma patients. BMC Cancer. 2017;17(1):553. doi:10.1186/s12885-017-3541-9
15. Connolly C, Madden SF, Buggy DJ, et al. Expression of anaesthetic and analgesic drug target genes in excised breast tumour tissue: association with clinical disease recurrence or metastasis. PLoS One. 2017;12:e0177105.
16. Ramirez MF, Gorur A, Cata JP. Opioids and cancer prognosis: a summary of the clinical evidence. Neurosci Lett. 2021;746:135661. doi:10.1016/j.neulet.2021.135661
17. Xie N, Matigian N, Vithanage T, et al. Effect of Perioperative Opioids on Cancer-Relevant Circulating Parameters: mu Opioid Receptor and Toll-Like Receptor 4 Activation Potential, and Proteolytic Profile. Clin Cancer Res. 2018;24(10):2319–2327. doi:10.1158/1078-0432.CCR-18-0172
18. Hänzelmann S, Castelo R, Guinney J. GSVA: gene set variation analysis for microarray and RNA-seq data. BMC Bioinform. 2013;14(1):7. doi:10.1186/1471-2105-14-7
19. Yoshihara K, Shahmoradgoli M, Martínez E, et al. Inferring tumour purity and stromal and immune cell admixture from expression data. Nat Commun. 2013;4(1):2612. doi:10.1038/ncomms3612
20. Newman AM, Liu CL, Green MR, et al. Robust enumeration of cell subsets from tissue expression profiles. Nat Methods. 2015;12(5):453–457. doi:10.1038/nmeth.3337
21. Bonneville R, Krook MA, Kautto EA, et al. Landscape of Microsatellite Instability Across 39 Cancer Types. JCO Precis Oncol. 2017;2017. doi:10.1200/PO.17.00073
22. Lamb J, Crawford ED, Peck D, et al. The Connectivity Map: using gene-expression signatures to connect small molecules, genes, and disease. Science. 2006;313(5795):1929–1935. doi:10.1126/science.1132939
23. Subramanian A, Narayan R, Corsello SM, et al. A Next Generation Connectivity Map: L1000 Platform and the First 1,000,000 Profiles. Cell. 2017;171(6):1437–52.e17. doi:10.1016/j.cell.2017.10.049
24. Guo T, Jiang L, Wang T, et al. Screening and identification of prognostic genes associated with eosinophilic features of clear cell renal cell carcinoma. Heliyon. 2023;9:e16479.
25. Kao TJ, Wu CC, Phan NN, et al. Prognoses and genomic analyses of proteasome 26S subunit, ATPase (PSMC) family genes in clinical breast cancer. Aging. 2021;13:17970. doi:10.18632/aging.203345
26. Anh ND, Thuong PH, Sim NT, et al. Maternal vascular endothelial growth factor receptor and interleukin levels in pregnant women with twin-twin transfusion syndrome. Int J Med Sci. 2021;18(14):3206–3213. doi:10.7150/ijms.61014
27. Belltall A, Zúñiga-Trejos S, Garrido-Cano I, et al. Solid Tumor Opioid Receptor Expression and Oncologic Outcomes: analysis of the Cancer Genome Atlas and Genotype Tissue Expression Project. Front Oncol. 2022;12:801411. doi:10.3389/fonc.2022.801411
28. Yang M, Miao Y-R, Xie G-Y, et al. ICBatlas: a Comprehensive Resource for Depicting Immune Checkpoint Blockade Therapy Characteristics from Transcriptome Profiles. Cancer Immunol Res. 2022;10(11):1398–1406. doi:10.1158/2326-6066.CIR-22-0249
29. Ye L, Li C, Jiang W, et al. Subacute toxicity evaluations of LPM3480392 in rats, a full µ-opioid receptor biased agonist. Front Pharmacol. 2023;14:1218380. doi:10.3389/fphar.2023.1218380
30. Wall T, Sherwin A, Ma D, et al. Influence of perioperative anaesthetic and analgesic interventions on oncological outcomes: a narrative review. Br J Anaesth. 2019;123(2):135–150. doi:10.1016/j.bja.2019.04.062
31. Qu N, Wang X, Meng Y, et al. Prospective oncotarget for gynecological cancer: opioid growth factor (OGF) - opioid growth factor receptor (OGFr) axis. Int Immunopharmacol. 2019;75:105723. doi:10.1016/j.intimp.2019.105723
32. Afsharimani B, Doornebal CW, Cabot PJ, et al. Comparison and analysis of the animal models used to study the effect of morphine on tumour growth and metastasis. Br J Pharmacol. 2015;172(2):251–259. doi:10.1111/bph.12589
33. Zurakowski D, Staffa SJ. Statistical power and sample size calculations for time-to-event analysis. J Thorac Cardiovasc Surg. 2022. doi:10.1016/j.jtcvs.2022.09.023
34. Lec PM, Lenis AT, Golla V, et al. The Role of Opioids and Their Receptors in Urological Malignancy: a Review. J Urol. 2020;204(6):1150–1159. doi:10.1097/JU.0000000000001156
35. Haque MR, Barlass U, Armstrong A, et al. Novel role of the Mu-opioid receptor in pancreatic cancer: potential link between opioid use and cancer progression. Mol Cell Biochem. 2022;477(5):1339–1345. doi:10.1007/s11010-022-04377-5
36. Wang X, Zhang S, Jin D, et al. μ-opioid receptor agonist facilitates circulating tumor cell formation in bladder cancer via the MOR/AKT/Slug pathway: a comprehensive study including randomized controlled trial. Cancer Commun. 2023.
37. Brejchova J, Holan V, Svoboda P, Geyer J. Expression of Opioid Receptors in Cells of the Immune System. Int J Mol Sci. 2020;22(1):22. doi:10.3390/ijms22010022
38. Choi H, Hwang W. Perioperative Inflammatory Response and Cancer Recurrence in Lung Cancer Surgery: a Narrative Review. Front Surg. 2022;9:888630. doi:10.3389/fsurg.2022.888630
39. Cuitavi J, Lorente JD, Campos-Jurado Y, et al. Neuroimmune and Mu-Opioid Receptor Alterations in the Mesocorticolimbic System in a Sex-Dependent Inflammatory Pain-Induced Alcohol Relapse-Like Rat Model. Front Immunol. 2021;12:689453. doi:10.3389/fimmu.2021.689453
40. Wen S, Jiang Y, Liang S, et al. Opioids Regulate the Immune System: focusing on Macrophages and Their Organelles. Front Pharmacol. 2021;12:814241. doi:10.3389/fphar.2021.814241
41. Chalabi M, Fanchi LF, Dijkstra KK, et al. Neoadjuvant immunotherapy leads to pathological responses in MMR-proficient and MMR-deficient early-stage colon cancers. Nat Med. 2020;26(4):566–576. doi:10.1038/s41591-020-0805-8
42. Zheng T, Qiu J, Li C, et al. Long noncoding RNA LINC00673 promotes the proliferation and metastasis of epithelial ovarian cancer by associating with opioid growth factor receptor. Onco Targets Ther. 2019;12:6145–6156. doi:10.2147/OTT.S209784
43. Huang H, Liu B, Qu N, et al. Research progress of opioid growth factor in immune-related diseases and cancer diseases. Int Immunopharmacol. 2021;99:107713. doi:10.1016/j.intimp.2021.107713
44. Wang R, Zhang Y, Shan F. Interaction of opioid growth factor (OGF) and opioid antagonist and their significance in cancer therapy. Int Immunopharmacol. 2019;75:105785. doi:10.1016/j.intimp.2019.105785
45. Anuraga G, Wang WJ, Phan NN, et al. Potential Prognostic Biomarkers of NIMA (Never in Mitosis, Gene A)-Related Kinase (NEK) Family Members in Breast Cancer. J Pers Med. 2021;12(1):11. doi:10.3390/jpm12010011
46. Xing C, Wang Z, Zhu Y, et al. Integrate analysis of the promote function of Cell division cycle-associated protein family to pancreatic adenocarcinoma. Int J Med Sci. 2021;18(3):672–684. doi:10.7150/ijms.53243
47. Modhukur V, Iljasenko T, Metsalu T, et al. MethSurv: a web tool to perform multivariable survival analysis using DNA methylation data. Epigenomics. 2018;10(3):277–288. doi:10.2217/epi-2017-0118
48. Shetab Boushehri MA, Lamprecht A. TLR4-Based Immunotherapeutics in Cancer: a Review of the Achievements and Shortcomings. Mol Pharm. 2018;15(11):4777–4800. doi:10.1021/acs.molpharmaceut.8b00691
49. Papadakos SP, Arvanitakis K, Stergiou IE, et al. The Role of TLR4 in the Immunotherapy of Hepatocellular Carcinoma: can We Teach an Old Dog New Tricks? Cancers. 2023;15.
50. Eriksen E, Afanou AK, Straumfors A, et al. Bioaerosol-induced in vitro activation of toll-like receptors and inflammatory biomarker expression in waste workers. Int Arch Occup Environ Health. 2023;96(7):985–998. doi:10.1007/s00420-023-01984-7
51. Bošnjak B, Kth D, Förster R, et al. Imaging dendritic cell functions*. Immunol Rev. 2022;306:137–163. doi:10.1111/imr.13050
52. Sanchez-Ruiz M, Iorgu AM, Küster F, et al. CD8 T cell-Derived Perforin and TNF-α Are Crucial Mediators of Neuronal Destruction in Experimental Autoimmune Enteric Ganglionitis. Am J Pathol. 2021;191:1064–1076. doi:10.1016/j.ajpath.2021.02.021
53. Niogret J, Berger H, Rebe C, et al. Follicular helper-T cells restore CD8+-dependent antitumor immunity and anti-PD-L1/PD-1 efficacy. J ImmunoTherapy Cancer. 2021;9:e002157. doi:10.1136/jitc-2020-002157
54. Velasco WV, Khosravi N, Castro-Pando S, et al. Toll-like receptors 2, 4, and 9 modulate promoting effect of COPD-like airway inflammation on K-ras-driven lung cancer through activation of the MyD88/NF-ĸB pathway in the airway epithelium. Front Immunol. 2023;14:1118721. doi:10.3389/fimmu.2023.1118721
55. Vacchelli E, Galluzzi L, Eggermont A, et al. Trial watch: FDA-approved Toll-like receptor agonists for cancer therapy. Oncoimmunology. 2012;1:894–907. doi:10.4161/onci.20931
56. Wang CY, Chiao CC, Phan NN, et al. Gene signatures and potential therapeutic targets of amino acid metabolism in estrogen receptor-positive breast cancer. Am J Cancer Res. 2020;10:95–113.
 © 2023 The Author(s). This work is published and licensed by Dove Medical Press Limited. The full terms of this license are available at https://www.dovepress.com/terms.php and incorporate the Creative Commons Attribution - Non Commercial (unported, v3.0) License.
By accessing the work you hereby accept the Terms. Non-commercial uses of the work are permitted without any further permission from Dove Medical Press Limited, provided the work is properly attributed. For permission for commercial use of this work, please see paragraphs 4.2 and 5 of our Terms.
© 2023 The Author(s). This work is published and licensed by Dove Medical Press Limited. The full terms of this license are available at https://www.dovepress.com/terms.php and incorporate the Creative Commons Attribution - Non Commercial (unported, v3.0) License.
By accessing the work you hereby accept the Terms. Non-commercial uses of the work are permitted without any further permission from Dove Medical Press Limited, provided the work is properly attributed. For permission for commercial use of this work, please see paragraphs 4.2 and 5 of our Terms.