Back to Journals » Diabetes, Metabolic Syndrome and Obesity » Volume 15
Palmitate Induces Mitochondrial Energy Metabolism Disorder and Cellular Damage via the PPAR Signaling Pathway in Diabetic Cardiomyopathy
Received 6 March 2022
Accepted for publication 28 June 2022
Published 1 August 2022 Volume 2022:15 Pages 2287—2299
DOI https://doi.org/10.2147/DMSO.S360931
Checked for plagiarism Yes
Review by Single anonymous peer review
Peer reviewer comments 3
Editor who approved publication: Professor Ming-Hui Zou
Xianyu Zhang, Min Mao, Zhong Zuo
Department of Cardiology, The First Affiliated Hospital of Chongqing Medical University, Chongqing, 400016, People’s Republic of China
Correspondence: Zhong Zuo, Department of Cardiology, The First Affiliated Hospital of Chongqing Medical University, No. 1, Medical College Road, Yuzhong District, Chongqing, 400016, People’s Republic of China, Email [email protected]
Purpose: To establish an in vitro lipotoxicity model with mouse cardiomyocytes (MCMs) and investigate the molecular mechanism of the peroxisome proliferator-activated receptors (PPAR) signaling on mitochondrial energy metabolism disorder and cellular injury in diabetic cardiomyopathy (DCM).
Methods: Gene ontology (GO) and Kyoto Encyclopedia of Genes and Genomes (KEGG) analyses were performed on the differentially expressed genes (DEGs) of DCM. CCK-8 method was used to detect the proliferation inhibition effect of palmitate (PA) on MCMs. Oil red O staining and mRNA levels of CD36 were used to verify intracellular lipid accumulation. DCFH-DA method was used to determine the content of intracellular reactive oxygen species (ROS), and ATP levels were detected by the ATP Detection Kit. Transmission electron microscope (TEM) was used to observe the mitochondrial structure. Western blot was used to detect the expression levels of PPARα, PPARγ, P-mTOR, mTOR, PGC-1α, UCP2, and BNP. In addition, the expression of PPARγ was also detected by cellular immunofluorescence staining. BNP levels were detected by qRT-PCR and the ELISA Kit.
Results: KEGG pathway analysis combined with GO analysis has shown that PPAR signaling played a significant regulatory role in mitochondrial biogenesis and fatty acid metabolism in DCM. Then, MCMs stimulated with PA for 24 h were selected as an in vitro lipotoxicity model. PA decreased cell viability, cell membrane shrinkage, and lipid accumulation. Meanwhile, PA-induced increase in cellular ROS led to ATP generation reduction and mitochondrial damage. Furthermore, the expression levels of p-mTOR- PPARα/γ were decreased, and the expressions of PGC-1α and UCP2 were increased. The levels of BNP were elevated, demonstrating PA impaired cardiomyocytes.
Conclusion: Mitochondrial energy metabolism obstacle and cell injury appeared in cardiac lipotoxicity of DCM, associated with lipid accumulation and increased ROS, indicating a crosstalk with the PPAR pathway mediated mechanism.
Keywords: diabetic cardiomyopathy, lipotoxicity, mitochondrial energy metabolism, cell damage, PPAR
Introduction
The global prevalence of diabetes is expected to be 12.2% in 2045, as reported by International Diabetes Federation (IDF).1 Diabetes can aggravate the clinical symptoms and mortality of patients with heart failure. Cardiovascular complications are the leading causes of death in individuals with diabetes, among which diabetic cardiomyopathy (DCM) is one of the serious cardiovascular complications.2 DCM refers to myocardial structure and function abnormalities in diabetic patients without coronary heart disease, hypertension, and other cardiovascular diseases. Its pathophysiological mechanisms include calcium homeostasis disorder, cardiac lipotoxicity, mitochondrial dysfunction, oxidative stress, and microvascular dysfunction.3,4 Hyperglycemia, hyperlipidemia, and insulin resistance are independent risk factors for the DCM progression, inducing pathological hypertrophy, fibrosis, and metabolic disturbances in the heart.5 If DCM is controlled improperly, it will eventually develop into heart failure. However, our knowledge of the key molecular mechanisms involved in DCM remains limited.
Insulin resistance and hyperglycemia are frequently observed in diabetic patients, contributing to DCM development through several related mechanisms, including the release of predominant saturated free fatty acids (FFAs) from the adipose tissue and the breakdown of triglycerides. Circulating FFAs are taken up by many nonadipose tissues, including the heart, causing a reduction in the heart’s ability to use glucose. As a result, the heart primarily has to rely on fatty acid oxidation (FAO) for energy, accompanied by higher rates of oxygen consumption and lower efficiency of energy metabolism,6,7 leading to overproduction of reactive oxygen species (ROS), mitochondrial damage, and FFAs accumulation in the form of triglycerides in the heart tissue to promote myocardial steatosis.8 Inappropriate accumulation of excess lipids will cause cardiomyocyte dysfunction and cell death in DCM, particularly in diabetic individuals.9
Studies show that excessive saturated fatty acids uptake by cardiomyocytes causes myocardial mitochondria overload in diabetic patients, resulting in adverse myocardial function changes.10 Saturated long-chain fatty acids, especially palmitate (PA), are associated with DCM lipotoxicity either because of their direct actions or the presence of detrimental lipid intermediates. Multiple molecular mediators have been proposed to explain lipotoxic effects on mitochondrial dysfunction, such as ROS,11 PPARs,12,13 and PGC-1α.14 Peroxisome proliferator-activated receptors (PPARs) belong to the ligand-activated nuclear transcription factor superfamily and are considered to be significant in controlling cardiac physiological processes. PPARs regulate energy metabolism, inflammatory responses, and lipid homeostasis by binding to ligands and cofactors.15 PPARs have different levels of expression in cardiac tissues. PPARα is highly expressed in metabolically active tissues (such as the liver, skeletal muscle, and heart) and drives a normal metabolic phenotype to maintain high-energy phosphate content by activating cardiac mitochondrial glycolipid oxidation. Whereas PPARγ is underexpressed in the heart and indirectly affects DCM development by increasing insulin sensitivity and glucose metabolism. Abnormal expression of PPARα/γ can cause an imbalance in the disturbance of glycolipid uptake and mitochondrial oxidative capacity.13 Moreover, as a coactivator of PPARs, PPARγ coactivator-1 alpha (PGC-1α) can enhance the ability of PPARs to bind to specific ligands, resulting in the activation of downstream target genes. It is a master regulator of mitochondrial biogenesis and mitochondrial antioxidant defense.16,17 Meanwhile, mitochondrial uncoupling protein-2 (UCP2) regulated by PPARs/PGC-1α also participates in anti-oxidation and energy metabolic balance.18,19 They are important in maintaining normal cardiac function, particularly in FAO and mitochondrial bioenergetics.
Dysfunctional mitochondria and impaired cells are associated with the development of DCM. However, the mechanism still needs to be further elucidated. In this study, cardiomyocytes were exposed to mediums containing palmitic acid to (1) observe whether mitochondrial energy metabolism disorder and cellular damage appear and (2) determine the underlying molecular mechanisms that the PPAR signaling pathway may be involved in DCM.
Materials and Methods
Microarray Data, Identification of DEGs, GO Analysis, and Pathway Enrichment Analysis
Download the GSE4745 gene expression profile data set from the GEO database (https://www.ncbi.nlm.nih.gov/geo/query/acc.cgi?acc=GSE4745). The chip analysis was based on the GPL85 platform, which is publicly available and allows unlimited re-use. The GSE4745 data set contained global mRNA expression in heart tissues of control and type I diabetic rats induced by streptozocin (STZ) at 3, 28, and 42 days.20 In this study, according to the finding criterion P < 0.05 and |log2FC| > 1.0, differentially expressed genes (DEGs) after diabetes induction at 42 days were selected. The study used Metascape bioinformatics resources (http://metascape.org/gp/index.html#/main/step1) to perform gene ontology (GO) analysis and Kyoto encyclopedia of genes and genome (KEGG) pathway analysis of DEGs. The bioinformatics web tool (http://www.bioinformatics.com.cn) was used to visualize the findings of the GO and KEGG analyses.
Cell Culture
Mouse cardiac myocytes (MCMs) were generously provided by Prof. Xiaoqiu Xiao (The First Affiliated Hospital of Chongqing Medical University). MCMs were cultivated in DMEM (Thermo Fisher Scientific Co., USA) supplemented with 10% FBS (PAN-Biotech Co., Germany) and 1% antibiotic-antimycotic (Beyotime Biotechnology Co., China), and incubated at 37°C with 5% CO2 and 100% humidity. The medium was changed every 2 to 3 days, and cells were passaged when they reached 80–85%.
Cell Viability Assay
MCMs (5 × 10⁴ per mL) were seeded into 96-well plates, allowed to attach, and then treated separately with various concentrations of PA (0, 150, 350, 450, and 550 µM) for 24 h in a 5% CO2 incubator at 37°C. The viability of MCMs was determined by CCK-8 (MedChemExpress Co., China). CCK-8 solution (10 µL per well) was added to each well. The cells were further incubated at 37°C for 2 h, the cell viability of each treatment was quantified by determining absorbance in each well at 450 nm using a microplate reader (Thermo Fisher Scientific Co., USA). Cell viability = (Treated Group OD−Blank Group OD)/(Control Group OD−Blank Group OD).
Cellular Oil Red O Staining
MCMs (1 × 10⁶ cells per well) were seeded in a 6-well plate and allowed to attach overnight. Subsequently, the cells were treated with various concentrations (0, 150, and 350 µM) of PA for 24 h, fixed with 4% paraformaldehyde for 15 min, and then stained with Oil red O staining (Solarbio Biotechnology Co., China). After staining, the cells were rinsed with PBS at least three times. Photographs were taken and recorded under a light microscope (Olympus Co., Japan).
Intracellular ROS Production Assay
To measure ROS levels, MCMs were incubated with DCFH-DA (Beyotime Biotechnology Co., China), a cell-permeant indicator of ROS. In short, after treatment of 0, 150, and 350 µM PA for 24 h, the treated cells were incubated with DCFH-DA (10 μmol/l) in the dark at 37°C for 30 min. After probe treatment, the cells were washed at least twice with ice-cold PBS. A fluorescence microscope was used at set excitation and emission wavelengths in this experiment. The images were captured under the same conditions, and the mean fluorescence intensity was quantified to compare the results from each group using Image J software (National Institutes of Health, USA).
Cellular ATP Level Assay
ATP levels were detected by the ATP Detection Kit (Beyotime Biotechnology Co., China). A standard curve was plotted to determine the ATP content of the cells according to the manufacturer’s instructions. Briefly, MCMs were treated with various concentrations of PA for 2, 4, 8, 16, and 24 h, then the cells that were lysed were collected in PBS by repeated freezing and thawing. Cell lysates were centrifuged at 12,000 × g and 4°C for 5 min to obtain the supernatant. A total of 100 µL of ATP detection solution and 20 µL of supernatant to the 96-well plate were added successively. The chemiluminescence values were determined by a multifunctional fluorescence enzyme marker (Thermo Fisher Scientific Co., USA).
Observation of Morphological Changes of Mitochondria
Following MCMs treatment with 0, 150, and 350 µM PA for 24 h, cells were collected and washed twice with PBS and fixed overnight in fresh 2.5% glutaraldehyde at 4°C. The samples were fixed with 2% osmium tetroxide in NaCac, stained with 2% uranyl acetate, dehydrated with graded ethanol series, and embedded with Epon-Araldite resin. The slices were obtained using Leica EM UC6 Microsystems and stained with uranyl acetate and lead citrate. TEM was used to examine the ultrastructure of the cells.
Cellular Immunofluorescence Staining
Cells (5 × 10⁴ cells per well) were seeded into 24-well plates with slides allowed to attach and treated separately with 0, 150, and 350 µM PA for 24 h in a 5% CO2 incubator at 37°C. Cells cultured on the slides were fixed with 4% paraformaldehyde, washed at least twice, permeated with 0.5% Triton X-100 (Sigma Co., USA), sealed with goat serum, incubated with anti-PPARγ (1:100; Santa Cruz Biotechnology Co., USA) overnight at 4°C, and incubated with appropriate secondary antibody (Proteintech Group Co., China). The nuclei were stained with DAPI (Beyotime Biotechnology Co., China) and the mean fluorescence intensity was quantified for comparing the results from each group using Image J software.
Western Blotting
RIPA buffer containing PMSF and phosphatase inhibitors was used to extract the protein of MCMs (Beyotime Biotechnology Co., China). Protein concentrations were determined using the BCA protein assay kit (Beyotime Biotechnology Co., China) according to the manufacturer’s instructions. The samples were stored at −20°C for further use. The protein samples of each group were separated by 8% or 12% SDS-PAGE and transferred to PVDF membranes (MerckMillipore Co., USA). The PVDF membranes were sealed with rapid blocking solution at room temperature. Western blotting analysis was performed using anti-P-mTOR (1:1000; Cell Signaling Technology Co., USA), anti-mTOR (1:1000; Proteintech Group Co., China), anti-PPARγ (1:1000; Santa Cruz Biotechnology Co., USA), anti-PPARα (1:1000; GeneTex Co., USA), anti-PGC-1α (1:1000; Abcam Co., UK), anti-UCP2 (1:1000; Abmart Biotechnology Co., China), anti-BNP (1:1000; Abclonal Biotechnology Co., China), and anti-GAPDH (1:5000; Proteintech Group Co., China) antibodies. Anti-mouse or anti-rabbit horseradish peroxidase-labeled antibodies (1:5000; Proteintech Group Co., China) were used for detection. Membranes were revealed with ECL chemiluminescent substrate (Advansta Co., USA). Finally, the fusion imaging system was used to detect the relative densities of the bands.
Quantitative Real-Time PCR
Total RNA was extracted from MCMs by using Trizol reagent (Takara Biotechnology Co., China). RNA (1 μg) was reverse-transcribed to cDNA using the cDNA Synthesis Kit (Accurate Biotechnology Co, China) according to the manufacturer’s instructions. The BNP RNA levels were quantified by real-time PCR. GAPDH was used as the internal control. Values are expressed in fold change of the control group, and calculated from the average threshold cycle of three independent experiments. Table 1 shows the primer sequences.
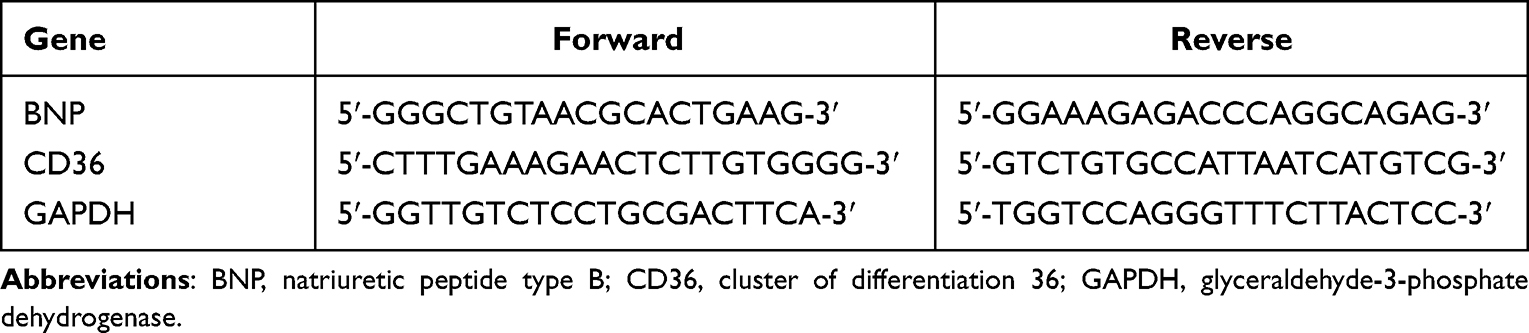 |
Table 1 Sequences of Primers for qRT-PCR |
Enzyme-Linked Immunosorbent Assay
The enzyme-linked immunosorbent assay (ELISA) was used to determine the intracellular and secreted levels of BNP. For intracellular levels of BNP, 5×10⁶ cells were washed in RPMI × 2, snap frozen in liquid nitrogen, and then thawed at 37°C. The snap freezing and thawing were repeated twice. Cellular debris was then spun down and the supernatant was saved for analysis. Secreted levels were estimated using cell culture supernatants. The remaining steps were completed according to the ELISA kit instructions (BoPei Biotechnology Co., China). A microtiter plate reader (Thermo Fisher Scientific Co., USA) was used to read the microplate at 450 nm.
Statistical Analysis
All data were expressed as Mean ± SEM. Statistical comparisons were performed (GraphPad prism 8.0 software) using one-way or two-way analysis of variance. Data were considered significantly different with P < 0.05.
Results
GO and KEGG Pathway Analysis of DEGs in Diabetic Heart
R language of the GEO database was used to perform differential expression reanalysis on the original microarray data online. A total of 161 up-regulated DEGs and 163 down-regulated DEGs were identified from GSE4745 (Figure 1A and B). Conducting GO analysis and KEGG pathway analysis of DEGs, it was found that these DEGs were mainly involved in the fatty acid metabolic processes in the biological process (BP) and cellular component (CC) was concentrated primarily on mitochondria. At the molecular function (MF), DEGs were mainly involved in oxidoreductase activity (Figure 1C). The PPAR pathway was also among the top enrichment pathways in the diabetic heart (Figure 1D).
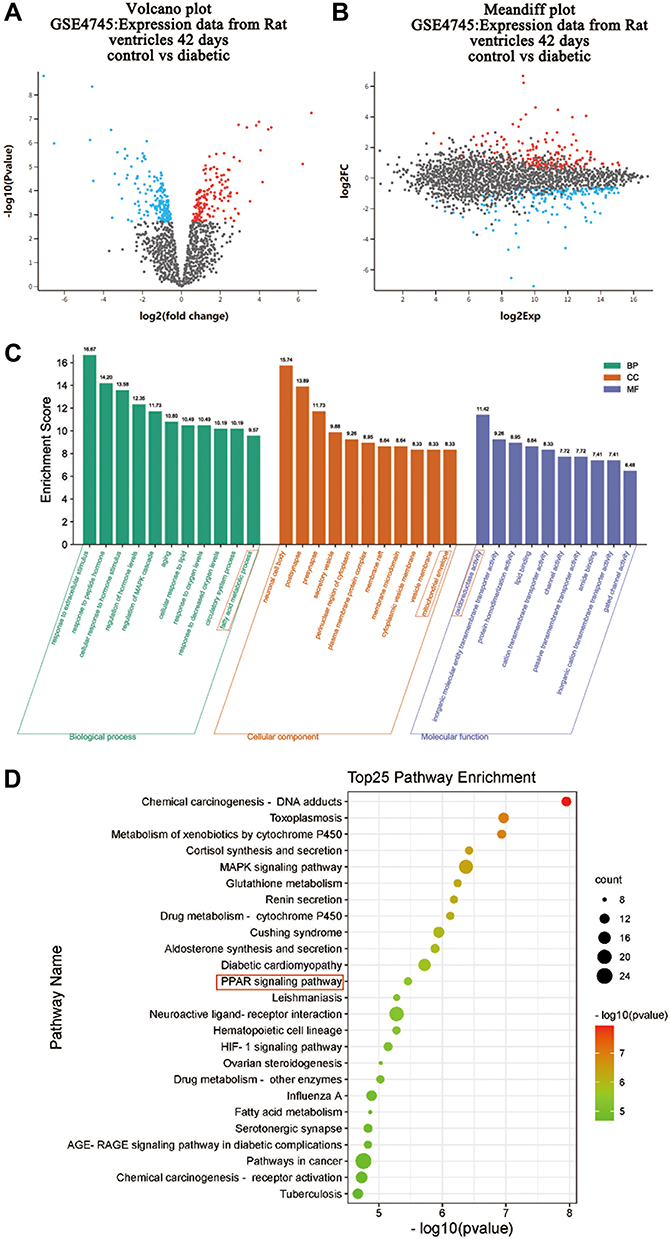 |
Figure 1 GO and KEGG pathway analysis of DEGs in hearts from normal and diabetic rats. Genes altered at 42 days after diabetes induction were obtained by statistical reanalysis of the GSE4745 data. (A) Volcano plot of expression data from diabetic hearts and normal ones 42 days after diabetes induction in GSE4745. (B) Meandiff plot of expression data from diabetic hearts and normal ones 42 days after diabetes induction in GSE4745. (C) GO analysis of DEGs between diabetic hearts and normal ones. The x-axis of GO analysis is the three basic terms (biological process, cellular component, and molecular function), the y-axis is the ratio of the number of differential genes enriched in the term to the total number of genes in the Go term. (D) KEGG pathway analysis of DEGs between diabetic hearts and normal ones. In bubble diagrams, the y-axis shows the name of the KEGG pathway, and the enrichment on the x-axis denotes the p-value. The dot’s colordot represents the p-value, and the size of the dot represents the exact number of DEGs mapped to this pathway. Abbreviation: DEGs, differentially expressed genes. |
PA Caused Low Viability and Severe Lipid Accumulation in Cardiomyocytes
We then established an in vitro lipotoxicity model by culturing MCMs in palmitate mediums to deepen the study of DCM. Therefore, the CCK-8 assay showed MCMs viability decreased with increasing concentrations of PA from 150 µM to 550 µM (P < 0.0001). The maximum inhibition rate (82.9%) was observed in the highest concentration of PA (Figure 2A). Based on our results and literature search,21–23 150 µm and 350 µm PA were selected as the optimum doses for further studies to evaluate the adverse effect of PA on cardiomyocyte proliferation. The morphological changes of MCMs were observed with light microscope. Compared to the control group, PA altered the morphology of the cells from a long spindle to a round shape, significantly reduced the density of live cells (long spindle), and increased the number of dead cells (round) following the ascending concentrations. After being treated with 350 µM PA, the cells shrunk and the cell membrane ruptured, which were characteristic features of cellular injury (Figure 2B). Furthermore, the study revealed that, compared to the control or 150 µM PA group, 350 µM PA treatment resulted in severe lipid accumulation in cardiomyocytes (P < 0.0001) (Figure 2C and D) and increased mRNA levels of lipid transporter CD36 (P < 0.01 and P < 0.05) (Figure 2E).
 |
Figure 2 PA caused low viability and severe lipid accumulation in cardiomyocytes. (A) MCMs treated with various concentrations (0, 150, 350, 450, 550 μM) of PA for 24 h. Cell viability was detected by CCK-8. (B) Cell morphological changes were assessed after PA (0, 150, 350 μM) stimulated MCMs for 24 h (Scale bars = 500 μm). (C) Oil red O staining was assessed with the Olympus light microscope after PA (0, 150, 350 μM) stimulated MCMs for 24 h (Scale bar = 50 μm). (D) Quantified relative area of positive oil red O staining (%Area) in cardiomyocytes (measured by Image J). (E) The mRNA levels of CD36 after being treated PA (0, 150, 350 μM) in cardiomyocytes. **P < 0.01, ****P < 0.0001 vs control or 0 μM PA, #P < 0.05, ####P < 0.0001 vs 150 μM PA. |
PA Increased ROS Levels, Decreased ATP Production and Damaged Mitochondria in Cardiomyocytes
To further investigate whether mitochondrial dysfunction is directly associated with DCM progression, the contents of ROS and ATP were detected in MCMs. According to our findings, 350 µM PA treatment increased ROS levels (P < 0.01 and P < 0.05) (Figure 3A and B) and decreased ATP production (P < 0.01 and P < 0.0001) (Figure 3C). Furthermore, TEM revealed that compared with the control group, the mitochondrial cristae of MCMs in the 150 µM PA group were slightly swollen and disorganized. In the 350 µM PA group, the mitochondrial cristae of MCMs were significantly swollen and vacuolated (Figure 3D).
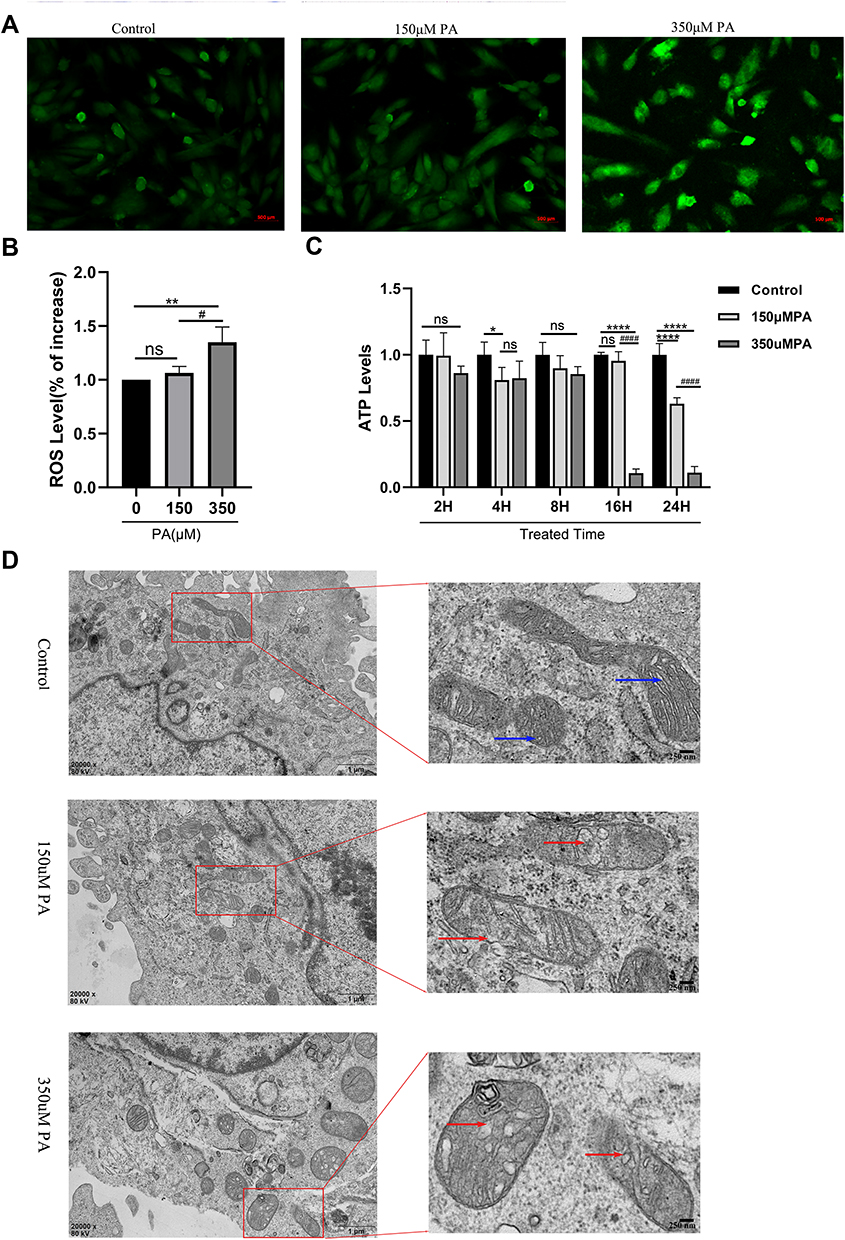 |
Figure 3 PA increased ROS levels, decreased ATP production and damaged mitochondria in cardiomyocytes. (A) Cellular ROS levels were assessed by DCF in cells after treatment with PA (0, 150, 350 μM) for 24 h (Scale bar = 500 μm). (B) Quantified cell ROS levels in cardiomyocytes (measured by Image J). (C) After MCMs were treated with PA (0, 150, 350 μM) for different times, cellular ATP levels were measured. (D) PA induced the morphological changes of mitochondrial in cardiomyocytes detected by TEM. MCMs were treated with PA (0, 150, 350 μM) for 24 h (Scale bars = 250 nm). Blue arrows indicate normal mitochondria, red arrows indicate abnormal mitochondria. *P < 0.05, **P < 0.01, ****P < 0.0001 vs control or 0 μM PA, #P < 0.05, ####P < 0.0001 vs 150 μM PA. |
PPARα and PPARγ Were Down-Regulated in PA-Stimulated Cardiomyocytes
The expression of PPARγ in cardiomyocytes among three groups was determined to confirm the hypothesis that mitochondrial energy metabolism disorder and cellular damage of diabetic cardiomyopathy may connect with the alternation of PPAR levels using Western blotting and immunofluorescence staining. The protein levels of PPARα were detected by Western blotting. The protein levels of PPARα and PPARγ were found to be down-regulated under the stimulation of 350 µM PA (P < 0.0001 and P < 0.001) and the expression levels of PPARα/γ were not statistically significant between the 150 µM PA group and the control group (>P > 0.05) (Figure 4A–D). Meanwhile, cellular immunofluorescence staining demonstrated that the red fluorescence intensity of PPARγ was weaker in the 350 μM PA group than that in the group and the 150 μM PA group (P < 0.05) (Figure 4E and F).
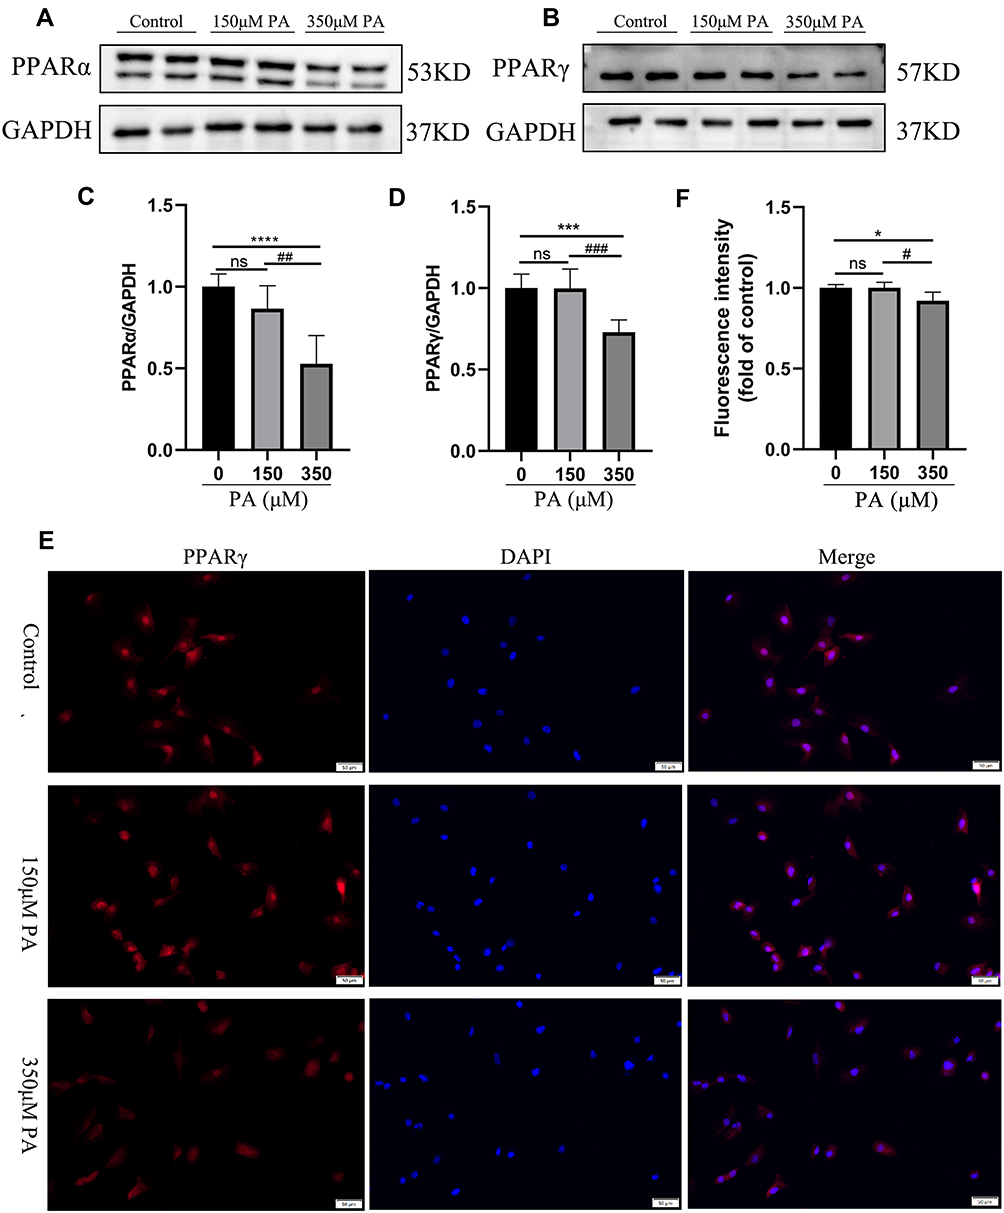 |
Figure 4 PPARα and PPARγ were down-regulated in the PA-stimulated cardiomyocytes. (A and B) The protein levels of PPARα and PPARγ in cardiomyocytes stimulated with various concentrations of PA (0, 150, 350 μM) for 24 h. The protein expression of GAPDH was used as standard. (C and D) Quantified protein levels of PPARα and PPARγ in cardiomyocytes (measured by Fusion). (E) Immunofluorescence of PPARγ (red) and DAPI (blue) in cardiomyocytes (Scale bars = 50 μm). (F) Quantified fluorescence intensity of PPARγ in cardiomyocytes (measured by Image J). *P < 0.05, ***P < 0.001, ****P < 0.0001 vs the control or 0 μM PA, #P < 0.05, ##P < 0.01, ###P < 0.001 vs the 150μM PA. |
p-mTOR Was Decreased and PGC-1α-UCP2-BNP Was Increased in PA-Inducted Impaired Cardiomyocytes
Given that PGC-1α and UCP2 are synergistically involved in regulating mitochondrial biogenesis, the expression of PGC-1α and UCP2 were further explored in an in vitro lipotoxic cellular model of DCM. Western blotting showed that the protein levels of PGC-1α and UCP2 were significantly increased in the 350 μM PA group (P < 0.01 and P < 0.0001) however their expression levels were not significantly different between the control group and the 150 μM PA group (P > 0.05) (Figure 5A–C). Moreover, the phosphorylation level of mTOR, a transcriptional driver of PPARs, was significantly decreased in the MCMs treated with 350 μM PA (P < 0.001) (Figure 5D and E). Importantly, BNP, serving as a stress marker of myocardial damage, was dramatically higher at both protein and mRNA levels in the PA stimulated cardiomyocytes than in the control group (P < 0.05) (Figure 5F–H). The cell lysate levels of BNP were elevated (P < 0.01) in the 350 μM PA group, but there was no difference in the amount of BNP in medium supernatant (P > 0.05) among the three group (Figure 5I).
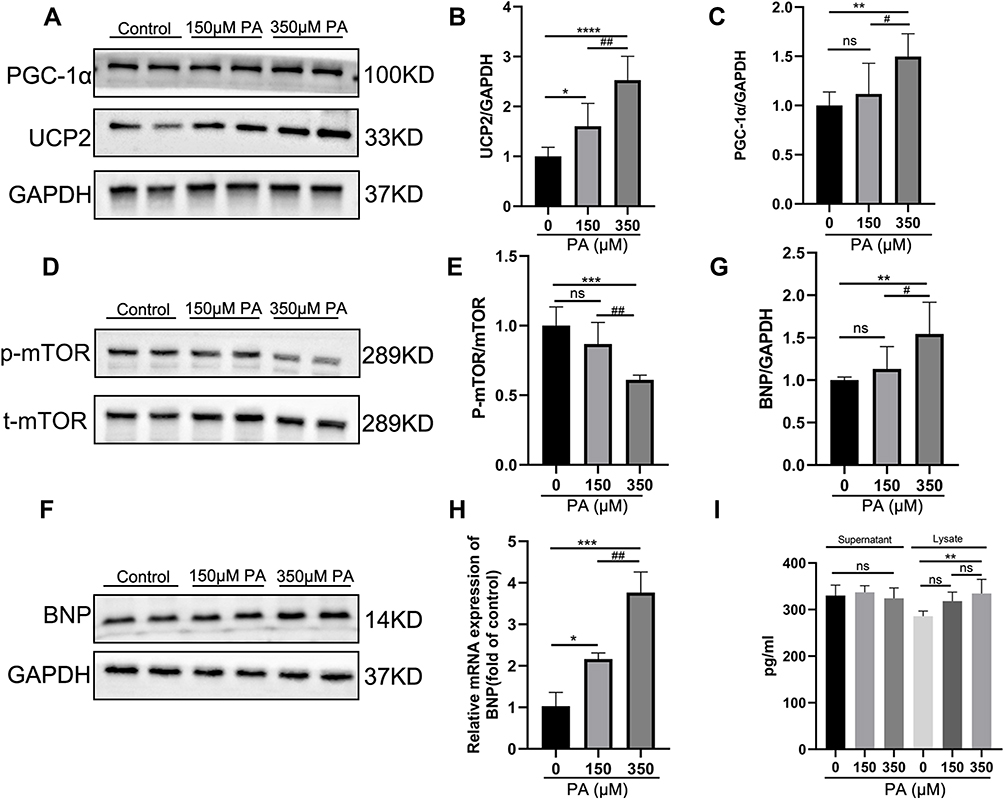 |
Figure 5 P-mTOR was decreased, and PGC-1α-UCP2-BNP was increased in PA-inducted impaired cardiomyocytes. (A) The protein expression levels of PGC-1α and UCP2 in the MCMs stimulated with PA for 24 h. GAPDH was used as standard. (B and C) Quantified protein levels of PGC-1α and UCP2 (measured by Fusion). (D and E) The protein expression levels of p-mTOR and mTOR were analyzed after PA (0, 150, 350 μM) stimulated MCMs for 24 h. (F and G) The protein expression levels of BNP were analyzed by Western blotting, and GAPDH was used as standard. (H) The mRNA levels of the cell damage marker gene BNP after being treated with PA in cardiomyocytes. (I) BNP content in cell supernatant and lysate was measured by ELISA Kit. *P < 0.05, **P < 0.01, ***P < 0.001, ****P < 0.0001 vs the control or 0 μM PA, #P < 0.05, ##P < 0.01 vs the 150 μM PA group. |
Discussion
Accumulating evidence has indicated that diabetes results in structural changes and dysfunction in the heart. The molecular etiologies of DCM, on the other hand, are complex and multifactorial. Indeed, there is a significant intersection between many of these; disorders of mitochondrial energy metabolism and imbalance of glycolipid metabolism homeostasis are significant in DCM development.24 Furthermore, studies have shown that PPARs are involved in mitochondrial lipid homeostasis in diabetic hearts as a link between free fatty acids (or their derivatives) and metabolic diseases.25 DCM has now become a major threat to the life and health of diabetic patients. Therefore, a better understanding of DCM’s mechanism will be beneficial for preventing and treating this disease.
This study first used GSE4745 data to screen out the DEGs associated with DCM to perform GO and KEGG pathway analysis. We discovered that the DEGs of diabetic hearts focused on fatty acid metabolism, mitochondrial structure, and oxidoreductase activity in terms of BP, CC, and MF, respectively. The KEGG analysis demonstrated that the PPAR signaling pathway was one of the most important enrichment pathways in DCM. The results of the bioinformatics analysis provided theoretical support and direction for further studies on the mechanism of DCM. Our next research goal was to determine the correlation between mitochondrial biogenesis and PPARs signaling in DCM.
The metabolic abnormalities of the diabetic heart involve a variety of mechanisms, one of which is the PPAR signaling pathway.26 PPARs, nuclear hormone receptors, control cellular, and whole-body energy homeostasis by influencing the expression of certain genes and play an important role in cardiovascular disease.27 PARα is expressed at relatively abundant levels in the heart. In mice, the expression of FAO-related genes is significantly reduced in the absence or reduced expression of PPARα, and then the mice may develop heart failure due to inadequate energy production caused by insufficient FAO.28 However, mice with cardiac restricted overexpression of PPARα also developed DCM-related cardiac pathological changes, such as increased myocardial fatty acid utilization and oxidation, decreased glucose uptake and oxidation, ventricular hypertrophy, and contractile dysfunction.29 Few studies suggest that PPARα expression level is related to the pathological stage of DCM, and PPARα activation is an early compensatory response to DCM, prompting the diabetic heart to flexibly convert fatty acids as available supply substrates, and enhance FAO to meet the body’s energy needs. In the late stage of DCM, the myocardial PPARα expression is reduced in the in vivo environment with a substantial quantity of FFA exposure, resulting in the development of maladaptive reactions such as cardiolipotoxicity and dysfunction.30
Furthermore, the role of PPATγ as a master regulator of adipogenesis and myocardial redox homeostasis is well known. In cardiac-specific PPARγ knockout mice, the heart exhibits extensive oxidative damage and abnormally increased mitochondria due to suppressed expression of genes encoding mitochondrial antioxidants.30 Transgenic mice overexpressing PPARγ developed pathological changes similar to DCM such as myocardial fatty acid accumulation, oxidative stress, and mitochondrial damage.31 The relationship between PPARγ and the pathological stage of DCM is yet to be determined. As a result, the regulatory mechanism of PPARs in the development of DCM needs further study. In this study, we constructed an in vitro lipotoxicity model, and our data revealed that cultured cells with high concentrations of PA resulted in decreased PPARα and PPARγ expression levels. PA being one of the most abundant circulating FFAs, inhibited MCM growth and caused morphological changes associated with cell damage. In addition, cardiomyocytes exposed to PA showed increased lipid accumulation, ROS overproduction, and decreased ATP synthesis. Meanwhile, TEM images indicated that PA treatment harmed mitochondrial structure. However, further research is needed to see whether other specific molecules involved in the PPARs pathway cause a metabolic disorder in the diabetic heart.
Finally, we investigated the PPAR pathway’s major drivers, mTOR pathway and the PPAR co-activator PGC-1α. Our findings showed that p-mTOR expression, like PPARα/γ protein expression levels, dropped after cell injury and mitochondrial energy disturbance, suggesting that mTOR and PPARα/γ may jointly participate in mitochondrial biogenesis. Previous studies have suggested that mTOR participates in mitochondrial metabolism function by activating the transcription factors PPARα/γ and PGC-1α.32,33 In cardiac mTOR disrupted mice, depletion of enzymes mediating fatty acid β-oxidation was accompanied by reduced expression of PPARα and PGC-1α, which regulate transcription of FAO genes in the heart.34,35 Multiple mitochondrial antioxidants, as well as enzymes involved in ATP production, were reduced in the myocardium of PGC-1α knockout mice, which leads to increased ROS and reduced ATP production in the mouse myocardium.36 However, the protein expression levels of PGC-1α were found to be higher. Studies have suggested that an early adaptive response to diabetes that triggers mitochondrial biogenesis while also increasing cellular ROS-detoxifying capacity.37,38
The heart is an organ that requires high oxidative metabolism to maintain continuous contraction. UCP’s relatively constant expression in the heart plays an important constitutive role and its overexpression is another potential explanation for mitochondrial inefficiency and dysfunction in DCM.18,39 Our data demonstrated that increased UCP2 protein expression levels were accompanied by decreased intracellular ATP content and excessive ROS production. In fact, increasing UCP2 can reduce ROS formation and improve cellular oxidative stress. This may be a temporary adaptive mechanism to prevent cells from being damaged by ROS. However, UCP2 activation can promote the uncoupling of the mitochondrial respiratory chain and dissipate energy in the form of heat, adversely affecting cardiac ATP production and contractile function in diabetic patients.40,41
Our findings revealed that mitochondrial energy metabolism obstacle and cell damage in DCM had crosstalk with the PPAR pathway mediated mechanism. We proposed the following molecular mechanism to clarify it: (1) Excessive lipid accumulation in the diabetic heart caused the down-regulation of mTOR and PPARα/γ involved in lipid metabolism and further aggravation of the lipid accumulation in cardiomyocytes; (2) Lipid overload-induced mitochondrial ROS overproduction causing a decrease in ATP content, mitochondrial damage and increase in cell damage marker BNP; (3) The upregulation of PGC1-α and UCP2 was considered to be an early adaptive change of DCM. It would eventually cause a decrease in cardiac ATP synthesis rates with higher oxygen consumption in FAO. The present study confirmed previous research and contributed additional evidence suggesting mitochondrial dysfunction and cell injury are major DCM processes.
Ethical Standard and Clarifying Statement
The Scientific Research Department of the First Affiliated Hospital of Chongqing Medical University has reviewed the related experimental procedures in this original research and found that this study did not contain humans and animals trials; the MCMs were generously provided by Prof. Xiaoqiu Xiao (The First Affiliated Hospital of Chongqing Medical University). Moreover, the GSE4745 database is publicly available, and unrestricted re-use is permitted via an open license. Therefore, the Scientific Research Department has waived the requirement for ethical approval for this study. Our study did not require ethical board approval.
Funding
This research was funded by Chongqing Natural Science Foundation (cstc2019jcyj-msxmX0433).
Disclosure
The authors declare that they have no conflicts of interest in this work.
References
1. Sun H, Saeedi P, Karuranga S, et al. IDF diabetes Atlas: global, regional and country-level diabetes prevalence estimates for 2021 and projections for 2045. Diabetes Res Clin Pract. 2021;183:109119. doi:10.1016/j.diabres.2021.109119
2. Bell DSH, Goncalves E. Heart failure in the patient with diabetes: epidemiology, aetiology, prognosis, therapy and the effect of glucose-lowering medications. Diabetes Obes Metab. 2019;21(6):1277–1290. doi:10.1111/dom.13652
3. Jia G, Whaley-Connell A, Sowers JR. Diabetic cardiomyopathy: a hyperglycaemia- and insulin-resistance-induced heart disease. Diabetologia. 2018;61(1):21–28. doi:10.1007/s00125-017-4390-4
4. Murtaza G, Virk HUH, Khalid M, et al. Diabetic cardiomyopathy - A comprehensive updated review. Prog Cardiovasc Dis. 2019;62(4):315–326. doi:10.1016/j.pcad.2019.03.003
5. Filardi T, Ghinassi B, Di Baldassarre A, et al. Cardiomyopathy associated with diabetes: the central role of the cardiomyocyte. Int J Mol Sci. 2019;20(13):3299. doi:10.3390/ijms20133299
6. Gandoy-Fieiras N, Gonzalez-Juanatey JR, Eiras S. Myocardium metabolism in physiological and pathophysiological states: implications of epicardial adipose tissue and potential therapeutic targets. Int J Mol Sci. 2020;21(7):2641. doi:10.3390/ijms21072641
7. Szablewski L. Glucose transporters in healthy heart and in cardiac disease. Int J Cardiol. 2017;230:70–75. doi:10.1016/j.ijcard.2016.12.083
8. Goldberg IJ, Trent CM, Schulze PC. Lipid metabolism and toxicity in the heart. Cell Metab. 2012;15(6):805–812. doi:10.1016/j.cmet.2012.04.006
9. Cerf ME. Cardiac glucolipotoxicity and cardiovascular outcomes. Medicina. 2018;54(5):70. doi:10.3390/medicina54050070
10. Brindley DN, Kok BP, Kienesberger PC, Lehner R, Dyck JR. Shedding light on the enigma of myocardial lipotoxicity: the involvement of known and putative regulators of fatty acid storage and mobilization. Am J Physiol Endocrinol Metab. 2010;298(5):E897–E908. doi:10.1152/ajpendo.00509.2009
11. Federico M, De la Fuente S, Palomeque J, Sheu SS. The role of mitochondria in metabolic disease: a special emphasis on heart dysfunction. J Physiol. 2021;599(14):3477–3493. doi:10.1113/JP279376
12. Wang L, Cai Y, Jian L, Cheung CW, Zhang L, Xia Z. Impact of peroxisome proliferator-activated receptor-α on diabetic cardiomyopathy. Cardiovasc Diabetol. 2021;20(1):2. doi:10.1186/s12933-020-01188-0
13. Montaigne D, Butruille L, Staels B. PPAR control of metabolism and cardiovascular functions. Nat Rev Cardiol. 2021;18(12):809–823. doi:10.1038/s41569-021-00569-6
14. Rius-Pérez S, Torres-Cuevas I, Millán I, Ál O, Pérez S. PGC-1α, inflammation, and oxidative stress: an integrative view in metabolism. Oxid Med Cell Longev. 2020;2020:1452696. doi:10.1155/2020/1452696
15. Mirza AZ, Althagafi II, Shamshad H. Role of PPAR receptor in different diseases and their ligands: physiological importance and clinical implications. Eur J Med Chem. 2019;166:502–513. doi:10.1016/j.ejmech.2019.01.067
16. Li SY, Susztak K. The role of peroxisome proliferator-activated receptor γ coactivator 1α (PGC-1α) in kidney disease. Semin Nephrol. 2018;38(2):121–126. doi:10.1016/j.semnephrol.2018.01.003
17. Bhatti JS, Bhatti GK, Reddy PH. Mitochondrial dysfunction and oxidative stress in metabolic disorders - A step towards mitochondria based therapeutic strategies. Biochim Biophys Acta Mol Basis Dis. 2017;1863(5):1066–1077. doi:10.1016/j.bbadis.2016.11.010
18. Cadenas S. Mitochondrial uncoupling, ROS generation and cardioprotection. Biochim Biophys Acta Bioenerg. 2018;1859(9):940–950. doi:10.1016/j.bbabio.2018.05.019
19. Kutsche HS, Schreckenberg R, Weber M, et al. Alterations in glucose metabolism during the transition to heart failure: the contribution of UCP-2. Cells. 2020;9(3):552. doi:10.3390/cells9030552
20. Gerber LK, Aronow BJ, Matlib MA. Activation of a novel long-chain free fatty acid generation and export system in mitochondria of diabetic rat hearts. Am J Physiol Cell Physiol. 2006;291(6):C1198–C1207. doi:10.1152/ajpcell.00246.2006
21. Wu KM, Hsu YM, Ying MC, et al. High-density lipoprotein ameliorates palmitic acid-induced lipotoxicity and oxidative dysfunction in H9c2 cardiomyoblast cells via ROS suppression. Nutr Metab. 2019;16:36. doi:10.1186/s12986-019-0356-5
22. Wen SY, Velmurugan BK, Day CH, et al. High density lipoprotein (HDL) reverses palmitic acid induced energy metabolism imbalance by switching CD36 and GLUT4 signaling pathways in cardiomyocyte. J Cell Physiol. 2017;232(11):3020–3029. doi:10.1002/jcp.26007
23. Gui T, Li Y, Zhang S, et al. Docosahexaenoic acid protects against palmitate-induced mitochondrial dysfunction in diabetic cardiomyopathy. Biomed Pharmacother. 2020;128:110306. doi:10.1016/j.biopha.2020.110306
24. Ritchie RH, Abel ED. Basic mechanisms of diabetic heart disease. Circ Res. 2020;126(11):1501–1525. doi:10.1161/CIRCRESAHA.120.315913
25. Dirkx E, Schwenk RW, Glatz JF, Luiken JJ, van Eys GJ. High fat diet induced diabetic cardiomyopathy. Prostaglandins Leukot Essent Fatty Acids. 2011;85(5):219–225. doi:10.1016/j.plefa.2011.04.018
26. Chong CR, Clarke K, Levelt E. Metabolic remodeling in diabetic cardiomyopathy. Cardiovasc Res. 2017;113(4):422–430. doi:10.1093/cvr/cvx018
27. Lamichane S, Dahal Lamichane B, Kwon SM. Pivotal roles of peroxisome proliferator-activated receptors (PPARs) and their signal cascade for cellular and whole-body energy homeostasis. Int J Mol Sci. 2018;19(4):949. doi:10.3390/ijms19040949
28. Standage SW, Waworuntu RL, Delaney MA, et al. Nonhematopoietic peroxisome proliferator-activated receptor-α protects against cardiac injury and enhances survival in experimental polymicrobial sepsis. Crit Care Med. 2016;44(8):e594–e603. doi:10.1097/CCM.0000000000001585
29. Finck BN, Lehman JJ, Leone TC, et al. The cardiac phenotype induced by PPARalpha overexpression mimics that caused by diabetes mellitus. J Clin Invest. 2002;109(1):121–130. doi:10.1172/JCI0214080
30. Jia G, Hill MA, Sowers JR. Diabetic cardiomyopathy: an update of mechanisms contributing to this clinical entity. Circ Res. 2018;122(4):624–638. doi:10.1161/CIRCRESAHA.117.311586
31. Ding G, Fu M, Qin Q, et al. Cardiac peroxisome proliferator-activated receptor gamma is essential in protecting cardiomyocytes from oxidative damage. Cardiovasc Res. 2007;76(2):269–279. doi:10.1016/j.cardiores.2007.06.027
32. Wipperman MF, Montrose DC, Gotto AM, Hajjar DP. Mammalian target of rapamycin: a metabolic rheostat for regulating adipose tissue function and cardiovascular health. Am J Pathol. 2019;189(3):492–501. doi:10.1016/j.ajpath.2018.11.013
33. Sciarretta S, Forte M, Frati G, Sadoshima J. New insights into the role of mTOR signaling in the cardiovascular system. Circ Res. 2018;122(3):489–505. doi:10.1161/CIRCRESAHA.117.311147
34. Zhu Y, Soto J, Anderson B, et al. Regulation of fatty acid metabolism by mTOR in adult murine hearts occurs independently of changes in PGC-1α. Am J Physiol Heart Circ Physiol. 2013;305(1):H41–H51. doi:10.1152/ajpheart.00877.2012
35. Shende P, Plaisance I, Morandi C, et al. Cardiac raptor ablation impairs adaptive hypertrophy, alters metabolic gene expression, and causes heart failure in mice. Circulation. 2011;123(10):1073–1082. doi:10.1161/CIRCULATIONAHA.110.977066
36. Lu Z, Xu X, Hu X, et al. PGC-1 alpha regulates expression of myocardial mitochondrial antioxidants and myocardial oxidative stress after chronic systolic overload. Antioxid Redox Signal. 2010;13(7):1011–1022. doi:10.1089/ars.2009.2940
37. Mitra R, Nogee DP, Zechner JF, et al. The transcriptional coactivators, PGC-1α and β, cooperate to maintain cardiac mitochondrial function during the early stages of insulin resistance. J Mol Cell Cardiol. 2012;52(3):701–710. doi:10.1016/j.yjmcc.2011.10.010
38. Duncan JG, Fong JL, Medeiros DM, et al. Insulin-resistant heart exhibits a mitochondrial biogenic response driven by the peroxisome proliferator-activated receptor-alpha/PGC-1alpha gene regulatory pathway. Circulation. 2007;115(7):909–917. doi:10.1161/CIRCULATIONAHA.106.662296
39. Lee TW, Bai KJ, Lee TI, Chao TF, Kao YH, Chen YJ. PPARs modulate cardiac metabolism and mitochondrial function in diabetes. J Biomed Sci. 2017;24(1):5. doi:10.1186/s12929-016-0309-5
40. Monteiro BS, Freire-Brito L, Carrageta DF, Oliveira PF, Alves MG. Mitochondrial uncoupling proteins (UCPs) as key modulators of ROS homeostasis: a crosstalk between diabesity and male infertility? Antioxidants. 2021;10(11):1746. doi:10.3390/antiox10111746
41. Schilling JD. The mitochondria in diabetic heart failure: from pathogenesis to therapeutic promise. Antioxid Redox Signal. 2015;22(17):1515–1526. doi:10.1089/ars.2015.6294
 © 2022 The Author(s). This work is published and licensed by Dove Medical Press Limited. The
full terms of this license are available at https://www.dovepress.com/terms
and incorporate the Creative Commons Attribution
- Non Commercial (unported, 3.0) License.
By accessing the work you hereby accept the Terms. Non-commercial uses of the work are permitted
without any further permission from Dove Medical Press Limited, provided the work is properly
attributed. For permission for commercial use of this work, please see paragraphs 4.2 and 5 of our Terms.
© 2022 The Author(s). This work is published and licensed by Dove Medical Press Limited. The
full terms of this license are available at https://www.dovepress.com/terms
and incorporate the Creative Commons Attribution
- Non Commercial (unported, 3.0) License.
By accessing the work you hereby accept the Terms. Non-commercial uses of the work are permitted
without any further permission from Dove Medical Press Limited, provided the work is properly
attributed. For permission for commercial use of this work, please see paragraphs 4.2 and 5 of our Terms.
Recommended articles
PEDF Overexpression Ameliorates Cardiac Lipotoxicity in Diabetic Cardiomyopathy via Regulation of Energy Metabolism
Mao T, Wang Y
Diabetes, Metabolic Syndrome and Obesity 2025, 18:217-231
Published Date: 27 January 2025