Back to Journals » Journal of Pain Research » Volume 10
Pain sensitivity and torque used during measurement predicts change in range of motion at the knee
Received 4 September 2017
Accepted for publication 22 October 2017
Published 29 November 2017 Volume 2017:10 Pages 2711—2716
DOI https://doi.org/10.2147/JPR.S150775
Checked for plagiarism Yes
Review by Single anonymous peer review
Peer reviewer comments 4
Editor who approved publication: Dr Katherine Hanlon
Mark D Bishop,1 Steven Z George2
1Department of Physical Therapy, University of Florida, Gainesville, FL, USA; 2Duke Clinical Research Institute, Department of Orthopaedic Surgery, Duke University, Durham, NC, USA
Objective: To determine the extent to which changes in knee range of motion (ROM) after a stretching program are related to sensory factors at the time of testing and the amount of force used during the measurement of ROM, rather than changes in soft-tissue properties.
Design: Randomized, single-blind design. Participants were randomly assigned to a control or stretching group.
Setting: Research laboratory.
Participants: Forty-four healthy volunteers (22.8±2.8 years of age; 23 men).
Interventions: The stretching group undertook static stretching twice a day for 8 weeks. The control group continued with routine activity, but was discouraged from starting a flexibility program.
Main outcome measures: ROM and tissue extensibility was assessed using a Biodex3 dynamometer, and ratings of thermal pain were collected at baseline and at 4 and 8 weeks by an examiner blinded to group assignment. Multilevel modeling was used to examine predictors of ROM across time.
Results: The stretching group showed a 6% increase, and the control group had a 2% increase, in ROM over the 8-week program. However, when fixed and random effects were tested in a complete model, the group assignment was not significant. End-point torque during ROM testing (p=0.021) and the ratings in response to thermal testing (p<0.001) were significant, however.
Conclusion: ROM measured in a testing session was not predicted by assignment to a stretching program. Rather, ROM was predicted by the ratings of thermal stimuli and the peak torque used to apply the stretch.
Keywords: sensory tolerance, stretching, rehabilitation, torque, pain
Plain language summary
This study aimed to empirically test the association of sensory tolerance and range of motion (ROM). Subjects performed passive stretching for eight weeks. Pain sensitivity and torque were measured during ROM testing to identify the contributions of these measures to any changes in motion. The average ROM increased in the stretching group more than the control group, but the amount of motion was associated with pain sensitivity and torque, and not whether a subject was in the stretching or control group. These findings support the hypothesis that changes in ROM may be more strongly related to sensory changes than properties of connective tissues.
Introduction
Stretching is a widely used intervention in rehabilitation and is considered an important component of wellness programs. Changes in joint ROM are proposed to occur through several mechanisms. One mechanism is to elicit change in passive properties of the muscle–tendon complex, and both in vitro1 and in vivo2–5 studies support changes in viscoelastic properties such as stress relaxation and hysteresis mechanisms. Stretching may also affect ROM via neurophysiological processes. For example, stretching may reduce or inhibit reflex activity, decreasing the resistance to stretch, and, thus, result in improved ROM.6,7 Both mechanisms may be beneficial for short-term changes in ROM, depending on the proposed limit to ROM. For example, after immobilization, a patient might emphasize stretches focused on the passive properties to address shortened connective tissues while a competitive athlete might choose active stretching to decrease muscle activity.
However, a meta-analysis of 26 studies of the effects of stretching on muscle length by Freitas et al8 concluded that stretching interventions of longer duration (≤8 weeks) do not change underlying muscle or the tendon properties – that is, longer-term change in ROM. The authors suggest that changes in ROM over this period likely occur at a sensory level. This hypothesis is not new. Changes in sensory perception have been previously inferred by authors who have speculated that any changes in ROM seen in the absence of measurable viscoelastic changes must be related to increased tolerance of the stretch sensation2,9 and from studies in which additional interventions, that should increase or decrease tissue extensibility such as heat or cold application, respectively, are found to provide no superior benefit.10 Studies report decreases in subjective reports of decreased “stretching sensation”11 and maximally “tolerated” ROM,12 implying that sensory adaptation had occurred. Other studies have reported these findings in healthy participants13 and patients with pain.14 In these studies, the authors inferred that changes in stretch tolerance account for the improvements in ROM, but none of these studies directly measured sensory perception specifically. We directly test this in this current study.
Mechanisms of stretch tolerance are not known, but Sharman et al have suggested changes in sensory perception – pain sensitivity – as a possible cause.15 Consequently, our present study sought to extend the findings of this previous literature by directly testing pain sensitivity using quantitative sensory testing (QST). Changes in sensory perception can be effectively measured using cutaneous thermal QST – particularly, tolerance and suprathreshold sensations.
Our overarching hypothesis for this experiment was that ROM, and especially changes in ROM, would be related to sensory factors at the time of testing and the amount of force used during the measurement of ROM. Specifically, we hypothesized that session-related participant responses to sensory testing for pain sensitivity would be significant predictors of ROM measures taken during a stretching program.
Methods
Participants
Forty-four participants who indicated that they were engaged in some form of exercise at least three times a week volunteered to participate in this study. Participants were excluded if they had lower extremity or spine-related musculoskeletal disorders that would contraindicate stretching or ROM testing at the knee. All participants read and signed a consent form. This study was approved by the University of Florida Institutional Review Board for the Health Science Center. All testing occurred in a temperature-controlled laboratory within the University Health Science Center, and efforts were made to test participants at the same diurnal period of the day.
Procedures
Baseline QST and ROM testing occurred prior to group assignment. A single evaluator performed conducted all testing during this experiment and remained blinded to group assignment throughout. Follow-up testing was undertaken at 4 and 8 weeks after the baseline assessment.
Quantitative sensory testing
Thermal QST was assessed using previously reported protocols.16–22 Stimuli were delivered via contact thermode and a computer-controlled Medoc Neurosensory Analyzer (TSA-2001, Ramat Yishai, Israel) with a handheld, peltier-element-based stimulator. Stimuli were applied to the back of the right leg in the popliteal fossa. Participants rated their response to thermal stimuli using a numerical rating scale (NRS) that ranged from “0” (No pain) to “100” (Worst pain intensity imaginable). Participants were familiarized to each stimulus protocol with a practice session delivered to the participants’ dominant forearm. We had both a male and female examiner during testing to account for sex and/or gender influence on reporting of responses to thermal QST,20,23 and standard text was used to explain each test at each session.
Heat stimuli of 3-second duration were applied to the participants’ skin. The temperature rose rapidly (10°C/seconds) from a baseline of 35°C to one of four peaks of 45°C, 47°C, 49°C, or 51°C. Participants were asked to rate the pain intensity felt at the peak temperature of each thermal pulse using the 101-point NRS described earlier. Each of these temperatures was presented twice, with the sequence of delivery randomized between presentations. These ratings are believed to be primarily mediated by input from A-delta fibers.21,24 An average of the ratings of each temperature was calculated.25
We chose to use a superficial stimulus, given reports from participants in other studies that stretching sensations are strongest superficially.
Range of motion
All participants were tested using a Biodex3 isokinetic dynamometer. The standard setup for testing the knee was modified similarly to previous stretching studies using an isokinetic dynamometer as the primary ROM outcome measure.2,3 This set up was such that participants sat with 100° hip flexion and the lumbar spine was maintained in lordosis. The knee began in 97° of flexion on average. The combined trunk and hip position that we used on the Biodex meant that no participant was able to completely straighten the knee during the testing procedure.
Setup positioning was recorded for consistent starting angle of the knee at each testing occasion. Prior to formal data collection, participants completed 5 minutes of cycling and 5 minutes of passive knee flexion and extension on the Biodex moving in passive mode, and practiced using the “stop” switch.
Three trials of passive knee extension at 10°/second were conducted with a minute’s rest between each trial. Each trial was self-limited by the participant.
Raw torque and range data were sampled directly from the Biodex output at 1,000 Hz using the Biopac MP-150 system (Biopac Systems, Goleta, CA) and analyzed using Acqknowledge 3.8.1 (Biopac Systems, Goleta, CA). Raw torque values were corrected for gravity, torque at the time of test termination (end-point torque), and change in knee angle from beginning position to test termination were measured in Acknowledge (Figure 1).
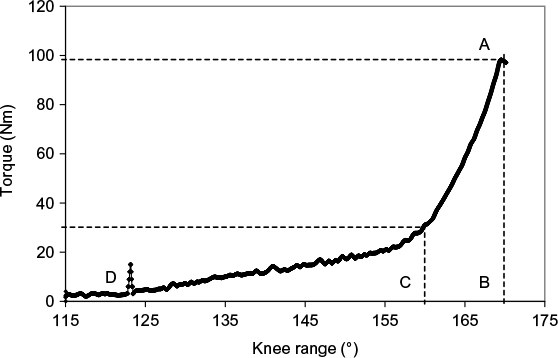 | Figure 1 Sample torque-angle curve created from raw data from one subject. Notes: The peak torque registered when subject terminated this range of motion trial occurred at A. The angle of the knee at the point of termination of the trial is represented at B with full knee extension represented by 180°. In this example, this subject terminated the trial at 170.2°. The point C indicates the angle of the knee at a torque of 30 Nm. We had speculated that angle C would increase if connective tissue properties occurred during the connective tissue bias stretching program. The beginning of the trial is indicated by event marker D. |
Interventions
Control group
The control group (CG) continued with their regular activity, but was dissuaded from starting a flexibility program during the study period.
Stretch technique (static)
Our goal was to replicate what is “typically” done in a home stretching program, and we used the same technique described by Bandy et al26,27 in their work. Participants stood on one leg with the other leg on a chair and the hip in neutral rotation. The participant maintained the pelvis in an anteriorly rotated (tilted) position and “head up,” and bent the stance limb until a stretching sensation was felt in the back of the thigh. The participant was asked to maintain the position, without contracting the quadriceps, for 30 seconds and undertook two repetitions. In between each stretch, the participant was instructed to release the stretch position and stand prior to returning for the second stretch.26,27 Participants were given verbal and written instructions on performance of the interventions and a home-exercise log. Recommendations included undertaking the exercise in the morning and evening after a brief walk; stretching was to be done on both legs, every day for 8 weeks. However, participants were not observed when performing these exercises.
All participants were called by a research assistant once a week to ask if they had any questions about the program. Participants were encouraged to continue with whichever intervention had been assigned.
Follow-up testing
Follow-up testing was conducted at 1 month and then again at 2 months by the same evaluator who remained blinded to group assignment. ROM assessment and QST were carried out at each visit.
Statistical analysis
Groups were compared at baseline on demographic variables using one-way analyses of variance (ANOVA) techniques for continuous data as well as independent t-tests for gender.
Our primary hypothesis was that pain sensitivity would predict ROM. To test this hypothesis, we chose to use multilevel modeling (MLM). MLM is an extension of the general linear model and does not require observations to be independent. Consequently, MLM is well suited for repeated data with observations nested within each participant,28 and both fixed (group) and random (individual) effects can be estimated with MLM. Fixed effects represent “average effects,” or effects that hold for all members of the group. In addition, we conducted random effects tests. Assuming that each value for each measure would be correlated with the previous value of that measure, we chose to use an autoregressive covariance structure (AR1).
The dependent variable was ROM. The model was built sequentially by first adding group, pain sensitivity, and torque as fixed effects. This allowed us to address average effects for all participants. Next, we added a random intercept. A significant finding would indicate that each individual has a different starting point for ROM, and this should be accounted for in the model. Last, we tested for random slopes of pain sensitivity and torque. A significant term would indicate that each person would have a different slope – that is, the magnitude of the within-person relationship between ROM and pain sensitivity, or ROM and torque, might differ substantially across individuals. In addition, we calculated a pseudo R2 value using the predicted values of the final parsimonious model.
Each variable was examined using Q-Q plots and histograms to determine whether the underlying distribution was normal. The linearity of the model was assessed by plotting the residuals and examining the variance. Model fit was determined by examining the Akaike Information Criterion (AIC). Type I error was set at 5%, and all statistical calculations were conducted using IBM SPSS for Windows, version 20 (IBM Corp., Armonk, NY, USA).
Results
Forty-one participants (22.6±2.3 years of age; 23 men) completed the protocol, after one participant withdrew from the control group and two from the intervention group. One participant withdrew after being involved in a motor vehicle accident and the other two left the local area and did not return for testing. Those participants that withdrew did not differ on baseline characteristics from the participants who completed the study. The randomly assigned groups did not differ on demographic, activity level, or responses to QST at baseline (p>0.05 for all comparisons). Baseline information about the participants is shown in Table 1.
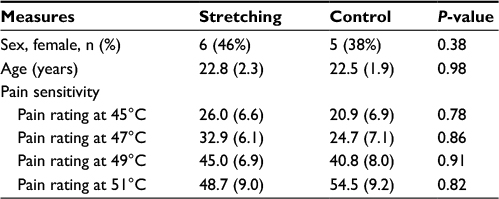 | Table 1 Comparison of baseline measures Note: Data are presented as mean (standard deviation) except for sex, which is the number of female participants (expressed as a proportion). |
Over the 8-week study, members of the intervention group significantly increased ROM by an average of 6.1° (p=0.016) whereas the control group had increased ROM of 2.2° (p=0.22).
All variables (dependent and independent predictor variables) were determined to be normally distributed. When these effects were tested in an MLM to control for the effects of pain sensitivity and end-point torque, the results of the MLM analysis indicated significant fixed effects (AIC 781.8) for both the end-point torque during ROM testing (p=0.021) and pain sensitivity (p<0.001). The group to which the participant had been assigned was not found to significantly affect the results (p=0.997). At the next step, a random intercept was added to the model (i.e., letting each individual start each test at different points in ROM), which was significant (p=0.003) and reduced the AIC (760.6), thereby suggesting an improved model fit. The addition of random slopes for pain sensitivity and torque resulted in a significant effect (p=0.011); however, the AIC rose (779.0), suggesting worse model fit. The pseudo R2 for the model with fixed effects and random intercept was 0.482. Table 2 shows changes in model parameters.
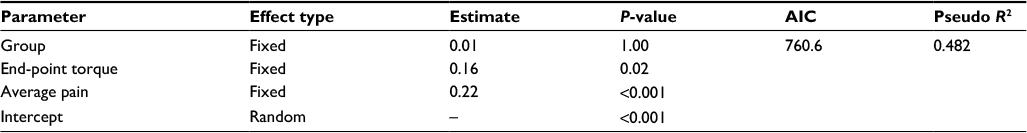 | Table 2 Parsimonious results from the multilevel modeling Notes: The Akaike Information Criterion (AIC) and R2 pertain to the entire model and not to individual parameters; “–” indicates no value for the random effect estimate in this model. |
Discussion
We speculated that if pain perception was a mechanism of action for changes in ROM, we would observe associations among participant responses to standardized suprathreshold QST procedures used experimentally to assess pain sensitivity and participant ROM. This represents a novel methodology for stretching studies, as sensory perception or changes in stretch tolerance were not directly measured in previous studies.2,11,12,14 In contrast, we measured pain perception directly. ROM measured at each evaluation session was significantly and positively associated with average pain sensitivity ratings, providing further evidence that sensory perception may be an important mechanism for stretching.
Furthermore, ROM was positively associated with the torque measured at termination of ROM testing. This suggests that the amount of torque used has an important impact on the motion measured. Consequently, the findings of associations between torque and ROM, and associations to responses to QST, provide additional support that the change in ROM in this group of participants was related to sensory perception rather than an intervention per se. That is, we did not find that the group to which the participants were assigned contributed significantly in a linear mixed model that included responses to sensory testing and the torque required to achieve the ROM. This finding is in contrast to both the univariate results of our analyses and that of other stretching studies. However, there are methodological differences that might account for the differences between our findings and those of other studies.
First, our participants were different from those in other studies with large effect sizes. For example, participants in a study by Webright et al29 had a 15° ROM limitation that was measured using the test that was also the outcome in that study. Similarly, Bandy et al26,27 recruited and tested only those participants with a limited ROM criteria (30° lack of knee extension) measured using the active hamstring test. Both Webright et al29 and Bandy et al26,27 used an active hamstring test as the primary outcome measure. In contrast to both these previous studies, we modified the position for data collection2–4 to be able to assess passive ROM in all volunteers. Thus, the potential for change in motion was likely smaller.
Second, when we built multivariate models, the effect of group was not statistically significant. This suggests that the changes noted in the stretching group may have been related to other factors. We measured thermal pain sensitivity based on our assumption that the sensation of stretch is mediated by a variety of superficial and deep somatic structures. In fact, our anecdotal experience has been that participants describe the sensation during stretching as one that is superficial.
The primary limitation to this investigation was that we did not collect electromyographic data to be sure that participants were maximally relaxed during each test. Changes in muscle activity may have affected the available ROM by modifying the compliance of the posterior thigh muscles. For example, we are unable to confirm that every individual was maximally relaxed during testing. Similarly, we cannot confirm that any reflex activation might have increased stiffness; however, the passive measurement was collected at 5°/second; therefore, we are confident that there was no reflex activity elicited in the muscle due to stretch reflexes. In addition, we did not directly supervise participants and, therefore, compliance may have varied greatly between the groups. Potentially, better compliance in the stretching group may have enhanced the differences between groups in the linear mixed model as well as on univariate tests. Last, our results can only be directly applied to individuals consistent with those participants who volunteered in our study and for the stretching program used in this study. People with major connective tissue restrictions or those undertaking higher levels of activity or different stretching programs might have differing responses to those we tested in this study.
Nonetheless, our findings in combination suggest that changes in ROM after 8 weeks of stretching in healthy participants may be related to pain sensitivity rather than changes in tissue extensibility. The parameters that were used for application of static hamstring stretching, based on clinical recommendations,26,27 may not change connective tissue properties but may be enough to change stretch tolerance.
Acknowledgments
The authors thank Hemal Vyas, Supriya Shidore, Andrew McNally, and Melissa McNally, for their assistance in data collection. The writing time of MD Bishop and SZ George was supported by the NIH/NIAMS (AR055899).
Disclosure
The authors report no conflicts of interest in this work.
References
 © 2017 The Author(s). This work is published and licensed by Dove Medical Press Limited. The
full terms of this license are available at https://www.dovepress.com/terms
and incorporate the Creative Commons Attribution
- Non Commercial (unported, 3.0) License.
By accessing the work you hereby accept the Terms. Non-commercial uses of the work are permitted
without any further permission from Dove Medical Press Limited, provided the work is properly
attributed. For permission for commercial use of this work, please see paragraphs 4.2 and 5 of our Terms.
© 2017 The Author(s). This work is published and licensed by Dove Medical Press Limited. The
full terms of this license are available at https://www.dovepress.com/terms
and incorporate the Creative Commons Attribution
- Non Commercial (unported, 3.0) License.
By accessing the work you hereby accept the Terms. Non-commercial uses of the work are permitted
without any further permission from Dove Medical Press Limited, provided the work is properly
attributed. For permission for commercial use of this work, please see paragraphs 4.2 and 5 of our Terms.