Back to Journals » International Journal of Nanomedicine » Volume 12
Paclitaxel-loaded and A10-3.2 aptamer-targeted poly(lactide-co-glycolic acid) nanobubbles for ultrasound imaging and therapy of prostate cancer
Authors Wu M ![]() , Wang Y, Wang YR, Zhang MB, Luo YK, Tang J, Wang ZG, Wang D, Hao L, Wang ZB
, Wang Y, Wang YR, Zhang MB, Luo YK, Tang J, Wang ZG, Wang D, Hao L, Wang ZB
Received 3 March 2017
Accepted for publication 30 May 2017
Published 26 July 2017 Volume 2017:12 Pages 5313—5330
DOI https://doi.org/10.2147/IJN.S136032
Checked for plagiarism Yes
Review by Single anonymous peer review
Peer reviewer comments 3
Editor who approved publication: Professor Lei Yang
Meng Wu,1,2 Ying Wang,3 Yiru Wang,2 Mingbo Zhang,2 Yukun Luo,2 Jie Tang,2 Zhigang Wang,4 Dong Wang,5 Lan Hao,4 Zhibiao Wang6
1School of Medicine, Nankai University, Tianjin, 2Department of Ultrasound, Chinese PLA General Hospital, Beijing, 3Wuhan Textile University, Wuhan, 4Chongqing Key Laboratory of Ultrasound Molecular Imaging, The Second Affiliated Hospital of Chongqing Medical University, 5Department of Ultrasound, The First Affiliated Hospital of Chongqing Medical University, 6College of Biomedical Engineering, Chongqing Medical University, Chongqing, People’s Republic of China
Abstract: In the current study, we synthesized prostate cancer-targeting poly(lactide-co-glycolic acid) (PLGA) nanobubbles (NBs) modified using A10-3.2 aptamers targeted to prostate-specific membrane antigen (PSMA) and encapsulated paclitaxel (PTX). We also investigated their impact on ultrasound (US) imaging and therapy of prostate cancer. PTX-A10-3.2-PLGA NBs were developed using water-in-oil-in-water (water/oil/water) double emulsion and carbodiimide chemistry approaches. Fluorescence imaging together with flow cytometry verified that the PTX-A10-3.2-PLGA NBs were successfully fabricated and could specifically bond to PSMA-positive LNCaP cells. We speculated that, in vivo, the PTX-A10-3.2-PLGA NBs would travel for a long time, efficiently aim at prostate cancer cells, and sustainably release the loaded PTX due to the improved permeability together with the retention impact and US-triggered drug delivery. The results demonstrated that the combination of PTX-A10-3.2-PLGA NBs with low-frequency US achieved high drug release, a low 50% inhibition concentration, and significant cell apoptosis in vitro. For mouse prostate tumor xenografts, the use of PTX-A10-3.2-PLGA NBs along with low-frequency US achieved the highest tumor inhibition rate, prolonging the survival of tumor-bearing nude mice without obvious systemic toxicity. Moreover, LNCaP xenografts in mice were utilized to observe modifications in the parameters of PTX-A10-3.2-PLGA and PTX-PLGA NBs in the contrast mode and the allocation of fluorescence-labeled PTX-A10-3.2-PLGA and PTX-PLGA NBs in live small animals and laser confocal scanning microscopy fluorescence imaging. These results demonstrated that PTX-A10-3.2-PLGA NBs showed high gray-scale intensity and aggregation ability and showed a notable signal intensity in contrast mode as well as aggregation ability in fluorescence imaging. In conclusion, we successfully developed an A10-3.2 aptamer and loaded PTX-PLGA multifunctional theranostic agent for the purpose of obtaining US images of prostate cancer and providing low-frequency US-triggered therapy of prostate cancer that was likely to constitute a strategy for both prostate cancer imaging and chemotherapy.
Keywords: nanobubbles, ultrasound imaging, paclitaxel, cancer therapy, aptamer, prostate-specific membrane antigen
Introduction
Prostate cancer has a poor prognosis; treatments for prostate cancer include conventional methods (eg, radiation, chemotherapy, surgical removal of the tumor, or a combination of these methods).1 The systemic toxicity together with adverse side effects resulting from typical treatments have led to the discovery of site-specific treatments with the help of nanotechnology, which reduce the negative effects on normal tissues.2 Nanomedicine likely increases the specificity of cancer therapy with the help of the cancer cell-specific delivery of anticancer medicine via nanoparticles equipped with targeting moieties.2,3 Efficient grouping of varied nanoscale materials has resulted in the growth of multifunctional nanoplatforms that enhance cancer diagnosis and therapy simultaneously.4 In recent years, polymer nanoparticles that can be used as drug delivery carriers or nonviral gene vectors have aroused high interest in nanomedicine.5 Among these molecules, poly(lactide-co-glycolic acid) (PLGA) is a biodegradable copolymer that has been approved by the United States Food and Drug Administration (FDA) for utilization as a scaffold in tissue engineering and in various drug or gene delivery systems.6,7 Via the tricarboxylic acid cycle, the final products of the cellular metabolic conversion of PLGA are water and carbon dioxide, which are nontoxic molecules.5
Recently, biodegradable gas-filled nanobubbles (NBs) used as ultrasound (US) agents and fabricated from PLGA (denoted as PLGA NBs) have received widespread attention not only because these molecules can improve US signals but also because they can be used as drug carriers.8 PLGA, as an NB shell with excellent biocompatibility, biodegradability, and mechanical strength, is preferred and popular for use in molecular imaging.9–12 Many studies have shown that the utilization of nanomaterials as target contrast agents as well as therapeutic actuators may be one of the most frequent approaches for cancer therapy and diagnosis (also called theranostics), although this process is still in its infancy.13–15 Theranostics combines therapy and imaging within a single multifunctional nanomaterial. This integration of therapeutic processes with diagnostic imaging capability is critical to address the challenges encountered in cancer.16 NBs modified with specific agents have been demonstrated as appropriate carriers that can efficiently deliver targeted therapeutic drugs to cells and tissues.17–21 In the current study, we developed a multifunctional nanocarrier that efficiently combines cancer cell targeting with imaging, thus providing the potential for space-controlled drug release in addition to tumor therapy. In the current study, we selected PLGA polymers in this nanocarrier system due to the diffusion capability and dispersal-controlled drug discharge of this molecule.22–24 Paclitaxel (PTX), which is an anticancer drug with a broad spectrum, has previously been used to encapsulate PLGA polymers.25–27 We also selected an A10-3.2 aptamer having merely 39 nucleotides as the targeting agent, which likely binds the intended proteins using optimal specificity and similarity, thus modulating the function of the target protein.28–30 Aptamers, with stable structures and little immunogenicity,31 can be chemically synthesized and stabilized.
A10-3.2 aptamers conjugated to NBs increase targeting, resulting in more efficient therapeutics and more selective diagnostics. NBs conjugates of the A10-3.2 aptamer have been generated to target prostate-specific membrane antigen (PSMA; Figure 1).32 A transmembrane protein is upregulated in metastatic prostate cancer and androgen-independent prostate cancer.33,34 Thus, these multifunctional nanocarriers can be targeted, led toward, and attracted to prostate cancer cells through tumor-specific A10-3.2 aptamers. A10-3.2 aptamers functionalized onto NBs play a crucial role in targeting these particles to a specific subset of prostate cancer cells.35
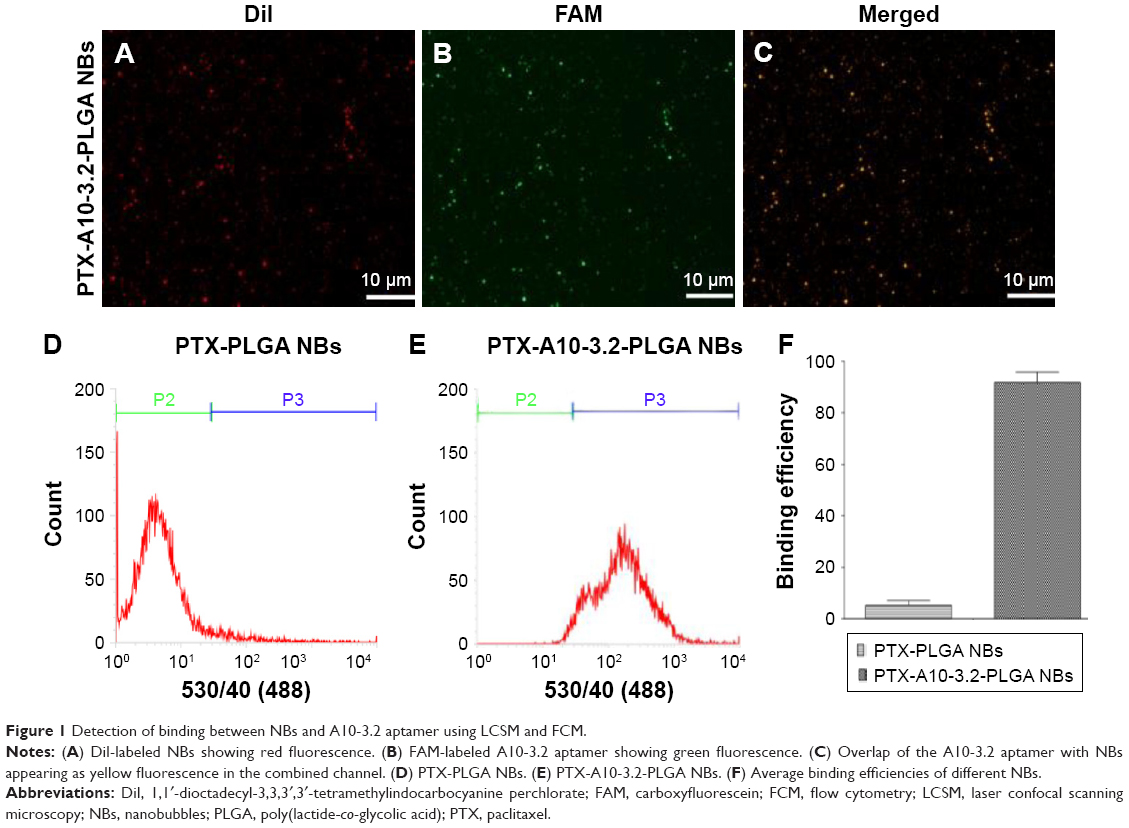 | Figure 1 Detection of binding between NBs and A10-3.2 aptamer using LCSM and FCM. |
We discovered that drug-loaded PLGA passively collected in tumor tissue. Ultrasonic irradiation of the tumor stimulated drug discharge from the PLGA and briefly changed the cell membrane permeability, leading to efficient intracellular uptake of the drug by tumor cells. Ultrasonic irradiation also enhanced the spread of the drug through the tumor volume and thus decreased drug concentration gradients, an effect that can help reduce side effects and increase drug therapy efficacy.
We assumed that after applying PTX-A10-3.2-PLGA NBs at the irradiated tumor site, “active targeting” was enhanced by the “passive targeting” of US, and this US process could considerably increase the cellular uptake and the accumulation of PTX in prostate tumors.36 In this study, we proposed a multifunctional nanocarrier system comprising 1) PTX for localized treatment, 2) PLGA NBs for US imaging, 3) tumor-specific aptamers for cell targeting, and 4) safety and the ability to undergo biodegradation into nontoxic by-products. The physicochemical properties of multifunctional PTX-A10-3.2-PLGA NBs were characterized in terms of morphology, surface charge, size, stability, and drug release. Cell viability, cellular uptake, uptake mechanisms, and anticancer effects were evaluated. Finally, we investigated the feasibility of PTX-A10-3.2-PLGA NBs for US imaging in vivo and in vitro.
Materials and methods
Preparation of PTX-PLGA NBs
PTX-loaded PLGA NBs (PTX-PLGA NBs) were generated using a water/oil/water double emulsion. Briefly, 50 mg PLGA-COOH (50:50, molecular weight [MW] =12.3 kDa, Jinan Daigang Biomaterial Co., Ltd, Shandong, People’s Republic of China) was directly dissolved in 1.5 mL of dichloromethane and mixed with 5 mg of PTX (Haoxuan, Xian, People’s Republic of China) and 0.2 mL of Milli-Q water under sonication (VCY-500; Yongyan, Shanghai, People’s Republic of China) with an amplitude of 20% for 1.5 min to obtain the first emulsion (first emulsion). The first emulsion was immediately poured into 8 mL of a poly(vinyl alcohol) (PVA; Sigma-Aldrich Co., St Louis, MO, USA) solution (4%, w/v) and sonicated for 1 min to form a double emulsion (second emulsion). Following dichloromethane evaporation to solidify the PTX-PLGA, the double emulsion was transferred into 20 mL of isopropanol (2%, v/v) and continuously stirred for 2–4 h at room temperature to extract dichloromethane. The obtained PTX-PLGA nanoparticles were further collected through centrifugation at 8,000 rpm for 10 min and washed three times using Milli-Q water, subsequently lyophilized for 48 h, and filled with perfluoropropane gas. A lyophilized powder of PTX-PLGA NBs was obtained and sealed at 4°C until further use. NBs without the addition of PTX were used as pure PLGA NBs.
Conjugation of the A10-3.2 aptamer to PTX-NBs
An amine-modified A10-3.2 (5′-GGGAGGACGAUGCGGAUCAGCCAUGUUUACGUCACUCCU-spacer-NH2-3′ with 2′-fluoro pyrimidines) (RiboBio, Guangzhou, People’s Republic of China) conjugation of aptamer was performed to the carboxyl group of the PTX-NBs using carbodiimide chemistry, a commonly used conjugation strategy. The carboxyl groups found on the exterior of the NBs were transferred to succinimide with the help of 1-ethyl-3-(3-dimethylaminopropyl)-carbodiimide (EDC; Sigma-Aldrich Co.) as well as N-hydroxysuccinimide (NHS; Sigma-Aldrich Co.) that was subsequently reacted with the A10-3.2 aptamer. Briefly, 50 mg of PTX-PLGA NBs was dispersedly and dissolved in 4 mL of 0.1 M 2-(N-morpholino)ethanesulfonic acid (MES; Dojindo, Shanghai, People’s Republic of China) buffer solution (pH =5.5) and incubated with 500 μL of 0.4 M EDC together with 500 μL of 0.1 M NHS for a period of 30 min at room temperature on a gentle shaker. Afterward, centrifugation of the solution was performed at 8,000 rpm for 5 min, and the precipitate was washed using deionized water. Centrifugation as well as washing was performed three times to remove unreacted EDC and NHS, and 4 mL of 0.1 M MES (pH =8.0) buffer solution was added to dissolve the NHS-activated PTX-PLGA NBs. The NHS-activated PTX-PLGA NBs are covalently linked to an appropriate amount of amine-modified A10-3.2 aptamer with incubation for 2 h at room temperature. After the reaction was finished, the solution was centrifuged and resuspended to obtain PTX-A10-3.2-PLGA NBs. Then, PTX-A10-3.2-PLGA NBs were preserved at 4°C before use.
Characterization of PTX-A10-3.2-PLGA NBs
The morphological characteristics of the prepared different formulations of NBs were evaluated using an inverted fluorescence microscope (TH4-200; Olympus Corporation, Tokyo, Japan) and scanning electron microscopy (SEM, S3400N; Hitachi Ltd., Tokyo, Japan). Transmission electron microscopy (TEM, H7500; Hitachi Ltd.) was used to estimate the shape of the NBs. A dynamic light scattering apparatus (ZS90; Malvern Instruments, Malvern, UK) was utilized to determine the mean diameter, size distribution, polydispersity index (PDI), and zeta potential.
Evaluation of binding between the A10-3.2 aptamer and PTX-PLGA NBs
The carboxyfluorescein (FAM)-labeled A10-3.2 aptamer was incubated with 1,1′-dioctadecyl-3,3,3′,3′-tetramethylindocarbocyanine perchlorate (DiI)-labeled PTX-PLGA NBs at room temperature for a period of 2 h. Following a wash with deionized water, the binding between the FAM-labeled A10-3.2 aptamer and DiI-labeled PTX-PLGA NBs was observed using laser confocal scanning microscopy (LCSM, A1+R; Nikon Corporation, Tokyo, Japan), and the binding efficiencies between the FAM-labeled A10-3.2 aptamer and DiI-labeled PTX-PLGA NBs were determined using flow cytometry (FCM; FACSVantage; BD, Franklin Lakes, NJ, USA).
Evaluation of encapsulation efficiency and drug loading
For the purpose of evaluating the drug-loading material, following the disintegration of free drug, PTX-A10-3.2-PLGA NBs were completely dissolved in methanol using sonication. The PTX density of the solution was evaluated using high-performance liquid chromatography (HPLC, LC-2010AHt; Shimadzu, Kyoto, Japan). The drug encapsulation efficiency and the drug-loading were calculated via the following equations:
|

|

W1 represents the total drug amount in the PTX-A10-3.2-PLGA NBs, W2 represents the weight of the provided drug, and W3 represents the weight of the provided drug and NBs mixture. Each process was performed in triplicate.
PTX-A10-3.2-PLGA NB in vitro drug release profiles
The PTX release profiles were obtained after immersing the PTX-A10-3.2-PLGA NBs and PTX-A10-3.2-PLGA NBs + the ultrasound gene transfer machine (CGZZ, Chongqing Key Laboratory of Ultrasound Molecular Imaging of Chongqing Medical University, Chongqing, People’s Republic of China) was applied at 1 MHz, 2 W/cm2, and 50% duty cycle (DC) for 20 min in a dialysis bag (MW cutoff: 8,000 Da) containing 2 mL of phosphate-buffered saline (PBS). Both ends of the dialysis bag were sealed, and the bag was subsequently fully immersed in a conical flask containing 150 mL of slow-release medium (30% ethyl alcohol, 0.01% Tween-80, and 0.02% sodium azide). The Erlenmeyer flask was gently shaken in a thermostatic rotary shaker at 120 rpm/min and 37°C. At different time points, 1 mL of the dialysate was collected and replaced with 1 mL of fresh PBS. The amount of PTX released in the dialysate was quantitatively determined using an HPLC system at 227 nm and a calibration curve. The total percentage of the discharged PTX was determined for each incubation time.
Cell culture and nude mice
The human prostate cancer cell lines LNCaP and PC3 were received from American Type Culture Collection (ATCC, Manassas, VA, USA), and all of the cells were cultured in DMEM F12 containing 10% heat-inactivated fetal bovine serum, 100 U/mL penicillin, and 0.1 mg/mL streptomycin at 37°C in a humidified 5% CO2 incubator. Male BALB/c, 4–6-week-old nude mice were obtained from the Laboratory Animal Centre of Chongqing Medical University and managed as per the instructions of the local animal care committee. All the experimental protocols were approved by the Animal Ethics Committee of Chongqing Medical University. The experimental operations were carried out according to the protocol approved by the Animal Ethics Committee of Chongqing Medical University.
In vitro assessment of the target binding
The LNCaP and PC3 cells were separately cultured in a six-well plate that had a coverslip at a density of 5×10⁴ cells/mL in each well. After 24 h of culture, the cells were washed three times using PBS. Moreover, the cells were divided into five groups: group I, DiI-labeled PTX-A10-3.2-PLGA NBs + US + LNCaP cells; group II, DiI-labeled PTX-A10-3.2-PLGA NBs + LNCaP cells; the inhibition/competitive group (group III), DiI-labeled PTX-A10-3.2-PLGA NBs + A10-3.2 + LNCaP cells (A10-3.2 aptamer excess group); group IV, DiI-labeled PTX-PLGA NBs + LNCaP cells; and group V, DiI-labeled PTX-A10-3.2-PLGA NBs + PC3 cells. Groups II, IV, and V were mixed with 100 μL of DiI-labeled NBs that had different formulations (2.5 mg/mL) and incubated for 2 h. For the competition/inhibition studies, excess A10-3.2 aptamer was added to and mixed with the incubation medium that was used for group III. After 2 h of blocking, the cells were washed three times with PBS, subsequently treated with 100 μL of DiI-labeled PTX-A10-3.2-PLGA NBs (2.5 mg/mL), and then continuously incubated for 2 h. Group I received 100 μL of DiI-labeled PTX-A10-3.2-PLGA NBs (2.5 mg/mL) and then underwent ultrasonic irradiation (1 MHz, 0.22 W/cm2, 10 s) and incubation for 2 h. The control group III received 100 μL of DiI-labeled PTX-A10-3.2-PLGA NBs (2.5 mg/mL) and was then incubated for 2 h. After the 2 h incubation, the cells in the five groups were washed three times using PBS, fixed in 4% paraformaldehyde for 15 min, and stained with 4′,6-diamidino-2-phenylindole (DAPI) and 3,3′-dioctadecyloxacarbocyanine perchlorate (DiO) for visualization of the nuclei and membrane, respectively. The stained coverslips were imaged using LCSM. DiI, DiO, and DAPI showed red, green, and blue colorations, respectively. The binding efficiencies between cells and NBs were determined using FCM.
Cell viability assay
Cell viability was compared between NBs and two types of cells using Cell Counting Kit-8 (CCK-8; Dojindo). LNCaP and PC3 cell suspensions were each plated onto 96-well plates at a density of 5×10³ cells/well and permitted to adhere overnight at a temperature of 37°C. After the medium was changed to fresh culture medium, the cells were divided into three groups: group I, LNCaP cells incubated with PLGA NBs, A10-3.2-PLGA NBs, PTX-PLGA NBs, and PTX-A10-3.2-PLGA NBs (at NB concentrations of 0.3, 0.625, 1.25, 2.5, 5, 10, 20, and 40 mg/mL) for 48 h; group II, LNCaP cells incubated with free PTX, PTX-PLGA NBs, PTX-A10-3.2-PLGA NBs, and PTX-A10-3.2-PLGA NBs + US (at PTX concentrations of 0.025, 0.05, 0.1, 0.25, 0.5, 1, 2, and 4 mg/mL) for 48 h; and group III, LNCaP cells incubated with PTX-A10-3.2-PLGA NBs and PTX-A10-3.2-PLGA NBs + US and PC3 cells incubated with PTX-A10-3.2-PLGA NBs and PTX-A10-3.2-PLGA NBs + US (at PTX concentrations of 0.025, 0.05, 0.1, 0.25, 0.5, 1, 2, and 4 mg/mL) for 48 h. Next, 10 μL of unfrozen CCK-8 solution was added to each well prior to incubation for 1 h. Afterward, the absorbance was recorded at 450 nm using a microplate reader (ELX800; BioTek, Winooski, VT, USA). The relative cell viability was calculated as a proportion of the control (nontreated cells).
Cell apoptosis analysis
The LNCaP cells were collected by resuspension in 500 μL of binding buffer, plated onto six-well plates at 5×10⁵ cells/well, and incubated overnight. Various formulations of PTX 0.25 mg/mL were incubated for 24 and 48 h. The cells were collected and re-suspended in 500 μL of binding buffer prior to the addition of up to 5 μL of Annexin V-fluorescein isothiocyanate (FITC) and 5 μL of propidium iodide (PI; BestBio, Shanghai, People’s Republic of China); these cells were then incubated for 15 min at room temperature. FCM was used to analyze the samples.
Imaging in vitro
A gel mold containing several holes with a depth of 2 cm along the edge was used to assess the US imaging of PTX-A10-3.2-PLGA NBs in vitro. Images of deionized water were acquired as a control, and PTX-A10-3.2-PLGA NBs of different concentrations (2.5, 5, 10, 20, and 40 mg/mL) were attained following the placement of these samples in the agarose molds of the Biosound Esaote MyLab 90 ultrasound imaging system. The same instrument parameters (mechanical index [MI] =0.1) were used to acquire all images, and the experiments were repeated three times. The mean gray scale was calculated using Grey Scale software (Chongqing Key Laboratory of Ultrasound Molecular Imaging).
In vivo enhancement of US imaging in xenograft tumors
The contrast mode of the small animal high-frequency US imaging apparatus (PanoViewβ1500; S-Sharp Co., Taibei, Taiwan) was used for scanning at a probe frequency of 20 MHz. Respiratory gating was used to eliminate pseudo results resulting from respiration-induced movements. The groups used for the experiment included the normal saline control group, the PTX-PLGA NBs group, and the PTX-A10-3.2-PLGA NBs group. The scan parameters remained unchanged during testing. The enhancement of US imaging was shown in green, and a echo signal intensity was constructed to compare the differences in the imaging gray-scale intensity (GSI) value.
In vivo fluorescence imaging in xenograft tumors
1,1′-Dioctadecyl-3,3,3′,3′-tetramethylindotricarbocyanine (DiR)-labeled PTX-A10-3.2-PLGA NBs and PTX-PLGA NBs 0.2 mL (20 mg/mL) were injected into LNCaP tumor-bearing nude mice via the tail vein. The changes in fluorescence intensity in xenograft tumors at the time intervals of 0, 2, 4, 8, 12, and 24 h were assessed in vivo using a small animal living fluorescence imaging apparatus (IVIS Lumina Series III; PerkinElmer Inc., Waltham, MA, USA). DiI-labeled PTX-A10-3.2-PLGA NBs and PTX-PLGA NBs 0.2 mL (20 mg/mL) were also injected into LNCaP tumor-bearing nude mice via the tail vein. The nude mice were euthanized, and the tumor tissue, liver, spleen, and kidney were removed and brought to the pathology department immediately to obtain cryosections. All pieces of the organ tissues were stained using DAPI to visualize the cell nucleus. The samples were washed three times with normal saline after incubation for 5 min at room temperature. The organ tissues were treated with antifade mounting medium, and then the fluorescence was observed by LCSM. We measured the integrated optical density (IOD) of each image using Image Pro Plus (IPP; Media Cybernetics, Inc, Rockville, MD, USA) 6.0 for quantitative analysis.
Tumor mouse xenograft model
The prostate tumor mouse xenograft model was generated by injecting 1×10⁷ LNCaP cells into the subcutaneous area around the right hip of 4- to 6-week-old male BALB/c nude mice. The volume of tumor was calculated using the following equation: V = length × width2/2.37–39 Treatment was initiated when the subcutaneous tumor reached a volume of 150 mm3. In total, 25 tumor-bearing nude mice were chosen and randomly segregated into five groups with five mice per group. The experiment groups were as follows: the saline control group (control); the pure PTX drug group (PTX); the nontargeting group (PTX-PLGA NBs); the targeting group (PTX-A10-3.2-PLGA NBs); and the targeted + ultrasonic irradiation group (PTX-A10-3.2-PLGA NBs + US). The PTX dose for each nude mouse was 25 mg/kg. Depending on the various drug loadings, the corresponding drug concentration was adjusted. Treatment included the corresponding drug concentration and a treatment interval of 3 days for a total of seven times, under the same ultrasonic irradiation group irradiation parameters (1 MHz, 2.0 W/cm2, 20 min).
Therapeutic effect in vivo
The conditions of the nude mice at 0, 3, 6, 9, 12, 15, 18, and 21 days after treatment were observed, and the long diameter and short diameter of the tumor were measured using a Vernier caliper. According to the measured tumor volume, a tumor growth curve was drawn. After treatment for 21 days, the following formula was used to calculate the tumor inhibition rate (TIR): TIR = (1- average tumor volume in the tested group/average volume in the control group) ×100%. After treatment for 7 times, put the nude mouse to death and blood was collected to detect the serum markers including blood urea nitrogen (BUN), creatinine (CREA), albumin (ALB), aspartate aminotransferase (AST), and alanine aminotransferase (ALT). After treatment, in another group of nude mice, the survival time and body weight were both recorded every day.
Statistical analyses
The data analysis was performed using Student’s t-tests or one-way analysis of variance (ANOVA) (SPSS software, version 19.0; IBM Corporation, Armonk, NY, USA). All data are expressed as mean ± SD. A P-value <0.05 was considered significant.
Results and discussion
Characterization of PTX-A10-3.2-PLGA NBs
Inverted fluorescence microscopy and SEM showed homogeneous bubble sizes among the NBs, with well-defined spherical morphology, smooth surfaces, high dispersity, and no aggregation (Figure 2A and B). The PTX was relatively uniformly distributed in the NBs shells (Figure 2C). The average NBs diameters, PDIs, and zeta potentials of the different formulations of NBs are shown in Table 1. These results show that the addition of PTX to the shell together with the grafting of A10-3.2 aptamer on the surface of polymer shells exerted a slight effect on the particle size and on the surface charge of PTX-A10-3.2-PLGA NBs. The mean particle size of PTX-PLGA NBs was slightly larger than that of PLGA NBs, indicating that the presence of PTX in the shell enlarged the volume of the NBs. The PTX-A10-3.2-PLGA NBs showed a larger particle size, reflecting the covalent linkage of the A10-3.2 aptamer on the surface of the polymer shell to form a well-knit structure.40 There was a statistically significant difference among them (P<0.05). Thus, PTX-A10-3.2-PLGA NBs are targeted and therapeutic. Because of its particle size being between 400–500 nm and <700 nm, which allows it to enter the tumor tissue gap, it plays the role of a therapeutic agent and US contrast agent, performing real-time dynamic observation treatment effect.
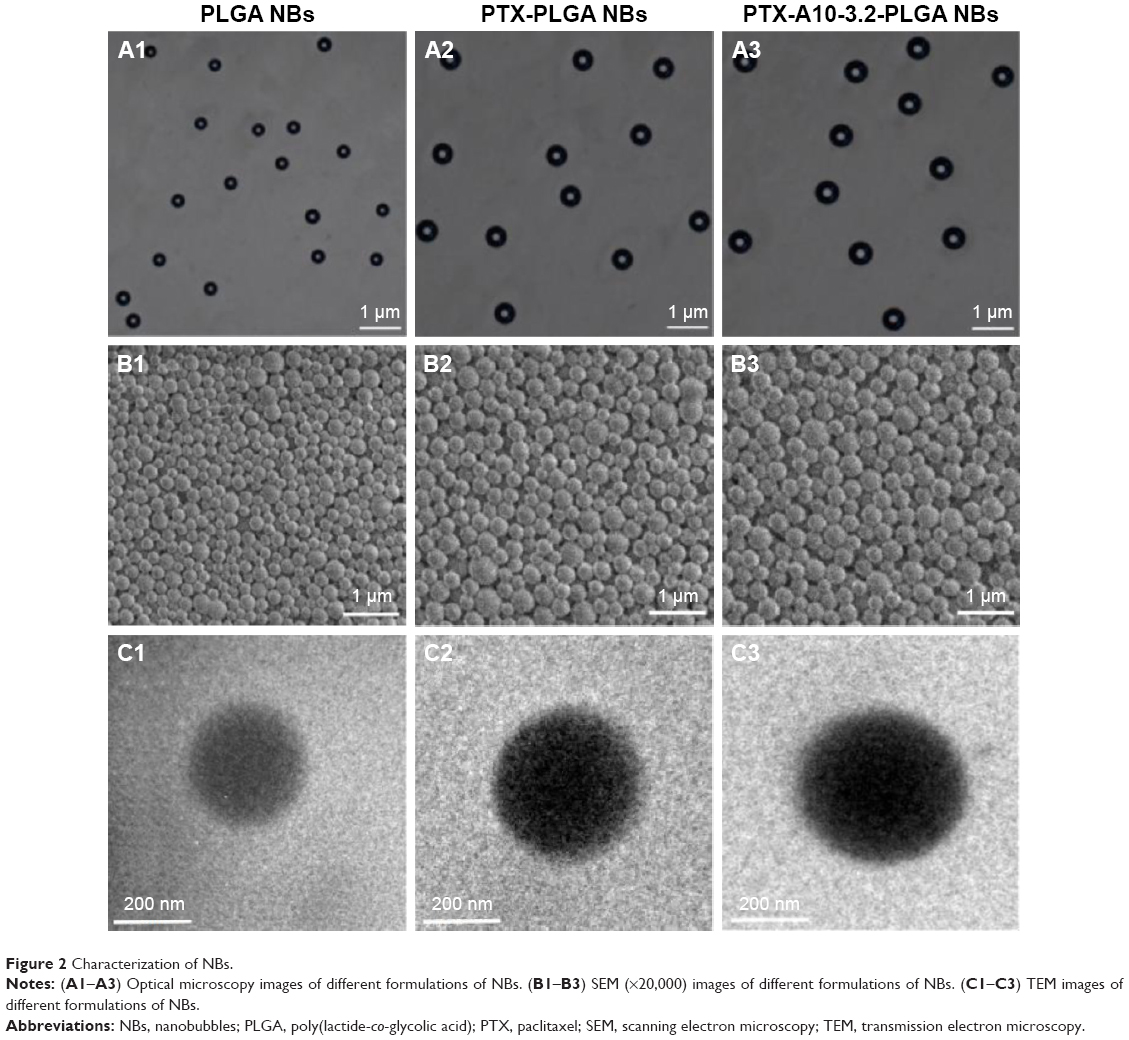 | Figure 2 Characterization of NBs. |
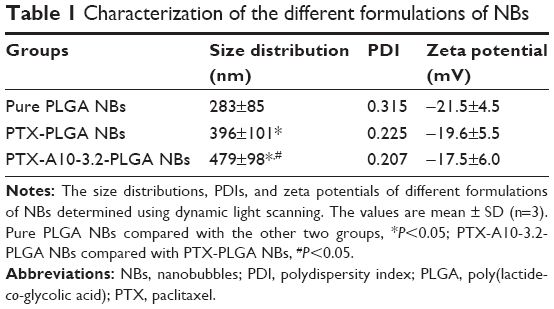 | Table 1 Characterization of the different formulations of NBs |
Assessment of binding between aptamer and NBs
LCSM showed that DiI-labeled NBs show red fluorescence, and the FAM-labeled A10-3.2 aptamer shows green fluorescence. In the combined channel, overlapping red NBs and green aptamers could appear as yellow fluorescence (Figure 1A–C). Furthermore, the binding efficiency between the aptamer and NBs was 89.9%±4.33%, as determined by FCM (Figure 1D–E).
In vitro drug release and loading capacity
The PTX drug release time curve within 30 and 5 days for PTX-A10-3.2-PLGA NBs revealed that in the first 12 h, the drug release rate in the ultrasonic irradiation group and the control group was 26.50%±1.87% and 10.60%±1.31% (Figure 3A and B), respectively. The drug release results from the PTX stuck on or not tightly wrapped onto the surface, and ultrasonic irradiation accelerates this process. After the burst release for 12 h, the drug release rate slowed, and the half-life of drugs in the US group and control group were 3 and 10 days (Figure 3A and B), respectively. The cumulative release quantity of the PTX-A10-3.2-PLGA NBs + US group and PTX-A10-3.2-PLGA NBs group on the 30th day was 85.70%±4.91% and 73.80%±5.33% (Figure 3A and B). HPLC was used to examine the PTX-loaded NBs after all of the drug was released from PTX-A10-3.2-PLGA NBs. The drug encapsulation efficiency and the drug loading were 51.03%±3.20% and 4.64%±0.29%, respectively.
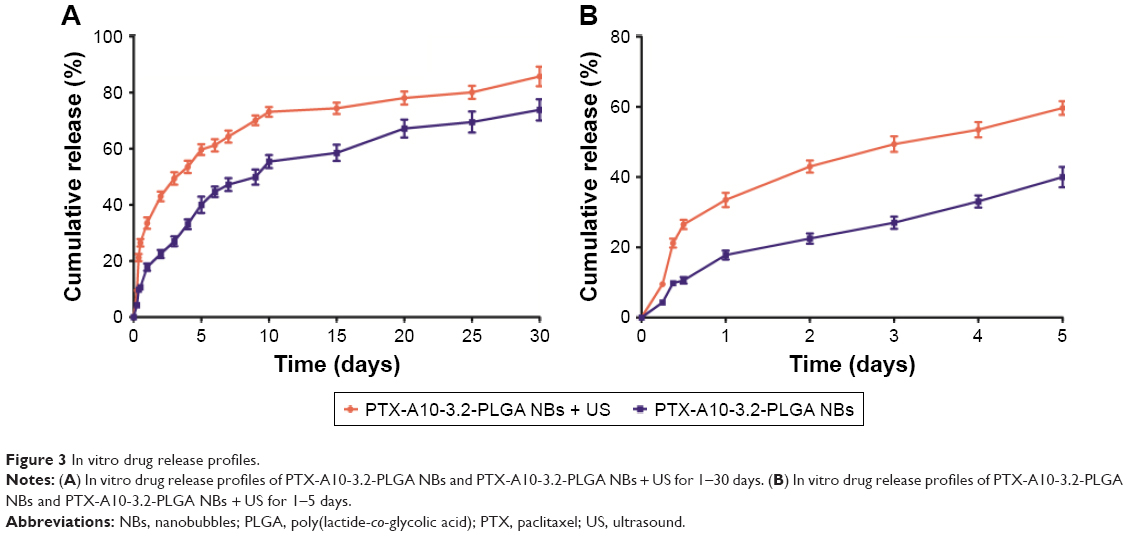 | Figure 3 In vitro drug release profiles. |
In vitro assessment of target binding
Two techniques, fluorescence imaging and FCM, were used to evaluate the targeting efficiency of different formulations of NBs to PSMA-positive LNCaP cells and to PSMA-negative PC3 cells. In group I, the LCSM images revealed that large amounts of DiI-labeled PTX-A10-3.2-PLGA NBs (red fluorescent dots) were present in the membranes (green fluorescent) of LNCaP cells, indicating that PTX-A10-3.2-PLGA NBs can target PSMA on the membranes of LNCaP cells and are subsequently consumed by cells (Figure 4A). In group II, DiI-labeled PTX-A10-3.2-PLGA NBs are present in the membranes of LNCaP cells, indicating that PTX-A10-3.2-PLGA NBs can target PSMA on the membranes of LNCaP cells (Figure 4B). In group III, the inhibition/competitive group, PTX-A10-3.2-PLGA NBs lost the ability to target cancer cells when the PSMA was blocked in advance with excess free A10-3.2 aptamer, reflecting the absence of intracellular DiI-labeled PTX-A10-3.2-PLGA NBs (Figure 4C). Group IV showed almost no red DiI-labeled PTX-PLGA NBs within LNCaP cells, reflecting the absence of targeting to the A10-3.2 aptamer on the surface (Figure 4D). Group V showed almost no red DiI-labeled PLGA NBs within PC3 cells, reflecting the lack of PSMA expression by PC3 cells (Figure 4E). Moreover, FCM indicated that the binding efficiencies between NBs and the cells in groups I, II, III, IV, and V were 89.7%±5.66%, 40.6%±3.52%, 4.57%±0.82%, 2.87%±1.17%, and 4.83%±0.85%, respectively (Figure 4F). These in vitro results provide direct evidence of the high targeting efficiency between PTX-A10-3.2-PLGA NBs + US and PSMA-positive LNCaP cells.
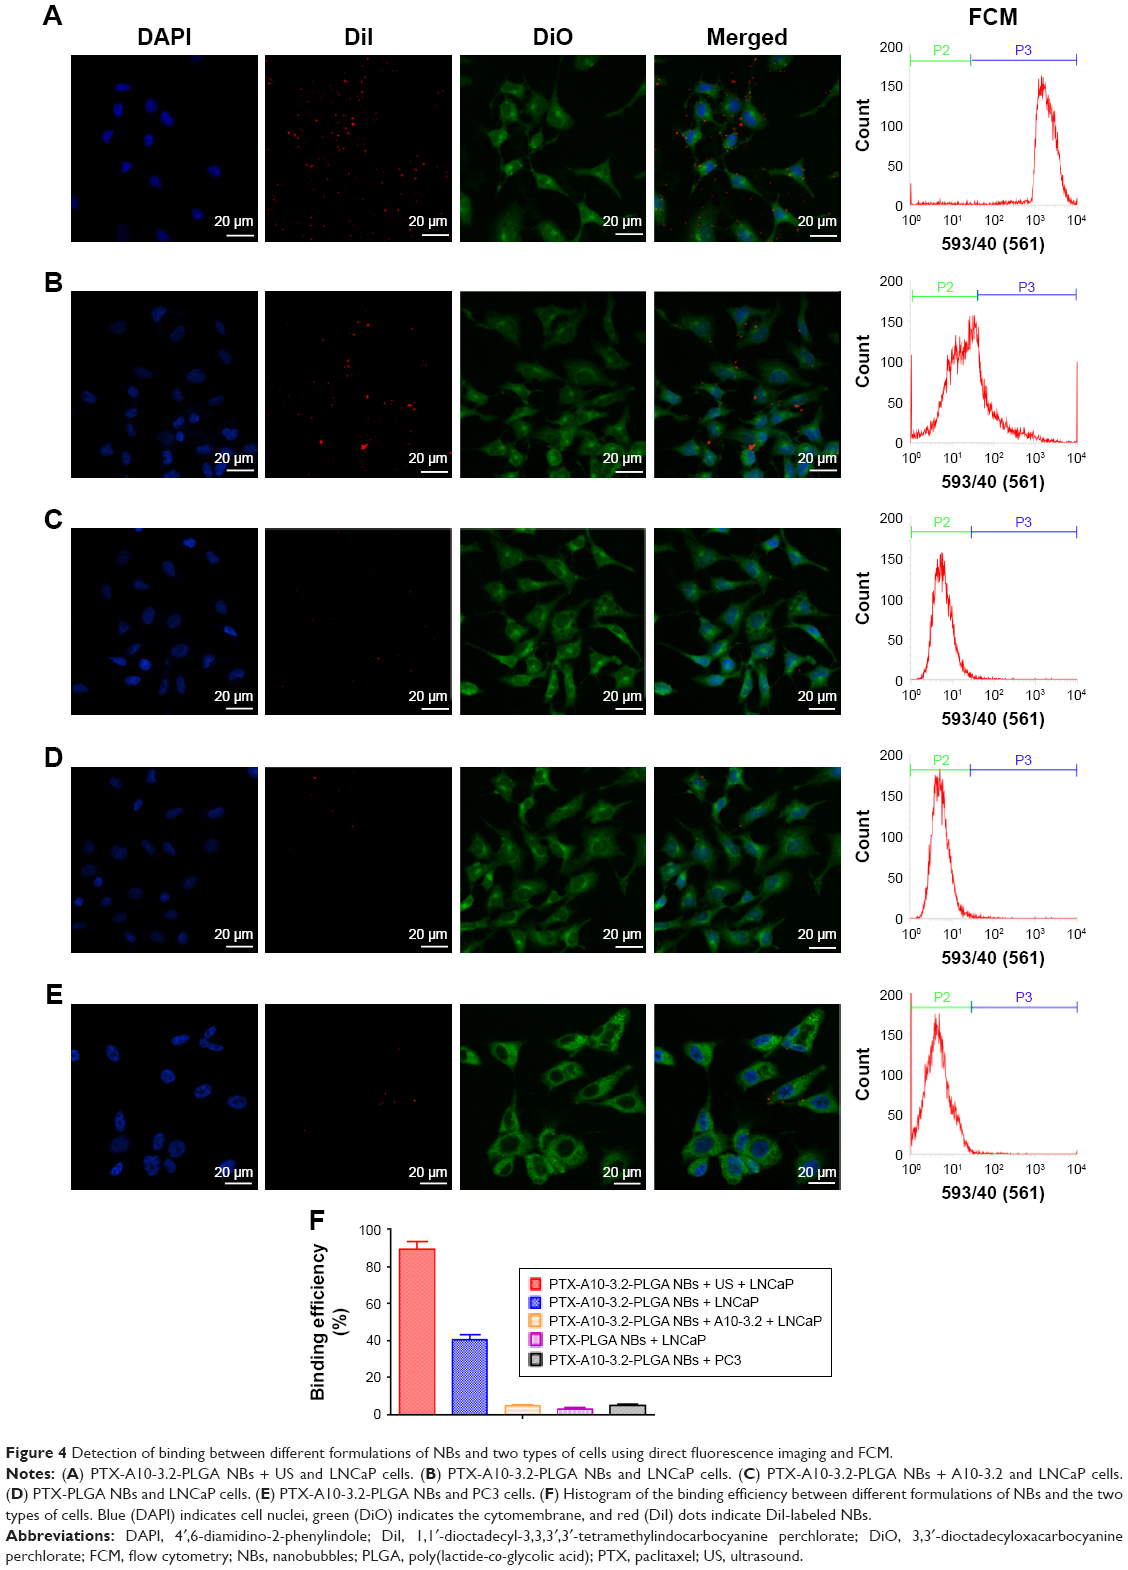 | Figure 4 Detection of binding between different formulations of NBs and two types of cells using direct fluorescence imaging and FCM. |
In vitro cell viability
The CCK-8 assay was used to determine the viability of LNCaP and PC3 cells after exposure to different NBs formulations.
Figure 5A shows that pure PLGA NBs exhibited no cytotoxicity; after LNCaP cells were incubated with different concentrations of PLGA NBs, the cell viability was 97.63%±1.86%, 97.60%±1.84%, 96.87%±2.11%, 94.23%±1.38%, 94.07%±1.39%, 92.75%±1.80%, 90.03%±4.08%, and 85.50%±3.47%. We observed over 85% cell viability, showing that the high MW polymer exhibited low, negligible toxicity. With increasing NB concentrations, the concentration of the PTX and aptamer also increased, and the cell viability of PTX-PLGA NBs and A10-3.2-PLGA NBs decreased in both groups. However, using the same concentration of NBs, the effect on cell viability of A10-3.2-PLGA NBs was higher than that in the PTX-PLGA NBs group. Compared with the other three groups, the cell viability in the PTX-A10-3.2-PLGA NBs group was the lowest, indicating that the aptamer enhanced the synergy of PTX and further increased cell toxicity.
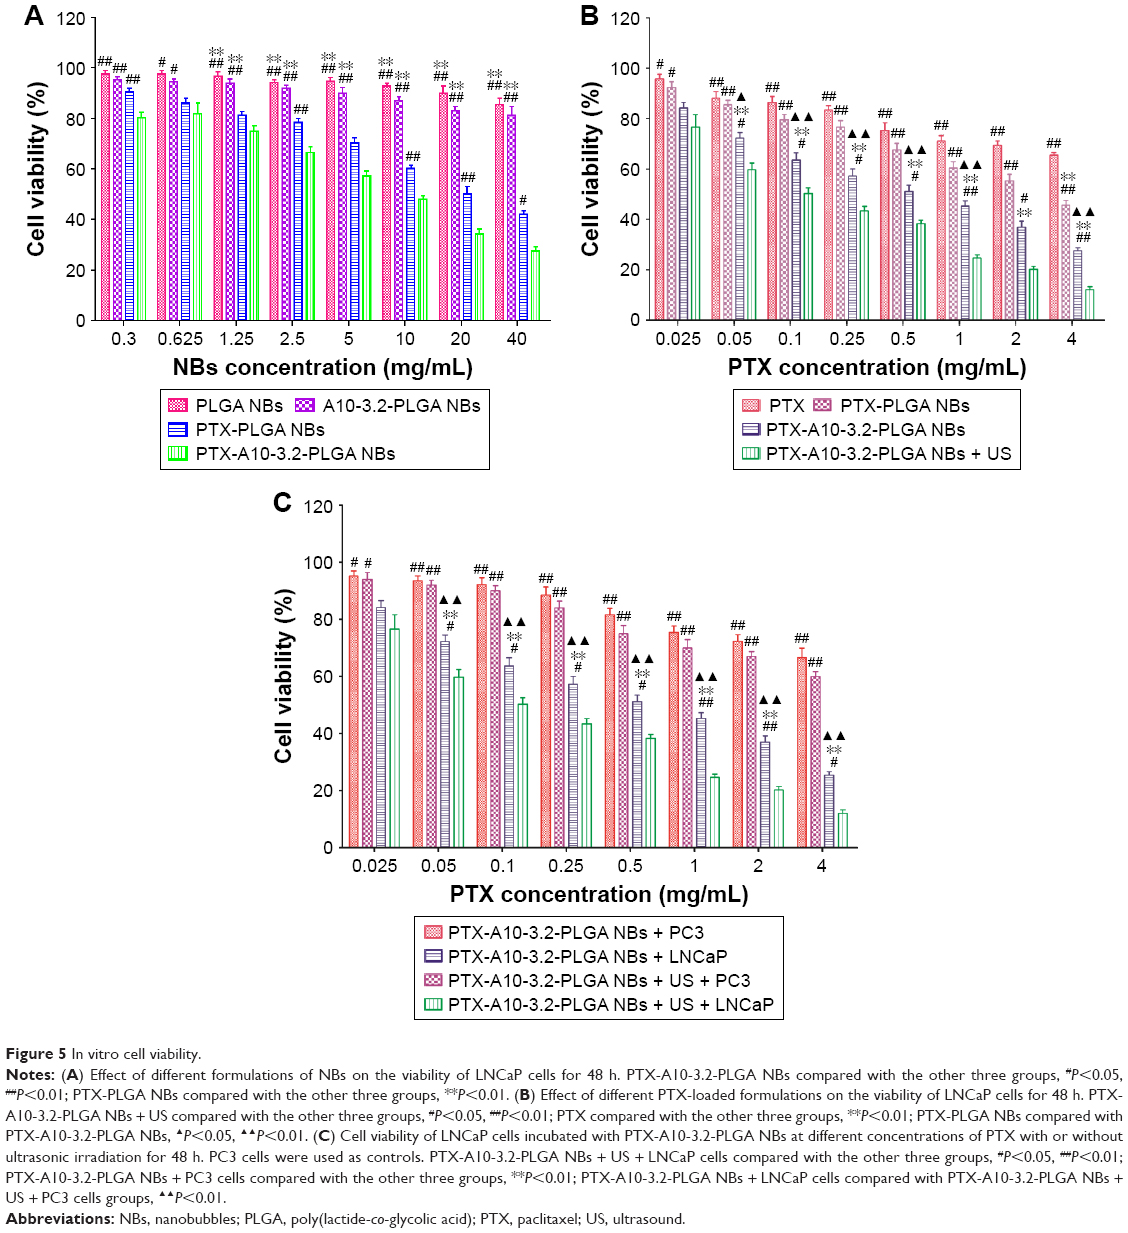 | Figure 5 In vitro cell viability. |
Figure 5B shows the viability after LNCaP cells were incubated with free PTX, PTX-PLGA NBs, PTX-A10-3.2-PLGA NBs, and PTX-A10-3.2-PLGA NBs + low-frequency US at the same concentrations of PTX. The results showed that with an increasing PTX concentration, cell viability was reduced, and the PTX-A10-3.2-PLGA NBs + US group exhibited the strongest toxic effect on the cells compared with that of the other three groups. Compared with the PTX, PTX-PLGA NBs and PTX-A10-3.2-PLGA NBs groups had low cell activity, but the toxic effect on the cells was high, suggesting that compared with free PTX, drug-loaded NBs have better therapeutic effects in vitro. As shown in Figure 5B, with increasing PTX concentration, the toxic effect of PTX-A10-3.2-PLGA NBs on LNCaP cells obviously increased. The 50% inhibition concentration (IC50) of PTX, namely the concentration required for 50% of cells to be inhibited, was 1 mg/mL. When PTX-A10-3.2-PLGA NBs and LNCaP cells were simultaneously incubated with ultrasonic irradiation, the cell viability was lower than that without irradiation, and the PTX concentration was 0.25 mg/mL, which meets the IC50.
Figure 5C indicates that with increasing PTX concentration, PTX-A10-3.2-PLGA NBs and PTX-A10-3.2-PLGA NBs + US exerted a slight influence on the viability of the PSMA-negative PC3 cells. Compared with PC3 cells, PSMA-positive LNCaP cells experienced significantly higher toxic effects in response to the PTX-A10-3.2-PLGA NBs. Compared with the PTX-A10-3.2-PLGA NBs group, LNCaP cells incubated with PTX-A10-3.2-PLGA NBs + US showed lower cell viability.
These data demonstrated that the targeting characteristics of NBs together with the supplementary physical dispersal by US considerably improved the inhibitory impact of PTX on PSMA-positive LNCaP cell growth.
Cell apoptosis analysis
After various formulations of PTX were added to LNCaP cells, an Annexin-V-FITC/PI double-staining assessment was used to evaluate cell apoptosis. The extents of early apoptosis (EA) and late apoptosis (LA) in addition to total apoptosis (TA) in several groups increased as follows: PTX < PTX-PLGA NBs < PTX-A10-3.2-PLGA NBs < PTX-A10-3.2-PLGA NBs + US (Figure 6A–D). The apoptosis at 48 h was considerably higher than that at 24 h for all groups for both LA and TA (Figure 6A–D). The effect of apoptosis by PTX-A10-3.2-PLGA NBs was considerably higher than that by PTX-PLGA NBs and was further improved through the application of low-frequency US. Considered collectively, these in-depth analyses of cellular targeted binding, cell apoptosis clearly demonstrated that PLGA NBs acted as outstanding carriers for PTX. Moreover, the A10-3.2 alteration on the surface of NBs enhanced the targeted binding and further improved the cellular uptake of PTX-A10-3.2-PLGA NBs.
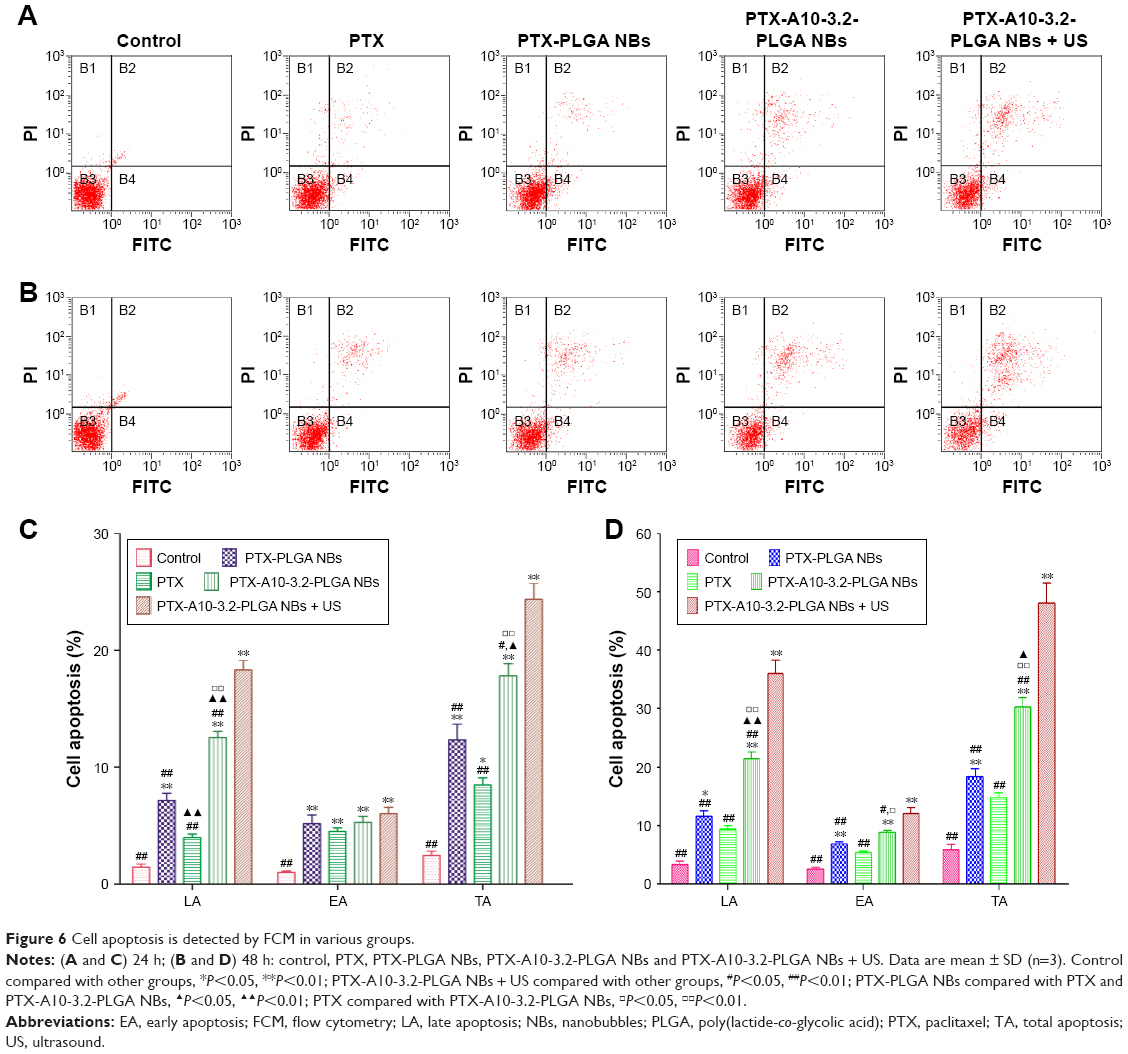 | Figure 6 Cell apoptosis is detected by FCM in various groups. |
In vitro and in vivo US imaging
Compared with the echo-free result with deionized water, the result from in vitro US imaging indicated a higher B mode mean gray value and the gradual enhancement of the contrast effect, which was accompanied by increasing concentration of NBs (Figure 7A and B).
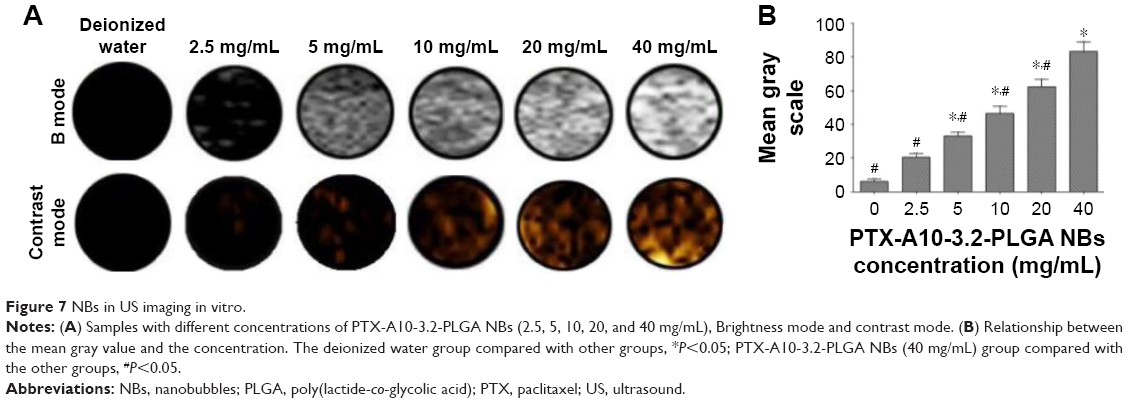 | Figure 7 NBs in US imaging in vitro. |
The contrast mode of the small animal high-frequency US imaging apparatus was used for real-time dynamic observations of tumor-bearing nude mice enhancement. The echo intensity of the normal saline control group and imaging before and after showed no significant change (Figure 8A), and the distribution of the few and scattered contrast agent echo signals was observed after PTX-PLGA NBs imaging (Figure 8A). PTX-A10-3.2-PLGA NBs showed a rich contrast agent echo signal distribution, and both the enhancement sustained time and contrast-enhanced US signal intensity. PTX-PLGA NBs were inferior compared with those PTX-A10-3.2-PLGA NBs in vivo (Figure 8A). For the PTX-PLGA NB group, peaking at approximately 15.4 dB. For PTX-A10-3.2-PLGA NBs, peaking at approximately 25 dB (Figure 8B). The imaging parameters examined before and after imaging the treatment groups revealed that compared with the saline control cohort, the PTX-PLGA NBs and PTX-A10-3.2-PLGA NBs had better imaging echo intensity, and compared with the PTX-PLGA NBs group, the PTX-A10-3.2-PLGA NBs group had a considerably higher GSI (P<0.05; Figure 8B). These results showed that the prepared NBs had the ability to specifically detect PSMA-expressing tumor cells.
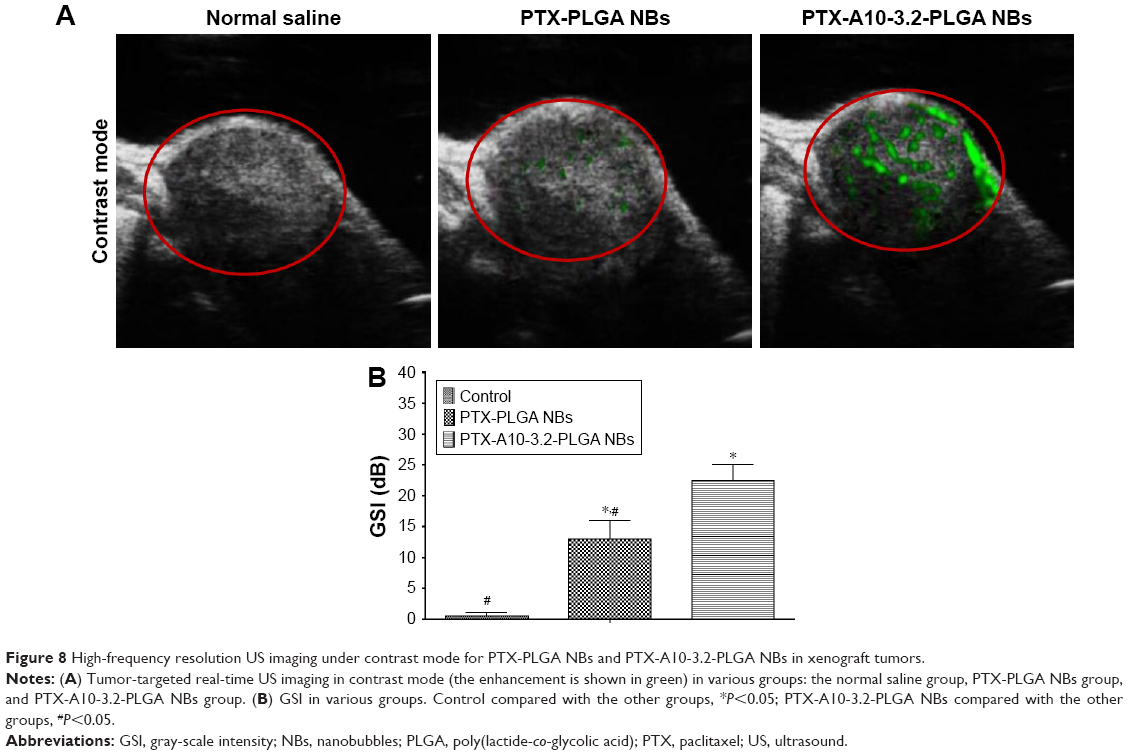 | Figure 8 High-frequency resolution US imaging under contrast mode for PTX-PLGA NBs and PTX-A10-3.2-PLGA NBs in xenograft tumors. |
In vivo fluorescence imaging in the xenograft tumors
The small live animal fluorescence imaging showed that more DiR-labeled PTX-A10-3.2-PLGA NBs aggregated in xenograft tumors and lasted for an extended time, while less DiR-labeled PTX-PLGA NBs aggregated or did not persist, showing a lower fluorescence intensity than PTX-A10-3.2-PLGA NBs (Figure 9). LCSM revealed that more red DiI-labeled PTX-A10-3.2-PLGA NBs aggregated in the tumor cryosections, while less DiI-labeled PTX-PLGA NBs aggregated in the tumor cryosections (Figure 10A and B). There was a statistically significant difference between them (P<0.001; Figure 10F). These findings highlighted the fact that targeted NBs could specifically detect PSMA-expressing tumors and accumulate in tumor tissues, thus providing more effective chemotherapy that can inhibit xenograft tumors. The fluorescence-intensity distribution in other organs in nude mice is also different, with the largest distribution in liver and the least distribution in kidney (Figure 10C–F).
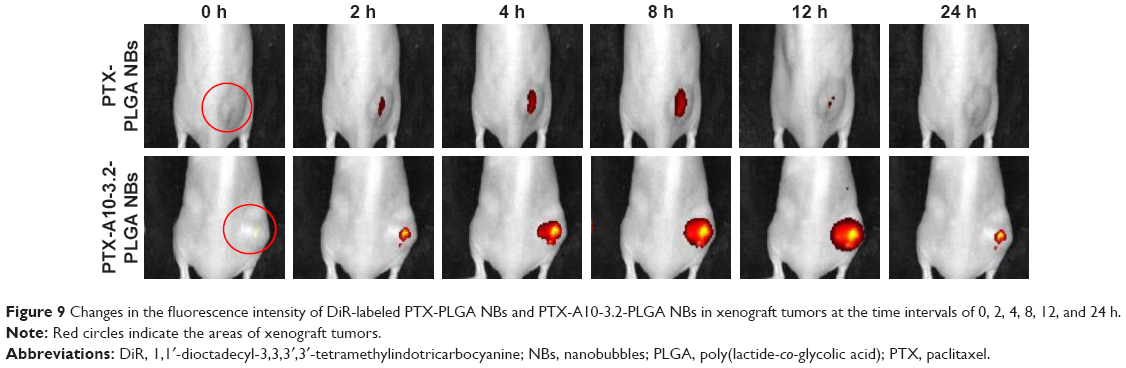 | Figure 9 Changes in the fluorescence intensity of DiR-labeled PTX-PLGA NBs and PTX-A10-3.2-PLGA NBs in xenograft tumors at the time intervals of 0, 2, 4, 8, 12, and 24 h. |
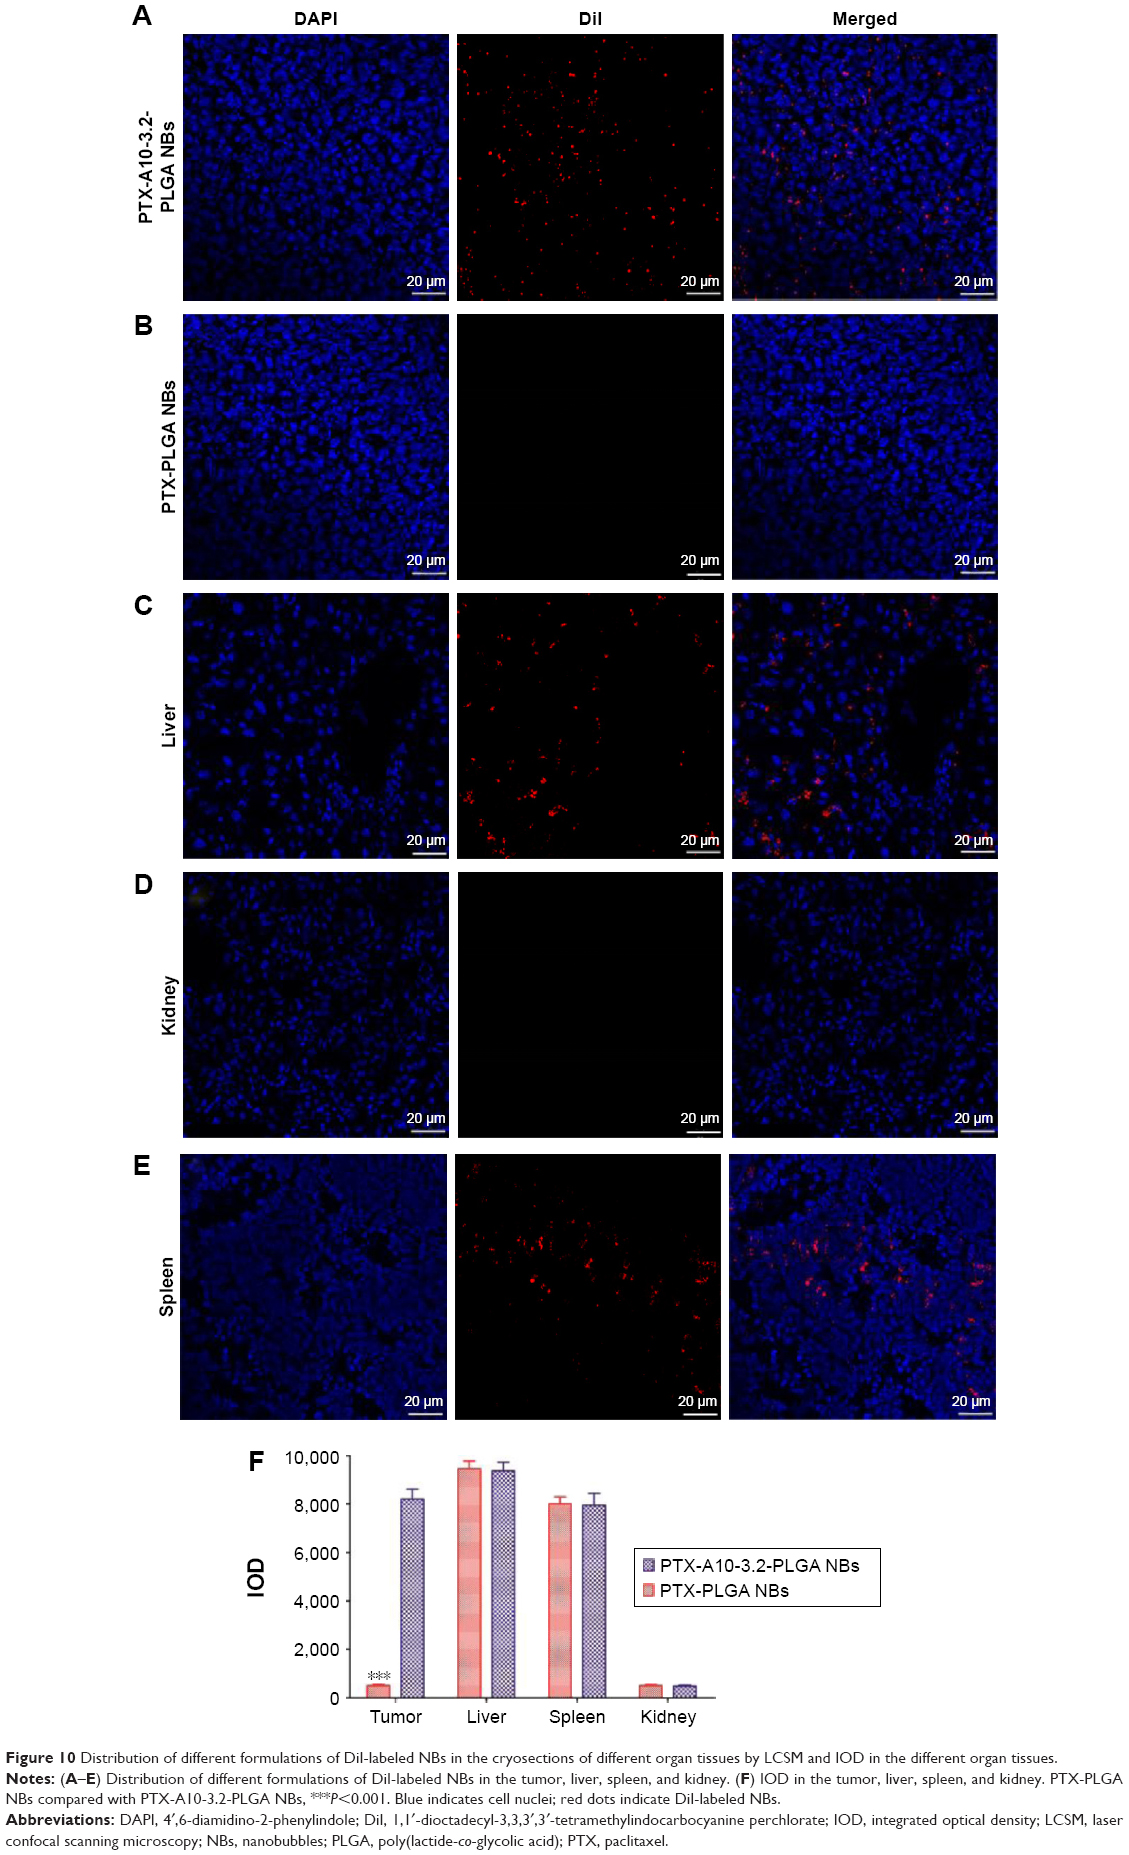 | Figure 10 Distribution of different formulations of DiI-labeled NBs in the cryosections of different organ tissues by LCSM and IOD in the different organ tissues. |
Therapeutic effect in xenograft tumors
Tumor growth curve and tumor inhibitory rate
LNCaP xenograft tumor growth curves for the nude mice in each treatment group are shown in Figure 11A. The control group had the steepest growth curve, followed by the PTX group and the PTX-PLGA NBs group. The PTX-A10-3.2-PLGA NBs group and the PTX-A10-3.2-PLGA NBs + US group had mild growth curves, showing a significant reduction in growth (Figure 11B). The tumor quantity and inhibitory rate in each treatment group are shown in Figure 11B and C, and the antitumor effect in the PTX-A10-3.2-PLGA NBs group was superior to that of the PTX-PLGA NBs and PTX groups (Figure 11C), demonstrating the targeted drug delivery of PTX-A10-3.2-PLGA NBs.
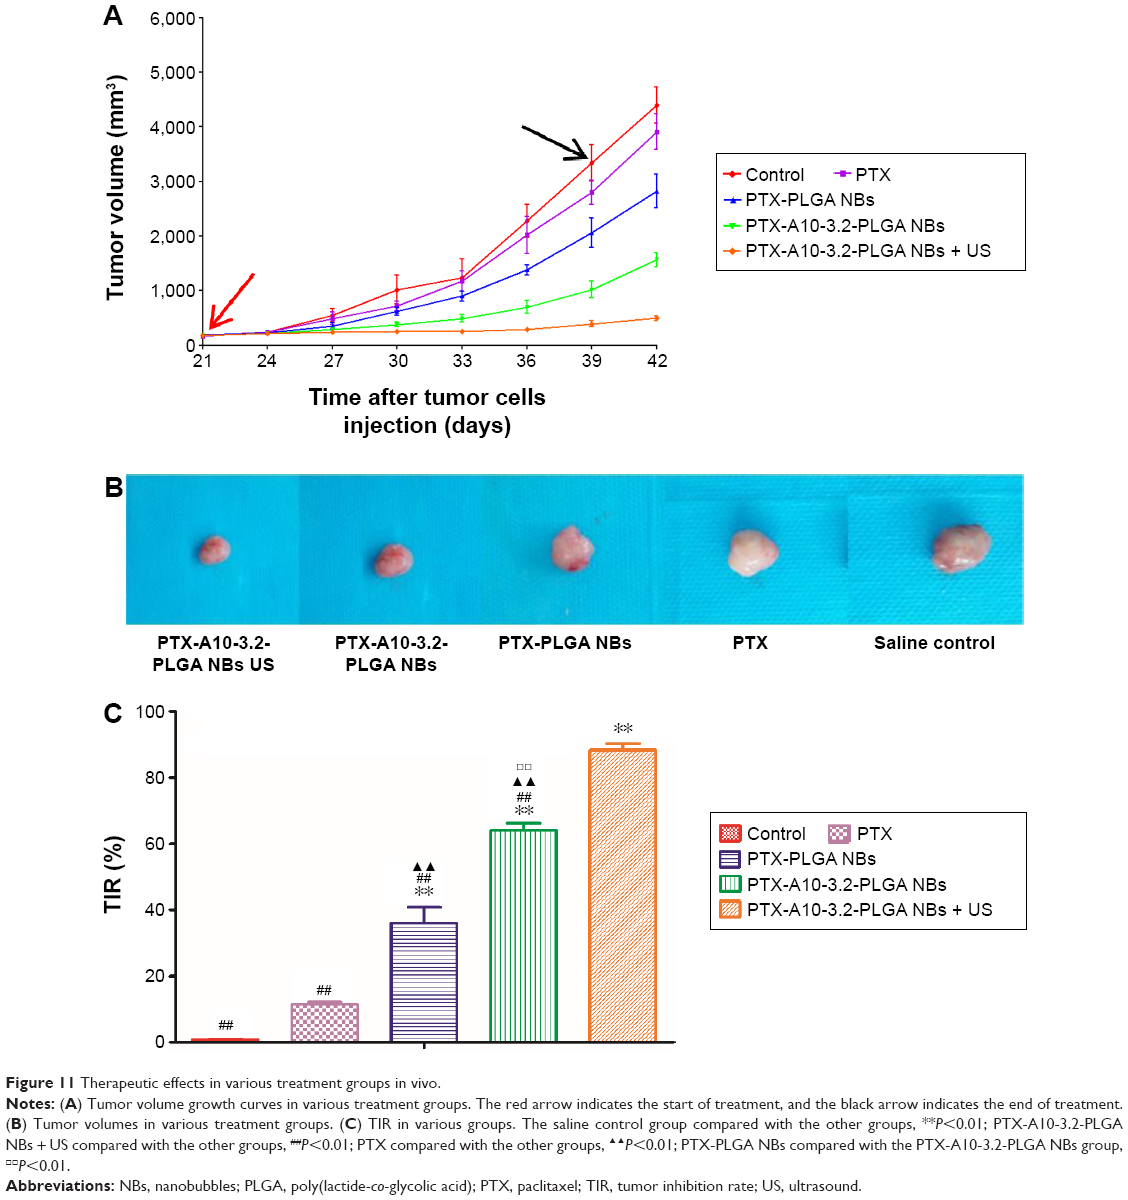 | Figure 11 Therapeutic effects in various treatment groups in vivo. |
When PTX-A10-3.2-PLGA NBs were applied simultaneously with US, a surprising augmentation in the therapeutic effectiveness was observed, leading to 88.34%±3.82% tumor inhibition (Figure 11C). Thus, the targeting properties of PTX-A10-3.2-PLGA NBs and the application of low-frequency US markedly enhanced the treatment of subcutaneous prostate cancer in nude mice.
Analysis of the survival and systemic toxicity
The median survival for all groups was analyzed using the Kaplan–Meier analysis, as shown in Figure 12A, and the results were saline control < PTX < PTX-PLGA NBs < PTX-A10-3.2-PLGA NBs < PTX-A10-3.2-PLGA NBs + US. On the 50th day following the tumor cell injection, all mice in the saline control group died, whereas 40%, 60%, 80%, and 90% of the mice survived in the PTX, PTX-PLGA NBs, PTX-A10-3.2-PLGA NBs, and PTX-A10-3.2-PLGA NBs + US groups, respectively (Figure 12A). Although all mice in the PTX-PLGA NBs group died, 30% of the mice in the PTX-A10-3.2-PLGA NBs group survived. All mice in the PTX-A10-3.2-PLGA NBs group died, but 50% of the mice in the PTX-A10-3.2-PLGA NBs + US group survived. The mouse that survived for the longest time remained alive for 90 days. These findings demonstrated that the targeting characteristics combined with the implementation of US had the potential to efficiently increase mouse survival. Nevertheless, no considerable difference was observed between the PTX and PTX-PLGA NBs groups, further indicating that the targeted delivery of PTX using PTX-A10-3.2-PLGA NBs could be applied for successful treatment.
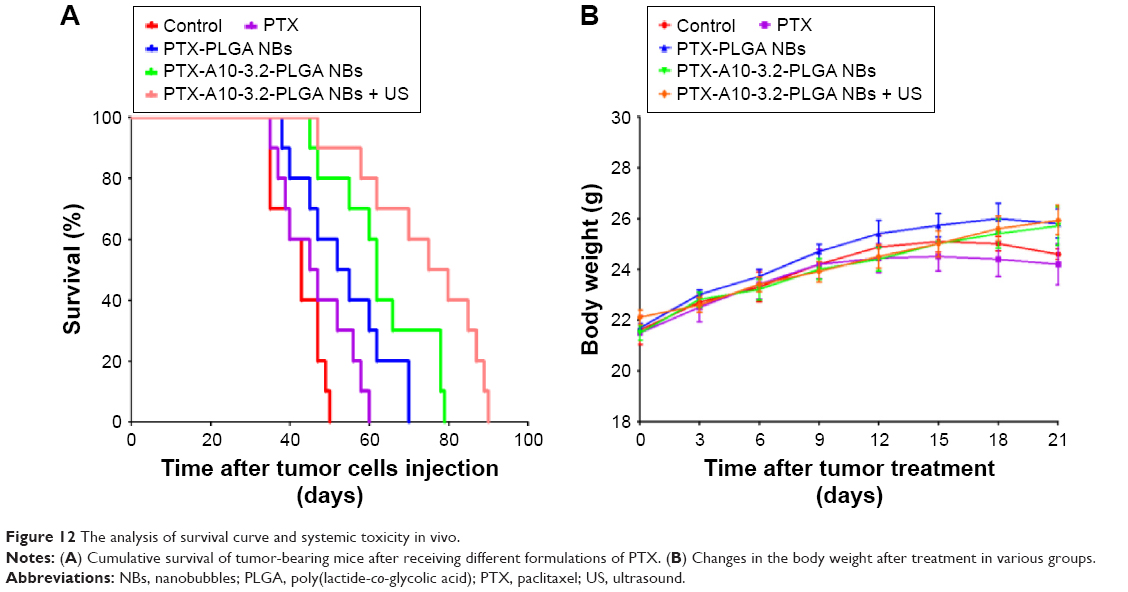 | Figure 12 The analysis of survival curve and systemic toxicity in vivo. |
To verify the impact of the several PTX formulations developed, on systemic toxicity, we evaluated the mouse weight every day after tumor cell injection. Figure 12B shows the recorded daily weight changes throughout the treatment. At no time during the treatment process was there a significant difference in the mouse weights among the various groups, revealing that the targeted NBs and US did not exhibit toxicity. However, the PTX-PLGA NBs group had the lowest ALT, the PTX-A10-3.2-PLGA NBs group had the lowest AST, and the PTX group had the highest AST and ALT. There was a statistically significant difference in the AST and ALT (Table 2).
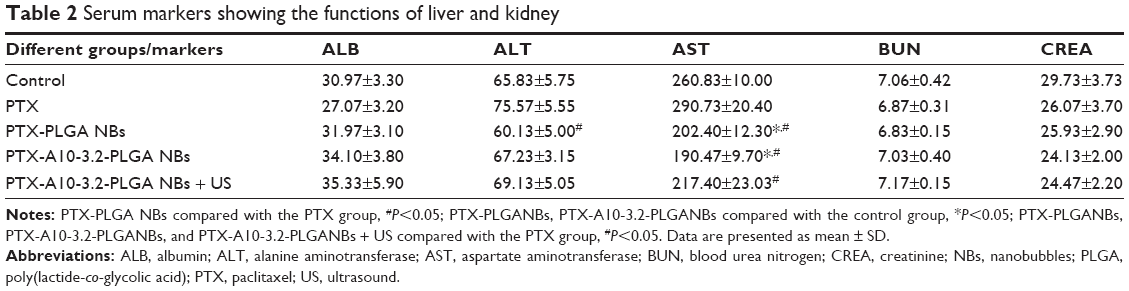 | Table 2 Serum markers showing the functions of liver and kidney |
These results clearly showed that NB-encapsulated PTX was less poisonous than free PTX. Thus, the PLGA NBs carrier reduced the side effects of PTX. In summary, PTX-A10-3.2-PLGA NBs combined with US represent an effective strategy for targeted PTX delivery to prostate cancer, without serious side effects.
Conclusion
The PTX-encapsulated A10-3.2-PLGA NBs could target and transmit PTX to both LNCaP cells in vitro and subcutaneous prostate tumors in BALB/c nude mice in vivo. Moreover, applying US significantly improved the cell targeting ability in vitro and introduced improvements in the efficacy of enhanced permeability and retention in vivo. The application of both US and targeted, drug-carrying NBs significantly improved the antitumor effect, which was associated with the transmission and distribution of NBs, in vitro as well as in vivo. Specifically, the combination of cells and PTX in subcutaneous tumors enhanced the treatment results.
The combination of PTX-A10-3.2-PLGA NBs and US markedly enhanced PTX release and cell apoptosis and reduced the IC50 in vitro. In vivo, the combined application of PTX-A10-3.2-PLGA NBs and US exhibited the highest TIR, prolonged survival, and showed no obvious toxicity.
In addition, PTX-A10-3.2-PLGA NBs could also be used as contrast agents, providing excellent contrast-enhanced US biological imaging in vitro and vivo. Overall, these data demonstrated that PTX-A10-3.2-PLGA NBs represent effective theranostic agents, and the application of these agents provides a strategy for imaging and chemotherapy in resistant human prostate cancers.
The combination of US irradiation and chemotherapy based on PTX-A10-3.2-PLGA NBs as the contrast agents for ultrasonography and drug carriers for anticancer drug transportation provides an appealing prospect for the development of nanomedicine and for noninvasive medical strategies, such as multifunctional particles for simultaneous targeted imaging, drug delivery, and the treatment of cancers and other diseases.
Acknowledgment
This study was financially supported by grants from the National Natural Science Foundation of China (Nos 81471682, 81327003, 81501498, and 81571688).
Disclosure
The authors report no conflicts of interest in this work.
References
Sun Y, Zheng Y, Ran H, et al. Superparamagnetic PLGA-iron oxide microcapsules for dual-modality US/MR imaging and high intensity focused US breast cancer ablation. Biomaterials. 2012;33(24):5854–5864. | ||
Chen T, Shukoor MI, Wang R, et al. Smart multifunctional nanostructure for targeted cancer chemotherapy and magnetic resonance imaging. ACS Nano. 2011;5(10):7866–7873. | ||
Koo OM, Rubinstein I, Onyuksel H. Role of nanotechnology in targeted drug delivery and imaging: a concise review. Nanomedicine. 2005;1(3):193–212. | ||
Aravind A, Nair R, Raveendran S, et al. Aptamer conjugated paclitaxel and magnetic fluid loaded fluorescently tagged PLGA nanoparticles for targeted cancer therapy. J Magn Magn Mater. 2013;344(344):116–123. | ||
Yang H, Deng L, Li T, et al. Multifunctional PLGA nanobubbles as theranostic agents: combining doxorubicin and P-gp siRNA co-delivery into human breast cancer cells and ultrasound cellular imaging. J Biomed Nanotechnol. 2015;11(12):2124–2136. | ||
Deng L, Li L, Yang H, et al. Development and optimization of doxorubicin loaded poly(lactic-co-glycolic acid) nanobubbles for drug delivery into HeLa cells. J Nanosci Nanotechnol. 2014;14(4):2947–2954. | ||
Yang H, Li K, Liu Y, Liu Z, Miyoshi H. Poly(D,L-lactide-co-glycolide) nanoparticles encapsulated fluorescent isothiocyanate and paclitaxol: preparation, release kinetics and anticancer effect. J Nanosci Nanotechnol. 2009;9(1):282–287. | ||
Ma J, Shen M, Xu CS, Sun Y, Duan YR, Du LF. Biodegradable double-targeted PTX-mPEG-PLGA nanoparticles for ultrasound contrast enhanced imaging and antitumor therapy in vitro. Oncotarget. 2016;7(48):80008–80018. | ||
Kim C, Qin R, Xu JS, Wang LV, Xu R. Multifunctional microbubbles and nanobubbles for photoacoustic and ultrasound imaging. J Biomed Opt. 2010;15(1):010510. | ||
Makadia HK, Siegel SJ. Poly lactic-co-glycolic acid (PLGA) as biodegradable controlled drug delivery carrier. Polymers (Basel). 2011;3(3):1377–1397. | ||
Zhang X, Zheng Y, Wang Z, et al. Methotrexate-loaded PLGA nanobubbles for ultrasound imaging and synergistic targeted therapy of residual tumor during HIFU ablation. Biomaterials. 2014;35(19):5148–5161. | ||
Rapoport N, Gao Z, Kennedy A. Multifunctional nanoparticles for combining ultrasonic tumor imaging and targeted chemotherapy. J Natl Cancer Inst. 2007;99(14):1095–1106. | ||
Santra S, Kaittanis C, Santiesteban OJ, Perez JM. Cell-specific, activatable, and theranostic prodrug for dual-targeted cancer imaging and therapy. J Am Chem Soc. 2011;133(41):16680–16688. | ||
Fan Z, Fu PP, Yu H, Ray PC. Theranostic nanomedicine for cancer detection and treatment. J Food Drug Anal. 2014;22(1):3–17. | ||
Cabral H, Nishiyama N, Kataoka K. Supramolecular nanodevices: from design validation to theranostic nanomedicine. Acc Chem Res. 2011;44(10):999–1008. | ||
Kelkar SS, Reineke TM. Theranostics: combining imaging and therapy. Bioconjug Chem. 2011;22(10):1879–1903. | ||
Sun T, Zhang YS, Pang B, Hyun DC, Yang M, Xia Y. Engineered nanoparticles for drug delivery in cancer therapy. Angew Chem Int Ed Engl. 2014;53(46):12320–12364. | ||
Du JZ, Mao CQ, Yuan YY, Yang XZ, Wang J. Tumor extracellular acidity-activated nanoparticles as drug delivery systems for enhanced cancer therapy. Biotechnol Adv. 2014;32(4):789–803. | ||
Muthu MS, Leong DT, Mei L, Feng SS. Nanotheranostics – application and further development of nanomedicine strategies for advanced theranostics. Theranostics. 2014;4(6):660–677. | ||
Yang T, Zhao P, Rong Z, et al. Anti-tumor efficiency of lipid-coated cisplatin nanoparticles co-loaded with microRNA-375. Theranostics. 2016;6(1):142–154. | ||
Hong CA, Nam YS. Functional nanostructures for effective delivery of small interfering RNA therapeutics. Theranostics. 2014;4(12):1211–1232. | ||
Cho HS, Dong Z, Pauletti GM, et al. Fluorescent, superparamagnetic nanospheres for drug storage, targeting, and imaging: a multifunctional nanocarrier system for cancer diagnosis and treatment. ACS Nano. 2010;4(9):5398–5404. | ||
Dunne M, Corrigan I, Ramtoola Z. Influence of particle size and dissolution conditions on the degradation properties of polylactide-co-glycolide particles. Biomaterials. 2000;21(16):1659–1668. | ||
Grayson AC, Cima MJ, Langer R. Size and temperature effects on poly(lactic-co-glycolic acid) degradation and microreservoir device performance. Biomaterials. 2005;26(14):2137–2145. | ||
Aravind A, Varghese SH, Veeranarayanan S, et al. Aptamer-labeled PLGA nanoparticles for targeting cancer cells. Cancer Nanotechnol. 2012;3(1–6):1–12. | ||
Koziara JM, Lockman PR, Allen DD, Mumper RJ. Paclitaxel nanoparticles for the potential treatment of brain tumors. J Control Release. 2004;99(2):259–269. | ||
Liang HF, Chen CT, Chen SC, et al. Paclitaxel-loaded poly(gamma-glutamic acid)-poly(lactide) nanoparticles as a targeted drug delivery system for the treatment of liver cancer. Biomaterials. 2006;27(9):2051–2059. | ||
Faulhammer D, Eschgfaller B, Stark S, et al. Biostable aptamers with antagonistic properties to the neuropeptide nociceptin/orphanin FQ. RNA. 2004;10(3):516–527. | ||
Jeong S, Lee HK, Kim MY. Use of RNA aptamers for the modulation of cancer cell signaling. Methods Mol Biol. 2009;542:363–377. | ||
Huang Z, Pei W, Jayaseelan S, Shi H, Niu L. RNA aptamers selected against the GluR2 glutamate receptor channel. Biochemistry. 2007;46(44):12648–12655. | ||
Fan X, Guo Y, Wang L, Xiong X, Zhu L, Fang K. Diagnosis of prostate cancer using anti-PSMA aptamer A10-3.2-oriented lipid nanobubbles. Int J Nanomedicine. 2016;11:3939–3950. | ||
Farokhzad OC, Jon S, Khademhosseini A, Tran TN, Lavan DA, Langer R. Nanoparticle-aptamer bioconjugates: a new approach for targeting prostate cancer cells. Cancer Res. 2004;64(21):7668–7672. | ||
Ristau BT, O’Keefe DS, Bacich DJ. The prostate-specific membrane antigen: lessons and current clinical implications from 20 years of research. Urol Oncol. 2014;32(3):272–279. | ||
Lupold SE, Hicke BJ, Lin Y, Coffey DS. Identification and characterization of nuclease-stabilized RNA molecules that bind human prostate cancer cells via the prostate-specific membrane antigen. Cancer Res. 2002;62(14):4029–4033. | ||
Wang CH, Kang ST, Lee YH, Luo YL, Huang YF, Yeh CK. Aptamer-conjugated and drug-loaded acoustic droplets for ultrasound theranosis. Biomaterials. 2012;33(6):1939–1947. | ||
Xing L, Shi Q, Zheng K, et al. Ultrasound-mediated microbubble destruction (UMMD) facilitates the delivery of CA19-9 targeted and paclitaxel loaded mPEG-PLGA-PLL nanoparticles in pancreatic cancer. Theranostics. 2016;6(10):1573–1587. | ||
Wang Y, Liu P, Qiu L, et al. Toxicity and therapy of cisplatin-loaded EGF modified mPEG-PLGA-PLL nanoparticles for SKOV3 cancer in mice. Biomaterials. 2013;34(16):4068–4077. | ||
Liu P, Qin L, Wang Q, et al. cRGD-functionalized mPEG-PLGA-PLL nanoparticles for imaging and therapy of breast cancer. Biomaterials. 2012;33(28):6739–6747. | ||
Yin P, Wang Y, Qiu Y, et al. Bufalin-loaded mPEG-PLGA-PLL-cRGD nanoparticles: preparation, cellular uptake, tissue distribution, and anticancer activity. Int J Nanomedicine. 2012;7:3961–3969. | ||
Wang H, Zhao Y, Wu Y, et al. Enhanced anti-tumor efficacy by co-delivery of doxorubicin and paclitaxel with amphiphilic methoxy PEG-PLGA copolymer nanoparticles. Biomaterials. 2011;32(32):8281–8290. |
 © 2017 The Author(s). This work is published and licensed by Dove Medical Press Limited. The
full terms of this license are available at https://www.dovepress.com/terms
and incorporate the Creative Commons Attribution
- Non Commercial (unported, 3.0) License.
By accessing the work you hereby accept the Terms. Non-commercial uses of the work are permitted
without any further permission from Dove Medical Press Limited, provided the work is properly
attributed. For permission for commercial use of this work, please see paragraphs 4.2 and 5 of our Terms.
© 2017 The Author(s). This work is published and licensed by Dove Medical Press Limited. The
full terms of this license are available at https://www.dovepress.com/terms
and incorporate the Creative Commons Attribution
- Non Commercial (unported, 3.0) License.
By accessing the work you hereby accept the Terms. Non-commercial uses of the work are permitted
without any further permission from Dove Medical Press Limited, provided the work is properly
attributed. For permission for commercial use of this work, please see paragraphs 4.2 and 5 of our Terms.