")
Back to Journals » Breast Cancer: Targets and Therapy » Volume 14
Ovo Like Zinc Finger 2 (OVOL2) Suppresses Breast Cancer Stem Cell Traits and Correlates with Immune Cells Infiltration
Received 24 February 2022
Accepted for publication 5 August 2022
Published 15 August 2022 Volume 2022:14 Pages 211—227
DOI https://doi.org/10.2147/BCTT.S363114
Checked for plagiarism Yes
Review by Single anonymous peer review
Peer reviewer comments 2
Editor who approved publication: Professor Pranela Rameshwar
Jiafa Wu,1 Dongping Luo,2 Shengnan Li3
1School of Food and Bioengineering, Henan University of Science and Technology, Luoyang, People’s Republic of China; 2The First Affiliated Hospital, Henan University of Science and Technology, Luoyang, People’s Republic of China; 3School of Medicine, Henan Polytechnic University, Jiaozuo, People’s Republic of China
Correspondence: Jiafa Wu, School of Food and Bioengineering, Henan University of Science and Technology, Kaiyuan Avenue 263, Luoyang, People’s Republic of China, Email [email protected]
Background: Breast cancer stem cells (BCSCs) are associated with tumor initiation, invasion, metastasis and drug resistance. It is known that many proteins and signaling pathways are involved in the regulation of BCSCs, however, much more efforts are needed to understand BCSCs comprehensively. Tumor-infiltrating immune cells are important in cancer treatment efficacy and patient prognosis. We tried to identify potential suppressor of BCSCs and analyze its correlation with various immune cells infiltration by bioinformatic and experimental methods.
Methods: Expression level and methylation state of OVOL2 were analyzed by tools from bc-GenExMiner v4.8 and UALCAN databases. The Kaplan–Meier plotter was applied to evaluate the prognostic values of OVOL2. Gene expression datasets (GSE7515, GSE15192) were selected to analyze differentially expressed genes (DEGs) related to BCSCs. GO and KEGG pathway analyses of DEGs were conducted. MCODE app plugin of Cytoscape was used to screen modules in PPI network of downregulated DEGs. Correlation of OVOL2 expression with infiltrating immune cells was evaluated by TIMER 2.0. Experiments were conducted to verify whether OVOL2 could inhibit stemness traits of breast cancer cell MDA-MB-231.
Results: The expression level of OVOL2 in basal/TNBC was significantly lower than that of other subtypes. Survival analyses indicated that high expression of OVOL2 was associated with favorable prognosis. GO and KEGG pathway analyses for upregulated and downregulated DEGs were conducted. The top three clusters of downregulated DEGs showed that tight junction and chemokines may play important roles in BCSCs. OVOL2 is one module of clusters. OVOL2 expression is correlated with various immune cells infiltration. Experiments showed that OVOL2 suppresses CD44+/CD24− ratio and mammospheres formation of MDA-MB-231.
Conclusion: OVOL2 may play an important role in the regulation of breast cancer stemness and immune cell infiltration, and is likely to be a target for the treatment of breast cancer.
Keywords: OVOL2, gene ontology, KEGG pathway, BCSCs, immune cell infiltration
Introduction
Breast cancer (BC) is the most common cancer in women worldwide, contributing 11.6% of new cases and 6.6% deaths in 2018.1 In the past few decades, although the treatment of BC has made great progress, the recurrence rate is still about 40% and metastasis ratio is up to 60%~70% in the patients with recurrence. Therefore, recurrence and metastasis are obstacles to complete cure of BC.2
Studies have shown that BC recurrence and metastasis are closely related to BCSCs. BCSCs refer to a small number of BC cells with slow differentiation, strong tumorigenic ability, self-renewal ability and certain differentiation potential similar to stem cells.3 BCSCs are resistant to chemotherapy/radiation. Conventional treatment can only eliminate non-tumorigenic tumor cells in the proliferating stage, so the drug-resistant tumor stem cells can re-proliferate to form the tumor and spread everywhere when the treatment is stopped. If we can remove the root of tumor (tumor stem cells), then the disease will be completely cured.3,4
In 2003, Al-Hajj et al successfully isolated CD44+/CD24−/low tumor stem cells from human BC for the first time. They found that the cells of this phenotype were highly tumorigenic, and 200 CD44+/CD2−/low cells transplanted into NOD/SCID mice could generate tumors, and the newly generated tumors included tumorigenic and non-tumorigenic cells, and the expression patterns of CD44 and CD24 were heterogeneous. Unscreened cells require transplantation of 50,000 cells to produce a tumor.5 In addition, ALDH, ABCG2, CD10, CD29, CD49f, CD133, CXCR4 and other markers can also be used to screen BCSCs.6
The mammosphere assay was developed as a method to propagate mammary epithelial stem cells (MaSC) in vitro by Dontu et al.7 The assay is based on the premise that only undifferentiated cells derived from the mammary epithelium will survive in suspension culture with all the other cell types dying by anoikis. Studies have shown that mammary gland stem/progenitor cells can be propagated through mammosphere culture, which can enrich CD44+/CD2−/low cells, so the ability to form mammosphere is a characteristic of cancer stem cells.8,9
Recent studies have shown that chemotherapy sensitivity and prognosis are largely dependent on the interaction of cancer cells with different components of the tumor microenvironment (TME), especially with tumor⁃infiltrating immune cells (TICs).10,11 In ER-negative tumors, the presence of CD8+ T cells and activated memory T cells was associated with a reduction in the risk of relapse, while tumors with high proportions of T follicular helper cells were more likely to respond to neoadjuvant chemotherapy. T regulatory cells were associated with poor prognosis in both ER-positive and ER-negative tumors.12 Therefore, it is important to study the correlation between TICs and neoadjuvant chemotherapy (NACT) in BC, to identify predictors of chemotherapy sensitivity, and to develop drugs to reverse chemoresistance by targeting such factors, in order to guide the use of chemotherapy and improve the efficiency of chemotherapy.
The OVO gene encodes a family of proteins that have evolved conservatively from fruit flies, nematodes and zebrafish to mammals. The protein family consists of transcription factors containing C2H2 zinc finger.13,14 There are three OVO homologous genes (OVOL1, OVOL2 and OVOL3) in human. OVOL2 plays an important role in organ development of fruit fly and mice.15–17 OVOL2 could reduce invasive activities of colorectal tumors by inhibiting Wnt Signaling.18 We also found that OVOL2 inhibited BC metastasis by inhibiting TGFβ signaling.19 Several studies showed that OVOL2 could block EMT by suppressing ZEB1, which in turn could inhibit OVOL2.20–23 In lung adenocarcinoma, OVOL2 inhibits EMT by transcriptionally repressing Twist1.24
In this paper, two GEO datasets (GSE7515, GSE15192) were analyzed to find potential “stemness” suppressor in BCSCs.25,26 Analyses showed that OVOL2 is significantly downregulated in BCSCs-enrichment populations, which implied that OVOL2 may play a role in BCSCs. Promoter of OVOL2 is highly methylated in basal BC, which may account for its low expression level in basal/TNBC. OVOL2 expression was correlated with immune cells infiltration. Experiments showed that OVOL2 was downregulated in mammospheres of MDA-MB-231. OVOL2 overexpression can inhibit CSCs properties of MDA-MB-231. OVOL2 could suppress CD44+/CD24− ratio and formation of mammospheres of MDA-MB-231. The on-line Kaplan–Meier plotter platform was used to investigate the prognostic values of OVOL2. The results of overall survival (OS), relapse-free survival (RFS), distant metastasis free survival (DMFS) and post progression survival (PPS) analyses indicated that high expression of OVOL2 was associated with favorable prognosis. Especially, the probability of RFS and PPS is significantly increased in OVOL2 high expression patients (P=1.1e-6 and P=0.0036).
Materials and Methods
Data Source
The gene expression datasets (GSE7515, GSE15192) analyzed in this study were obtained from the GEO database (https://www.ncbi.nlm.nih.gov/geo/). GSE7515 and GSE15192 were based on platform GPL570 (HG-U133_Plus_2, Affymetrix Human Genome U133 Plus 2.0 Array). GSE7515 included 15 mammospheres and 11 primary BC samples. GSE15192 included CD44+/CD24− and CD44−/CD24+ samples with 4 replicates respectively. OVOL2 expression in different cancers was acquired through the DiffExp module of the TIMER 2.0 database (https://timer.cistrome.org/),27 which was also adopted to analyze correlation between OVOL2 expression and immune infiltration. OVOL2 expression in basal/TNBC subtype was analyzed by bc-GenExMiner v4.8 (http://bcgenex.ico.unicancer.fr/BC-GEM/GEM-Accueil.php?js=1).28 Methylation of OVOL2 promoter was analyzed by methylation module of UALCAN databases (http://ualcan.path.uab.edu).29 The analyses of correlation between OVOL2 and BCSCs markers were conducted by LinkedOmics (http://www.linkedomics.org/login.php).30
Data Processing of DEGs
The GEO2R online analysis tool (https://www.ncbi.nlm.nih.gov/geo/geo2r/) was used to detect the DEGs between BCSCs-enriched populations (mammospheres, CD44+/CD24−) and control populations (primary cancer, CD44−/CD24+), and the adjusted P-value and |logFC| were calculated. Genes that met the cutoff criteria (adjusted P-value <0.05 and |logFC|≥2) were considered as DEGs. Statistical analysis was carried out for each dataset, and the intersecting part was identified using the Venn diagram webtool (http://bioinformatics.psb.ugent.be/webtools/Venn/).
GO and KEGG Pathway Analysis of DEGs
GO annotation analysis is a common useful method for large scale functional enrichment research; gene functions can be classified into biological process (BP), molecular function (MF), and cellular component (CC). KEGG is a widely used database which stores a lot of data about genomes, biological pathways, diseases, chemical substances, and drugs. GO annotation analysis and KEGG pathway enrichment analysis of DEGs in this study were performed by Enrichr (http://amp.pharm.mssm.edu/Enrichr/).31,32
Construction PPI Network and Screening of Modules
STRING database (http://string-db.org/) is designed to analyze the PPI information. To evaluate the potential PPI relationship, the DEGs were mapped to the STRING database. The PPI pairs were extracted with a combined score>0.4. Subsequently, the PPI network was visualized by Cytoscape software (www.cytoscape.org/). MCODE, an app plugin in cytoscape, was used to screen important modules with the following standard: include loops, degree cutoff = 3, node score cutoff= 0.2, k-core = 2, and max. depth = 100.
Survival Analysis
The Kaplan–Meier plotter (http://kmplot.com/analysis/) is an online tool applied to assess the effect of 54,675 genes on survival using 10,461 cancer samples (5143 breast, 1816 ovarian, 2437 lung, and 1065 gastric cancer). BC mRNA of the Kaplan–Meier plotter database was applied to evaluate the prognostic values of OVOL2 in BC patients. The patients were split by “Auto select best cutoff”. Probes (Affy ID: 211778_s_at, OVOL2) was selected. OS (overall survival), RFS (relapse-free survival) DMFS (distant metastasis free survival) and PPS (post progression survival) were analyzed respectively. p<0.05 was considered as a statistically significant.33
Cell Culture
BC cell line MDA-MB-231 was obtained from ATCC (American Type Culture Collection, Manassas, VA, USA) and was cultured in DMEM media containing 10% fetal bovine serum supplemented with 100 units/mL of penicillin and 100 μg/mL of streptomycin and incubated at 37°C in a humidified atmosphere of 5% CO2. MDA-MB-231 was recently authenticated and tested without contamination.
Mammosphere Culture
Cells (1×10⁴ cells/mL) were cultured in ultra-low attachment plates in serum-free DMEM/F12 (Invitrogen) supplemented with B-27 (1:50; Invitrogen), 20 ng/mL epidermal growth factor (EGF; BD Biosciences), 20 ng/mL basic fibroblast growth factor (bFGF; BD Biosciences) and 4 mg/mL insulin (Sigma), and fed every 3 days.34
Lentivirus Generation and Infection
Human OVOL2 cDNA was cloned under the control of the EF-1α promoter in the lentiviral vector pLV-CS2.0. Lentivirus was generated by co-transfecting pLV-CS2.0-OVOL2 or control vector with helper plasmids pVSV-G and pHR into HEK293T cells using Lipofectamine 2000 (Invitrogen). The viral supernatant was collected 48h after transfection. Cells at 50% to 70% confluence were infected with viral supernatants containing 10 μg/mL Polybrene for 24 h, after which fresh medium was added to the infected cells.
RNA Extraction and Real-Time PCR
Total RNA was isolated by TRIzol® Reagent (Invitrogen, Carlsbad, CA, USA). 2.0 μg of total RNA was used to reverse transcribe cDNA using the HiFi-MMLV cDNA Kit (Cwbio, Beijing, China). Real-time PCR was performed using the SYBR Green qPCR SuperMix (Invitrogen, Carlsbad, CA, USA) in the CFX96 Real Time System. All real-time PCR assays were performed in technical triplicate and in at least three independent experiments. In addition, all mRNA quantification data were normalized to the house-keeping gene. The sequences of specific primers are described in Table S1.
FACS Analysis
Confluent cells were trypsinized into single-cell suspensions and washed with fluorescence-activated cell sorting (FACS) buffer (2% foetal bovine serum in PBS), counted, and stained with fluorophore-conjugated antibodies (BD Biosciences). A total of 106cells were incubated with antibodies for 30 minutes at 4°C. Unbound antibodies were washed off, and the cells were sorted using a Beckman EPICS XL instrument and analyzed by FlowJo X 10.0.7 software.
Statistical Analysis
Quantitative data is presented as mean ± s.d., analysed and graphed by GraphPad Prism 6.0. Student’s t-test was performed to analyse data between two groups. P values and sample sizes are listed in the figure legends.
Results
High Expression of OVOL2 in BC Patients is Correlated with Better Prognosis
Compared with normal tissue, OVOL2 is highly expressed in most tumors (Figure S1). The on-line Kaplan–Meier plotter platform was used to investigate the prognostic values of OVOL2. 1402 and 3951 BC patients were available for OS and RFS analyses respectively (Figure 1A and B). 1746 and 414 BC patients were available for DMFS and PPS analyses respectively (Figure 1C and D). To our surprise, higher expression of OVOL2 was correlated with better prognosis, which may result from its inhibitory roles in pro-tumor process. It should be pointed out that probability of RFS and PPS is significantly higher in OVOL2 high expression patients (p=1.1e-6 and p=0.0036).
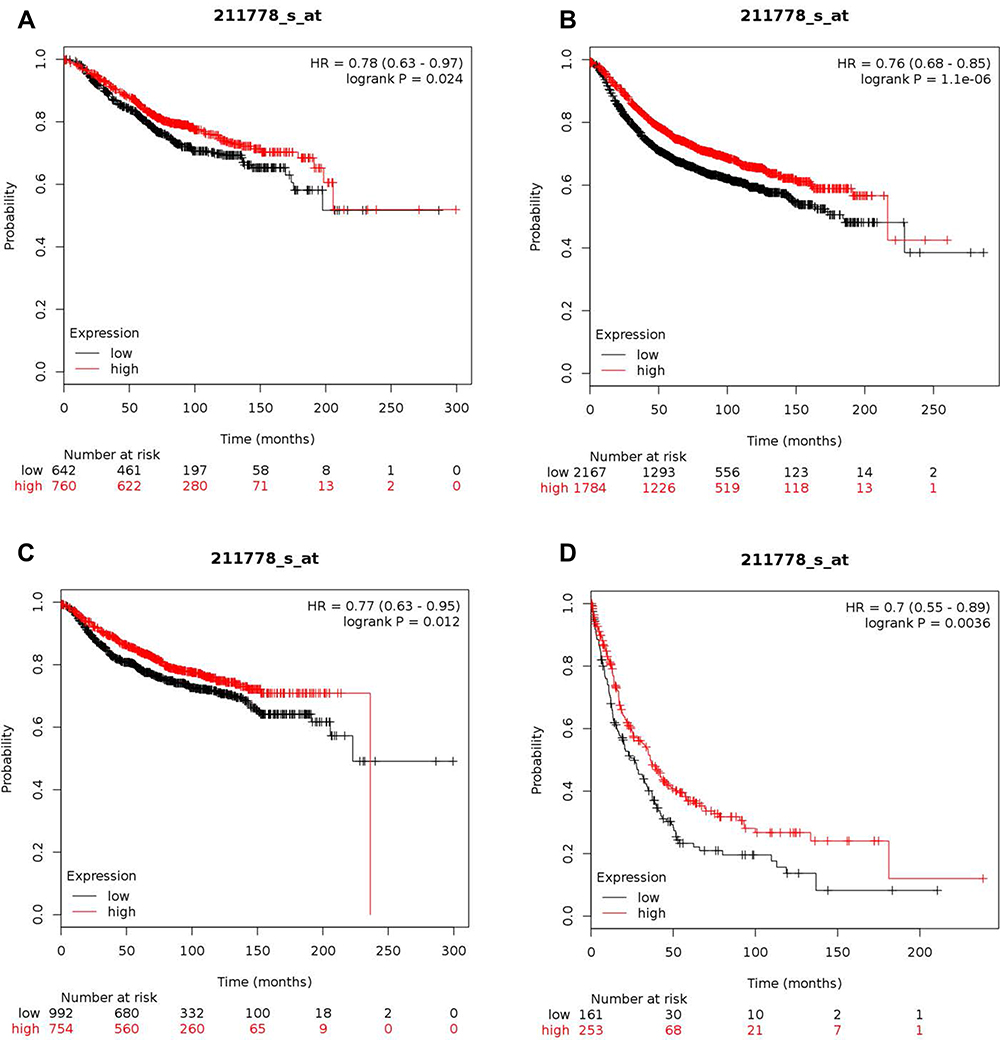 |
Figure 1 High expression level of OVOL2 correlates good prognosis in BC patients. (A) Kaplan–Meier plots comparing OS in cases with high/low expression of OVOL2. (B) Kaplan–Meier plots comparing RFS in cases with high/low expression of OVOL2. (C) Kaplan–Meier plots comparing DMFS in cases with high/low expression of OVOL2. (D) Kaplan–Meier plots comparing PPS in cases with high/low expression of OVOL2. Quantitative data is calculated by Kaplan-Meier Plotter (Details please see MATERIALS AND METHODS). |
OVOL2 is Downregulated in Basal/Triple-Negative Breast Cancer
BC can be classified into five major subtypes (luminal A, luminal B, HER2/neu, basal-like, and normal breast-like) based on gene expression patterns.35,36 Triple-negative breast cancer (TNBC) is often classified as a subtype of basal-like breast cancer according to gene expression profiling analysis.37,38 Our previous study found that OVOL2 was downregulated in basal subtype of BC.19
Bc-GenExMiner v4.8 is a statistical mining tool of published annotated BC transcriptomic data (DNA microarrays, n=11,359 and RNA-seq, n=4421). It offers the possibility to explore gene-expression of genes of interest in BC. Data analysis showed that OVOL2 was significantly lower in basal/TNBC subtype based on DNA microarrays (Figure 2) and RNA-seq (Figure S2). UALCAN is a comprehensive, user-friendly, and interactive web resource for analyzing cancer OMICS data. Analysis of the data of UALCAN showed that the methylation level of OVOL2 promoter was significantly higher in TNBC than the Normal and Luminal subtypes (Figure 3), which may explain low expression of OVOL2 in basal/TNBC subtype. High expression of OVOL2 was positively correlated with survival of TNBC patients (Figure 4).
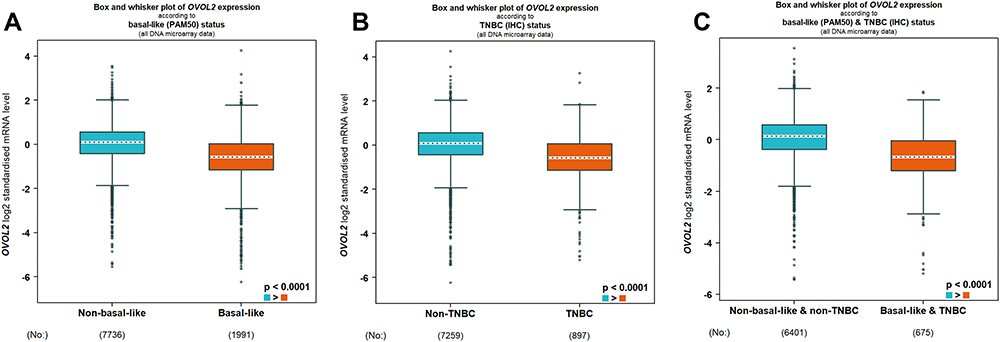 |
Figure 2 OVOL2 was significantly lower in basal/TNBC subtype. Expression level of OVOL2 was significantly lower in basal-like (A), TNBC (B) and basal-like and TNBC (C) subtype based on DNA microarrays of bc-GenExMiner v4.8 database. (Figures were automatically generated from the database. The “*” represents the values of samples. p < 0.0001). |
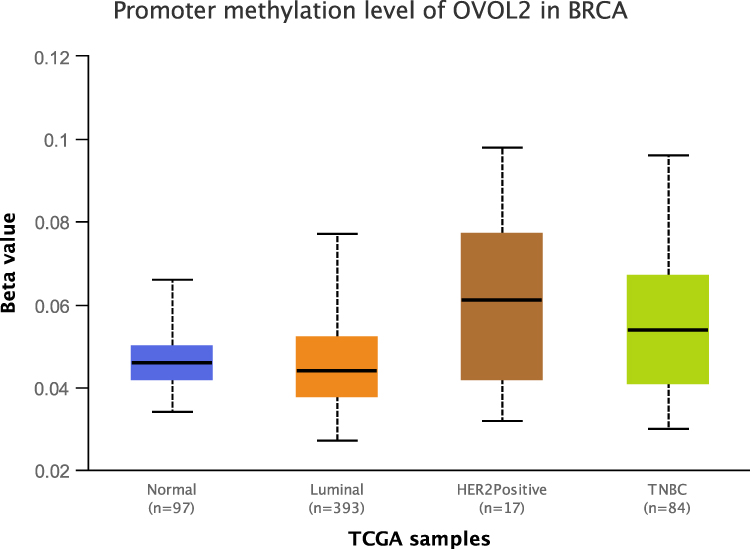 |
Figure 3 Promoter methylation level of OVOL2 was significantly higher in TNBC. Promoter methylation level of OVOL2 Normal, Luminal, HER2 positive and TNBC. (Comparison and Statistical significance: Normal-vs-Luminal, 1.405210E-01; Normal-vs-HER2 Positive, 1.056760E-01; Normal-vs-TNBC, 6.341600E-02; Luminal-vs-HER2 Positive, 7.800400E-03; Luminal-vs-TNBC, 6.413200E-04; HER2Positive-vs-TNBC, 6.074400E-01). |
 |
Figure 4 High expression of OVOL2 was positively correlated with survival of TNBC patients. Survival probability of TNBC patients with OVOL2 high expression was better than lower expression group. (p = 0.045). |
Functional Enrichment Analyses of DEGs in BCSCs-Enriched Populations
Two gene expression profiles (GSE7515, GSE15192) were selected in this study. GSE7515 included 15 mammospheres and 11 primary BC samples. GSE15192 included CD44+/CD24−and CD44−/CD24+ samples with 4 replicates respectively. Based on the criteria of adjusted P-value <0.05 and |logFC| ≥ 2, 1397 DEGs were identified from GSE7515, including 351 upregulated genes and 1046 downregulated genes. In gene chip GSE15192, 2120 DEGs were identified, including 1146 genes were upregulated, and 974 genes were downregulated. All DEGs were identified by comparing BCSCs-enriched samples with control samples. Subsequently, Venn analysis was performed to get the intersection of the DEG profiles (Figure 5). Finally, 244 DEGs were significantly differentially expressed among all two groups, of which 96 genes were significantly upregulated and 148 genes were downregulated (Tables S2 and S3).
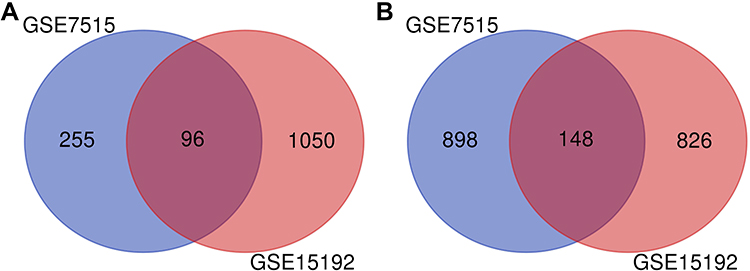 |
Figure 5 Venn diagram of DEGs of two GEO datasets. (A) 96 genes were detected between upregulated genes of GSE7515 and GSE15192. (B) 148 genes were intersected between downregulated genes of GSE7515 and GSE15192. |
GO function and KEGG pathway enrichment analysis for the upregulated (Table S4) and downregulated DEGs (Table 1) were performed using Enrichr. BP analysis indicated that the downregulated DEGs were significantly enriched in bicellular tight junction assembly (GO:0070830), apical junction assembly (GO:0043297) and cell-cell junction assembly (GO:0007043) etc (Table 1). For the cell component, the downregulated DEGs were enriched in bicellular tight junction (GO:0005923), perinuclear region of cytoplasm (GO:0048471) and anchored component of plasma membrane (GO:0046658) etc (Table 1). MF analysis showed that the downregulated DEGs were significantly enriched in protein tyrosine kinase activator activity (GO:0030296), epidermal growth factor receptor binding (GO:0005154) and protein binding involved in heterotypic cell-cell adhesion (GO:0086080) etc (Table 1). The results of KEGG pathway analysis showed that the downregulated DEGs were mainly enriched in Tight junction, NF-kappa B signaling pathway and Cell adhesion molecules (CAMs) etc (Table 1).
 |
Table 1 Gene Ontology (GO) and Kyoto Encyclopedia of Genes and Genomes (KEGG) Functional Enrichment Analysis of Downregulated DEGs |
OVOL2 is One Member of Modules of PPI Network Constructed by Downregulated DEGs
In order to find suppressor of stemness, protein interactions among the downregulated DEGs were predicted with STRING tools. A total of 142 nodes and 160 edges were involved in the PPI network (Figure 6). Average node degree was 2.25 and avg. local clustering coefficient was 0.387. Expected number of edges was 54 and PPI enrichment p-value < 1.0 e-16. Such an enrichment indicates that the proteins are at least partially biologically connected as a group. The top three modules were found in the PPI network (Figure 7). We found that OVOL2 was one member of modules.
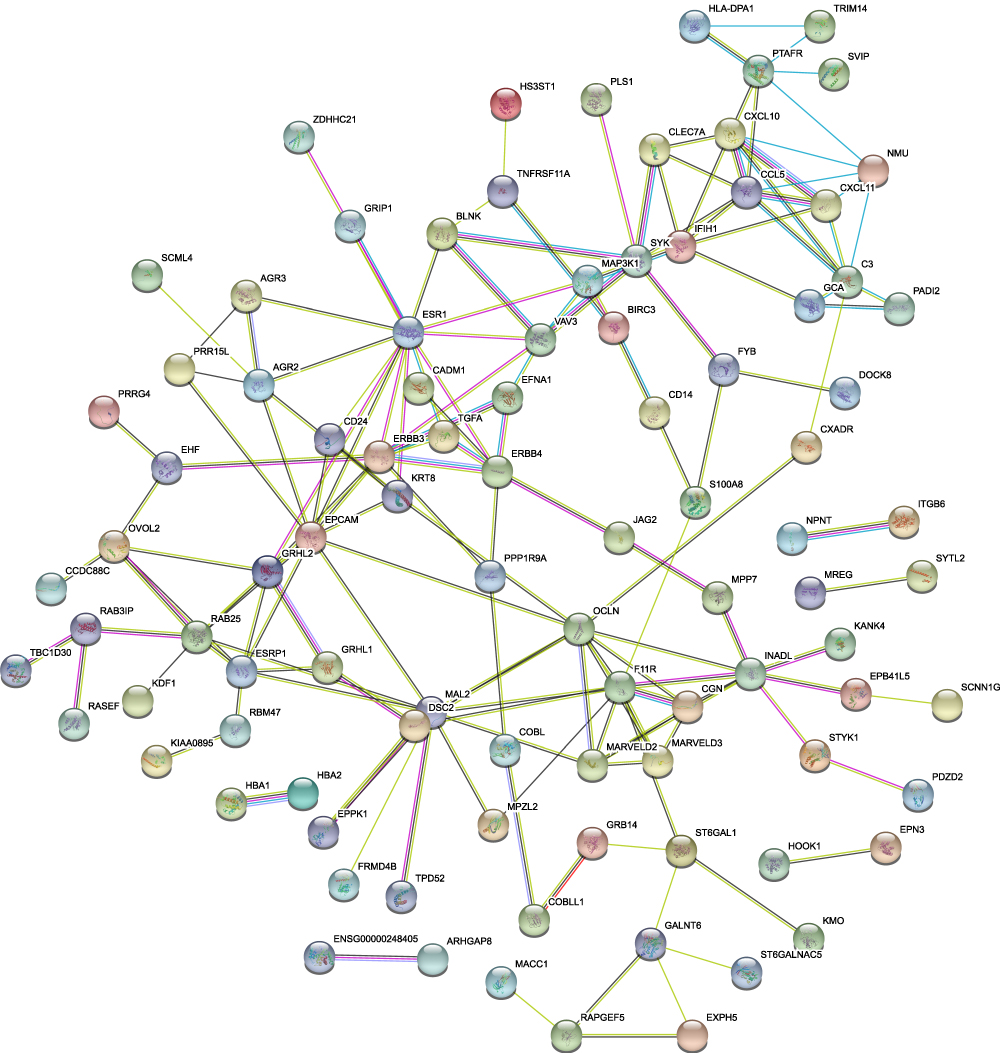 |
Figure 6 PPI network of downregulated DEGs. A total of 142 nodes and 160 edges were involved in the PPI network, with p < 1.0 e-16. |
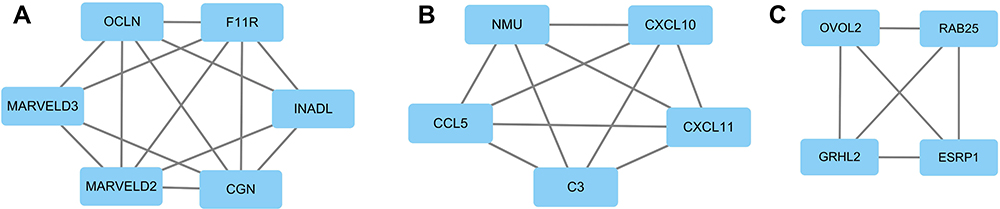 |
Figure 7 The top three modules of downregulated DEGs. (A) Members of module 1 are mainly involved in tight junction. (B) Members of module 2 are mainly involved in immune response. (C) Members of module 3 are mainly involved in TFs in EMT. |
OVOL2 is Correlated with Immune Cells Infiltration in Basal Subtype
Recent studies showed that the prognosis of BC patients is correlated with immune cells infiltration. Data from TIMER 2.0 indicated that expression of OVOL2 was significantly positively correlated with purity (Rho = 0.239, p = 1.48e-03). Expression of OVOL2 was significantly negatively correlated with infiltration of non−regulatory CD4+ T cell (XCELL, Figure S3A), naïve CD4+ T cell (CIBERSORT, Figure S3B; CIBERSORT−ABS, Figure S3C), Neutrophil (TIMER, Figure S3D; MCPCOUNTER, Figure S3E), Macrophage M2 (CIBERSORT−ABS, Figure S3F; QUANTISEQ, Figure S3G), Myeloid dendritic cell (XCELL, Figure S3H), Cancer associated fibroblast (XCELL, Figure S3I), Endothelial cell (EPIC, Figure S3J; MCPCOUNTER, Figure S3K; XCELL, Figure S3L), NK T cell (XCELL, Figure S3M) and Monocyte (XCELL, Figure S3N), while positively correlated with infiltration of Eosinophil (XCELL, Figure S3O) and MDSC (TIDE, Figure S3P).
OVOL2 is Downregulated in Mammospheres of MDA-MB-231and GEO Datasets
To assess the role of OVOL2 in BCSCs, we detected expression levels of OVOL2 and CSC-related markers in mammospheres of MDA-MB-231. The results showed that the OVOL2 was downregulated in mammospheres as compared with the monolayer adherent culture (Figure 8A). However, the levels of the CSC-related markers (NANOG, SOX2 and OCT4) were significantly upregulated in mammospheres (Figure 8B). OVOL2 was also significantly downregulated in GSE7515 and GSE15192 (Figure 9A and B).
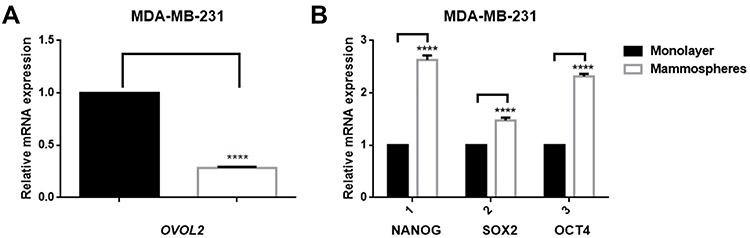 |
Figure 8 OVOL2, NANOG, OCT4 and SOX2 expression in mammospheres of MDA-MB-231. (A) mRNA of OVOL2 was significantly lower in mammospheres. (B) mRNA of NANOG, OCT4 and SOX2 was significantly higher in mammospheres. Quantitative data is presented as mean ± s.d. of three independent experiments. ****p<0.0001. |
 |
Figure 9 OVOL2 was significantly downregulated in GSE7515 and GSE15192. (A) mRNA of OVOL2 was significantly lower (p<0.05) in mammospheres (GSE7515). (B) mRNA of OVOL2 was significantly lower (p<0.0001) in CD44+/CD24− subgroup (GSE15192). Quantitative data is presented as mean ± s.d. of two GEO datasets (GSE7515 included 15 mammospheres and 11 primary breast cancer samples. GSE15192 included CD44+/CD24− and CD44−/CD24+ samples with 4 replicates respectively). *p<0.05, ****p<0.0001. |
OVOL2 Overexpression Inhibits CSCs Properties of MDA-MB-231
Our previous work has shown that OVOL2 is expressed at very low level in MDA-MB-231 cells.19 OVOL2 was overexpressed in MDA-MB-231 to explore its function in BCSCs. Compared with the cells expressing the empty vector (Plv-Vec), OVOL2 overexpression (Plv-OVOL2) significantly inhibited the mammosphere formation of MDA-MB-231 (Figure 10A and B). The ratio of CD44+CD24− subpopulation was significantly reduced by OVOL2 overexpression (Figure 11A and B). Furthermore, our previous work has showed that the overexpression of OVOL2 also significantly inhibits breast tumorigenicity and metastasis in mouse model.19
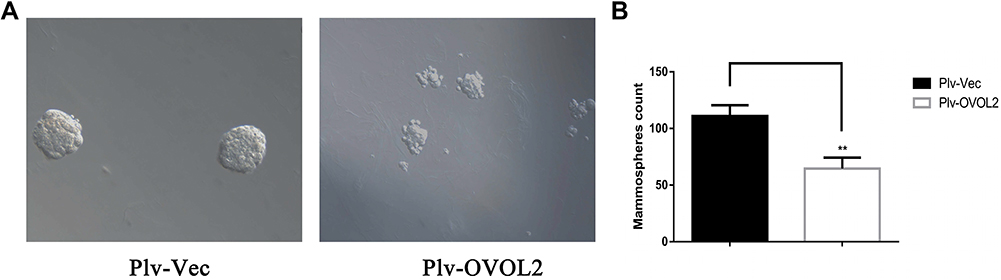 |
Figure 10 OVOL2 inhibited mammosphere formation of MDA-MB-231. (A) The representative images of mammospheres of control (Plv-Vec) and OVOL2 overexpression (Plv-OVOL2) groups. (B) Quantitatively analysis of mammospheres number. Quantitative data is presented as mean ± s.d. of three independent experiments. **p<0.01. Scale bars: 100 μm. |
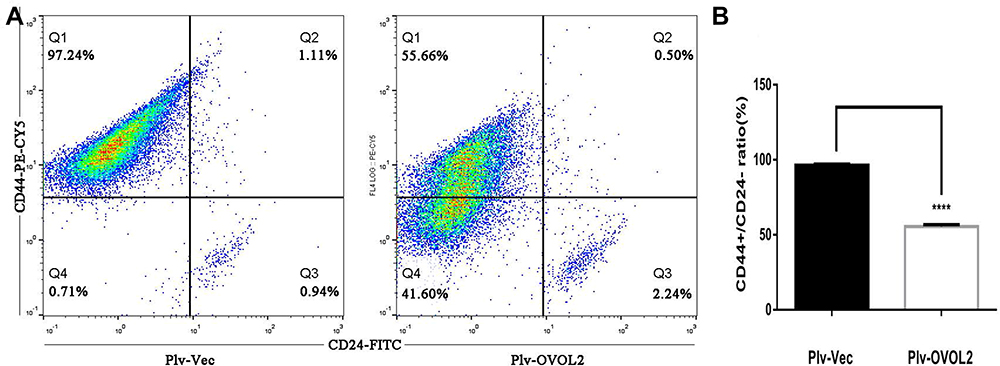 |
Figure 11 OVOL2 downregulated CD44+/CD24− subpopulation ratio. (A) CD44+/CD24− ratio of control group (left) and OVOL2 overexpression group (right). (B) Statistic analysis of CD44+/CD24− ratio between two groups (****p<0.0001). Quantitative data is presented as mean ± s.d. of three independent experiments. |
ALDH1 and CD44 are currently recognized as markers of BCSCs. Data of LinkedOmics manifested that expression of OVOL2 was negatively correlated with CD44, ALDH1A1, ALDH1A2, ALDH1A3, CXCR4 and POU5F1 in breast invasive carcinoma (Table 2). All these results demonstrate that OVOL2 could act as a potential repressor of BCSCs.
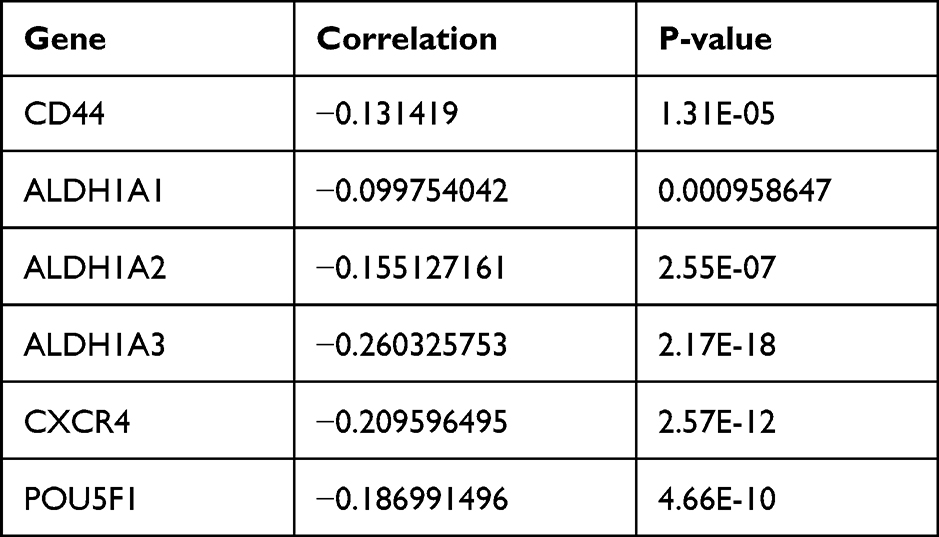 |
Table 2 Negative Correlation Between Expression of OVOL2 and Markers of BCSCs |
Discussion
Numerous reports have revealed that BC is hierarchically organized and driven by a small fraction of tumor cells that display stem cell properties. This small population is also designated as BCSCs or BC initiating cells. It is well recognized that BCSCs play important roles in the tumorigenesis, drug resistance, invasion and metastasis.39,40 Considering inhibitory function of OVOL2 in EMT and close connection between EMT and stemness of BC,19 we hypothesized that OVOL2 may regulate stemness of BC.
Functional enrichment analyses of the downregulated DEGs showed that “tight junction” (TJ) may play a key role in BCSCs regulation. Recent research reported that the TJ structure played an important part in tumor development through the dysregulation of its barrier and fence functions. Loss of cohesion of the TJ structure can lead to invasion and ultimately to the metastasis of cancer cells.41 The top three modules include several genes involved in the following epithelial function: interactions at tight junctions (MARVELD2, MARVELD3, F11R, CGN, INADL, OCLN); transcription regulation of cell-cell junction complexes (GRHL2); epithelial RNA splicing regulators (ESRP1); epithelial vesicle traffic (RAB25, GRHL2); terminal differentiation of epithelial cells (OVOL2); maintenance of apico-basal polarity (RAB25).42,43 For example, tight junction protein MarvelD3 contains a conserved MARVEL (MAL and related proteins for vesicle trafficking and membrane link) domain like occludin and tricellulin. MarvelD3 is transcriptionally downregulated in Snail-induced EMT during the progression for the pancreatic cancer.44 Inhibition of JAM-A/F11R by miR-495 promoted the migration of MCF-7 and MDA-MB-231 cells.43 ESRP1 is a mRNA splicing factor that regulates the formation of epithelial cell-specific isoforms. ESRP1 also regulates the splicing of CD44, CTNND1, ENAH, 3 transcripts that undergo changes in splicing during EMT.45 Kikuchi et al found that ZEB1-RAB25/ESRP1 axis plays a critical role in phenylbutyrate treatment-resistant BC.46 In addition, RAB25 is involved in the regulation of epithelial morphogenesis through the control of CLDN4 expression and localization at tight junctions.42 GRHL2 and OVOL2 are also transcription factors, both of which are potent suppressor of EMT.16,18–20,47,48 Downregulation of above molecules may contribute to losing epithelial cell traits and acquire mesenchymal cell traits.
EMT is an embryonic process during which polarized epithelial cells transform into a more motile and mesenchymal phenotype.49 Numerous literatures have reported the important role of EMT in the process of cancer metastasis.50 Moreover, it has been shown that EMT is also a process by which non stem cells acquire stem cell traits. Mani et al found that induction of EMT in immortalized human mammary epithelial cells increased the expression of stem cell markers, and their ability to form mammospheres.51 Therefore, targeting EMT is a strategy to treat triple-negative BC.52 In addition, these CSC properties are considered to be closely correlated with tumor initiation, progression and metastasis, as well as resistance to chemotherapy.53–55 Our previous studies have shown that OVOL2 inhibits CRC and BC migration and invasion through inhibiting the EMT by inhibiting Wnt and TGF-β signaling.18,19 OVOL2 also can directly regulate expression of ZEB1 by binding to its promoters.21–23 GEO datasets analysis showed that OVOL2 was significantly downregulated in mammospheres and CD44+/CD24− subpopulation (Figure 9A and B). Considering the close relationship between EMT and CSC properties, we examined the effect of OVOL2 on CSC traits of MDA-MB-231. Herein, we demonstrate that high OVOL2 expression inhibits CSC traits of BC. Survival analyses indicated that high expression of OVOL2 was associated with favorable prognosis. Higher expression of OVOL2 significantly increased the probability of RFS and PPS, which highlight OVOL2 as a promising novel therapeutic target for aggressive breast tumors. Due to the complexity of signaling network and target proteins regulated by OVOL2, further work is needed to clarify the molecular mechanism of its action on EMT and stemness of BC.
Although chemokines were initially appreciated as important mediators of immune cell migration, they also play important roles in tumor growth and progression. The discovery of host interferon-γ (IFNγ) in rejecting tumor cells has led to renewed interest in cancer immunotherapies.56 Chemokines play an important role in leukocyte infiltration into any tissue, including tumors. Hence, they have a critical role in shaping the immune cell composition in tumor microenvironment (TME), which affects tumor development. The major effector cells that are involved in the elimination of cancer cells are natural killer (NK) cells, γδ T cells, and effector CD4+ and CD8+ T cells.57 To eradicate a tumor, effector cells must migrate into the TME, and the presence of effector cells within a tumor can be a positive prognostic indicator. Expression of CCL5 has been correlated with the presence of tumor-infiltrating lymphocytes (TILs) in melanoma and Triple negative breast cancer (TNBC).58,59 Furthermore, IFNγ-inducible chemokines CXCL9, CXCL10, and CXCL11 have been associated with activation of cytotoxic CD8+ T cell responses in BC treated by DNA methyltransferase inhibitor (DMTi).60 Complement component 3 (C3) plays a central role in killing cancer cells.61,62 Downregulation of these molecules may help BCSCs to escape immune surveillance.
Su et al showed that intratumoral tregs developed mainly from naïve T cells in situ rather than from recruited tregs. The abundance of naïve CD4+ T cells is correlated closely with Tregs, both indicating poor prognosis for BC patients.63 Huang et al found that CD8+ T cells are the key effector cell population mediating effective anti-tumor immunity. In contrast, intratumoral CD4+ T cells have negative prognostic effects on BC patient outcomes.64 Tumor cell–neutrophil interactions play an important role in tumor progression, metastasis, and overall survival. Wu et al found BC cell-neutrophil interactions play an important role in pro-tumor characteristics, including therapy resistance.65 Macrophages promote “pro-tumourigenic” cellular characteristics of BC cell migration and stem cell activity. Ward et al found that co-culture with four BC cell lines (MCF7, T47D, MDA-MB-231, MDA-MB-468), M2-macrophages increased mammosphere formation.66 BC can hijack dendritic cells (DCs) to promote chronic inflammation and accelerate tumor development.67 Early BC has an inflammatory milieu characterized by myeloid dendritic cell (mDC), Treg, and CSC infiltration, while plasmacytoid DC (pDC) were almost absent.68 Cancer associated fibroblasts (CAFs) are the largest stromal cell population in breast tumors. Emerging evidence suggests that CAFs play an important role not only in promoting tumor growth and spread, but also in altering tumor response to therapeutic agents.69 Lymphatic endothelial cells provide not only nutrient and oxygen to tissues, but also important microenvironmental factor for normal morphogenesis and cancerous growth in BC.70,71 Some studies showed an association between higher circulating eosinophil count and better prognosis, as well as an association with response to neoadjuvant chemotherapy in hormone receptor-negative/HER2-positive and in TNBC.72 The antitumor functions of eosinophils could be direct, by cytotoxicity through release of granules, or indirect, by modulating immune responses, especially by attracting CD8+ T cells.73 A study showed that eosinophils secrete chemoattractant cytokines that guide CD8+ T cells into cancer tissue and induce normalization of the tumor vasculature.74 In summary, CD4+ T cell, Neutrophil, Macrophage M2, Myeloid dendritic cell, Cancer associated fibroblast and Endothelial cell have cancer-promoting function, while eosinophils have cancer-inhibiting effect. Interestingly, OVOL2 expression was negatively correlated with naïve CD4+ T cell, Neutrophil, Macrophage M2, Myeloid dendritic cell, Cancer associated fibroblast, Endothelial cell, and positively correlated with Eosinophil.
Conclusion
In conclusion, bioinformatics and experiments suggest that tight junction, EMT and chemokines may deeply participate in regulation of BCSCs. OVOL2 expression was significantly correlated with infiltrating level of various immune cells. OVOL2 is a potential suppressor of BCSCs in basal subtype.
Abbreviations
BCSCs, Breast cancer stem cells; BP, Biological process; BC, Breast cancer; CC, Cellular component; CRC, Colorectal cancer; CSC, Cancer stem cell; DMFS, Distant metastasis free survival; DEGs, Differentially expressed genes; EMT, Epithelial-to-mesenchymal transition; FACS, Fluorescence-activated cell sorting; FC, Fold change; GO, Gene Ontology; KEGG, Kyoto Encyclopedia of Genes and Genomes; MaSC, Mammary epithelial stem cells; MF, Molecular function; OS, Overall survival; OVOL2, Ovo like zinc finger 2; PPI, Protein-protein interactions; PPS, Post progression survival; RFS, Relapse-free survival; TJ, Tight junction; TME, Tumor microenvironment.
Ethics Statement
In this study, bioinformatics methods were mainly adopted to analyze publicly available data from non-profit databases, and its sources were described in detail. Cell line MDA-MB-231 was used in this research, which did not involve human beings and experimental animals and approved by Institutional Review Board of The First Affiliated Hospital of Henan University of Science and Technology.
Acknowledgment
The authors thank Dr. Xi Lian of Oxford University for critical reading of this manuscript.
Funding
This research was funded by Natural Science Foundation of Henan Province (No. 162300410099), Doctor Scientific Research start-up Fund from Henan University of Science & Technology (No. 13480064) and National Natural Science Foundation of China (No. 81700775).
Disclosure
The authors declare no conflicts of interest in this work.
References
1. Bray F, Ferlay J, Soerjomataram I, Siegel RL, Torre LA, Jemal A. Global cancer statistics 2018: GLOBOCAN estimates of incidence and mortality worldwide for 36 cancers in 185 countries. CA Cancer J Clin. 2018;68(6):394–424. doi:10.3322/caac.21492
2. Smalley M, Piggott L, Clarkson R. Breast cancer stem cells: obstacles to therapy. Cancer Lett. 2013;338(1):57–62.
3. Takebe N, Harris PJ, Warren RQ, Ivy SP. Targeting cancer stem cells by inhibiting Wnt, Notch, and Hedgehog pathways. Nat Rev Clin Oncol. 2011;8(2):97–106.
4. Jones RJ, Matsui W. Cancer stem cells: from bench to bedside. Biol Blood Marrow Transplant. 2007;13(Suppl 1):47–52.
5. Al-Hajj M, Wicha MS, Benito-Hernandez A, Morrison SJ, Clarke MF. Prospective identification of tumorigenic breast cancer cells. Proc Natl Acad Sci U S A. 2003;100(7):3983–3988.
6. Morrison BJ, Schmidt CW, Lakhani SR, Reynolds BA, Lopez JA. Breast cancer stem cells: implications for therapy of breast cancer. Breast Cancer Res. 2008;10(4):210.
7. Dontu G, Abdallah WM, Foley JM, et al. In vitro propagation and transcriptional profiling of human mammary stem/progenitor cells. Genes Dev. 2003;17(10):1253–1270.
8. Ponti D, Zaffaroni N, Capelli C, Daidone MG. Breast cancer stem cells: an overview. Eur J Cancer. 2006;42(9):1219–1224.
9. Kohandel M. Mesenchymal traits and cancer stem cells in mammospheres: chicken or egg? Cell Cycle. 2012;11(24):4498.
10. Larionova I, Cherdyntseva N, Liu T, Patysheva M, Rakina M, Kzhyshkowska J. Interaction of tumor-associated macrophages and cancer chemotherapy. Oncoimmunology. 2019;8(7):1596004. doi:10.1080/2162402X.2019.1596004
11. Nalio Ramos R, Missolo-Koussou Y, Gerber-Ferder Y, et al. Tissue-resident FOLR2(+) macrophages associate with CD8(+) T cell infiltration in human breast cancer. Cell. 2022;185(7):1189–1207 e1125. doi:10.1016/j.cell.2022.02.021
12. Ali HR, Chlon L, Pharoah PD, Markowetz F, Caldas C. Patterns of immune infiltration in breast cancer and their clinical implications: a gene-expression-based retrospective study. PLoS Med. 2016;13(12):e1002194.
13. Li B, Dai Q, Li L, Nair M, Mackay DR, Dai X. Ovol2, a mammalian homolog of Drosophila ovo: gene structure, chromosomal mapping, and aberrant expression in blind-sterile mice. Genomics. 2002;80(3):319–325.
14. Mackay DR, Hu M, Li B, Rheaume C, Dai X. The mouse Ovol2 gene is required for cranial neural tube development. Dev Biol. 2006;291(1):38–52.
15. Unezaki S, Horai R, Sudo K, Iwakura Y, Ito S. Ovol2/Movo, a homologue of Drosophila ovo, is required for angiogenesis, heart formation and placental development in mice. Genes Cells. 2007;12(6):773–785.
16. Watanabe K, Villarreal-Ponce A, Sun P, et al. Mammary morphogenesis and regeneration require the inhibition of EMT at terminal end buds by Ovol2 transcriptional repressor. Dev Cell. 2014;29(1):59–74.
17. Hayashi M, Shinozuka Y, Shigenobu S, et al. Conserved role of Ovo in germline development in mouse and Drosophila. Sci Rep. 2017;7:40056.
18. Ye GD, Sun GB, Jiao P, et al. OVOL2, an inhibitor of WNT signaling, reduces invasive activities of human and mouse cancer cells and is down-regulated in human colorectal tumors. Gastroenterology. 2016;150(3):659–671 e616.
19. Wu RS, Hong JJ, Wu JF, et al. OVOL2 antagonizes TGF-beta signaling to regulate epithelial to mesenchymal transition during mammary tumor metastasis. Oncotarget. 2017;8(24):39401–39416.
20. Roca H, Hernandez J, Weidner S, et al. Transcription factors OVOL1 and OVOL2 induce the mesenchymal to epithelial transition in human cancer. PLoS One. 2013;8(10):e76773.
21. Liu J, Wu Q, Wang Y, et al. Ovol2 induces mesenchymal-epithelial transition via targeting ZEB1 in osteosarcoma. Onco Targets Ther. 2018;11:2963–2973.
22. Hong T, Watanabe K, Ta CH, Villarreal-Ponce A, Nie Q, Dai X. An Ovol2-Zeb1 mutual inhibitory circuit governs bidirectional and multi-step transition between epithelial and mesenchymal states. Plos Comput Biol. 2015;11(11):e1004569.
23. Haensel D, Sun P, MacLean AL, et al. An Ovol2-Zeb1 transcriptional circuit regulates epithelial directional migration and proliferation. EMBO Rep. 2019;20(1):e46273.
24. Wang ZH, Li Z, Hu M, et al. Ovol2 gene inhibits the epithelial-to-mesenchymal transition in lung adenocarcinoma by transcriptionally repressing Twist1. Gene. 2017;600:1–8.
25. Bhat-Nakshatri P, Appaiah H, Ballas C, et al. SLUG/SNAI2 and tumor necrosis factor generate breast cells with CD44+/CD24- phenotype. BMC Cancer. 2010;10:411.
26. Creighton CJ, Li X, Landis M, et al. Residual breast cancers after conventional therapy display mesenchymal as well as tumor-initiating features. Proc Natl Acad Sci U S A. 2009;106(33):13820–13825.
27. Li T, Fu J, Zeng Z, et al. TIMER2.0 for analysis of tumor-infiltrating immune cells. Nucleic Acids Res. 2020;48(W1):W509–W514.
28. Jezequel P, Gouraud W, Ben Azzouz F, et al. bc-GenExMiner 4.5: new mining module computes breast cancer differential gene expression analyses. Database (Oxford). 2021;2021:baab007.
29. Chandrashekar DS, Karthikeyan SK, Korla PK, et al. UALCAN: an update to the integrated cancer data analysis platform. Neoplasia. 2022;25:18–27.
30. Vasaikar SV, Straub P, Wang J, Zhang B. LinkedOmics: analyzing multi-omics data within and across 32 cancer types. Nucleic Acids Res. 2018;46(D1):D956–D963.
31. Chen EY, Tan CM, Kou Y, et al. Enrichr: interactive and collaborative HTML5 gene list enrichment analysis tool. Bmc Bioinformatics. 2013;14:128.
32. Kuleshov MV, Jones MR, Rouillard AD, et al. Enrichr: a comprehensive gene set enrichment analysis web server 2016 update. Nucleic Acids Res. 2016;44(W1):W90–97.
33. Nagy A, Lanczky A, Menyhart O, Gyorffy B. Validation of miRNA prognostic power in hepatocellular carcinoma using expression data of independent datasets. Sci Rep. 2018;8(1):9227.
34. Cai WY, Wei TZ, Luo QC, et al. The Wnt-beta-catenin pathway represses let-7 microRNA expression through transactivation of Lin28 to augment breast cancer stem cell expansion. J Cell Sci. 2013;126(Pt 13):2877–2889.
35. Perou CM, Sorlie T, Eisen MB, et al. Molecular portraits of human breast tumours. Nature. 2000;406(6797):747–752.
36. Sorlie T, Tibshirani R, Parker J, et al. Repeated observation of breast tumor subtypes in independent gene expression data sets. Proc Natl Acad Sci U S A. 2003;100(14):8418–8423.
37. Cancer Genome Atlas N. Comprehensive molecular portraits of human breast tumours. Nature. 2012;490(7418):61–70.
38. Yin L, Duan JJ, Bian XW, Yu SC. Triple-negative breast cancer molecular subtyping and treatment progress. Breast Cancer Res. 2020;22(1):61.
39. Luo M, Clouthier SG, Deol Y, et al. Breast cancer stem cells: current advances and clinical implications. Methods Mol Biol. 2015;1293:1–49.
40. Al-Ejeh F, Smart CE, Morrison BJ, et al. Breast cancer stem cells: treatment resistance and therapeutic opportunities. Carcinogenesis. 2011;32(5):650–658.
41. Martin TA, Mason MD, Jiang WG. Tight junctions in cancer metastasis. Front Biosci (Landmark Ed). 2011;16:898–936.
42. Kohn KW, Zeeberg BM, Reinhold WC, Pommier Y. Gene expression correlations in human cancer cell lines define molecular interaction networks for epithelial phenotype. PLoS One. 2014;9(6):e99269.
43. Cao M, Nie W, Li J, et al. MicroRNA-495 induces breast cancer cell migration by targeting JAM-A. Protein Cell. 2014;5(11):862–872.
44. Raleigh DR, Marchiando AM, Zhang Y, et al. Tight junction-associated MARVEL proteins marveld3, tricellulin, and occludin have distinct but overlapping functions. Mol Biol Cell. 2010;21(7):1200–1213.
45. Warzecha CC, Sato TK, Nabet B, Hogenesch JB, Carstens RP. ESRP1 and ESRP2 are epithelial cell-type-specific regulators of FGFR2 splicing. Mol Cell. 2009;33(5):591–601.
46. Kikuchi M, Yamashita K, Waraya M, et al. Epigenetic regulation of ZEB1-RAB25/ESRP1 axis plays a critical role in phenylbutyrate treatment-resistant breast cancer. Oncotarget. 2016;7(2):1741–1753.
47. Mooney SM, Talebian V, Jolly MK, et al. The GRHL2/ZEB feedback loop-A key axis in the regulation of EMT in breast cancer. J Cell Biochem. 2017;118(9):2559–2570.
48. Riethdorf S, Frey S, Santjer S, et al. Diverse expression patterns of the EMT suppressor grainyhead-like 2 (GRHL2) in normal and tumour tissues. Int J Cancer. 2016;138(4):949–963.
49. Thiery JP, Acloque H, Huang RY, Nieto MA. Epithelial-mesenchymal transitions in development and disease. Cell. 2009;139(5):871–890.
50. Huber MA, Kraut N, Beug H. Molecular requirements for epithelial-mesenchymal transition during tumor progression. Curr Opin Cell Biol. 2005;17(5):548–558.
51. Mani SA, Guo W, Liao MJ, et al. The epithelial-mesenchymal transition generates cells with properties of stem cells. Cell. 2008;133(4):704–715.
52. Maqbool M, Bekele F, Fekadu G. Treatment strategies against triple-negative breast cancer: an updated review. Breast Cancer (Dove Med Press). 2022;14:15–24.
53. Wellner U, Schubert J, Burk UC, et al. The EMT-activator ZEB1 promotes tumorigenicity by repressing stemness-inhibiting microRNAs. Nat Cell Biol. 2009;11(12):1487–1495.
54. Singh A, Settleman J. EMT, cancer stem cells and drug resistance: an emerging axis of evil in the war on cancer. Oncogene. 2010;29(34):4741–4751.
55. Chiu WT, Huang YF, Tsai HY, et al. FOXM1 confers to epithelial-mesenchymal transition, stemness and chemoresistance in epithelial ovarian carcinoma cells. Oncotarget. 2015;6(4):2349–2365.
56. Dighe AS, Richards E, Old LJ, Schreiber RD. Enhanced in vivo growth and resistance to rejection of tumor cells expressing dominant negative IFN gamma receptors. Immunity. 1994;1(6):447–456.
57. Vesely MD, Kershaw MH, Schreiber RD, Smyth MJ. Natural innate and adaptive immunity to cancer. Annu Rev Immunol. 2011;29:235–271.
58. Harlin H, Meng Y, Peterson AC, et al. Chemokine expression in melanoma metastases associated with CD8+ T-cell recruitment. Cancer Res. 2009;69(7):3077–3085.
59. Araujo JM, Gomez AC, Aguilar A, et al. Effect of CCL5 expression in the recruitment of immune cells in triple negative breast cancer. Sci Rep. 2018;8(1):4899.
60. Luo N, Sugiura A, Balko JM. Therapeutic potential of DNA methyltransferase inhibitors with immune checkpoint inhibitor therapy in breast cancer. Cell Stress. 2018;2(3):69–71.
61. Hakulinen J, Meri S. Complement-mediated killing of microtumors in vitro. Am J Pathol. 1998;153(3):845–855.
62. Li F, Cheng Y, Lu J, Hu R, Wan Q, Feng H. Photodynamic therapy boosts anti-glioma immunity in mice: a dependence on the activities of T cells and complement C3. J Cell Biochem. 2011;112(10):3035–3043.
63. Su S, Liao J, Liu J, et al. Blocking the recruitment of naive CD4(+) T cells reverses immunosuppression in breast cancer. Cell Res. 2017;27(4):461–482.
64. Huang Y, Ma C, Zhang Q, et al. CD4+ and CD8+ T cells have opposing roles in breast cancer progression and outcome. Oncotarget. 2015;6(19):17462–17478.
65. Wu L, Saxena S, Goel P, Prajapati DR, Wang C, Singh RK. Breast Cancer Cell-Neutrophil Interactions Enhance Neutrophil Survival and Pro-Tumorigenic Activities. Cancers (Basel. 2020;12(10):e46273.
66. Ward R, Sims AH, Lee A, et al. Monocytes and macrophages, implications for breast cancer migration and stem cell-like activity and treatment. Oncotarget. 2015;6(16):14687–14699.
67. Palucka K, Coussens LM, O’Shaughnessy J. Dendritic cells, inflammation, and breast cancer. Cancer J. 2013;19(6):511–516.
68. Solis-Castillo LA, Garcia-Romo GS, Diaz-Rodriguez A, et al. Tumor-infiltrating regulatory T cells, CD8/Treg ratio, and cancer stem cells are correlated with lymph node metastasis in patients with early breast cancer. Breast Cancer. 2020;27(5):837–849.
69. Lappano R, Rigiracciolo DC, Belfiore A, Maggiolini M, De Francesco EM. Cancer associated fibroblasts: role in breast cancer and potential as therapeutic targets. Expert Opin Ther Targets. 2020;24(6):559–572.
70. Ingthorsson S, Sigurdsson V, Fridriksdottir A
71. Lee E, Pandey NB, Popel AS. Lymphatic endothelial cells support tumor growth in breast cancer. Sci Rep. 2014;4:5853.
72. Poncin A, Onesti CE, Josse C, et al. Immunity and breast cancer: focus on eosinophils. Biomedicines. 2021;9(9):3.
73. Gatault S, Legrand F, Delbeke M, Loiseau S, Capron M. Involvement of eosinophils in the anti-tumor response. Cancer Immunol Immunother. 2012;61(9):1527–1534.
74. Carretero R, Sektioglu IM, Garbi N, Salgado OC, Beckhove P, Hammerling GJ. Eosinophils orchestrate cancer rejection by normalizing tumor vessels and enhancing infiltration of CD8(+) T cells. Nat Immunol. 2015;16(6):609–617.
 © 2022 The Author(s). This work is published and licensed by Dove Medical Press Limited. The full terms of this license are available at https://www.dovepress.com/terms.php and incorporate the Creative Commons Attribution - Non Commercial (unported, v3.0) License.
By accessing the work you hereby accept the Terms. Non-commercial uses of the work are permitted without any further permission from Dove Medical Press Limited, provided the work is properly attributed. For permission for commercial use of this work, please see paragraphs 4.2 and 5 of our Terms.
© 2022 The Author(s). This work is published and licensed by Dove Medical Press Limited. The full terms of this license are available at https://www.dovepress.com/terms.php and incorporate the Creative Commons Attribution - Non Commercial (unported, v3.0) License.
By accessing the work you hereby accept the Terms. Non-commercial uses of the work are permitted without any further permission from Dove Medical Press Limited, provided the work is properly attributed. For permission for commercial use of this work, please see paragraphs 4.2 and 5 of our Terms.