")
Back to Journals » Journal of Inflammation Research » Volume 16
Overexpression of TREM1 is Associated with the Immune-Suppressive Microenvironment and Unfavorable Prognosis in Pan-Cancer
Authors Zhou X , Lin K, Fu L, Liu F, Lin H, Chen Y, Zhuang B, Liang H , Deng Q , Wang Z, Chen W, Luo J, Cao J, Li P
Received 24 November 2022
Accepted for publication 21 March 2023
Published 27 March 2023 Volume 2023:16 Pages 1375—1391
DOI https://doi.org/10.2147/JIR.S398284
Checked for plagiarism Yes
Review by Single anonymous peer review
Peer reviewer comments 4
Editor who approved publication: Professor Ning Quan
Xinwei Zhou,1,* Ke Lin,2,* Liangmin Fu,1,* Fei Liu,3,* Hansen Lin,1 Yuhang Chen,1 Bowen Zhuang,2 Hui Liang,4 Qiong Deng,4 Zhu Wang,4 Wei Chen,1 Junhang Luo,1,5 Jiazheng Cao,6 Pengju Li1
1Department of Urology, The First Affiliated Hospital of Sun Yat-sen University, Guangzhou, People’s Republic of China; 2Department of Medical Ultrasonics, Institute of Diagnostic and Interventional Ultrasound, The First Affiliated Hospital of Sun Yat-sen University, Guangzhou, People’s Republic of China; 3Department of Urology, National Cancer Center/National Clinical Research Center for Cancer/Cancer Hospital, Chinese Academy of Medical Sciences and Peking Union Medical College, Beijing, People’s Republic of China; 4Department of Urology, Affiliated Longhua People’s Hospital, Southern Medical University, Shenzhen, People’s Republic of China; 5Institute of Precision Medicine, the First Affiliated Hospital, Sun Yat-sen University, Guangzhou, People’s Republic of China; 6Department of Urology, Jiangmen Central Hospital, Jiangmen, People’s Republic of China
*These authors contributed equally to this work
Correspondence: Pengju Li, Department of Urology, The First Affiliated Hospital of Sun Yat-sen University, No. 58, Zhongshan Road II, Guangzhou, 510080, People’s Republic of China, Tel +86-20-87618227, Email [email protected] Jiazheng Cao, Department of Urology, Jiangmen Central Hospital, Haibang Street 23, Jiangmen, 529030, People’s Republic of China, Tel +86-750-3165500, Email [email protected]
Background: Triggering receptors expressed by myeloid cells-1 (TREM1) is a receptor belonging to the immunoglobulin superfamily and plays an important role in pro-inflammation in acute and chronic inflammatory disorders. However, the understanding of the immunomodulatory roles of TREM1 in the tumor microenvironment remains incomplete.
Methods: The expression patterns of TREM1 mRNA in tumors and adjacent normal tissues were compared by analyzing data obtained from the Genotype-Tissue Expression and The Cancer Genome Atlas datasets. Survival analysis was performed to determine the prognostic value of TREM1. Functional enrichment analysis was applied to decipher the discrepancy in biological processes between high- and low-TREM1 groups across various cancers. The correlation between TREM1 and immune cell infiltration determined by using multiple algorithms was evaluated with the Pearson method. Four independent immunotherapy cohorts were adopted to validate the role of TREM1 as a biomarker.
Results: TREM1 was elevated in most cancers as verified with clinical samples. Overexpression of TREM1 was linked with undesirable prognosis in patients. Further analysis revealed that TREM1 was positively correlated with immune response, pro-tumor pathways, and myeloid cell infiltration, while being negatively correlated with CD8+ T cell (including infiltration level and biological processes). Concordantly, tumors with high TREM1 levels were more resistant to immunotherapy. Through connective map analysis, therapeutically potential compounds like tozasertib and TPCA-1 were identified, which can be used synergistically with immunotherapy to improve the poor prognosis of patients with high TREM1 levels.
Conclusion: Through a systematic and comprehensive pan-cancer analysis, we demonstrated that overexpression of TREM1 in tumors correlated closely with unfavorable outcome, infiltration of immune-suppressive cells, and immune regulation, which highlights its potential use as a tumor prognostic biomarker and a novel target for immunotherapy.
Keywords: triggering receptors expressed by myeloid cells-1, pan-cancer, prognostic biomarker, tumor microenvironment, clear cell renal cell carcinoma, immunotherapy
Introduction
The tumor microenvironment (TME) is a collective term that includes tumor cells and the non-neoplastic components with which they interact. Changes in the TME often affect multiple biological functions in tumors.1 Although “inflammatory” type tumors characterized by high immune cell infiltration are considered to have a better prognosis and a better response to immunotherapy, chronic inflammation is inextricably linked with tumor development and immune escape.2 Studies have confirmed that the presence of long-term chronic infection is highly related to the risk of tumors at the same location, and many cancers occur at the sites of chronic inflammation.3 Cancer-related inflammation is even considered the seventh hallmark of cancer.4 Therefore, the potential role of inflammation in TME deserves further study.
Triggering receptors expressed on myeloid cells (TREM) are a group of activated receptors specifically expressed in bone marrow-derived cells. There are five subtypes in the TREM family: TREM1-5.5 TREM1 subtype is the most characteristic protein of its family, and promotes inflammatory response in many ways.6 An increase in the levels of TREM1 was observed in pneumonia, inflammatory bowel disease, intraperitoneal infection, and other inflammatory diseases.7,8 In, addition, TREM1 was overexpressed in some solid tumors and the elevated levels of TREM1 seem to be associated with a poor prognosis of tumors.9,10 These observations imply that TREM1 may participate in the development and progress of tumors by involving in tumor-related inflammation.
Considering these important roles played by TREM1 in inflammation and tumor, pan-cancer data were analyzed to explore the abnormal expression, predictive value, and immunosuppressive role of TREM1 in a variety of tumors, especially in kidney renal clear cell carcinoma (KIRC). By analyzing the transcriptome data of Genotype-tissue Expression (GTEx) database and The Cancer Genome Atlas (TCGA) cohorts, the differential level of TREM1 expression between tumor tissues and adjacent tissues was revealed. With clinical samples, quantitative real-time PCR (qRT-PCR), Western blot, and immuno-histochemistry (IHC) were conducted to assess the expression level of TREM1 in tumor and adjacent normal tissue. The prognostic role of TREM1 in solid tumors was determined through Kaplan–Meier (K-M) survival analysis, univariate Cox regression (UniCox), and multivariate Cox regression (MultiCox) analysis. The correlations between immune cell abundance quantified by multiple methods and TREM1 were determined in pan-cancer. Finally, the reliability of TREM1 as a prognostic biomarker in immunotherapy was explored through four immune checkpoint inhibitor (ICI) treatment cohorts. In short, the results indicated that TREM1 could serve as a promising biomarker and a therapeutic target across multiple cancer types.
Materials and Methods
TREM1 Expression Profiles in Normal Tissues and Tumors
RNA-seq data in transcripts per million (TPM) of GTEx and TCGA Pan-Cancer were downloaded from the UCSC Xena (https://xenabrowser.net/datapages/). The difference in TREM1 mRNA expression between tumor and adjacent normal tissues was analyzed for multiple cancer types using the TIMER2.0 database (http://timer.cistrome.org/).11 The abbreviations of various cancers are given in Table S1.
Clinical Samples Collection
Bladder urothelial carcinoma (BLCA), breast invasive carcinoma (BRCA), and KIRC samples and corresponding para-carcinoma normal tissues were resected from patients hospitalized in the First Affiliated Hospital of Sun Yat-sen University from 2020 to 2022. Patients are between the ages of 18 and 80. Prior to surgery, none of the patients received neoadjuvant chemotherapy or radiotherapy. This study was reviewed and approved by the Institutional Ethics Committee for Clinical Research and Animal Trials Ethical of the First Affiliated Hospital of Sun Yat-sen University. Written informed consent was obtained from participated patients. All experiments were performed in accordance with the ethical standards of the Helsinki Declaration.
RT-qPCR, Western Blot and IHC
After extracting total RNA by TRIzol, PrimeScript RT reagent kit (EZBioscience, China) and SYBR Green PCR reagent (EZBioscience, China) were used for reverse transcription and further qRT-PCR according to the manufacturer’s instruction. ACTB was used as an internal control. The primer sequences are presented in Table S2. The expression levels of TREM1 were quantified relatively using 2-ΔΔCT. The following primary antibodies were used in Western blot or IHC: anti-Vinculin rabbit polyclonal antibody (26520-1-AP, Proteintech), anti-TREM1 rabbit polyclonal antibody (11791-1-AP, Proteintech). The concentration of primary antibody was adjusted according to the manufacturer’s recommendation and the actual application. The Western blot and IHC assays were performed following the manufacturer’s protocol.
Analysis of the Relationship Between TREM1, Clinical Progression and Prognostic of Pan-Cancer
Based on the expression levels of TREM1 above, we next explored its relationship with tumor stages through The University of Alabama at Birmingham Cancer data analysis Portal (UALCAN) (http://ualcan.path.uab.edu) in pan-cancer.12 Corresponding clinical data including overall survival (OS) and disease-specific survival (DSS) for each sample from TCGA Pan-Cancer were also obtained from the UCSC Xena database. Based on the optimal cut-off point, which was calculated using the “surv_cutpoint” function of the R package “survminer”, patients were assigned to the high- or low-TREM1 expression subgroups. K-M analysis, UniCox, and MultiCox were conducted to explore the impact of TREM1 on the prognostic of patients.
Mutation Profiles of TREM1 in Pan-Cancer
The cBioPortal (www.cbioportal.org) was used to investigate the mutation landscapes of TREM1 in pan-cancer.13,14 Correlation analysis was performed to investigate the association between TREM1 expression and DNA methylation, tumor mutation burden (TMB), microsatellite instability (MSI), and tumor neoantigen (NEO) in various cancers with Pearson method.
Functional Enrichment Analysis
Differential expression analysis with the “limma” R package was performed between high and low TREM1 expression groups in the indicated tumor types. The criteria of adjusted P value <0.05 and |Fold Change| ≥1 was applied to screen the differentially expressed genes (DEGs). Gene Ontology (GO) and Kyoto Encyclopedia of Genes and Genomes (KEGG) analyses were carried out and visualized according to these DEGs using the “clusterProfiler” package.15 Gene lists sorted by log (Fold Change) generated by differential expression analysis were inputted for Gene Set Enrichment Analysis (GSEA) to determine whether 50 hallmark gene sets differ significantly between high- and low-TREM1subgroups.16 Hallmark gene sets (h.all.v7.5.1.symbols.gmt) was downloaded from the Molecular Signatures Database (http://www.gsea-msigdb.org/).17 The results of GSEA were summarized and presented in a bubble plot.
Association Between TREM1 Expression and Immunity
ESTIMATE algorithm was applied to calculate the immune and stromal scores which portrayed the abundance of stromal and immune cells in TME through the R package “ESTIMATE”.18 The immune infiltration scores of TCGA Pan-cancer, which were calculated with different quantitative methods, were obtained from the TIMER2.0 dataset. Pearson correlation analysis was conducted to evaluate the correlation between TREM1 and immune cell infiltration abundance. The results containing subsets of macrophages, monocytes, dendritic cells (DCs), myeloid-derived suppressor cells (MDSCs), neutrophils, eosinophils, CD4+ T cells, CD8+ T cells, T-regulatory lymphocytes (Tregs), NK cells, B cells, mast cells and cancer-associated fibroblasts (CAFs) across cancers were presented in a heatmap. Twenty-nine TME-related signatures, which represented the major functional components of TME (including anti-tumor microenvironment, pro-tumor microenvironment, angiogenesis fibrosis, and malignant cell properties), were obtained from Bagaev, A19 (Table S3). The scores of these signatures were calculated through single-sample gene set enrichment analysis (ssGSEA) algorithm. Signature scores of GO terms, KEGG terms, hallmark and TME gene sets were computed with ssGSEA using the “IOBR” R package20 The associations between TREM1 expression and gene sets scores in TCGA-KIRC or Pan-Cancer were evaluated by Pearson correlation analysis.
Prognostic Role of TREM1 in Immunotherapy
Transcriptomic data and matched clinical data from four ICIs therapy cohorts were collected to validate the prognostic predictive ability of TREM1 in immunotherapy. The IMmotion150 cohort (renal cell carcinoma, RCC) included 162 patients undergoing atezolizumab (anti-PDL1) or atezolizumab + bevacizumab (anti-VEGF) treatment.21 The IMmotion151 cohort (RCC) included 407 patients treated with atezolizumab + bevacizumab.22 The CheckMate cohort (RCC) contained 170 patients undergoing treatment with nivolumab (anti-PD-1).23 The IMvigor210 cohort (metastatic urothelial cancer, mUC) contains 298 patients treated with atezolizumab.24 Patients were classified into the high- or low-TREM1 expression subgroups according to the optimal cut-off value. The distribution difference of responders between high- and low-TREM1 subgroups was tested through Chi-squared test.
Drug Sensitivity Analysis in Pan-Cancer
To explore the difference in response to commonly used inhibitors and chemotherapeutics drug in high- and low-TREM1 subgroups, we conducted a drug prediction analysis. Based on the RNA-seq TPM matrix of TCGA-KIRC, the semi-inhibitory concentrations (IC50) of 237 commonly used anticancer drugs were estimated with the “pRRopheticPredict” function of the R package “pRRophetic”.25 Connectivity Map (CMap) database (https://clue.io/) is an online public tool for users to explore relationships between diseases and drugs according to the gene expression profile changes to perturbation.26 Three hundred DEGs (150 upregulated and 150 downregulated) between high- and low-TREM1 subgroups in indicated TCGA cohorts were inputted to predict potential compounds associated with TREM1 expression using the function “query”.
Statistical Analysis
Statistical differences between two groups were determined by a Wilcoxon rank-sum test. Statistical difference of the TREM1 mRNA expression levels between tumor and adjacent normal tissues was determined by a paired t-test. Kaplan–Meier survival analysis with Log rank test and UniCox analysis were applied to evaluate the prognostic role of TREM1 in TCGA Pan-cancer. Pearson correlation analysis was conducted to evaluate the correlation between TREM1 expression and immune cell infiltration abundance, ssGSEA scores, etc. P values were corrected with the adjustment method “Benjamini-Hochberg”. The Chi-squared test was used to assess the distribution difference of responders and non-responders between high- and low-TREM1 groups in immunotherapy cohorts. P value less than 0.05 was considered significant, and all P values were two-sided. All statistical data analyses were performed using R software, version 4.1.0.
Result
Expression Profiles of TREM1 in Different Tumors
Firstly, the GTEx and TCGA databases were integrated to compare the expression profiles of TREM1 in tumors and corresponding normal tissues. We found that TREM1 levels were significantly elevated in ACC, BLCA, BRCA, CESC, CHOL, COAD, ESCA, GBM, HNSC, KIRC, KIRP, LGG, OV, PAAD, READ, SKCM, STAD, TGCT, THCA, UCEC, and UCS, while decreased in ALL, KICH, LAML, LIHC, LUAD, LUSC, and PRAD (Figure 1A). Similar results were observed in paired tumors and adjacent normal tissues in the TCGA database. TREM1 was overexpressed in tumors in most cancer types except for LIHC, LUAD, and LUSC (Figure S1A). qRT-PCR was then applied to compare the mRNA transcript levels of TREM1 in paired tumor and adjacent normal tissues from clinical samples of KIRC, BLCA, and BRCA. The results acquired revealed that the expression of TREM1 was significantly upregulated in tumor samples (Figure 1B). Western blot and IHC staining were conducted to confirm these mRNA expression patterns at the protein level (Figure 1C–E). Through the UALCAN database, we further investigated the association between TREM1 expression and American Joint Committee on Cancer (AJCC) stage. The results demonstrated that the expression of TREM1 was significantly upregulated in advanced AJCC stages in BLCA, COAD, ESCA, HNSC, KIRC, KIRP, READ, STAD, THCA, and UCEC (Figure S1B).
 |
Figure 1 TREM1 expression profiles in normal tissues and tumors. (A) Expression level of TREM1 between tumor and normal tissues in pan-cancer according to the integrated data from GTEx and TCGA datasets. (B) mRNA expression of TREM1 in KIRC, BLCA and BRCA patients assessed by qRT-PCR analysis. (C) Protein expression of TREM1 detected by Western blot in paired KIRC and adjacent normal tissues. (D) Western blot protein detection of theTREM1 expression levels in paired normal tissues and BLCA (left panel), BRCA (right panel) tissues. (E) IHC of TREM1 in paired KIRC and adjacent normal tissues. Abbreviations: BLCA, bladder urothelial carcinoma; BRCA, breast invasive carcinoma; GTEx, Genotype-Tissue Expression; IHC, immunohistochemistry; TCGA, The Cancer Genome Atlas; TPM, transcripts per million. Notes: *P < 0.05, **P < 0.01, ***P < 0.001. Abbreviation list of tumor cohorts from TCGA is given in Table S1. |
Prognostic Role of TREM1 in Pan-Cancer
To investigate the prognostic value of TREM1 in pan-cancer, we conducted K-M and UniCox analysis to reveal the association between patients’ OS or DSS and the expression of TREM1 in primary solid tumor. The results of K-M analysis suggested that an elevated TREM1 expression significantly related to the worse OS in several cancers, including CESC, ESCA, GBM, HNSC, KIRC, KIRP, LGG, LIHC, LUSC, MESO, OV, PAAD, SARC, SKCM, STAD, and UCEC (Figure 2). Unicox results suggested that TREM1 was a risk factor for OS of CESC, GBM, KIRC, LIHC, LGG, LUSC, OV, and PAAD tumors. In addition, a high TREM1 expression indicated a worse DSS in patients with CESC, GBM, KIRC, LIHC, LGG, LUSC, OV, PAAD, PRAD, and UCEC (Figure S2A). Of note, TREM1 was a protective factor for DSS of LUAD (Figure S2B). Further multiCox analysis revealed that TREM1 was an independent prognostic factor in CESC, KIRC, LGG, LIHC, LUSC, and OV (Figure S2C–J). These results confirmed that the abnormal expression of TREM1 in tumor was linked with the unfavorable outcome of patients with various cancers.
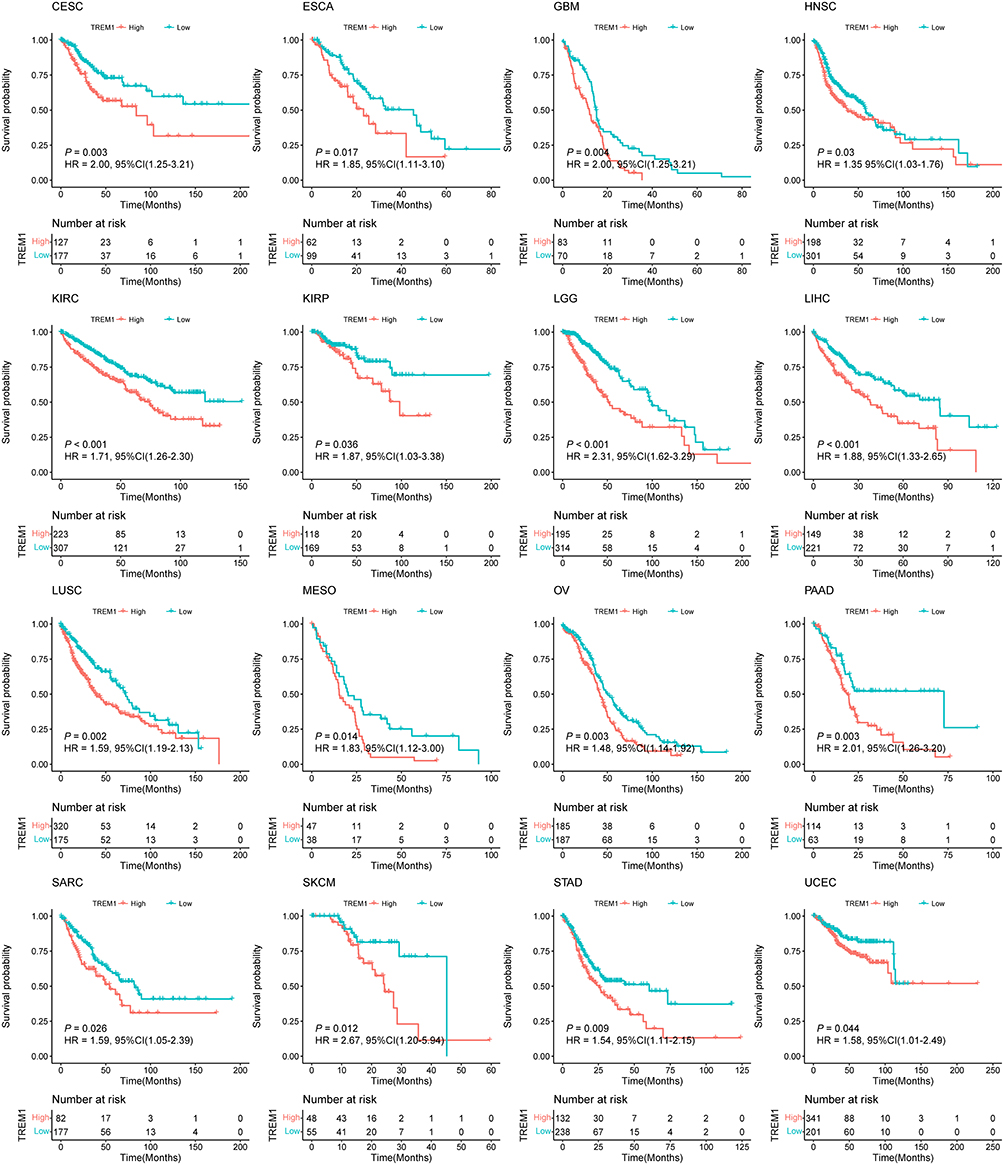 |
Figure 2 Prognostic value of TREM1 in TCGA pan-cancer. K-M curves of overall survival stratified by the low- and high-expression of TREM1 in indicated cancers. Log rank test was applied to calculate the P values. Abbreviation: TCGA, The Cancer Genome Atlas. Note: Abbreviation list of tumor cohorts from TCGA is given in Table S1. |
Landscape of TREM1 Gene Mutation in Pan-Cancer
In consideration of the possibility that aberrant expression of TREM1 in tumors might be induced by gene alterations, we explored the mutation landscape of TREM1 in TCGA pan-cancer employing cBioPortal database. Figure 3A and B showed that TREM1 altered less than 6% in most cancers. Amplification was the primary alteration type, while deep deletion was rare. Notably, the alteration frequency of TREM1 in KIRC was approximately 0%. A total of 63 mutations were detected in TREM1 (including 51 missense, 8 truncating, and 4 splice) (Figure 3C). Furthermore, a negative correlation between expression level and promoter methylation level of TREM1 was observed (Figure 3D). Additionally, we discovered a positive association between the expression level of TREM1 and TMB, MSI, and NEO in several cancers (Figure 3E–G).
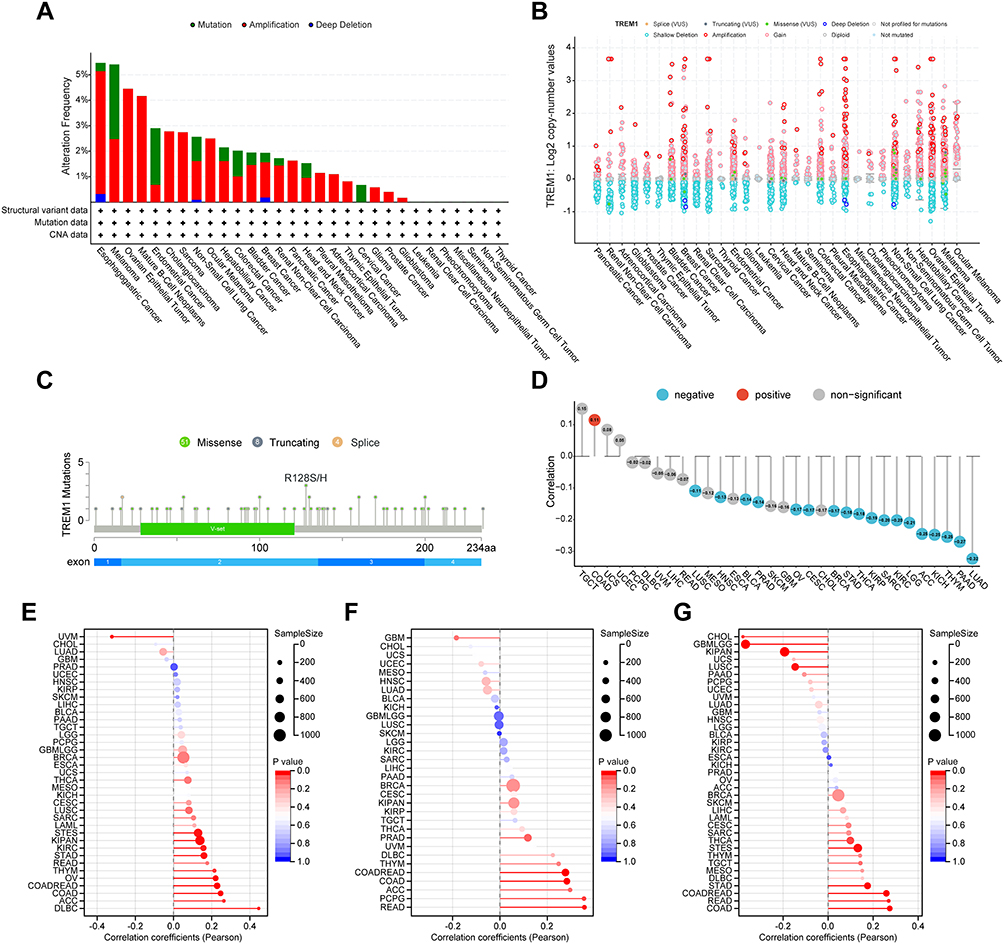 |
Figure 3 Mutation landscape of TREM1 in pan-cancer. (A and B) Mutation frequency (A) and general mutation count (B) of TREM1 in multiple TCGA pan-cancer studies according to the cBioPortal database. (C) Mutation diagram of TREM1 across protein domains in various cancers. (D) Correlations between TREM1 expression and DNA methylation in pan-cancer. (E–G) Correlations between TREM1 expression and TMB (E), MSI (F), and NEO (G) in pan-cancer. Abbreviations: MSI, microsatellite instability; NEO, neoantigen; TCGA, The Cancer Genome Atlas; TMB, tumor mutation burden. Note: Abbreviation list of tumor cohorts from TCGA is given in Table S1. |
Enrichment Analysis of TREM1
To further explore the potential biological characteristics with TREM1-related genes, we screened the DEGs based on TREM1 expression and conducted enrichment analysis on DEGs in KIRC. For GO results, TREM1 expression was correlated with regulation of immune effector process, acute inflammatory response, myeloid leukocyte migration, complement activation, immune receptor activity, collagen-containing extracellular matrix, etc. (Figure S3A). For KEGG results, TREM1 was related to complement and coagulation cascades, IL-17 signaling pathway, TNF signaling pathway, and NF-κB signaling pathway (Figure S3B). Based on the result of differential expression analysis between high- and low-TREM1 groups across 16 indicated cancer types, GSEA analysis was conducted to dissect the underlying biological processes/pathways associated with TREM1 in various cancers. The result displayed that pathways related to immune regulation, including inflammatory response, TNFα-signaling-via-NFκB, IFN-α/IFN-γ response, IL2-STAT5-signaling, IL6-JAK-STAT3 signaling, and complement were enriched in the high-TREM1 group (Figures S3C and S4), with a high degree of consistency across various tumor types. Moreover, the high-TREM1 group showed a remarkable enrichment in angiogenesis, epithelial–mesenchymal transition (EMT), hypoxia, glycolysis, and TGF-β signaling in pan-cancer (Figures S3D and S4). Additionally, TREM1 had a significant negative correlation with oxidative phosphorylation and correlated moderately with adipogenesis and fatty acid metabolism in certain kinds of tumors, especially in KIRC (Figures S3E and S4). In brief, these results demonstrated that TREM1 played an important role in the processes of the immune response and tumor progression.
Immune Cell Infiltration Analysis of TREM1 in Pan-Cancer
Based on the data downloaded from the TIMER database, we dug into the correlation between TREM1 expression and immune cell infiltration abundance in various cancers. TREM1 was found positively associated with the abundance of Macrophage.M2, Macrophage.M0, Neutrophils, and Tregs, but inversely correlated with the abundance of immune killer cells including Macrophage.M1, CD8+ T cells, and activated NK cells in pan-cancer, especially in KIRC (Figure 4A). Furthermore, the TME scores calculated with ESTIMATE algorithm, including the Immune and Stromal scores, were positively correlated with TREM1 levels across multiple cancers (Figure 4B). A similar trend was also observed with infiltration levels computed using other algorithms, like XCELL, MCPCOUNTER, EPIC, QUANTISEQ, and TIDE (Figure S5). Through Pearson correlation analysis, we then assessed the association between TREM1 and immune-modulatory genes across multiple cancer types. Figure S6A showed that TREM1 was positively correlated with a majority of immune co-inhibitory markers (such as CD274, CD276, CTLA4, and HAVCR2) in most cancers except in UCS and UVM. In addition, the TREM1 expression levels were positively correlated with cell surface molecules: ICAM1, and ITG, and proinflammatory cytokine: IL1A, IL1B, and IL2RA in pan-cancer (Figure S6B). A positive correlation was also observed between the expression of TREM1 and the most of immune stimulatory genes in COAD, GBM, LGG, KICH, OV, PAAD, PRAD, READ and, THCA; while a negative correlation was found only in LUAD (Figure S6B). Collectively, these results revealed that TREM1 might be involved in TME shaping and the immune suppression induced by T cell exhaustion.
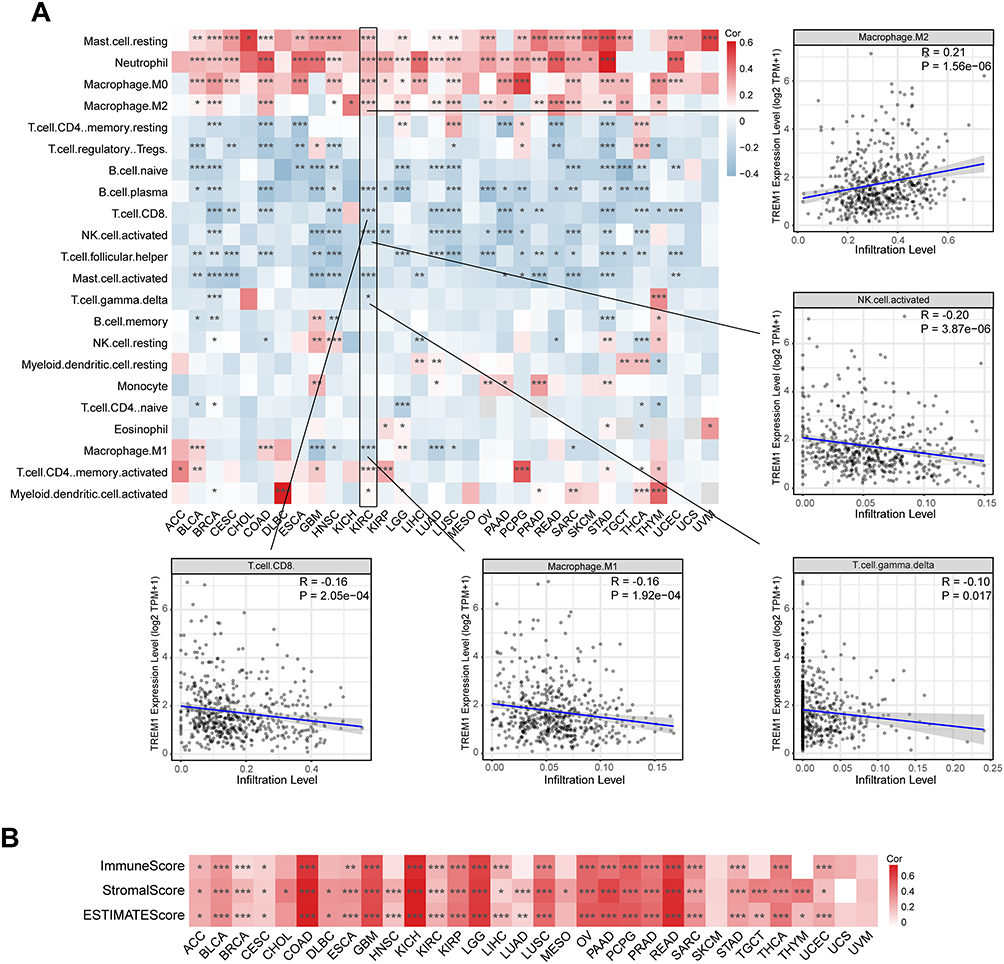 |
Figure 4 Correlations between TREM1 expression and immune cell infiltration abundance in cancers. (A) Heatmap displaying the correlations between TREM1 expression and infiltration levels of 22 immune cells calculated by CIBERSORT in pan-cancer. (B) Heatmap displaying the correlations between TREM1 expression and estimate scores in pan-cancer. *P < 0.05, **P < 0.01, ***P < 0.001. Abbreviation list of tumor cohorts from TCGA is given in Table S1. |
Exploration of the Relationship Between TREM1 and Immune Components Based on ssGSEA
In the analysis of 29 TME-related signatures, TREM1 exhibited a significant positive association with most of the signatures, which reflected the pro-tumor microenvironment, angiogenesis fibrosis, and malignant cell properties (Figure 5A). Intriguingly, TREM1 showed a positive association with section of the signatures in anti-tumor microenvironment (Figure 5A). TREM1 was also positively correlated with multiple pro-tumor signaling pathways and biological processes of immune response related to macrophages, while exhibited a negative association with biological processes involved in anti-tumor immunity, including antigen processing and presentation, T cell-mediated cytotoxicity, and response to cancer cell and others (Figure 5A). In addition, in ssGSEA of hallmark terms, TREM1 showed a strong positive correlation with immune-related gene sets and pro-tumor gene sets (Figure 5B) in pan-cancer, which was consistent with the results obtained from GSEA in KIRC as described in the previous section. Moreover, scatter plots of TREM and signature scores of MDSC, T cell exhaustion, immune checkpoint, and CAF in various cancers exhibited a significant positive correlation (Figure 5C). These results in conjunction revealed that a higher expression of TREM1 represented a more malignant pro-tumor environment with characteristics of immune exhaustion and fibrosis.
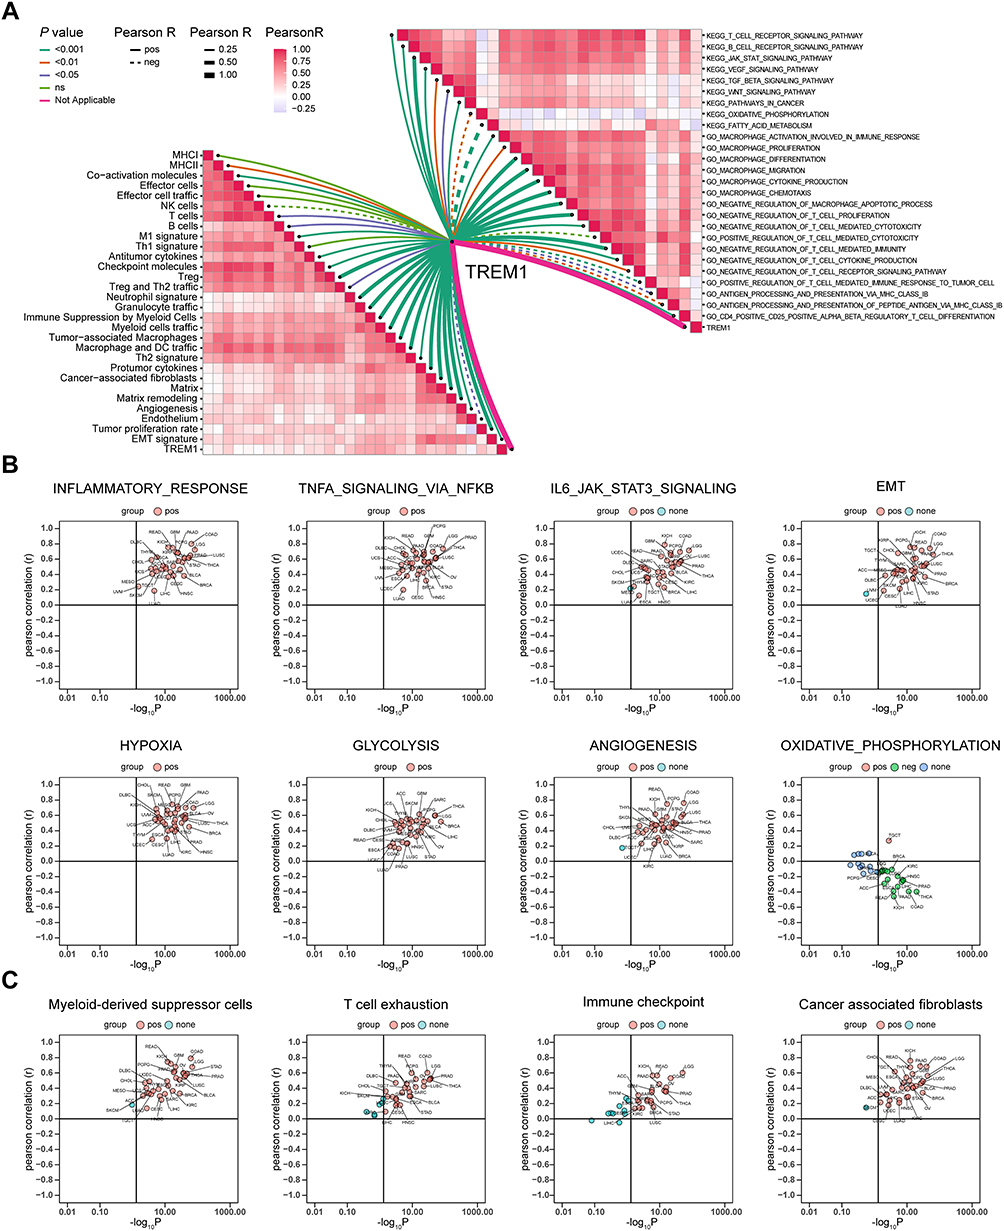 |
Figure 5 Exploration of the relationship between TREM1 and immune components based on ssGSEA algorithm. (A) Butterfly plot displaying the correlation between TREM1 and TME-related signatures (left panel), KEGG terms, and GO terms (right panel) in KIRC. (B and C) Correlations between TREM1 expression and ssGSEA scores of hallmark (B) or TME (C) gene sets in TCGA pan-cancer. Abbreviations: KIRC, Kidney renal clear cell carcinoma; ssGSEA, single-sample gene set enrichment analysis; TCGA, The Cancer Genome Atlas; TME, tumor microenvironment. Note: Abbreviation list of tumor cohorts from TCGA is given in Table S1. |
Relationship Between TREM1 and the Outcome of Immunotherapy
The results from the correlation analysis between TREM1 and TMB, MSI, and NEO implied that TREM1 could serve as a biomarker in predicting the effects of ICIs. Therefore, we evaluated the predictive efficiency of TREM1 for prognosis and response in patients who received ICIs. However, elevated TREM1 was linked to a worse progression-free survival in patients with RCC in the IMmotion150 cohort (P < 0.001, HR = 1.93) and IMmotion151 cohort (P = 0.02, HR = 1.35) (Figure 6A and B). A similar tendency was seen in patients with RCC which received anti-PD1 therapy in the CheckMate cohort (P = 0.13, HR = 1.35) (Figure 6C). In addition, in the mUC of the IMvigor210 cohort, patients with high-TREM1 levels presented decreased survival time than those with low-TREM1 levels (P = 0.031, HR = 1.40) (Figure 6D). Furthermore, there was a significant difference in responders and non-responders to anti-PDL1 therapy between high- and low-TREM1 subgroups in the IMmotion150 cohort (P < 0.001) (Figure 6E). Elevated rates of response to immunotherapy were observed in patients with low TREM1 expression (77% vs 45%). A similar trend was observed in the IMvigor210 cohort (P = 0.057, 29% vs 19%) (Figure 6F). It was concluded that patients with high TREM1 expression did not benefit from anti-PD1/PDL1 immunotherapy, which implied TREM1 might impinge on anti-tumor immunity through other ways.
 |
Figure 6 Predictive value of TREM1 in immunotherapy efficacy. (A and B) Kaplan–Meier survival curve of PFS between high- and low-TREM1 subgroups in the IMmotion150 cohort (A) and the IMmotion151 cohort (B). (C and D) Kaplan–Meier survival curve of OS between high- and low-TREM1 subgroups in the CheckMate cohort (C) and the IMvigor210 cohort (D). Log rank test was applied to calculate the P values. (E) Bar charts representing the proportion of patients in high- and low-TREM1 subgroups that responded to immunotherapy in the IMmotion150 cohort. (F) Bar charts representing the proportion of patients in high- and low-TREM1 subgroups that responded to immunotherapy in the IMvigor210 cohort. Abbreviations: CR, complete response; OS, overall survival; ORR, objective response rate; PD, progressive disease; PFS, progression-free survival; PR, partial response; SD, stable disease. |
Identification of Potential Inhibitors/ Compounds Targeting TREM1 in Pan-Cancer
To explore the potential regimen for the treatment of patients in the high-TREM1 subgroup, we estimated the IC50 of commonly used inhibitors or chemotherapy drugs according to the transcription profile. The result showed that the IC50 values for seven inhibitors (ie, sunitinib, tivozanib, linifanib, foretinib, cetuximab, gefitinib, and lapatinib) were lower in the patients from the high-TREM1 subgroup (Figure 7A). In addition, the IC50 values of 3 broad-spectrum chemotherapeutic drugs (ie, cisplatin, vinblastine, and mitomycin) was found relatively lower in the high-TREM1 group (Figure 7A). Next, the TREM1-associated drugs in various cancers were screened using the “query” function of the CMap dataset. The result of top 60 compounds (30 negatively correlated and 30 positively correlated) are summarized and presented in the heatmap (Figure 7B). The higher predicted score indicated that the changes in the gene expression profile induced by drugs were more similar to the expression profile characteristic in high-TREM1 subgroup. The compounds like tozasertib, TPCA-1, BRD-K30351863, fostamatinib, and selumetinib, which showed a high degree of consistency across various cancer types, may attenuate the functional changes associated with high TREM1 expression. Therefore, patients with high expression of TREM1 may benefit from treatment with a combination of compounds with low predicted scores and ICIs. Collectively, the results of collated from the drug-efficiency prediction analysis provide a new perspective on the clinical decision-making for the treatment of patients with high TREM1 expression. However, further experiments are required to investigate the correlations between these drugs and TREM1.
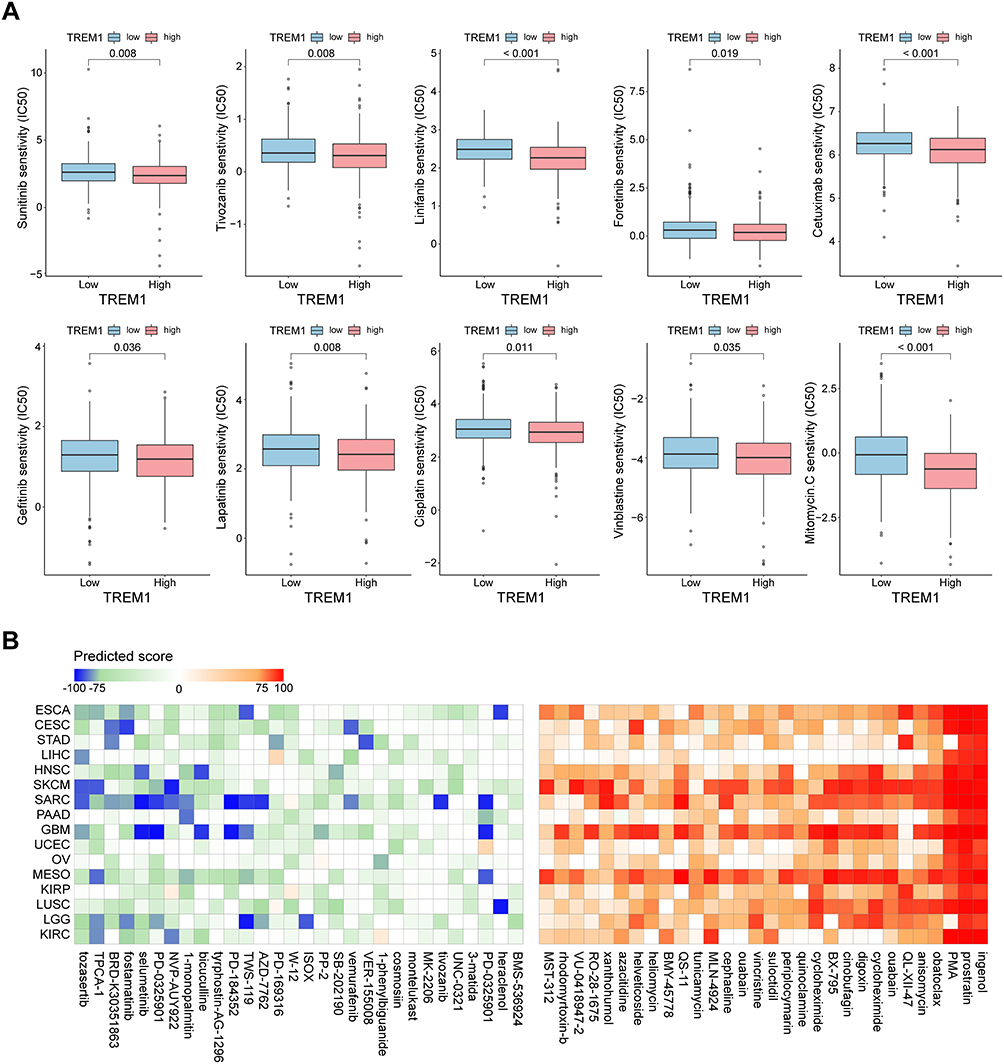 |
Figure 7 Therapeutic response prediction based on pRRopheticPredict and Connectivity Map analysis. (A) Boxplot displaying difference of the sensitivities to the chemotherapy drugs between patients with a high expression of TREM1 and a low expression of TREM1 in KIRC. (B) Heatmap showing predicted score (positive in red, negative in blue) of top 60 compounds (30 negatively correlated and 30 positively correlated) from the Connectivity Map for indicated cancer type. KIRC, Kidney renal clear cell carcinoma. Abbreviation list of tumor cohorts from TCGA is given in Table S1. |
Discussion
Inflammation seems to play a very complex role in tumors. It is generally believed that hot tumors characterized by high lymphocyte infiltration have better prognosis and immune response than cold tumors. However, an expanding body of evidence suggest that chronic inflammation is an important factor in the occurrence and development of tumors. As early as 1863, it was proposed that tumors originated from chronic inflammation.27 Some studies have found that about 90% of tumors are induced by acquired factors, and the commonness is that persistent chronic inflammation occurs after the homeostasis of the internal environment is broken.28 The roles of some anti-inflammatory drugs in inhibiting tumors have also been explored. For example, long-term aspirin treatment can prevent lung cancer, while flurbiprofen can significantly inhibit tumor metastasis.3 Although the relationship between chronic inflammation, TME and tumor progression has been well established, its mechanism is complex as numerous factors are involved. Chronic inflammation is a repetitive wound repair process, accompanied by instability of genome repair; a variety of inflammatory chemokines cause the aggregation of a variety of immune cells; chronic infection induces T cell exhaustion due to prolonged exposure of T cells to antigens.29,30
Among the above inducements, myeloid cells recruited into the microenvironment also play an important role in tumor progression.31 TREM family receptors, especially TREM1, have attracted more and more researchers’ attention. The TREM family of receptors is expressed only in bone marrow cells. TREM1 is the most characteristic receptor of the TREM family, which is expressed on the cell surface of monocytes and neutrophils.32 TREM1, as an amplifier and promoter of inflammatory reaction, promotes and maintains chronic inflammation.33 TREM1 is also a biomarker for numerous inflammatory diseases, and the increased expression of TREM1 in biological fluids represents inflammatory damage to the corresponding organs.34 At the same time, there is increasing evidence suggesting that TREM1 plays a role in the development of solid tumors. The overexpression of TREM1 in lung, breast, and colon cancer indicates a poor prognosis.35–37 Since TREM1 is expressed only in myeloid cells, its tumor-promoting and immunosuppressive effects do not seem to be affected by tumor heterogeneity, thus providing the dual possibility of using TREM1 as a prognosis biomarker and a therapeutic target in pan-cancer. Through collection and analysis of pan-cancer transcriptome and related data, we investigated the association between TREM1 and tumor prognosis as well as immunity, thereby providing important information regarding its potential applicability in tumor diagnosis and treatment.
First, we found that TREM1 was up-regulated significantly in 20 tumor tissues and down-regulated in 6 tumor tissues based on the GTEx and TCGA datasets. Additionally, the expression of TREM1 in KIRC, THCA, UCEC, KIRP, and READ was closely related to the clinical stage. In the evaluation of TREM1 and patients’ clinical prognosis, TREM1 was recognized as a prognostic risk factor for OS in 16 tumors.
Next, we explored the mutation landscape of TREM1 in pan-cancer. We found the alteration frequency of TREM1 was lower than 6% and the expression level of TREM1 was inversely correlated to DNA methylation in a majority of cancers. Thus, these results demonstrated that the aberrant expression of TREM1 in tumors might be ascribed to the decrease of DNA methylation of the TREM1 promoter. Functional enrichment analysis revealed that elevated expression of TREM1 was closely related to immune response signaling pathways (ie, IL6-JAK-STAT3 signaling, IL2-STAT5-signaling, and TNFα-signaling-via-NFκB) and pro-tumor gene sets (ie, EMT, hypoxia, angiogenesis, and glycolysis) in diverse cancers, especially in KIRC. In addition, we observed that TREM1 is correlated with myeloid-derived cells (ie, M0 macrophage, M2 macrophage, dendritic cell, neutrophil, MDSC, excluding M1 macrophage) and the several pro-tumor microenvironment components (ie, exhausted T cell, Treg, and CAF) in most cancers. Moreover, TREM1 showed a significant negative association with anti-tumor microenvironment components (ie, M1 macrophage, NK cell, CD4+ T cell, CD8+T cell, and γδ T cell) and gene sets scores reflecting anti-tumor immunity (ie, antigen processing and presentation, T cell-mediated cytotoxicity, and response to cancer cells). These observations imply that TREM1 is crucial for immunosuppression and may act by dampening the activity of T cells. Collectively, these results demonstrate that excessive inflammatory activation and chronic inflammation in the TME are not conducive to anti-tumor immunity and may lead to the depletion of T cells and promote tumor progression, which was consistent with previous studies.38–42
Then we investigated the association between TREM1 and the effect of anti-PD1/PDL1 immunotherapy using four independent ICIs treatment cohorts. The results suggested that the higher the expression of TREM1, the worse the prognosis of and response to anti-PD1/PDL1 treatment. The above results indicate that TREM1 has a strong predictive value for immunotherapy efficacy. According to the previous research results, blocking TREM1 might be a promising strategy for the reinvigoration of CD8+ T cell to exert its anti-tumor activity and improve the efficiency of anti-PD1/PDL1 immunotherapy in RCC and mUC.43
Lastly, we identified inhibitors or compounds related to TREM1 expression through drug sensitivity analysis aimed to improve the prognosis of high-TREM1 patients. The high-TREM1 group in KIRC was speculated more sensitive to inhibitors (ie, sunitinib, tivozanib, linifanib, foretinib, gefitinib), whose effectiveness in KIRC and other tumors have been substantiated.44–47 Through CMap analysis, several compounds like tozasertib, TPCA-1, BRD-K30351863, fostamatinib, and selumetinib were identified, which might inhibit the transcriptional changes and immunosuppression induced by TREM1 across multiple cancers. However, the anti-tumor activities of these drugs should be further investigated in vitro and vivo.
This study does have certain limitations. Being a retrospective study, our data are mainly obtained from public databases which inevitably leads to internal bias. Large-scale clinical studies are required to further verify. In addition, the specific mechanism of TREM1 needs to be further elucidated and verified experimentally. Moreover, the specific mechanisms by which the potential drugs identified interact with TREM1 need to be further clarified and studied to provide direct evidence for their applicability.
In summary, TREM1 was explored in tumor development and immunosuppression by conducting a comprehensive and systematic analysis of its role in pan-cancer. The abnormal expression of TREM1 closely correlates with the undesirable prognosis, immune cell infiltration, and immune regulation in many tumors, which highlights its potential as a tumor prognosis biomarker and a new target for immunotherapy.
Abbreviation
AJCC, American Joint Committee on Cancer; CAFs, cancer-associated fibroblasts; CMap, The Connectivity Map; DCs, dendritic cells; DSS, disease-specific survival; DEGs, differentially expressed genes; EMT, epithelial–mesenchymal transition; GO, Gene Ontology; GSEA, Gene Set Enrichment Analysis; GTEx, Genotype-tissue expression; IC50, semi-inhibitory concentration; ICI, immune checkpoint inhibitor; IHC, immunohistochemistry; KEGG, Kyoto Encyclopedia of Genes and Genomes; K-M, Kaplan-Meier; MDSCs, myeloid-derived suppressor cells; MSI, microsatellite instability; mUC, metastatic urothelial cancer; MultiCox, multivariate Cox regression; NEO, tumor neoantigen; OS, overall survival; qRT-PCR, quantitative real-time PCR; RCC, renal cell carcinoma; ssGSEA, single-sample gene set enrichment analysis; TCGA, The Cancer Genome Atlas; TMB, tumor mutation burden; TME, tumor microenvironment; TPM, transcripts per million; Tregs, T-regulatory lymphocytes; TREM1, triggering receptors expressed by myeloid cells-1; UniCox, univariate Cox regression; UALCAN, The University of Alabama at Birmingham Cancer data analysis Portal. Abbreviation list of cancers in TCGA are in Table S1.
Data Sharing Statement
The datasets supporting the conclusions of this article are available in the UCSC Xena (https://xenabrowser.net/datapages/), cBioPortal (www.cbioportal.org), TIMER2.0 (http://timer.cistrome.org/), and published research, which have been described in Method.
Ethics Statement
The studies involving human participants were reviewed and approved by Institutional Ethics Committee for Clinical Research and Animal Trials Ethical of the First Affiliated Hospital of Sun Yat-sen University [(2021)143], [(2021)144]. The patients/participants provided their written informed consent to participate in this study.
Consent for Publication
Written informed consent for publication was obtained from all participants.
Acknowledgment
We would like to express our sincere appreciation to UCSC Xena, UALCAN, TIMER2.0, cBioPortal, and CMap for providing the data used in this study.
Author Contributions
All authors made a significant contribution to the work reported, whether that is in the conception, study design, execution, acquisition of data, analysis and interpretation, or in all these areas; XZ and KL took part in drafting, revising the article, which was critically reviewed and edited by JC and PL; all authors gave final approval of the version to be published and agreed on the journal to which the article has been submitted; all authors agreed to be accountable for all aspects of the work.
Funding
This work was supported by The National Science Fund for Distinguished Young Scholars of China (No.81725016), and The National Natural Science Foundation of China (No.81872094, No.82272862).
Disclosure
The authors declare that the research was conducted in the absence of any commercial or financial relationships that could be construed as a potential conflict of interest.
References
1. Giraldo NA, Sanchez-Salas R, Peske JD, et al. The clinical role of the TME in solid cancer. Br J Cancer. 2019;120(1):45–53. doi:10.1038/s41416-018-0327-z
2. Wen Y, Zhu Y, Zhang C, et al. Chronic inflammation, cancer development and immunotherapy. Front Pharmacol. 2022;13:1040163. doi:10.3389/fphar.2022.1040163
3. Coussens LM, Werb Z. Inflammation and cancer. Nature. 2002;420(6917):860–867. doi:10.1038/nature01322
4. Colotta F, Allavena P, Sica A, Garlanda C, Mantovani A. Cancer-related inflammation, the seventh hallmark of cancer: links to genetic instability. Carcinogenesis. 2009;30(7):1073–1081. doi:10.1093/carcin/bgp127
5. Singh H, Rai V, Nooti SK, Agrawal DK. Novel ligands and modulators of triggering receptor expressed on myeloid cells receptor family: 2015–2020 updates. Expert Opin Ther Pat. 2021;31(6):549–561. doi:10.1080/13543776.2021.1883587
6. Bouchon A, Dietrich J, Colonna M. Cutting edge: inflammatory responses can be triggered by TREM-1, a novel receptor expressed on neutrophils and monocytes. J Immunol. 2000;164(10):4991–4995. doi:10.4049/jimmunol.164.10.4991
7. Gibot S, Le Renard PE, Bollaert PE, et al. Surface triggering receptor expressed on myeloid cells 1 expression patterns in septic shock. Intensive Care Med. 2005;31(4):594–597. doi:10.1007/s00134-005-2572-x
8. Barraud D, Gibot S. Triggering receptor expressed on myeloid cell 1. Crit Care Clin. 2011;27(2):265–279. doi:10.1016/j.ccc.2010.12.006
9. Pittet MJ, Michielin O, Migliorini D. Clinical relevance of tumour-associated macrophages. Nat Rev Clin Oncol. 2022;19(6):402–421. doi:10.1038/s41571-022-00620-6
10. Zhao Y, Zhang C, Zhu Y, et al. TREM1 fosters an immunosuppressive tumor microenvironment in papillary thyroid cancer. Endocr Relat Cancer. 2022;29(2):71–86. doi:10.1530/ERC-21-0297
11. Li T, Fan J, Wang B, et al. TIMER: a web server for comprehensive analysis of tumor-infiltrating immune cells. Cancer Res. 2017;77(21):e108–e110. doi:10.1158/0008-5472.CAN-17-0307
12. Chandrashekar DS, Karthikeyan SK, Korla PK, et al. UALCAN: an update to the integrated cancer data analysis platform. Neoplasia. 2022;25:18–27. doi:10.1016/j.neo.2022.01.001
13. Cerami E, Gao J, Dogrusoz U, et al. The cBio cancer genomics portal: an open platform for exploring multidimensional cancer genomics data. Cancer Discov. 2012;2(5):401–404. doi:10.1158/2159-8290.CD-12-0095
14. Gao J, Aksoy BA, Dogrusoz U, et al. Integrative analysis of complex cancer genomics and clinical profiles using the cBioPortal. Sci Signal. 2013;6(269):pl1. doi:10.1126/scisignal.2004088
15. Yu G, Wang LG, Han Y, He QY. clusterProfiler: an R package for comparing biological themes among gene clusters. OMICS. 2012;16(5):284–287. doi:10.1089/omi.2011.0118
16. Subramanian A, Tamayo P, Mootha VK, et al. Gene set enrichment analysis: a knowledge-based approach for interpreting genome-wide expression profiles. Proc Natl Acad Sci U S A. 2005;102(43):15545–15550. doi:10.1073/pnas.0506580102
17. Liberzon A, Birger C, Thorvaldsdottir H, Ghandi M, Mesirov JP, Tamayo P. The molecular signatures database (MSigDB) hallmark gene set collection. Cell Syst. 2015;1(6):417–425. doi:10.1016/j.cels.2015.12.004
18. Yoshihara K, Shahmoradgoli M, Martinez E, et al. Inferring tumour purity and stromal and immune cell admixture from expression data. Nat Commun. 2013;4:2612. doi:10.1038/ncomms3612
19. Bagaev A, Kotlov N, Nomie K, et al. Conserved pan-cancer microenvironment subtypes predict response to immunotherapy. Cancer Cell. 2021;39(6):845–865 e847. doi:10.1016/j.ccell.2021.04.014
20. Zeng D, Ye Z, Shen R, et al. IOBR: multi-omics immuno-oncology biological research to decode tumor microenvironment and signatures. Front Immunol. 2021;12:687975. doi:10.3389/fimmu.2021.687975
21. Banchereau R, Leng N, Zill O, et al. Molecular determinants of response to PD-L1 blockade across tumor types. Nat Commun. 2021;12(1):3969. doi:10.1038/s41467-021-24112-w
22. Motzer RJ, Banchereau R, Hamidi H, et al. Molecular subsets in renal cancer determine outcome to checkpoint and angiogenesis blockade. Cancer Cell. 2020;38(6):803–817.e804. doi:10.1016/j.ccell.2020.10.011
23. Braun DA, Hou Y, Bakouny Z, et al. Interplay of somatic alterations and immune infiltration modulates response to PD-1 blockade in advanced clear cell renal cell carcinoma. Nat Med. 2020;26(6):909–918. doi:10.1038/s41591-020-0839-y
24. Mariathasan S, Turley SJ, Nickles D, et al. TGFbeta attenuates tumour response to PD-L1 blockade by contributing to exclusion of T cells. Nature. 2018;554(7693):544–548. doi:10.1038/nature25501
25. Geeleher P, Cox N, Huang RS, Barbour JD. pRRophetic: an R package for prediction of clinical chemotherapeutic response from tumor gene expression levels. PLoS One. 2014;9(9):e107468. doi:10.1371/journal.pone.0107468
26. Subramanian A, Narayan R, Corsello SM, et al. A next generation connectivity map: L1000 platform and the first 1,000,000 profiles. Cell. 2017;171(6):1437–1452 e1417. doi:10.1016/j.cell.2017.10.049
27. Balkwill F, Mantovani A. Inflammation and cancer: back to Virchow? Lancet. 2001;357(9255):539–545. doi:10.1016/S0140-6736(00)04046-0
28. Greten FR, Grivennikov SI. Inflammation and cancer: triggers, mechanisms, and consequences. Immunity. 2019;51(1):27–41. doi:10.1016/j.immuni.2019.06.025
29. Kidane D, Chae WJ, Czochor J, et al. Interplay between DNA repair and inflammation, and the link to cancer. Crit Rev Biochem Mol Biol. 2014;49(2):116–139. doi:10.3109/10409238.2013.875514
30. Gao Z, Feng Y, Xu J, Liang J. T-cell exhaustion in immune-mediated inflammatory diseases: new implications for immunotherapy. Front Immunol. 2022;13:977394. doi:10.3389/fimmu.2022.977394
31. Yang M, McKay D, Pollard JW, Lewis CE. Diverse functions of macrophages in different tumor microenvironments. Cancer Res. 2018;78(19):5492–5503. doi:10.1158/0008-5472.CAN-18-1367
32. Muller M, Haghnejad V, Lopez A, et al. Triggering receptors expressed on myeloid cells 1: our new partner in human oncology? Front Oncol. 2022;12:927440. doi:10.3389/fonc.2022.927440
33. Sharif O, Knapp S. From expression to signaling: roles of TREM-1 and TREM-2 in innate immunity and bacterial infection. Immunobiology. 2008;213(9–10):701–713. doi:10.1016/j.imbio.2008.07.008
34. Bosco MC, Raggi F, Varesio L. Therapeutic potential of targeting TREM-1 in inflammatory diseases and cancer. Curr Pharm Des. 2016;22(41):6209–6233. doi:10.2174/1381612822666160826110539
35. Pullikuth AK, Routh ED, Zimmerman KD, et al. Bulk and single-cell profiling of breast tumors identifies TREM-1 as a dominant immune suppressive marker associated with poor outcomes. Front Oncol. 2021;11:734959. doi:10.3389/fonc.2021.734959
36. Fontana R, Raccosta L, Rovati L, et al. Nuclear receptor ligands induce TREM-1 expression on dendritic cells: analysis of their role in tumors. Oncoimmunology. 2019;8(3):1554967. doi:10.1080/2162402X.2018.1554967
37. Weber B, Schuster S, Zysset D, et al. TREM-1 deficiency can attenuate disease severity without affecting pathogen clearance. PLoS Pathog. 2014;10(1):e1003900. doi:10.1371/journal.ppat.1003900
38. Elinav E, Nowarski R, Thaiss CA, Hu B, Jin C, Flavell RA. Inflammation-induced cancer: crosstalk between tumours, immune cells and microorganisms. Nat Rev Cancer. 2013;13(11):759–771. doi:10.1038/nrc3611
39. Locati M, Curtale G, Mantovani A. Diversity, mechanisms, and significance of macrophage plasticity. Annu Rev Pathol. 2020;15:123–147. doi:10.1146/annurev-pathmechdis-012418-012718
40. Park JH, Ameri AH, Dempsey KE, et al. Nuclear IL-33/SMAD signaling axis promotes cancer development in chronic inflammation. EMBO J. 2021;40(7):e106151. doi:10.15252/embj.2020106151
41. Liu C-H, Chen Z, Chen K, et al. Lipopolysaccharide-mediated chronic inflammation promotes tobacco carcinogen-induced lung cancer and determines the efficacy of immunotherapy. Cancer Res. 2021;81(1):144–157. doi:10.1158/0008-5472.CAN-20-1994
42. Kong Y, Feng Z-C, Zhang Y-L, et al. Identification of immune-related genes contributing to the development of glioblastoma using weighted gene co-expression network analysis. Front Immunol. 2020;11:1281. doi:10.3389/fimmu.2020.01281
43. Wu Q, Zhou W, Yin S, et al. Blocking triggering receptor expressed on myeloid cells-1-positive tumor-associated macrophages induced by hypoxia reverses immunosuppression and anti-programmed cell death ligand 1 resistance in liver cancer. Hepatology. 2019;70(1):198–214. doi:10.1002/hep.30593
44. Rini BI, Pal SK, Escudier BJ, et al. Tivozanib versus sorafenib in patients with advanced renal cell carcinoma (TIVO-3): a Phase 3, multicentre, randomised, controlled, open-label study. Lancet Oncol. 2020;21(1):95–104. doi:10.1016/S1470-2045(19)30735-1
45. Cainap C, Qin S, Huang W-T, et al. Linifanib versus Sorafenib in patients with advanced hepatocellular carcinoma: results of a randomized Phase III trial. J Clin Oncol. 2015;33(2):172–179. doi:10.1200/JCO.2013.54.3298
46. Fujino T, Suda K, Koga T, et al. Foretinib can overcome common on-target resistance mutations after capmatinib/tepotinib treatment in NSCLCs with MET exon 14 skipping mutation. J Hematol Oncol. 2022;15(1):79. doi:10.1186/s13045-022-01299-z
47. Zhong W-Z, Wang Q, Mao W-M, et al. Gefitinib versus vinorelbine plus cisplatin as adjuvant treatment for stage II-IIIA (N1-N2) EGFR-Mutant NSCLC: final overall survival analysis of CTONG1104 Phase III trial. J Clin Oncol. 2021;39(7):713–722. doi:10.1200/JCO.20.01820
 © 2023 The Author(s). This work is published and licensed by Dove Medical Press Limited. The full terms of this license are available at https://www.dovepress.com/terms.php and incorporate the Creative Commons Attribution - Non Commercial (unported, v3.0) License.
By accessing the work you hereby accept the Terms. Non-commercial uses of the work are permitted without any further permission from Dove Medical Press Limited, provided the work is properly attributed. For permission for commercial use of this work, please see paragraphs 4.2 and 5 of our Terms.
© 2023 The Author(s). This work is published and licensed by Dove Medical Press Limited. The full terms of this license are available at https://www.dovepress.com/terms.php and incorporate the Creative Commons Attribution - Non Commercial (unported, v3.0) License.
By accessing the work you hereby accept the Terms. Non-commercial uses of the work are permitted without any further permission from Dove Medical Press Limited, provided the work is properly attributed. For permission for commercial use of this work, please see paragraphs 4.2 and 5 of our Terms.