Back to Journals » Nature and Science of Sleep » Volume 15
Overall Obesity Not Abdominal Obesity Has a Causal Relationship with Obstructive Sleep Apnea in Individual Level Data
Authors Li X ![]() , Wang T, Jin L, Li Z, Hu C, Yi H
, Wang T, Jin L, Li Z, Hu C, Yi H ![]() , Guan J, Xu H, Wu X
, Guan J, Xu H, Wu X
Received 15 June 2023
Accepted for publication 30 September 2023
Published 9 October 2023 Volume 2023:15 Pages 785—797
DOI https://doi.org/10.2147/NSS.S422917
Checked for plagiarism Yes
Review by Single anonymous peer review
Peer reviewer comments 2
Editor who approved publication: Professor Valentina Alfonsi
Xinyi Li,1,* Tao Wang,2,* Li Jin,3 Zhiqiang Li,4 Cheng Hu,3 Hongliang Yi,1 Jian Guan,1 Huajun Xu,1 Xiaolin Wu5
1Department of Otorhinolaryngology Head and Neck Surgery, Shanghai Sixth People’s Hospital Affiliated to Shanghai Jiao Tong University School of Medicine, Shanghai Key Laboratory of Sleep Disordered Breathing, Otorhinolaryngology Institute of Shanghai JiaoTong University, Shanghai, People’s Republic of China; 2Department of Endocrinology, The Second Affiliated Hospital of Soochow University, Suzhou, People’s Republic of China; 3Shanghai Diabetes Institute, Shanghai Key Laboratory of Diabetes Mellitus, Shanghai Clinical Centre for Diabetes, Shanghai Jiao Tong University Affiliated Sixth People’s Hospital, Shanghai, People’s Republic of China; 4Key Laboratory for the Genetics of Developmental and Neuropsychiatric Disorders, Bio-X Institutes, Ministry of Education, Shanghai Jiao Tong University, Shanghai, People’s Republic of China; 5Central Laboratory of Shanghai Eighth People’s Hospital, Xuhui Branch of Shanghai Sixth People’s Hospital, Shanghai, People’s Republic of China
*These authors contributed equally to this work
Correspondence: Huajun Xu, Department of Otorhinolaryngology Head and Neck Surgery, Shanghai Sixth People’s Hospital Affiliated to Shanghai Jiao Tong University School of Medicine, Shanghai Key Laboratory of Sleep Disordered Breathing, Otorhinolaryngology Institute of Shanghai JiaoTong University, Shanghai, 200233, People’s Republic of China, Email [email protected] Xiaolin Wu, Central Laboratory of Shanghai Eighth People’s Hospital, Xuhui Branch of Shanghai Sixth People’s Hospital, Shanghai, People’s Republic of China, Email [email protected]
Objective: Both obstructive sleep apnea (OSA) and obesity are highly prevalent worldwide, and are intrinsically linked. Previous studies showed that obesity is one of the major risk factors for OSA, but the causality of the relationship is still unclear. The study was to investigate the causal relationships of overall obesity and abdominal obesity with OSA and its quantitative traits.
Methods: In this case-control study, a total of 7134 participants, including 4335 moderate-to-severe OSA diagnosed by standard polysomnography and 2799 community-based controls were enrolled. Anthropometric and biochemical data were collected. Mendelian randomization (MR) analyses were performed using the genetic risk score, based on 29 body mass index (BMI)- and 11 waist-hip-ratio (WHR)-associated single nucleotide polymorphisms as instrumental variables. The causal associations of these genetic scores with OSA and its quantitative phenotypes were analyzed.
Results: Obesity was strongly correlated with OSA in observational analysis (β= 0.055, P = 3.7 × 10− 5). In MR analysis, each increase by one standard deviation in BMI was associated with increased OSA risk [odds ratio (OR): 2.21, 95% confidence interval (CI): 1.62– 3.02, P = 5.57 × 10− 7] and with 2.72-, 4.68-, and 3.25-fold increases in AHI, ODI, and MAI, respectively (all P < 0.05) in men. However, no causal associations were found between WHR and OSA risk or OSA quantitative traits in men and women.
Conclusion: Compared to abdominal obesity, overall obesity showed a causal relationship with OSA and its quantitative traits, especially in men.
Keywords: body mass index, Mendelian randomization, obesity, obstructive sleep apnea, waist-hip ratio
Backgrounds
Obstructive sleep apnea (OSA) is a common sleep disorder characterized by recurrent episodes of partial or complete upper airway obstruction that result in intermittent hypoxemia during sleep and sleep disruption.1,2 Individuals with OSA are at increased risk of cardiovascular diseases, diabetes, and other diseases with significant morbidity, underscoring the need to better understand the etiology of OSA.3
OSA involves complex interactions between genetic and environmental factors.4 A recent large-scale genome-wide association study (GWAS) of OSA based on the FinnGen Study dataset identified five genome-wide loci associated with OSA, most of which were correlated with obesity.5 Numerous studies showed that obesity is the strongest risk factor for the development of OSA, and the incidence of obesity is relatively high among OSA patients.6,7 Obesity has been hypothesized to alter breathing during sleep via multiple mechanisms, including alteration of upper airway structure and function, and disturbance of the balance between respiratory drive and load compensation.8,9 OSA may predispose individuals to sleep deprivation, daytime somnolence, and poor sleep; it also increases sympathetic activation and insulin resistance, thereby potentially exacerbating obesity.7,10 Furthermore, OSA may be associated with changes in leptin, ghrelin, and orexin levels, as well as increased appetite and caloric intake, which also exacerbate obesity.9,11 Obesity and OSA appear to form a vicious circle and show a bidirectional relationship. However, most studies have used an observational design and could not demonstrate causal relationships due to confounding factors, reverse causation, or selection bias.
The gold standard for causal inference is the randomized controlled trial (RCT). However, RCTs are costly and take a great deal of time, and so can be impractical. An alternative approach to allow causal inference is Mendelian randomization (MR), which analyzes genetic variants that are randomly assorted during meiosis and unassociated with confounders to allow causality to be inferred for a given outcome.12,13 Genetic variants that promote increased weight would have several advantages over traditional measures of obesity, ie, they would not be related to potential confounding factors or affected by reverse causation, and may act as a lifelong markers of increased body weight.14,15 MR studies about sleep reported to date have concentrated on the relationships of insomnia, sleep disturbance, and sleep duration with stroke,16 cardiovascular disease,17 cancer,18 etc. With regard to sleep apnea, it was reported that OSA was a causal factor in breast cancer in women,19 cardiometabolic disease,5 and atrial fibrillation.20 However, no MR studies on OSA and obesity have been reported to date. Therefore, the causal relationship between obesity and OSA is still unclear.
In the present case-control study, we performed MR analyses of individual-level data to explore the potential causal relationship between obesity and OSA diagnosed based on standard polysomnography (PSG). We identified 29 body mass index (BMI)-associated single nucleotide polymorphisms (SNPs) and 11 waist-hip-ratio (WHR)-associated SNPs, and constructed genetic risk scores (GRSs) for use as instrumental variables to examine whether general obesity and abdominal obesity contribute differentially to OSA.
Methods
Study Participants and Design
All OSA patients were recruited from the ongoing Shanghai Sleep Health Study (SSHS), performed in the sleep center of Shanghai Jiao Tong University Affiliated Sixth People’s Hospital.21 Patients with suspected OSA referred to the SSHS were continuously enrolled, and anthropometric, genomic, and standard PSG data were collected from 2007 to 2018. Control subjects were enrolled from a community-based Han Chinese population. The inclusion criteria of controls were as follows:1) without self-reported snoring problems; 2) without systemic diseases, cardiovascular disease; 3) without cancer, psychiatric diseases, and pregnancy. A total of 5438 patients with OSA confirmed by standard PSG, and 2989 community-based control subjects, were initially enrolled in this study. Subjects with missing data for > 15% of the SNPs, OSA quantitative traits, BMI, or WHR, and those with low genotyping call rates (< 95%), were excluded. Finally, 4335 patients with moderate-to-severe OSA and 2891 control participants were included in the analyses. Each participant provided written informed consent in accordance with the guidelines of the Ethics Committee of China. This study was performed in accordance with the Declaration of Helsinki and was approved by the Institutional Ethics Committee of Shanghai Jiao Tong University Affiliated Sixth People’s Hospital.
Polysomnography and Definition of Sleep Events
Respiratory events were scored using a laboratory-based overnight PSG device (Alice 4 or 5; Respironics, Pittsburgh, PA, USA) according to the American Academy of Sleep Medicine (AASM) 2012 criteria;22 PSG recorded before 2012 were re-analyzed according to the same criteria. Apnea was defined as complete cessation of airflow lasting ≥ 10s, and hypopnea as either a ≥ 50% reduction in airflow for ≥ 10s or a < 50% reduction accompanied by either a ≥ 4% decrease in oxyhemoglobin saturation or arousal. The apnea-hypopnea index (AHI) was determined based on the number of apnea and hypopnea events per hour during sleep. The total oxygen desaturation index (ODI) was defined as the total number of episodes of ≥ 4% oxyhemoglobin desaturation during sleep (total sleep time was recorded in hours). The micro-arousal index (MAI) was defined as the average number of arousals per hour of sleep.
Anthropometric Information and Biochemical Measurements
Information was collected on sociodemographic factors, history of chronic disease and medications, and lifestyle-related factors. Trained investigators measured height, body weight, waist circumference (WC), and hip circumference (HC), and the average values of three measurements were used for the analysis. Height and weight were measured with a digital scale, with each participant standing straight wearing light clothing. WC was measured at a point midway between the lowest rib and iliac crest. HC was measured at the largest circumference of the buttocks. BMI was calculated as weight in kilograms divided by height in meters squared (kg/m2). The WHR was calculated as WC/HC. For each patient, high-density lipoprotein (HDL-C), low-density lipoprotein (LDL-C), total cholesterol (TC), triglycerides (TG), and fasting blood glucose (FBG) levels were measured in the hospital laboratory using an autoanalyzer (H-7600; Hitachi, Tokyo, Japan). Serum fasting insulin (FIN) was measured using a human insulin-specific radioimmunoassay (Linco Research, St. Charles, MO, USA).
Selection of Genetic Loci, Genotyping, and Genetic Risk Score Construction
The Affymetrix Genome-Wide Human SNP Array 6.0 (SNP6.0) and Affymetrix AxiomTM Genome-Wide CHB Array Plates (CHB) were used for genotyping. Genotypes were then generated by Axiom Genotyping Algorithm v1 (Axiom GT1) and constitute our genetic database, which was described previously.23 We selected previously reported BMI- and WHR-associated SNPs from a large-scale GWAS that had been replicated in East Asian populations.24–27 Some studies perform the analysis with the largest WHR data from the UK Biobank28 and found over 941 variants for BMI.29 However, a World Health Organization (WHO) expert consultation suggested that the associations among BMI, body fat percentage, and health risks differ between Asian and European populations.30 Therefore, BMI thresholds must be tailored for Asian populations because they show markedly different obesity-related characteristics from non-Asian populations.31 Therefore, this study used SNPs demonstrated to be relevant in East Asian populations. These SNPs were described in our previous report.32 A total of 32 BMI-associated SNPs and 13 WHR-associated SNPs were included in the analysis. SNPs with a high missing genotype call rate (> 5%) or low minor allele frequency (< 0.01) were excluded, along with those out of Hardy–Weinberg equilibrium (HWE). After filtering variants in our genomic database in linkage disequilibrium with each other in the same regions (r2 > 0.8), we focused on 29 independent BMI-associated and 11 WHR-associated SNPs for the case group. For the control group, the SNPs were genotyped using a MassARRAY Compact Analyzer (Sequenom, San Diego, CA, USA). Finally, BMI SNPs SEC16B rs574367, TNNI3K rs1514175, PTBP2 rs1555543, NEGR1 rs2568958, RBJ rs713586, TMEM18 rs6548238, ITIH4-AS1 rs2535633, ETV5 rs7647305, GNPDA2 rs10938397, PCSK1 rs261967, POC5 rs2112347, TFAP2B rs987237, CDKAL1 rs9356744, KLF9 rs11142387, LRRN6C-LINGO2 rs10968576, NT5C2 rs11191580, BDNF rs6265, MTCH2 rs3817334, RPL27A rs4929949, ALDH2 rs671, FAIM2 rs7138803, MTIF3 rs4771122, MAP2K5 rs2241423, FTO rs1558902, SH2B1 rs7498665, GP2 rs12597579, MC4R rs17782313, KCTD15 rs29941, TMEM160 rs3810291 and WHR SNPs TBX15 rs984222, LYPLAL1 rs4846567, GRB14 rs10195252, VEGFA rs6905288, RREB1 rs6931262, NFE2L3 rs1055144, MSC rs12679556, ABCA1 rs10991437, SFXN2 rs7917772, CMIP rs2925979, GDF5 rs224333 were included.
For GRS construction, we used an additive genetic model for each variant, applying linear weighing of 0, 1, and 2 to genotypes containing 0, 1, and 2 risk alleles, respectively. The weighted GRS was calculated by weighting each risk allele according to the effect size, and then adding the scores (the effect size of the SNP after increasing BMI and WHR, determined based on previous Asian studies on obesity).
Statistical Analysis
MATLAB 8.1 (MathWorks, Natick, MA, USA), SPSS 21.0 (IBM Corp., Armonk, NY, USA), GraphPad Prism 7.0 (GraphPad Software Inc., La Jolla, CA, USA), PLINK (http://zzz.bwh.harvard.edu/plink/ld.shtml), and R (R Development Core Team, Vienna, Austria) software were used for database management and statistical analysis. The general characteristics of the participants are provided as mean ± SD for continuous variables and frequency (%, n) for categorical variables. A multiple linear regression model adjusted for age, sex, and BMI was used to test for associations among BMI-GRS, WHR-GRS, and clinical characteristics. BMI-GRS and WHR-GRS were modelled as continuous variables, and a general linear regression model was applied to test the associations with quantitative traits.
In MR analysis, we used BMI-GRS and WHR-GRS as instrumental variables to measure the strength of the causal relationship between obesity and OSA. The odds ratios (ORs) for instrumental variables were derived using the Wald-type estimator.33 Linear associations of BMI-GRS, WHR-GRS and obesity were assessed using multivariable linear regression models (adjusted for age and sex when focusing on BMI, and for age, sex, and BMI when focusing on WHR). Multivariable logistic regression models were used to assess the associations of obesity and obesity-related GRS with the risk of OSA. The β values of the regressions were used to calculate causal effect estimates (βe) between obesity and OSA, as follows: βe = βGRS-OSA/βGRS-BMI/WHR. ORe was calculated as exp(βe). Multivariable logistic regression models were used to assess the associations of BMI-GRS and WHR-GRS with AHI, ODI, and MAI. βe was calculated as βGRS-AHI/ODI/MAI/βGRS-BMI/WHR. Pe was determined using the t-statistic. The inverse variance method was applied for Egger regression, using a formula described in detail previously.34
Mendelian randomization R package were used to perform sensitivity analysis and pleiotropy. Power calculations were computed with online tool: https://shiny.cnsgenomics.com/mRnd/.
Results
General Characteristics
The general characteristics of the 7134 participants in this study (4335 patients with moderate-to-severe OSA and 2799 community-based control subjects) are presented in Table 1. Participants with OSA were more obese and had worse dyslipidemia than the controls (P < 0.05). The OSA group had a higher proportion of men than the control group (85.3% vs 45.7%, P < 0.05). The descriptive statistics for males and females separately were shown in Table S1. The 29 BMI- and 11 WHR-associated SNPs selected for GRS construction are shown in Table 2, respectively. The data for the SNPs, including gene, chromosome, position, minor alleles, major alleles, risk alleles, and effect sizes, are listed. None of the SNPs failed quality control, with minor allele frequencies were < 0.5 and PHWE > 0.05.
 |
Table 1 Basic Characteristics of the Enrolled Subjects |
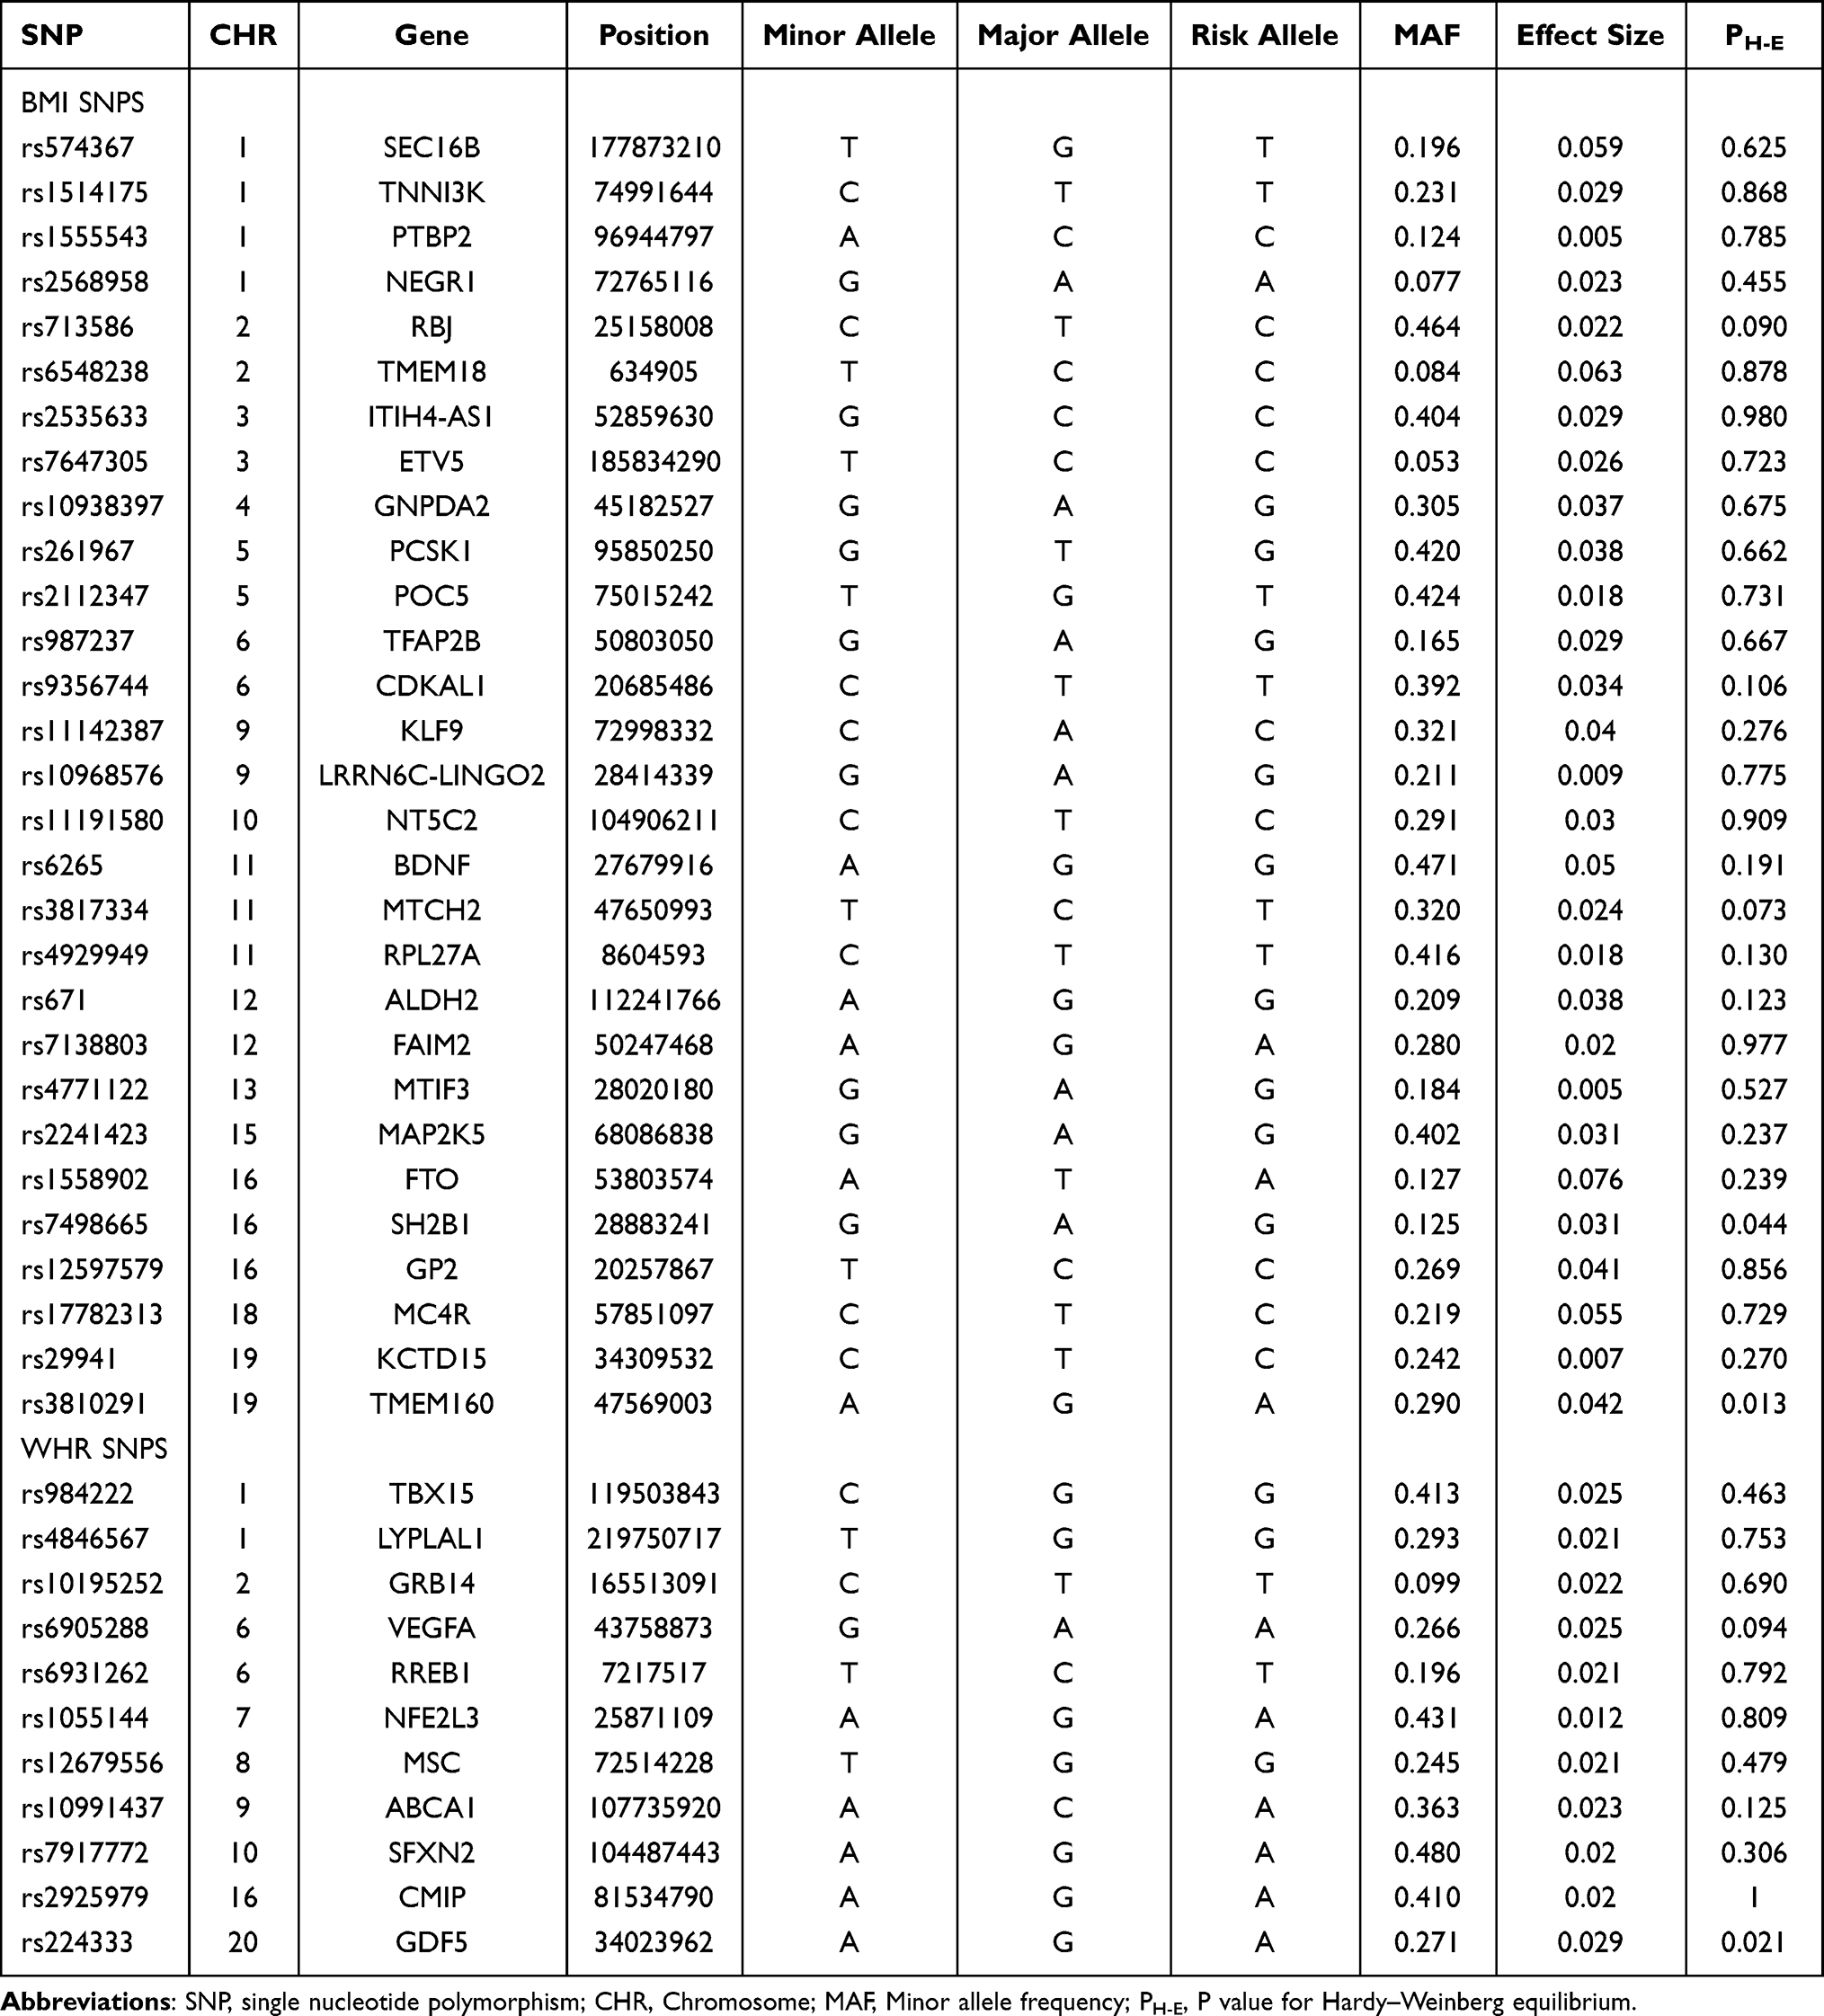 |
Table 2 Characteristics of BMI- and WHR- Associated SNPs |
Associations of SNPs with Clinical Traits and OSA
The linear associations of BMI- and WHR-associated SNPs with the clinical traits of all subjects and OSA are listed in Table 3. Of all subjects, we found BMI-related SNPs rs574367, rs6548238, rs7647305, rs10938397, rs261967, rs2112347, rs206936, rs10968576, rs6265, rs7138803, rs1558902, rs17782313, rs3810291, rs11671664 were significantly correlated with BMI (ρ<0.05), rs2568958 and rs4771122 were correlated with TC(β=−0.08, ρ=0.013; β=−0.045, ρ=0.043; respectively), rs671, rs7138803 and rs4771122 were associated with TG (all ρ<0.05), rs12597579 was are associated with LDL(β=0.036, ρ=0.038), rs574367, rs6548238, rs9356744, rs6265, rs2237892, rs1558902, rs12597579 and rs17782313 were associated with FBG(all ρ<0.05), rs574367, rs6548238, rs7647305, rs9356744, rs6265, rs2237892, rs671, rs7138803, rs1558902 were associated with FIN(all ρ<0.05), when adjusted for age and sex. For WHR SNPs, rs984222 was associated with WHR (β=−0.004, ρ=1.40×10⁻⁵), rs4846567 and rs10195252 were associated with FIN (β=−0.52, ρ=5.3×10⁻⁴; β=−0.52, ρ=0.025, respectively), rs6905288 was associated with TG and HDL (β=−0.14, ρ=6.4×10⁻⁵; β=0.018, ρ=0.002, respectively), rs6931262 was associated with WHR and LDL (β=0.002, ρ=0.046; β=0.041, ρ=0.032; respectively), rs1055144 was associated with FIN (β=0.28, ρ=0.04), rs10991437 was associated with WHR (β=0.002, ρ=0.014); rs7917772 was associated with LDL and FBG (β=0.030, ρ=0.045; β=0.055, ρ=0.014, respectively) when adjusted for age, sex and BMI.
 |
Table 3 The Linear Associations Between BMI- and WHR- Associated SNPs with Related Clinical Characteristics |
Fewer BMI- and WHR-associated SNPs were related to clinical traits in participants with OSA (Tables S2 and S3). The associations of the BMI- and WHR-associated SNPs with OSA risk are shown as forest plots in Figures S1 and S2. BMI-SNPs rs713586, rs10938397, rs2112347, rs2241423 and rs1558902 increased the risk of OSA (OR=1.085, 95% confidence interval [CI]:1.006–1.171, ρ=0.0347; OR=1.129, 95% CI:1.039–1.227, ρ=0.0043; OR= 1.113, 95% CI:1.030–1.204, ρ=0.0071; OR=1.087, 95% CI:1.005–1.176, ρ=0.038; OR=1.172, 95% CI:1.044–1.316, ρ=0.0073, respectively) (Figure S1). WHR-SNPs rs4846567 and rs10195252 decreased the risk of OSA (OR= 0.856, 95% CI:0.782–0.936, ρ=6.67×10⁻⁴; OR=0.850, 95% CI:0.742–0.974, ρ=0.019, respectively) (Figure S2).
Associations of BMI and WHR with OSA: MR Analysis
Linear regressions showed 7.2% variance for the association between the BMI GRS and the exposure variable (BMI) after adjustment for age and sex. The distributions of BMI and BMI-GRS are shown in Figure S3. The correlations between GRS and clinical traits are shown in Table S4. BMI-GRS was associated with FIN (β = 0.071, ρ = 0.045) and BMI (β = 0.55, ρ = 2.7 × 10⁻⁵). Figure 1A compares the associations of BMI GRS, as an observed and instrumental variable, with OSA after adjustment for age and sex. The association was also studied in men (Figure 1B) and women separately (Figure 1C). In all subjects, BMI was significantly associated with OSA (OR = 1.279, 95% CI: 1.256–1.302, ρ = 1.17 × 10−153) after adjusting for age and sex. MR analysis showed a significant association between BMI-GRS and OSA risk (OR = 1.64, 95% CI: 1.148–2.349, ρ = 0.0066) (Figure 1A). The ρ-value of the Egger regression was 0.042. The risk of OSA was higher in men than in all subjects (OR = 2.21, 95% CI: 1.622–3.018, ρ = 5.57 × 10⁻⁷) (Figure 1B). BMI-GRS was not associated with BMI in the MR analysis of women (β = −0.051, ρ = 0.07) (Figure 1C).
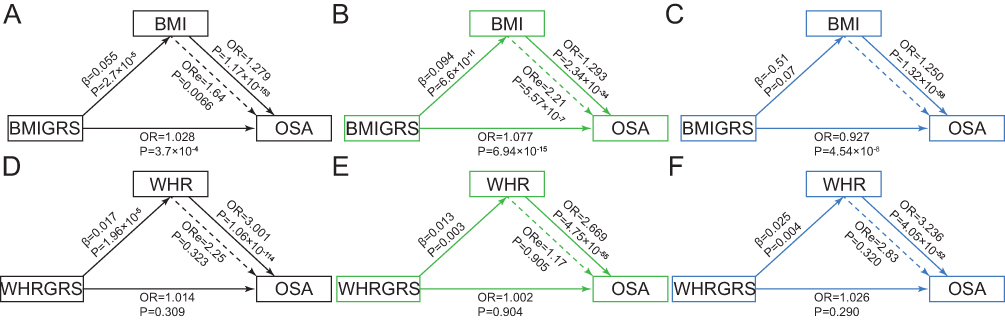 |
Figure 1 Mendelian randomization analysis for the association of obesity and incidence of OSA. (A) BMI GRS and OSA for total population; (B) BMI GRS and OSA for men; (C) BMI GRS and OSA for women; (D) WHR GRS and OSA for total population; (E) WHR GRS and OSA for men; (F) WHR GRS and OSA for women. |
Linear regressions showed 46.5% variance for the association between the WHR GRS and the exposure variable (WHR) after adjustment for age, sex and BMI. The distributions of WHR and WHR-GRS are shown in Figure S4. The MR analysis of WHR and OSA in all subjects, men and women, respectively were shown Figure 1D, Figure 1E and F. We found no causal relationships between WHR and OSA (OR = 2.257, 95% CI: 0.450–11.329, ρ = 0.3226) (Figure 1D). In the observational analysis, WHR was significantly associated with OSA (OR = 3.001, 95% CI: 2.730–3.298, ρ = 1.06 × 10−114) for all subjects after adjustment for age, sex, and BMI (Figure 1D); OR = 2.669, 95% CI: 2.360–3.019, ρ = 4.75 × 10−55 in men after adjustment for age and BMI (Figure 1E); OR = 3.236, 95% CI: 2.781–3.766, ρ = 4.05 × 10−52 in women after adjustment for age and BMI (Figure 1F).
Associations of BMI and WHR with OSA Quantitative Traits: MR Analysis
The associations of BMI with OSA quantitative traits, ie, AHI, ODI, and MAI, were analyzed (Figure 2). For all subjects, BMI was significantly associated with AHI (Figure 2A), ODI (Figure 2B), and MAI (Figure 2C) (β = 1.723, ρ = 7.07 × 10−106; β = 2.206, ρ = 2.68 × 10−140; β = 0.862, ρ = 2.88 × 10⁻²²). In MR analysis, each 1 SD increase in BMI-GRS (4.0 kg/m2) was associated with an increased risk of OSA, based on the AHI (β = 2.973, standard error of the mean [SEM] = 1.079, ρ = 0.00588) (Figure 2A), ODI (β = 4.779, SEM = 1.349, ρ = 0.0004) (Figure 2B), and MAI (β = 3.180, SEM = 1.191, ρ = 0.00758) (Figure 2C). For men, an increase in BMI-GRS was also associated with increased OSA, based on the AHI (β = 2.723, SEM = 1.171, ρ = 0.020) (Figure 2D), ODI (β = 4.677, SEM = 1.467, ρ = 0.00145) (Figure 2E), and MAI (β = 3.245, SEM = 1.340, ρ = 0.0155) (Figure 2F). However, no associations were found between BMI and AHI (Figure 2G), ODI (Figure 2H), or MAI (Figure 2I) in women (ρ > 0.05) when adjusted for age. There is a stronger association between BMI, BMI-GRS with ODI compared to AHI. However, no associations were found between WHR- GRS with AHI, ODI, and MAI in all subjects (Figure S5A–C), men (Figure S5D–F) and women (Figure S5G–I) as the instrumental variables (WHR- GRS) did not met the MR assumptions.
 |
Figure 2 Mendelian randomization analysis for the association of BMI GRS and OSA quantitative traits. (A) BMI GRS and AHI for total population; (B) BMI GRS and ODI for total population; (C) BMI GRS and MAI for total population; (D) BMI GRS and AHI for men; (E) BMI GRS and ODI for men; (F) BMI GRS and MAI for men; (G) BMI GRS and AHI for women; (H) BMI GRS and ODI for women; (I) BMI GRS and MAI for women. |
Egger results and Power Calculations
The MR-egger results of BMI, WHR SNPs and OSA, OSA related traits were shown in Table S5. The power calculations BMI-GRS, WHR GRS and OSA, OSA related traits were shown in Table S6.
Discussion
In this study, we demonstrated that general obesity is a genetic risk factor for OSA, especially in men. Central obesity was not causally related to OSA in women or men.
As an instrumental rather than exposure variable, GRS has frequently been used to predict outcomes.14 A number of studies have used the obesity GRS to predict the risk of various diseases, however, there have been fewer studies on the causal relationship between obesity and OSA. In a GWAS of OSA including 16,761 OSA patients from the FinnGen Study dataset, which used 64 independent BMI-associated SNPs as instrumental variables to predict OSA, Strausz et al discovered that BMI was a strong predictor of OSA,5 consistent with our results. However, their study identified OSA patients from nationwide health registries, rather than through standard PSG. In the present study, we used laboratory-based PSG and relatively complete obesity phenotype data to perform MR analyses.
Some observational studies have suggested that WHR is associated with OSA.35,36 It has been reported that the visceral adiposity index is a good marker of metabolic syndrome, but not of OSA.37 Meanwhile, decreases in end-expiratory lung volume appear to be related to increased overall chest wall fat, rather than to increased fat in any particular region of the chest wall.38 Obesity is characterized by fatty deposits around the neck; this promotes pharyngeal collapse, which is independently associated with AHI and may be a determinant of the severity of OSA.39,40 Weight loss reduces pharyngeal fat pads and can improve symptoms of OSA.39 Results showing that overall obesity, rather than abdominal obesity, may be associated with OSA, consistent with our conclusions. Further studies are required to validate the lack of a causal relationship between abdominal obesity and OSA.
We also found that the associations between BMI, BMI-GRS with ODI were stronger than AHI. There were multiple studies showing that ODI was a more sensitive and valuable predictor to detect OSA41,42 which was consistent with our results. Oxygen desaturation parameters were better markers for cardiovascular disease43 and OSA associated morbidity and mortality compared to the AHI.44,45 In turn, it was reported that BMI influences the accuracy of ODI for OSA diagnosis.46 Obesity influences the severity of blood oxygen desaturation during apnea and hypopnea events.47 Therefore, more attention should be paid to the causal relationship between hypoxia and obesity, and the corresponding mechanism is worth exploring.
There are sex differences in the manifestations and progression of OSA, men have a two- or three fold higher risk of OSA compared to women, and the underlying mechanisms of these differences are complex.3,48 There may be sex differences in anatomical and physiological features of the upper airways, especially with respect to the modulatory effects of sex hormones on breathing control, as well as sex differences in fat distribution, upper airway size and craniofacial morphology.48,49 In women, fat tends to be preferentially deposited around the abdomen rather than the neck.50 Also, women have more stable and less mobile upper airway structures than men, providing protection against severe forms of OSA.51 Women with polycystic ovary syndrome are at increased risk of developing OSA due to their higher free testosterone levels.52 Among menopausal women, there is a higher prevalence, but not severity, of OSA.53 Several studies have suggested a role of sex hormones in sleep modulation, and in the progression and severity of OSA.48,54 These studies suggested that, in contrast to men, obesity was not the main cause of OSA in women. In addition, OSA severity is not dependent on WHR or neck circumference in women.55 In our previous interventional study, OSA patients who underwent Roux-en-Y gastric bypass surgery showed significant improvements in sleep parameters and obesity indices, which indirectly confirmed the causal relationship between obesity and OSA.56
Limitations
This was the first study of the causal relationships of overall and abdominal obesity with OSA and its quantitative traits. We used individual-level data from the genomic database of our GWAS, and confirmed OSA by standard PSG in all cases; nevertheless, this study had some limitations. First, not all SNPs relevant to BMI and WHR were included. Second, the SNPs in the control group were obtained with a DNA extraction kit and analyzed using a MassARRAY Compact Analyzer, which was not consistent with the OSA group. Third, the male/female ratio was different between the OSA and control groups, which may explain the failure to identify a causal relationship between obesity and OSA in women. Fourth, the control group was recruited from the community, and PSG was not performed as standard. In addition, interactions among the phenotype-related SNPs were not taken into consideration. Finally, bidirectional MR analyses of OSA and obesity were not performed, as there have been no GWAS of OSA in Asian populations. Our genomic database was built to explore the genetic background of OSA, with the aim of aiding its diagnosis and treatment in the future.
Conclusions
Our MR study demonstrated that BMI, but not WHR, is causally related to OSA in men. In contrast, obesity may not be a causal factor of OSA in women. These results suggest that greater attention should be paid to weight management in men, to reduce OSA risk.
Abbreviations
OSA, obstructive sleep apnea; MR, Mendelian randomization; SNP, single nucleotide polymorphism; GRS, genetic risk score; LD, linkage disequilibrium; BMI, body mass index; WHR, waist hip ratio; CHR, Chromosome; MAF, Minor allele frequency; H-E, Hardy–Weinberg equilibrium; IV, instrumental variable; OR, odds ratio; AHI, apnea-hypopnea index; ODI, oxygen desaturation index; MAI, Micro-arousal index.
Data Sharing Statement
All data generated or analyzed during this study are included in this published article.
Ethics Approval and Consent to Participate
The ethics committee of Shanghai Sixth People’s Hospital approved this study according to Helsinki Declaration II. All the participants have given the informed consent before taking part in the study.
Acknowledgments
We thank all the research subjects for their participation and acknowledge the skillful work of the entire medical staff.
Author Contributions
All authors made a significant contribution to the work reported, whether that is in the conception, study design, execution, acquisition of data, analysis and interpretation, or in all these areas; took part in drafting, revising or critically reviewing the article; gave final approval of the version to be published; have agreed on the journal to which the article has been submitted; and agree to be accountable for the contents of the work.
Funding
The work was supported by Ministry of Science and Technology of the People's Republic of China (STI2030-Major Projects2021ZD0201900); National Natural Science Foundation of China (81770987, 81970870, 82000967); Shanghai Municipal Commission of Science and Technology (Grant No.18DZ2260200); The work was supported by a grant from Shanghai Sixth People’s Hospital (ynts202103, ZY(2021-2023)-0205-04).
Disclosure
The authors declare that they have no competing interests in this work.
References
1. Jordan AS, McSharry DG, Malhotra A. Adult obstructive sleep apnoea. Lancet. 2014;383(9918):736–747. doi:10.1016/s0140-6736(13)60734-5
2. Veasey SC, Rosen IM, Solomon CG. Obstructive sleep apnea in adults. N Engl J Med. 2019;380(15):1442–1449. doi:10.1056/NEJMcp1816152
3. Sforza E, Roche F. Chronic intermittent hypoxia and obstructive sleep apnea: an experimental and clinical approach. Hypoxia. 2016;4:99–108. doi:10.2147/hp.s103091
4. Redline S, Tishler PV. The genetics of sleep apnea. Sleep Med Rev. 2000;4(6):583–602. doi:10.1053/smrv.2000.0120
5. Strausz S, Ruotsalainen S, Ollila HM, et al. Genetic analysis of obstructive sleep apnoea discovers a strong association with cardiometabolic health. Eur Respir J. 2021;57(5). doi:10.1183/13993003.03091-2020
6. Tuomilehto H, Seppä J, Uusitupa M. Obesity and obstructive sleep apnea--clinical significance of weight loss. Sleep Med Rev. 2013;17(5):321–329. doi:10.1016/j.smrv.2012.08.002
7. Hamilton GS, Joosten SA. Obstructive sleep apnoea and obesity. Aust Fam Physician. 2017;46(7):460–463.
8. Meurling IJ, Shea DO, Garvey JF. Obesity and sleep: a growing concern. Curr Opin Pulm Med. 2019;25(6):602–608. doi:10.1097/mcp.0000000000000627
9. Crummy F, Piper AJ, Naughton MT. Obesity and the lung: 2. Obesity and sleep-disordered breathing. Thorax. 2008;63(8):738–746. doi:10.1136/thx.2007.086843
10. Reutrakul S, Van Cauter E. Sleep influences on obesity, insulin resistance, and risk of type 2 diabetes. Metabolism. 2018;84:56–66. doi:10.1016/j.metabol.2018.02.010
11. Spiegel K, Tasali E, Penev P, Van Cauter E. Brief communication: sleep curtailment in healthy young men is associated with decreased leptin levels, elevated ghrelin levels, and increased hunger and appetite. Ann Intern Med. 2004;141(11):846–850. doi:10.7326/0003-4819-141-11-200412070-00008
12. Emdin CA, Khera AV, Kathiresan S. Mendelian randomization. JAMA. 2017;318(19):1925–1926. doi:10.1001/jama.2017.17219
13. Dudbridge F. Polygenic Mendelian randomization. Cold Spring Harb Perspect Med. 2021;11(2):a039586. doi:10.1101/cshperspect.a039586
14. Burgess S, Small DS, Thompson SG. A review of instrumental variable estimators for Mendelian randomization. Stat Methods Med Res. 2017;26(5):2333–2355. doi:10.1177/0962280215597579
15. Locke AE, Kahali B, Berndt SI, et al. Genetic studies of body mass index yield new insights for obesity biology. Nature. 2015;518(7538):197–206. doi:10.1038/nature14177
16. Titova OE, Michaëlsson K, Larsson SC. Sleep duration and stroke: prospective cohort study and Mendelian randomization analysis. Stroke. 2020;51(11):3279–3285. doi:10.1161/strokeaha.120.029902
17. Zhuang Z, Gao M, Yang R, et al. Association of physical activity, sedentary behaviours and sleep duration with cardiovascular diseases and lipid profiles: a Mendelian randomization analysis. Lipids Health Dis. 2020;19(1):86. doi:10.1186/s12944-020-01257-z
18. Richmond RC, Anderson EL, Dashti HS, et al. Investigating causal relations between sleep traits and risk of breast cancer in women: Mendelian randomisation study. BMJ. 2019;365:l2327. doi:10.1136/bmj.l2327
19. Gao XL, Jia ZM, Zhao FF, et al. Obstructive sleep apnea syndrome and causal relationship with female breast cancer: a Mendelian randomization study. Aging. 2020;12(5):4082–4092. doi:10.18632/aging.102725
20. Chen W, Cai X, Yan H, Pan Y. Causal effect of obstructive sleep apnea on atrial fibrillation: a Mendelian randomization study. J Am Heart Assoc. 2021;10(23):e022560. doi:10.1161/jaha.121.022560
21. Guan J, Yi H, Zou J, et al. Distinct severity stages of obstructive sleep apnoea are correlated with unique dyslipidaemia: large-scale observational study. Thorax. 2016;71(4):347–355. doi:10.1136/thoraxjnl-2015-207403
22. Berry RB, Budhiraja R, Gottlieb DJ, et al. Rules for scoring respiratory events in sleep: update of the 2007 AASM manual for the scoring of sleep and associated events. Deliberations of the sleep apnea definitions task force of the American Academy of Sleep Medicine. J Clin Sleep Med. 2012;8(5):597–619. doi:10.5664/jcsm.2172
23. Xu H, Liu F, Li Z, et al. Genome-wide association study of obstructive sleep apnea and objective sleep-related traits identifies novel risk loci in Han Chinese Individuals. Am J Respir Crit Care Med. 2022;206(12):1534–1545. doi:10.1164/rccm.202109-2044OC
24. Okada Y, Kubo M, Ohmiya H, et al. Common variants at CDKAL1 and KLF9 are associated with body mass index in east Asian populations. Nat Genet. 2012;44(3):302–306. doi:10.1038/ng.1086
25. Wen W, Cho YS, Zheng W, et al. Meta-analysis identifies common variants associated with body mass index in east Asians. Nat Genet. 2012;44(3):307–311. doi:10.1038/ng.1087
26. Wen W, Zheng W, Okada Y, et al. Meta-analysis of genome-wide association studies in East Asian-ancestry populations identifies four new loci for body mass index. Hum Mol Genet. 2014;23(20):5492–5504. doi:10.1093/hmg/ddu248
27. Wen W, Kato N, Hwang JY, et al. Genome-wide association studies in East Asians identify new loci for waist-Hip ratio and waist circumference. Sci Rep. 2016;6(1):17958. doi:10.1038/srep17958
28. Christakoudi S, Evangelou E, Riboli E, Tsilidis KK. GWAS of allometric body-shape indices in UK Biobank identifies loci suggesting associations with morphogenesis, organogenesis, adrenal cell renewal and cancer. Sci Rep. 2021;11(1):10688. doi:10.1038/s41598-021-89176-6
29. Yengo L, Sidorenko J, Kemper KE, et al. Meta-analysis of genome-wide association studies for height and body mass index in ∼700000 individuals of European ancestry. Hum Mol Genet. 2018;27(20):3641–3649. doi:10.1093/hmg/ddy271
30. Tan KC. Appropriate body-mass index for Asian populations and its implications for policy and intervention strategies. Lancet. 2004;363(9403):157–163. doi:10.1016/s0140-6736(03)15268-3
31. Shiwaku K, Anuurad E, Enkhmaa B, Kitajima K, Yamane Y. Appropriate BMI for Asian populations. Lancet. 2004;363(9414):1077. doi:10.1016/s0140-6736(04)15856-x
32. Wang T, Ma X, Tang T, et al. Overall and central obesity with insulin sensitivity and secretion in a Han Chinese population: a Mendelian randomization analysis. Int J Obes. 2016;40(11):1736–1741. doi:10.1038/ijo.2016.155
33. Fall T, Hägg S, Mägi R, et al. The role of adiposity in cardiometabolic traits: a Mendelian randomization analysis. PLoS Med. 2013;10(6):e1001474. doi:10.1371/journal.pmed.1001474
34. Xu M, Bi Y, Huang Y, et al. Type 2 diabetes, diabetes genetic score and risk of decreased renal function and albuminuria: a Mendelian randomization study. EBioMedicine. 2016;6:162–170. doi:10.1016/j.ebiom.2016.02.032
35. Tan X, Alén M, Cheng SM, et al. Associations of disordered sleep with body fat distribution, physical activity and diet among overweight middle-aged men. J Sleep Res. 2015;24(4):414–424. doi:10.1111/jsr.12283
36. Liu Y, Zou J, Qian Y, et al. The association between obesity indices and obstructive sleep apnea is modified by age in a sex-specific manner. Sleep Breath. 2021;25(1):189–197. doi:10.1007/s11325-020-02083-4
37. Mazzuca E, Battaglia S, Marrone O, et al. Gender-specific anthropometric markers of adiposity, metabolic syndrome and visceral adiposity index (VAI) in patients with obstructive sleep apnea. J Sleep Res. 2014;23(1):13–21. doi:10.1111/jsr.12088
38. Babb TG, Wyrick BL, DeLorey DS, Chase PJ, Feng MY. Fat distribution and end-expiratory lung volume in lean and obese men and women. Chest. 2008;134(4):704–711. doi:10.1378/chest.07-1728
39. Pahkala R, Seppä J, Ikonen A, Smirnov G, Tuomilehto H. The impact of pharyngeal fat tissue on the pathogenesis of obstructive sleep apnea. Sleep Breath. 2014;18(2):275–282. doi:10.1007/s11325-013-0878-4
40. Chen HC, Wang CJ, Lo YL, Hsu HC. Parapharyngeal fat pad area at the subglosso-supraglottic level is associated with corresponding lateral wall collapse and apnea-hypopnea index in patients with obstructive sleep apnea: a pilot study. Sci Rep. 2019;9(1):17722. doi:10.1038/s41598-019-53515-5
41. Rashid NH, Zaghi S. The value of oxygen desaturation index for diagnosing obstructive sleep apnea: a systematic review. Laryngoscope. 2021;131(2):440–447. doi:10.1002/lary.28663
42. Chung F, Liao P, Elsaid H, Islam S, Shapiro CM, Sun Y. Oxygen desaturation index from nocturnal oximetry: a sensitive and specific tool to detect sleep-disordered breathing in surgical patients. Anesth Analg. 2012;114(5):993–1000. doi:10.1213/ANE.0b013e318248f4f5
43. Wang L, Ou Q, Shan G. Independent association between oxygen desaturation index and cardiovascular disease in non-sleepy sleep-disordered breathing subtype: a Chinese Community-Based Study. Nat Sci Sleep. 2022;14:1397–1406. doi:10.2147/nss.s370471
44. Trzepizur W, Blanchard M, Ganem T. Sleep apnea-specific hypoxic burden, symptom subtypes, and risk of cardiovascular events and all-cause mortality. Am J Respir Crit Care Med. 2022;205(1):108–117. doi:10.1164/rccm.202105-1274OC
45. Labarca G, Vena D, Hu W-H. Sleep apnea physiological burdens and cardiovascular morbidity and mortality. Am J Respir Crit Care Med. 2023;208(7):802–813. doi:10.1164/rccm.202209-1808OC
46. Ernst G, Bosio M, Salvado A, Dibur E, Nigro C, Borsini E. Difference between apnea-hypopnea index (AHI) and oxygen desaturation index (ODI): proportional increase associated with degree of obesity. Sleep Breath. 2016;20(4):1175–1183. doi:10.1007/s11325-016-1330-3
47. Peppard PE, Ward NR, Morrell MJ. The impact of obesity on oxygen desaturation during sleep-disordered breathing. Am J Respir Crit Care Med. 2009;180(8):788–793. doi:10.1164/rccm.200905-0773OC
48. Snyder B, Cunningham RL. Sex differences in sleep apnea and comorbid neurodegenerative diseases. Steroids. 2018;133:28–33. doi:10.1016/j.steroids.2017.12.006
49. Bonsignore MR, Saaresranta T, Riha RL. Sex differences in obstructive sleep apnoea. Eur Respir Rev. 2019;28(154):190030. doi:10.1183/16000617.0030-2019
50. Ye L, Pien GW, Weaver TE. Gender differences in the clinical manifestation of obstructive sleep apnea. Sleep Med. 2009;10(10):1075–1084. doi:10.1016/j.sleep.2009.02.006
51. Mohsenin V. Effects of gender on upper airway collapsibility and severity of obstructive sleep apnea. Sleep Med. 2003;4(6):523–529. doi:10.1016/s1389-9457(03)00168-0
52. Helvaci N, Karabulut E, Demir AU, Yildiz BO. Polycystic ovary syndrome and the risk of obstructive sleep apnea: a meta-analysis and review of the literature. Endoc Connect. 2017;6(7):437–445. doi:10.1530/ec-17-0129
53. Peppard PE, Young T, Barnet JH, Palta M, Hagen EW, Hla KM. Increased prevalence of sleep-disordered breathing in adults. Am J Epidemiol. 2013;177(9):1006–1014. doi:10.1093/aje/kws342
54. Mong JA, Cusmano DM. Sex differences in sleep: impact of biological sex and sex steroids. Philos Trans R Soc Lond B Biol Sci. 2016;371(1688):20150110. doi:10.1098/rstb.2015.0110
55. Punjabi NM. The epidemiology of adult obstructive sleep apnea. Proc Am Thorac Soc. 2008;5(2):136–143. doi:10.1513/pats.200709-155MG
56. Xu H, Zhang P, Han X, et al. Sex effect on obesity indices and metabolic outcomes in patients with obese obstructive sleep apnea and type 2 diabetes after laparoscopic roux-en-y gastric bypass surgery: a preliminary study. Obes Surg. 2016;26(11):2629–2639. doi:10.1007/s11695-016-2140-1
 © 2023 The Author(s). This work is published and licensed by Dove Medical Press Limited. The
full terms of this license are available at https://www.dovepress.com/terms
and incorporate the Creative Commons Attribution
- Non Commercial (unported, 3.0) License.
By accessing the work you hereby accept the Terms. Non-commercial uses of the work are permitted
without any further permission from Dove Medical Press Limited, provided the work is properly
attributed. For permission for commercial use of this work, please see paragraphs 4.2 and 5 of our Terms.
© 2023 The Author(s). This work is published and licensed by Dove Medical Press Limited. The
full terms of this license are available at https://www.dovepress.com/terms
and incorporate the Creative Commons Attribution
- Non Commercial (unported, 3.0) License.
By accessing the work you hereby accept the Terms. Non-commercial uses of the work are permitted
without any further permission from Dove Medical Press Limited, provided the work is properly
attributed. For permission for commercial use of this work, please see paragraphs 4.2 and 5 of our Terms.