Back to Journals » International Journal of Chronic Obstructive Pulmonary Disease » Volume 15
Oscillation Mechanics, Integer and Fractional Respiratory Modeling in COPD: Effect of Obstruction Severity
Authors Ribeiro CO ![]() , Lopes AJ
, Lopes AJ ![]() , Melo PL
, Melo PL
Received 12 August 2020
Accepted for publication 9 November 2020
Published 8 December 2020 Volume 2020:15 Pages 3273—3289
DOI https://doi.org/10.2147/COPD.S276690
Checked for plagiarism Yes
Review by Single anonymous peer review
Peer reviewer comments 3
Editor who approved publication: Prof. Dr. Richard Russell
Caroline Oliveira Ribeiro,1 Agnaldo José Lopes,2,3 Pedro Lopes de Melo1
1Biomedical Instrumentation Laboratory, Institute of Biology and Faculty of Engineering, State University of Rio de Janeiro, Rio de Janeiro, Brazil; 2Pulmonary Function Laboratory, State University of Rio de Janeiro, Rio de Janeiro, Brazil; 3Pulmonary Rehabilitation Laboratory, Augusto Motta University Center, Rio de Janeiro, Brazil
Correspondence: Pedro Lopes de Melo
Biomedical Instrumentation Laboratory, Institute of Biology and Faculty of Engineering, State University of Rio de Janeiro, Rua São Francisco Xavier 524, Pavilhão Haroldo Lisboa da Cunha, Sala 104 Maracanã, Rio de Janeiro 20550-013, RJ, Brazil
Tel +55-21-2334-0705
Email [email protected]
Purpose: This research examines the emerging role of respiratory oscillometry associated with integer (InOr) and fractional order (FrOr) respiratory models in the context of groups of patients with increasing severity. The contributions to our understanding of the respiratory abnormalities along the course of increasing COPD severity and the diagnostic use of this method were also evaluated.
Patients and Methods: Forty-five individuals with no history of smoking or pulmonary diseases (control group) and 141 individuals with diagnoses of COPD were studied, being classified into 45 mild, 42 moderate, 36 severe and 18 very severe cases.
Results: This study has shown initially that the course of increasing COPD severity was adequately described by the model parameters. This resulted in significant and consistent correlations among these parameters and spirometric indexes. Additionally, this evaluation enhanced our understanding of the respiratory abnormalities in different COPD stages. The diagnostic accuracy analyses provided evidence that hysteresivity, obtained from FrOr modeling, allowed a highly accurate identification in patients with mild changes [area under the receiver operator characteristic curve (AUC)= 0.902]. Similar analyses in groups of moderate and severe patients showed that peripheral resistance, derived from InOr modeling, provided the most accurate parameter (AUC=0.898 and 0.998, respectively), while in very severe patients, traditional, InOr and FrOr parameters were able to reach high diagnostic accuracy (AUC> 0.9).
Conclusion: InOr and FrOr modeling improved our knowledge of the respiratory abnormalities along the course of increasing COPD severity. In addition, the present study provides evidence that these models may contribute in the diagnosis of COPD. Respiratory oscillometry exams require only tidal breathing and are easy to perform. Taken together, these practical considerations and the results of the present study suggest that respiratory oscillometry associated with InOr and FrOr models may help to improve lung function tests in COPD.
Keywords: chronic obstructive pulmonary disease, COPD physiopathology, diagnostic of respiratory diseases, oscillation mechanics, respiratory oscillometry, respiratory modeling, integer-order modeling, fractional-order modeling
Introduction
Chronic obstructive pulmonary disease (COPD) is one of the main causes of morbidity and mortality worldwide. It is responsible for a major public health issue in the 21st century, resulting in an increasing economic and social burden. It is currently the fourth and will soon become the third most frequent cause of death, accounting for 6% of all deaths in the world.1,2 COPD is defined as a chronic respiratory condition that is characterized by a persistent progressive limitation of airflow associated with an inflammatory response in the airways and lung, responsive to harmful particles or gases.2,3 Airflow limitation, which is characteristic of the disease, is basically caused by four major mechanisms: loss of elasticity; alveolar destruction as a result of emphysema; decrease in airway calibers; and obstruction of small airways with secretion, a result of chronic bronchitis.4
Airflow limitation is usually diagnosed by spirometry, an exam performed to classify and grade the severity of the disease. The diagnosis occurs from the ratio of volume expired in the first second/forced vital capacity (FEV1/FVC) after bronchodilator (BD) <0.70, and its classification in stages is based on the parameter of volume expired in the first second (FEV1).2,4,5
Despite being considered the gold standard, spirometry requires high cooperation on the part of the volunteers, and great effort in the execution of the expiratory maneuver. These factors become a major disadvantage, since this procedure can temporarily cause several changes in bronchomotor tone, which can result in variation in the quality of the final exam results.6,7
The forced oscillation technique (FOT), also known as respiratory oscillometry, consists of a non-invasive method, which aims to assess the resistance and reactance of the respiratory system during spontaneous ventilation. The method is based on the application of sinusoidal pressure variations in the opening of the airway through a mouthpiece during spontaneous ventilation. The exam is simple to perform, requiring a short time to be performed and little collaboration from patients.8,9 This method has reached a high level of sophistication, currently representing the state of the art in terms of assessing lung function. It has been successfully applied in our laboratory and in several other research groups to diagnose changes in respiratory mechanics associated with various diseases.10–18
The extended RIC model (eRIC) has been suggested as a model that shows improvements compared to the basic RIC model. In these models, R is the central airway resistance analog, Rp describes peripheral resistance, and I and C are associated with pulmonary inertia and compliance, respectively. The eRIC model can also be used to assess total resistance (Rt = R + Rp).19
Fractional-order models (FrOr) in combination with respiratory oscillometry have recently been proposed, allowing a more detailed and accurate description of the dynamic behavior of the respiratory system.20–24 These models help to obtain a new view on the mechanisms associated with peripheral changes in the diseased lung.25 They can provide information associated with resistive properties and hysteresis, which reflects the increase in heterogeneity and changes in lung structure. Information is also provided on the damping factor, associated with parenchymal deformity and elastance.18,25
A previous study by our group showed that these parameters are adequate to describe the initial effects of COPD, observed in individuals with mild disease.18 However, there are no studies in the literature evaluating the description of the effects of COPD in advanced stages using these models. The contribution to the understanding of the pathophysiology of COPD and the diagnostic use of these models has not yet been investigated.
In this context, the main objectives of this study were to 1) analyze the potential of respiratory oscillometry combined with the eRIC and FrOr models in the different classifications of COPD; and 2) determine the best parameters for diagnosing the different stages of the disease.
Patients and Methods
Study Design
The respiratory oscillometry and spirometry tests were evaluated at the Biomedical Instrumentation Laboratory of the Roberto Alcântara Gomes Biology Institute at the State University of Rio de Janeiro (LIB/UERJ). The study was conducted in accordance with the Declaration of Helsinki, and was approved by the Research Ethics Committee of the Pedro Ernesto University Hospital. Prior to the tests, the volunteers were previously informed of the research and gave their consent by signing the informed consent form (ICF).
For the control group, healthy volunteers were recruited. They were over 40 years old, non-smokers, with no history of respiratory infections in the last thirty days at the time of the exams, no pulmonary, cardiovascular or orthopedic diseases, clinically stable, and with spirometric and respiratory oscillometry exams compatible with normality.26,27 Patients were classified according to the GOLD criteria.2 Patients over 40 years old with a previous diagnosis of COPD, in mild, moderate, severe and very severe disease stages, were studied. They had no history of respiratory infections in the last thirty days at the time of exams and no history of cardiovascular or orthopedic diseases. Before the exams were performed, all patients took their usual medication, except for the use of bronchodilators (BD), to avoid interference in the assessment, as established by the American Thoracic Society/European Respiratory Society (ATS/ERS).28
All examinations were performed by a duly qualified and experienced operator. All research subjects were instructed to avoid large meals before the exams were performed. The following spirometric parameters were evaluated: Forced Vital Capacity (FVC), forced expiratory volume in the first second (FEV1), FEV1/FVC ratio, Expiratory Flow 25–75% (FEF25-75%) and FEF25-75/FVC ratio.
Respiratory Impedance Measurements
For the evaluation of respiratory mechanics, a multi-frequency respiratory oscillometry was performed, where pressure oscillations were applied in the frequency range of interest (4–32 Hz), with amplitude of approximately 1 cmH2O produced by a loudspeaker coupled to the respiratory system through of a nozzle for individual use. The resulting flow and pressure signals were measured close to the mouth by a pneumotachograph and a pressure transducer, respectively.
During examinations, volunteers remain seated with their heads in a neutral position, use a nose clip, maintain spontaneous breathing through a mouthpiece and must firmly support their cheeks and chin with both hands to minimize shunt. Three tests were conducted, each lasting 16 seconds, with the mean score being adopted as the final result. To be considered acceptable, the test should be free of respiratory pauses and presented stable tidal volumes. Common artifacts, such as coughs, swallows and leaks, were identified observing the pressure and flow signals. The forced pseudo-random noise used in this study was composed of a frequency range between 4 and 32 Hz. To exclude outlying values, the coefficient of variability at the lowest oscillation frequency (4Hz) of the three tests used was ≤10%. To reduce the influence of spontaneous breathing, the minimum coherence function (CF) for acceptable results was 0.9. The exams were repeated until all frequencies analyzed had this minimum CF value.
Respiratory resistance curves were submitted to linear regression analysis in the 4–16 Hz range, which allowed us to obtain the respiratory resistance extrapolated at 0 Hz (R0), and the frequency dependence of Rrs expressed as the slope (S) of the linear relationship between the resistive impedance and frequency. We also calculated the mean resistance (Rm) in this frequency range. R0 describes the low-frequency range, reflecting the Newtonian resistance of the respiratory system. This includes the resistance of the airways and tissue resistance originating from the lung and chest wall, along with the effect of gas redistribution (pendelluft).29 S describes the resistance change with frequency and is related to respiratory system non-homogeneities,30 while Rm is related with the mid-frequency range resistance, which is sensitive to the airway caliber, reflecting resistance in the central airways.31 There is not a consensus in the literature concerning what are the best parameters to interpret respiratory impedance curves. To contribute to elucidate this question, other widely used respiratory resistance parameters were also analyzed: the resistances at 4 Hz (R4), 12 Hz (R12) and 20 Hz (R20), representing the low, mid and high-frequency spectra, respectively, and the frequency dependence of resistance, which was represented as the difference between R4 and R20 (R4-R20).
The imaginary part of the impedance was interpreted using five indexes: mean reactance (Xm), resonance frequency (fr) and respiratory system dynamic compliance (Cdyn), the impedance module, and the area under the reactance curve (Ax). Mean reactance was calculated using the 4 to 32 Hz frequency range and describes respiratory system inhomogeneity. The frequency at which Xrs becomes zero is known as the resonance frequency.32 Cdyn reflects the total compliance of the respiratory system, including airway compliance, chest wall compliance and pulmonary compliance. This parameter is also related to the homogeneity of the respiratory system.31 The reactance at 4 Hz was used to calculate Cdyn (Cdyn = 1/2πfX4). The total mechanical load of the respiratory system was studied analyzing the 4 Hz impedance module (Z4), which reflects respiratory resistance and compliance.33 Ax was also analyzed using the area from the triangle composed by the lowest frequency (4Hz), the associated reactance (X4) and the fr.8
Integer-Order Respiratory Modeling
Multifrequency impedance analyses using models with equivalent electrical circuits enable a detailed description of the respiratory system. In addition to being useful for improving our understanding of respiratory biomechanics, these parameters can improve the detection, diagnosis and, consequently, the treatment of lung diseases.
In the particular case of the extended RIC model (eRIC, Figure 1), the peripheral resistance (Rp) enables observing the frequency dependence of the typical data of the real impedance component, which are beyond the capacity of the traditional RIC model.
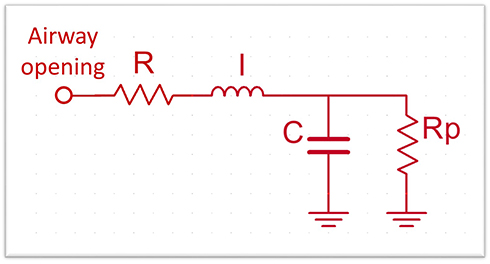 |
Figure 1 Two-compartment integer-order modeling used to describe the respiratory system. The resistance (R), inductance (I) and capacitance (C), reflects respiratory resistance, inertance and compliance, respectively. The small airways (peripheral) resistance is represented by Rp. |
This additional component describes the resistance presented by the small airways in the respiratory system. In this study, we also assessed total resistance (Rt = R + Rp), which includes the effects of central and peripheral airways.19
Fractional-Order Respiratory Modeling
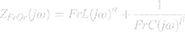
The fractional-order model (FrOr) (Figure 2) is described in Equation 1. This model was the one that performed better in a previous comparative study investigating the use of several fractional models in asthma.25 It includes a frequency-dependent inertia (FrL), which takes into account the ability of fractional terms to approximate resistive properties (0≤α≤1) and a tissue-related component described as a constant-phase impedance in the form of a fractional compliance (FrC) associated with a fractional coefficient (0≤β≤1).
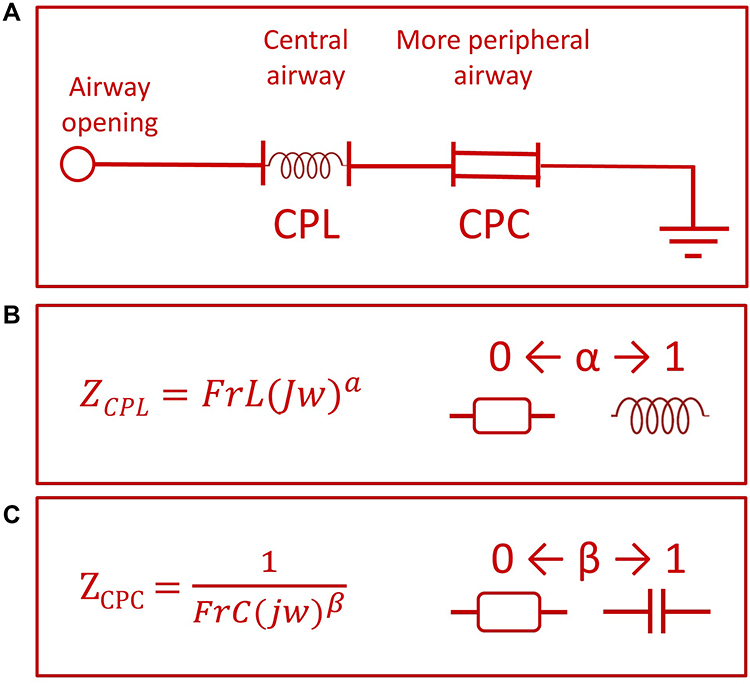 |
Figure 2 Fractional-order two compartment model used (A), including a constant phase inertance (CPL) and a constant phase compliance (CPC) composed by a fractional inertance (FrL) and a fractional compliance (FrC). The ability of the fractional elements FrL and FrC to describe the resistive and reactive respiratory properties, depending of α and β values, is described in (B) and (C), respectively. |
These results were interpreted physiologically using the damping factor (G, equation 2), elastance (H, equation 3) and the hysteresis coefficient (η, equation 4), as described below:


The damping factor is associated with energy dissipation in the respiratory system, while H reflects the potential storage of elastic energy (elastance). Hysteresivity describes the heterogeneity of pulmonary ventilation.18,25
The parameters of the eRIC and FrOr models were estimated using the ModeLIB program, developed at LIB/UERJ using the LABVIEW™ 2018 (National Instruments, Austin, TX) environment. This program uses the Levenberg-Marquardt algorithm to determine the set of parameters of the model that best represents the input data established in terms of least squares. Together with the model estimates, this analysis also provides the calculation of the error value, defined as the square root of the sum of the quadratic errors (MSE) in the impedance adjustments in the real and imaginary curves.19 A further error analysis was performed using the mean relative distance from the model and measured resistance and reactance values (Rd), according to the procedure used by Oostveen et al.34
Statistical Analysis
To obtain the sample size necessary for this research, the MedCalc® 13 software (MedCalc Software, Mariakerke, Belgium) was used. The average value used for calculation was based on a previous study18 and preliminary results from the present study, with type I and type II errors of 2.5% being assumed. These analyses resulted in a minimum number of 45 volunteers in the control group, and 45 patients with mild cases, 26 moderate, 16 severe and 11 very severe.
The distribution characteristics of the samples were evaluated using the Shapiro–Wilk normality test. When the sample showed a normal distribution behavior (parametric), the One-Way ANOVA test was used. On the other hand, when the distribution showed a non-normal (non-parametric) characteristic, the Kruskal–Wallis ANOVA test was used. For analysis between groups with parametric distribution, the independent Student's t-test was used, and for non-parametric, Mann Whitney was used. Statistical analyses were performed using the OriginLab Origin® 8.0 program (Microcal Software Inc, Northampton, USA).
The assessment of sensitivity and specificity through the elaboration of the ROC (Receiver Operating Curve) was carried out to identify the potential diagnosis among patients with mild COPD and smokers through the parameters of respiratory oscillometry. The software used for this calculation was the program MedCalc® 14.12.0 (MedCalc Software, Mariakerke, Belgium). ROCs with AUC ≥ 0.80 were considered suitable for diagnostic use, while AUC between 0.90 and 1.00 were considered indicative of high diagnostic accuracy.35
The relationships among the model and spirometric parameters were analyzed using Spearman correlation coefficients. These analyses were performed using GraphPad Prism 7, and the interpretation of these results was based on the classification proposed by Dawson and collaborators.36 To reduce the chances of making a Type I error, the significance level was corrected using the modified Bonferroni method, that considers the computation of several correlations.37 This was conducted dividing the p-value by an estimate of the number of independent correlations used. In general, four independent variables are usually observed in traditional pulmonary function analysis, while two independent variables are related with the resistive and reactive characteristics of the FOT. As a result, we used a corrected significance level related with eight independent correlations (0.0063=0.05/8).
Results
The anthropometric and spirometric characteristics of the groups studied are described in Table 1. We can see that there was an increase in age and smoking load (SL), and a decrease in body mass and body mass index (BMI). There was no change in height between the groups studied. All spirometric parameters were significantly reduced in individuals with COPD.
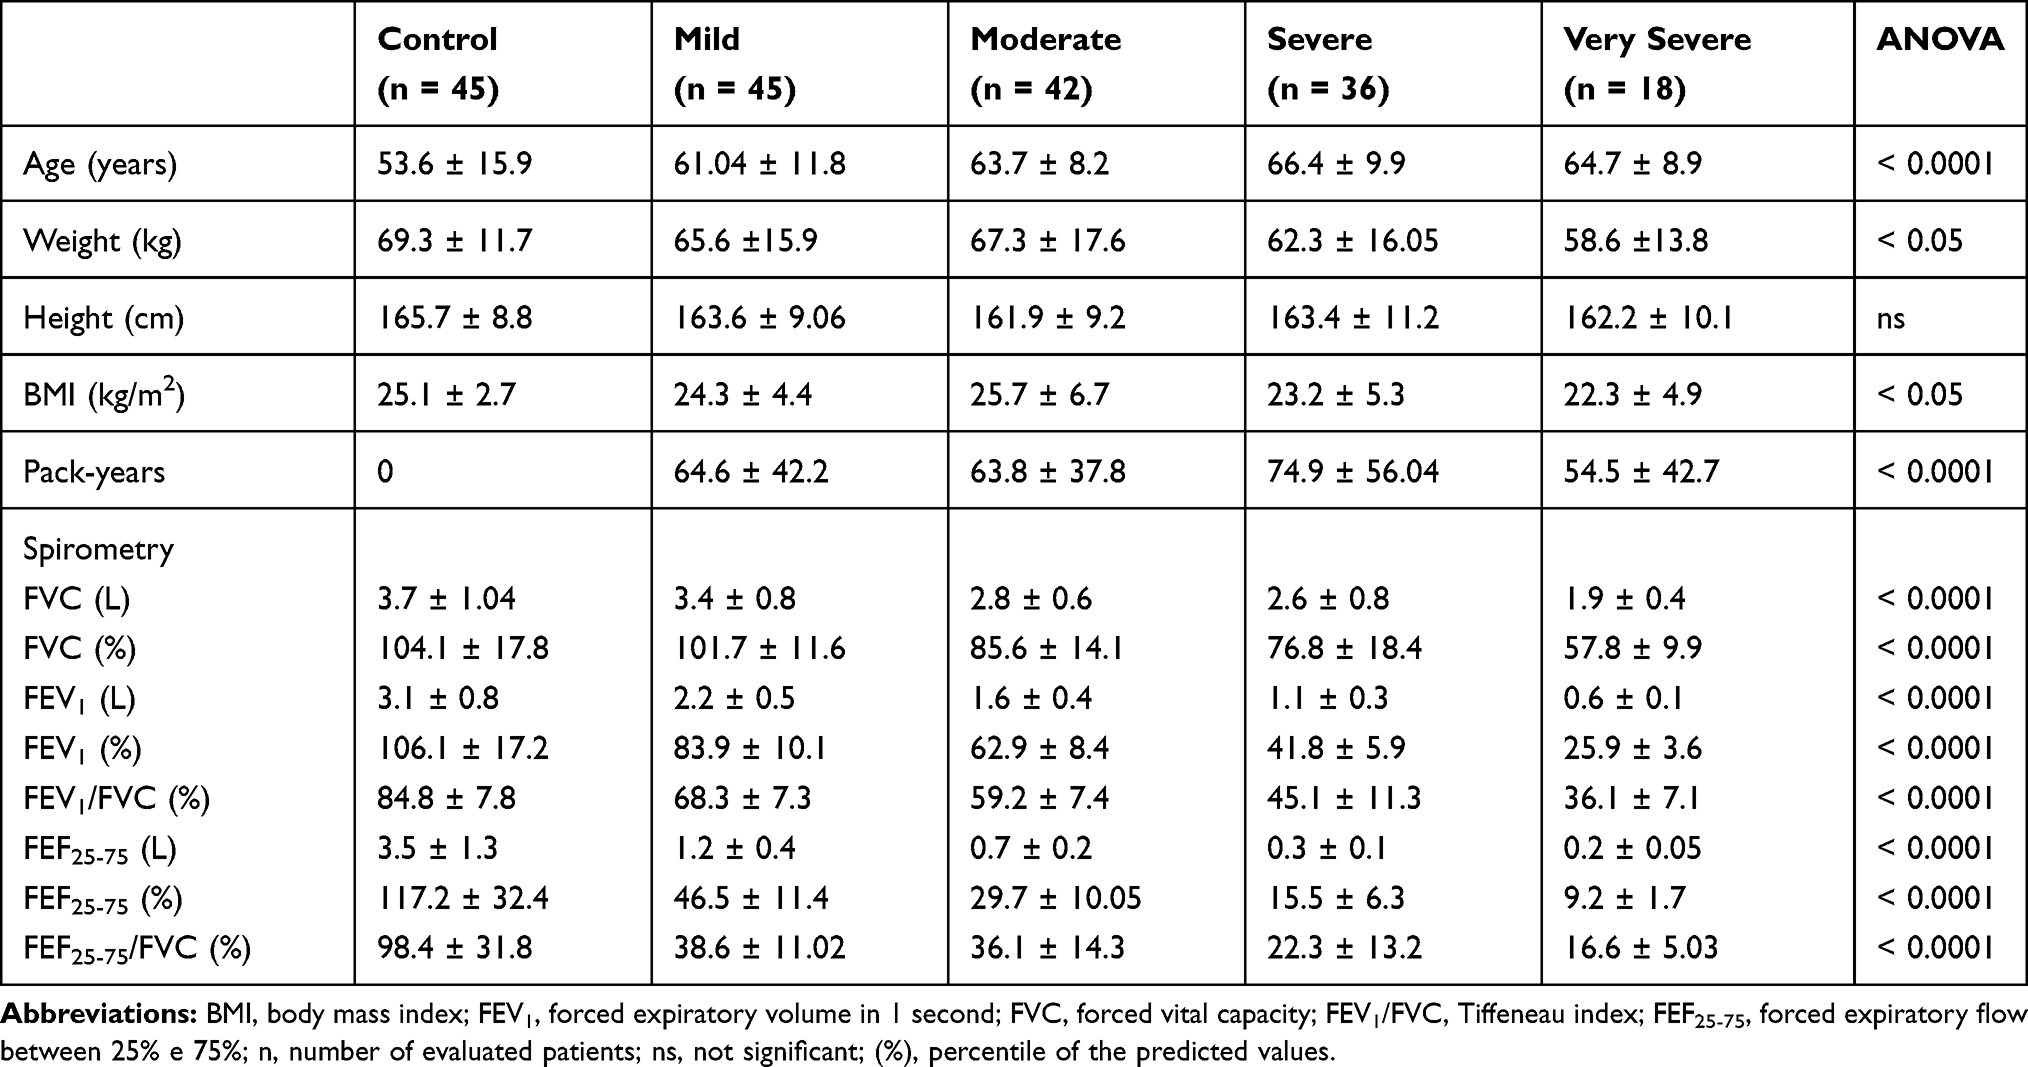 |
Table 1 Anthropometric and Spirometric Measurements of the Groups Studied |
Respiratory Impedance Curves and Associated Traditional Parameters
Figure 3 describes the results of the mean respiratory resistance (A) and reactance (B) curves in controls and patients with COPD. The worsening of the disease increased the resistance values (Figure 3A) and introduced more negative reactance values (Figure 3B).
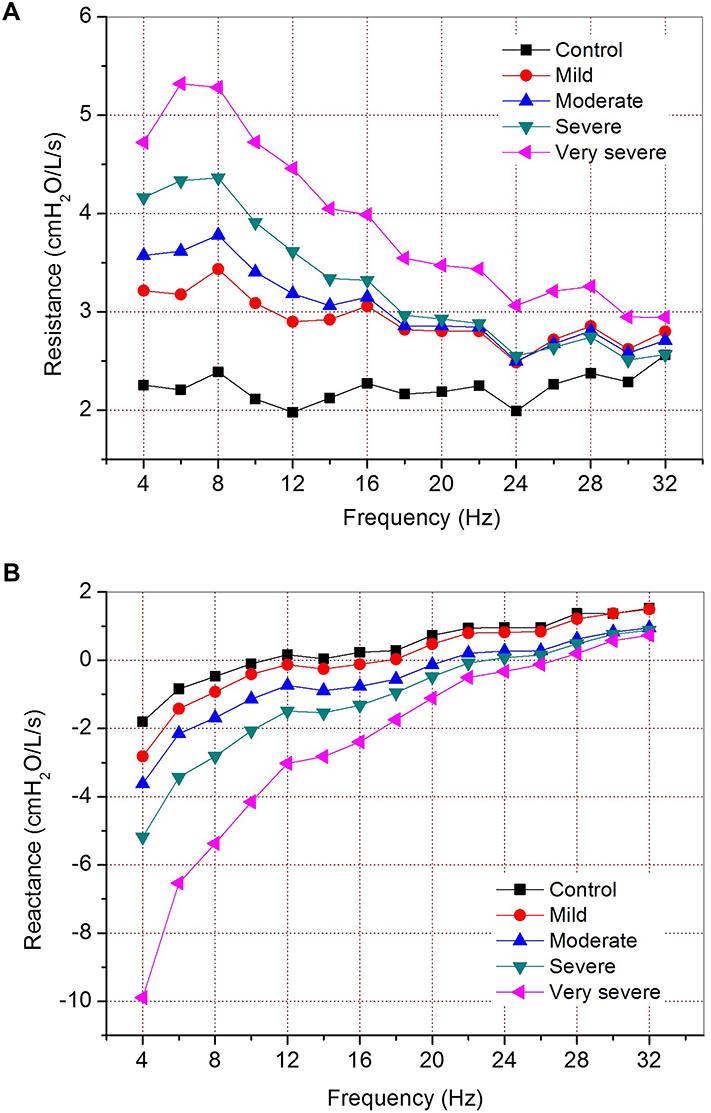 |
Figure 3 Mean respiratory resistance (A) and reactance (B) curves obtained in the five studied groups, showing progressively increased values of resistance and more negative reactance with COPD severity. |
Table 2 presents the traditional parameters of respiratory oscillometry. All parameters showed significant changes (p <0.0001), with increases in resistive parameters (R0, Rm, R4, R12, R20, R4-R20), and more negative values of S.
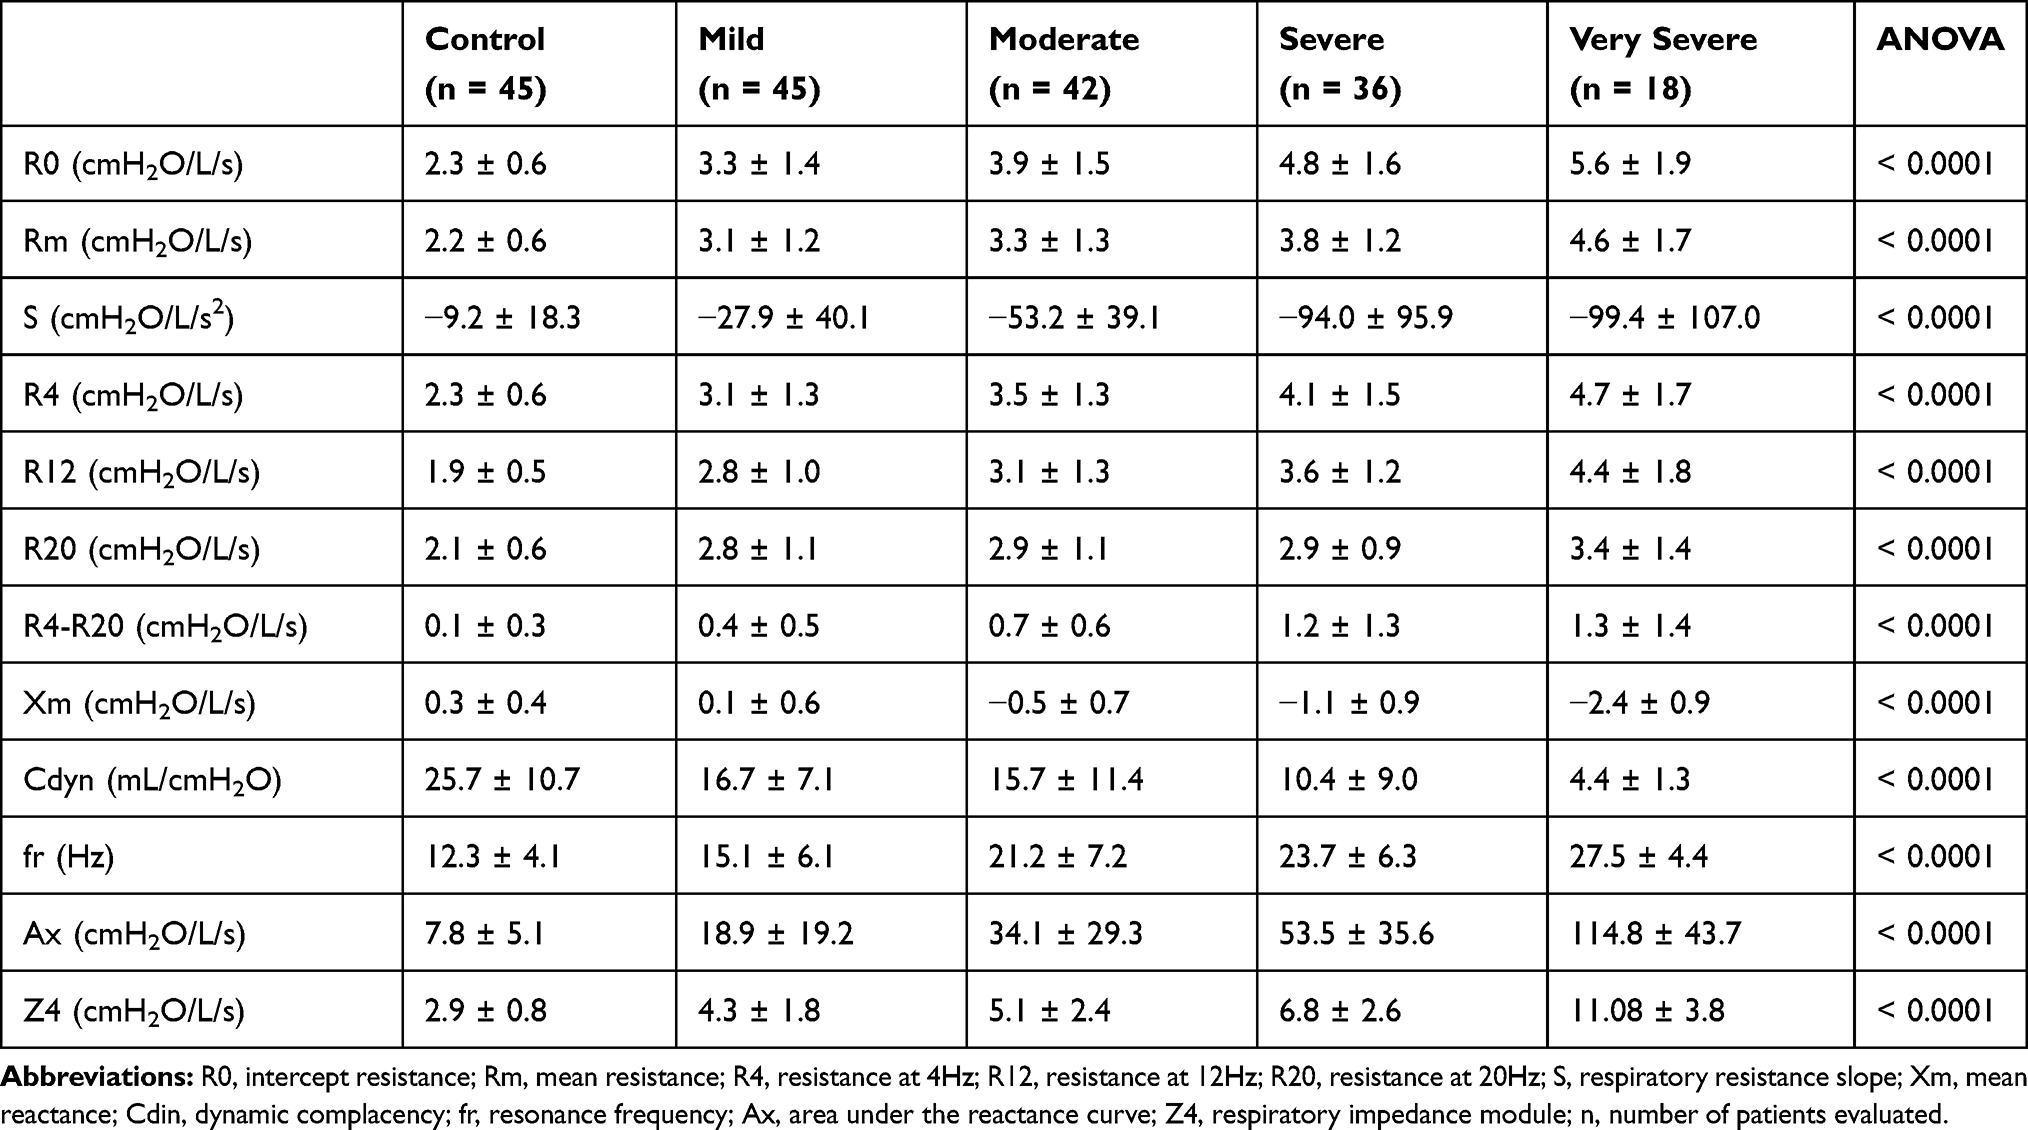 |
Table 2 Measurements of Traditional Respiratory Oscillometry of the Groups Under Study |
In terms of reactive parameters, progressively more negative values were observed in Xm, lower in Cdyn and progressively higher in terms of fr, Ax and Z4 with the severity of COPD.
Respiratory Modeling
Figure 4 describes the results obtained using the eRIC model in the groups under study. The values of R, Rp and Rt increased with the progression of COPD, while progressive reductions in I and C were observed with the progression of COPD.
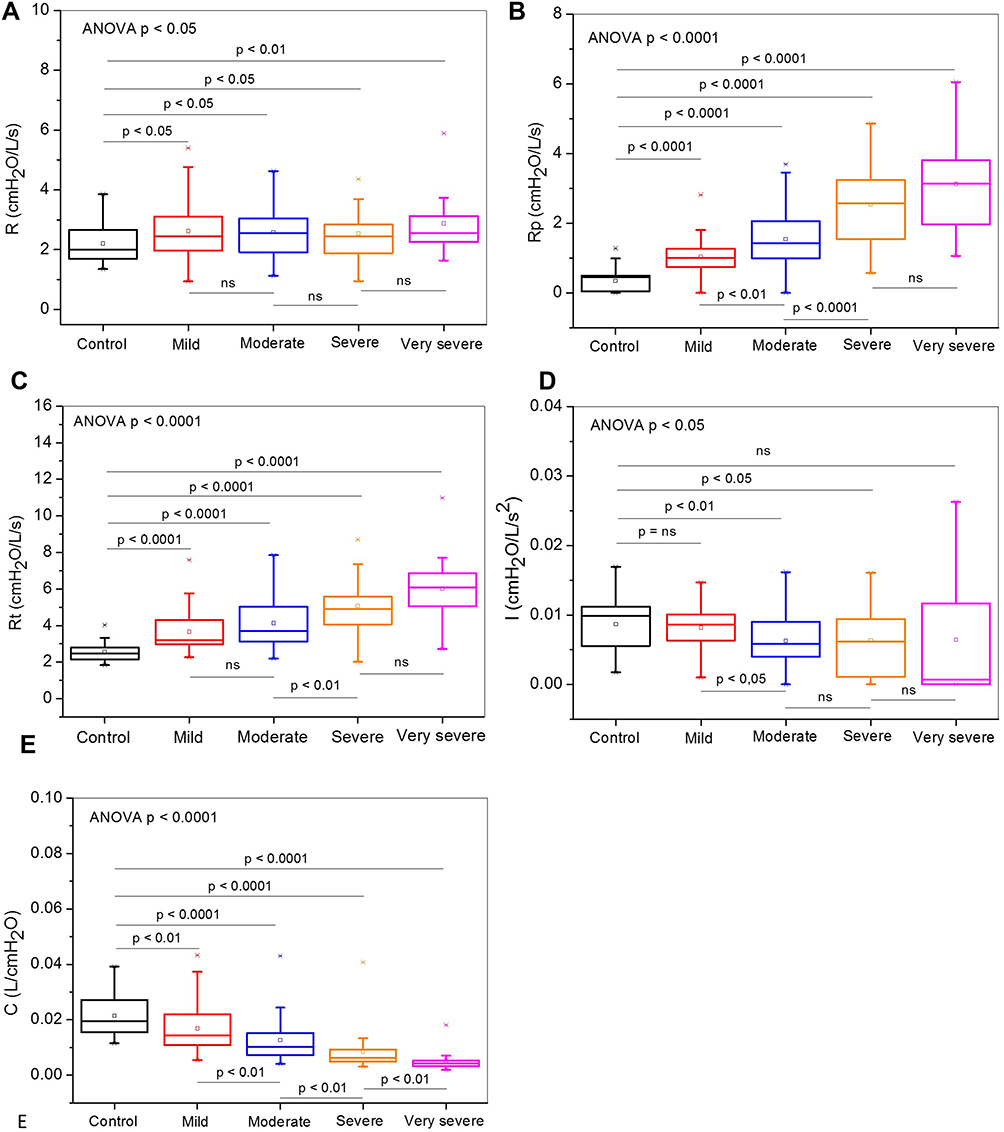 |
Figure 4 Effect of increasing COPD severity on the parameters estimated in the extended RIC model. Central airway resistance (R; A), peripheral resistance (Rp; B), total resistance (Rt; C), pulmonary inertance (I; D), and alveolar compliance (C; E). |
Significant increases were observed in G and η (Figure 5). H showed significant reductions in patients with mild and moderate COPD, showing significant elevation in very severe patients.
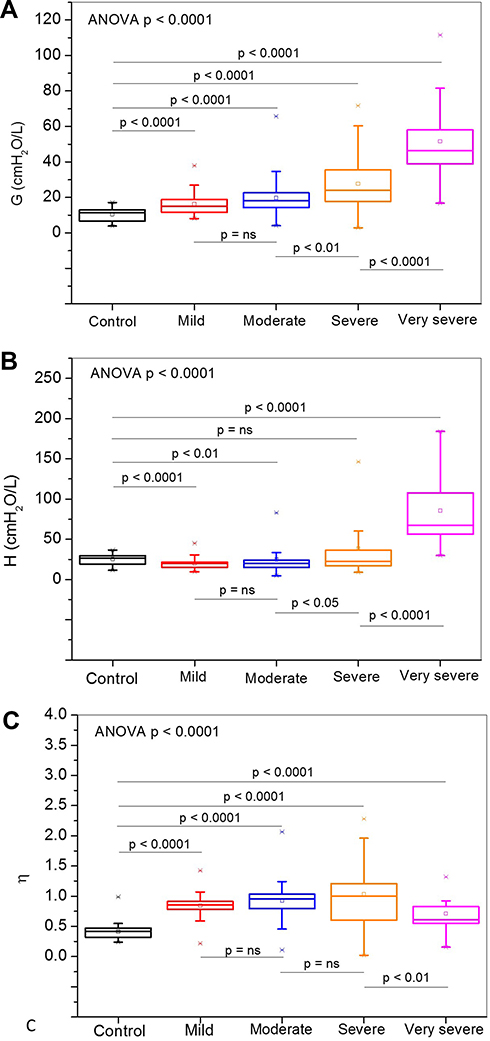 |
Figure 5 Fractional-order model parameters changes with increasing degree of severity in COPD, damping factor (G, figure A); respiratory elastance (H, B) and hysteresivity (η, C).Abbreviation: ns, not significant. |
The error values in the adjustments in the real and imaginary parts of the impedance and the mean relative distances for the studied models are described in Figure 6. The interested reader may find a detailed description of these values in Table S1. In general, the MSE errors increased with disease severity, and FrOr model presented smaller errors (Figure 6A). The relative distance (Figure 6B) was approximately constant in the eRIC model, while in the FrOr model this distance decreased with disease severity.
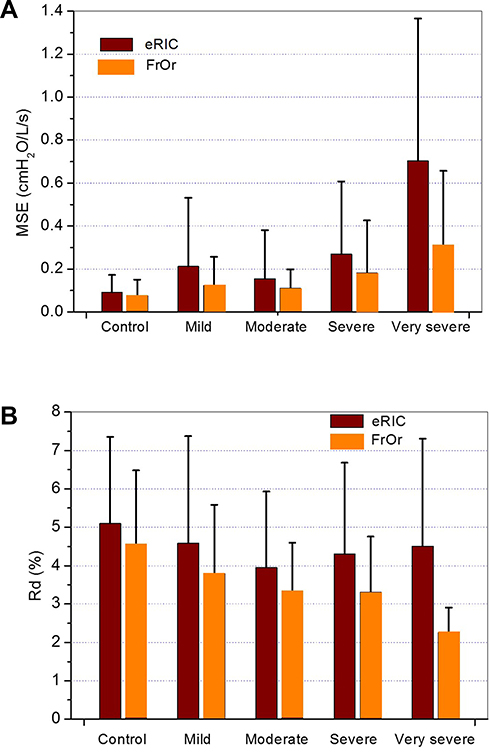 |
Figure 6 Adjustment errors in the integer and fractional-order models in the studied groups comparing the mean square errors fitting the resistance curves (MSE, figure A) and the relative distance (Rd, figure (B). |
Correlation of eRIC and FrOr Model Parameters with Spirometry and Smoking Load
The correlation analyses between the eRIC and FrOr model with spirometry are described in Tables 3 and 4, respectively. Considering the eRIC model, the strongest correlations were presented by Rp and Rt, showing a good and inverse correlation with FEV1% and FEV1 (L), respectively. In FrOr modeling, the strongest correlation was between G and FEV1 (%), showing a good and inverse correlation.
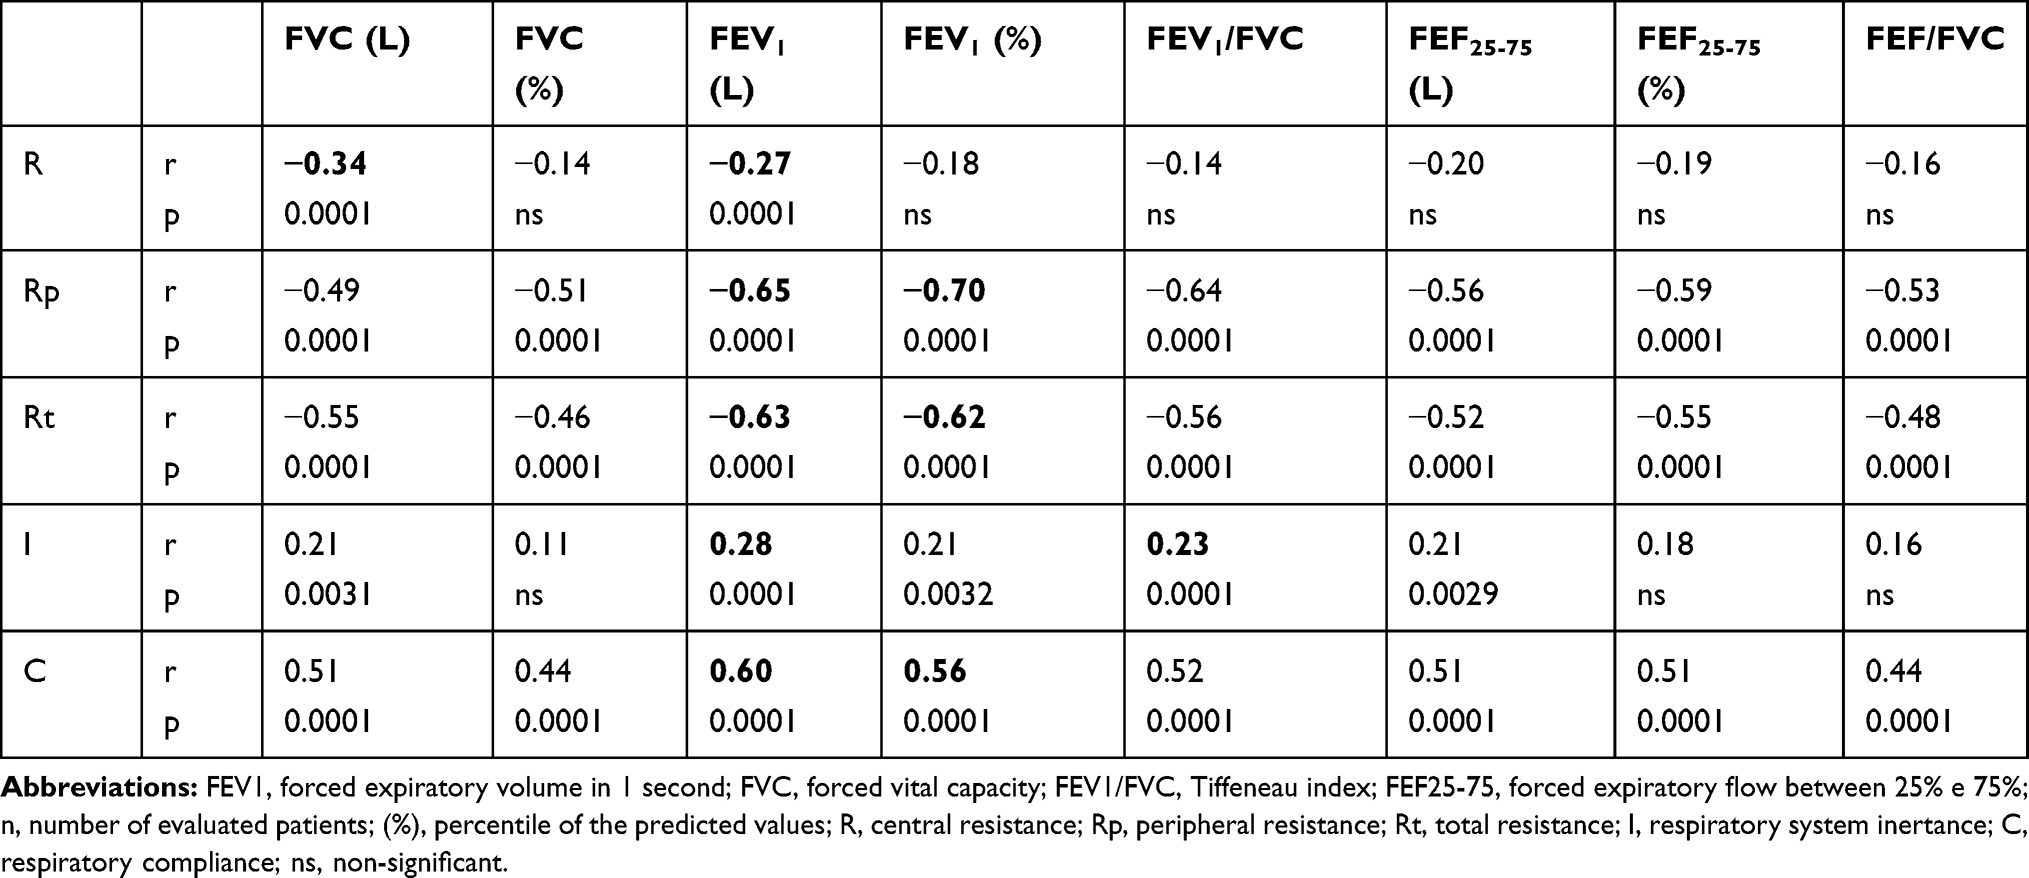 |
Table 3 Analysis of the Correlation Between the Parameters of the eRIC Model and the Spirometric Results. The Two Strongest Correlations for Each Parameter are Indicated in Bold |
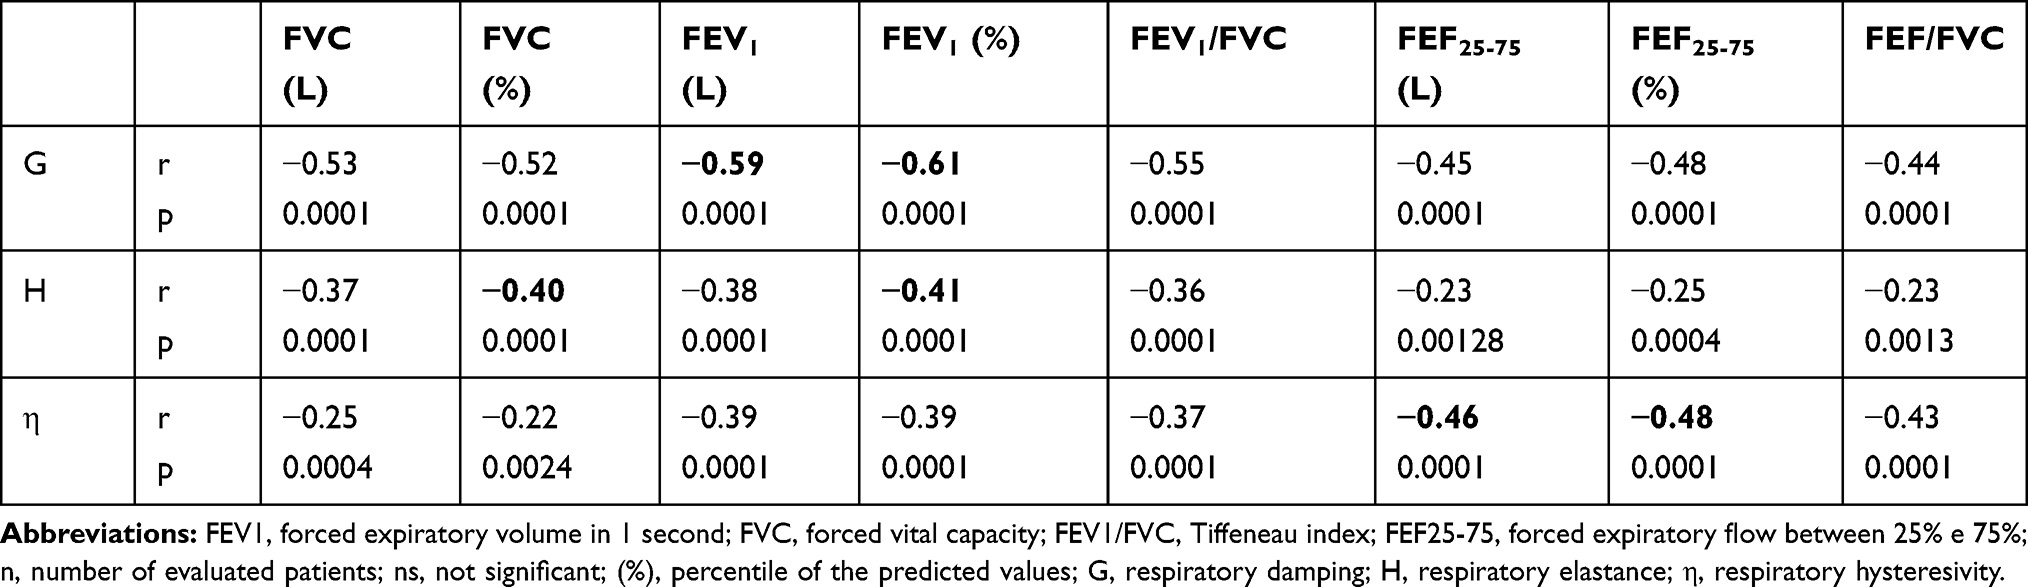 |
Table 4 Analysis of the Correlation Between the Parameters of the FrOr Model and the Spirometric Results. The Two Strongest Correlations for Each Parameter are Indicated in Bold |
No evidence was found for the associations between the eRIC and FrOr model parameters and smoking load in patients with COPD. The interested reader may find a detailed description of these values in Tables S2 and S3.
Diagnostic Accuracy of Traditional FOT, eRIC and FrOr Parameters
Figure 7 shows the AUC values and the associated confidence interval, as well as the comparison between the groups studied in the eRIC model. A detailed description of the results, in the form of tables, can be found in Table S4, traditional FOT parameters and Table S5, eRIC parameters.
 |
Figure 7 Area under the ROC curve (AUC) and 95% confidence interval in the studied groups. ns, not significant. Central resistance (R; figure (A), peripheral resistance (Rp; B), total resistance (Rt; C), pulmonary inertance (I; D), alveolar compliance (C; E). The dashed line describes the adequate value for clinical use (AUC≥0.8) and high diagnostic accuracy (AUC≥0.9). |
Figure 8 shows a similar analysis for the FrOr model. The interested reader can find a detailed description of these results in Table S6.
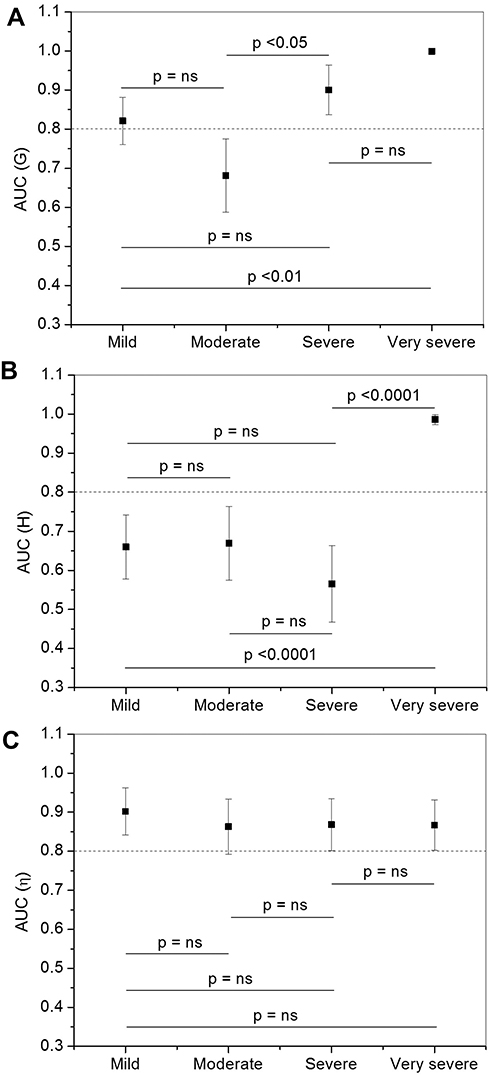 |
Figure 8 Area under the ROC curve (AUC) and 95% confidence interval observed in the fractional-order model. ns, not significant. Damping factor (G; figure A), elastance (H; B), Hysteresivity (η; C). The dashed line describes the adequate value for clinical use (AUC≥0.8) and high diagnostic accuracy (AUC≥0.9). |
Figure 9 compares the best parameters observed in the traditional analysis, eRIC and FrOr models in each of the COPD groups investigated.
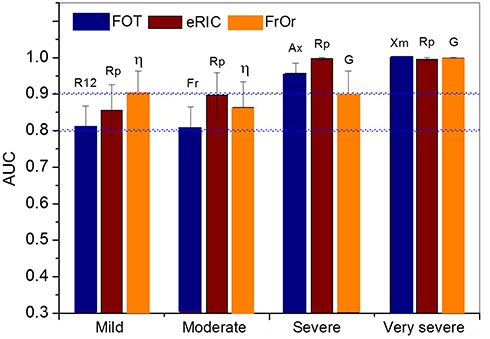 |
Figure 9 Comparisons of AUCs for the most accurate traditional FOT, eRIC and FrOr parameters in mild, moderate, severe, and very severe patients. Abbreviations: R12, resistance in 12 Hz; Rp, peripheral resistance; η, hysteresivity; Fr, resonant frequency; Ax, reactance area; G, damping factor; Xm, mean reactance. |
Discussion
Recommendations for research in COPD38 include the need for improved noninvasive mechanical tests of lung function. The present study was conducted as an effort to contribute in this direction, and five major findings were obtained: 1) the studied parameters provided a physiologically adequate description of the respiratory abnormalities along the course of increasing COPD severity; 2) significant associations were observed among these parameters and spirometric measurements; 3) the diagnostic accuracy increased with COPD severity; 4) FrOr modeling provided the most accurate approach in the identification of mild changes; and 5) the eRIC model provided the most accurate parameters in groups of moderate and severe patients, while traditional, eRIC and FrOr parameters reached high diagnostic accuracy in severe patients.
In the present study, age increased with the severity of COPD (Table 1). This is an expected result, since the evolution of the disease takes time. Although the number of pack-years consumed was similar among COPD groups, Table 1 shows a significant increase in the number of pack-years consumed. This can be attributed to the inclusion of the control group.
Weight and BMI decreased with the severity of COPD. These patients have an obstructive disorder, which confers a marked degree of oxidative stress, protease-antiprotease imbalance, inflammation and consequent reduction in body weight.39 The heights of the groups studied are similar; this is the parameter of greatest importance for the definition of impedance values.27 The reductions observed in the spirometric parameters were consistent with the classification values for the severity of COPD.2
The measurements of traditional respiratory oscillometry are described in Table 2. Smooth muscle hypertrophy and bronchial wall fibrosis are factors that can contribute to increases in airway and tissue resistance. The increases observed in resistive parameters are associated with inflammation of the mucous glands due to high levels of tobacco consumption, which results in airway obstruction.40,41 Similar results have been reported for silicosis.11
S and R4-R20 reflects the heterogeneity of the respiratory system.42 Recent studies have shown associations between resistance variations and the degree of morphologic abnormalities of small airways assessed with endobronchial optical coherence tomography in COPD and heavy smokers.43 It should be noted that these parameters are also influenced by the shunt impedance from the upper airway, as well as by the tissue resistance. The changes observed indicate increasing heterogeneity of the respiratory system with the progression of the disease. Similar results were obtained in previous studies in Cystic Fibrosis19 and Silicosis.11
The more negative reactance (Xm) found in the patient groups reflects the reduction in homogeneity of the respiratory system and in dynamic compliance of the subjects under study.3 Table 2 also showed a significant reduction in dynamic compliance (Cdin), which is related to the elastic properties of the respiratory system. This decrease may be associated with changes in lung tissue, chest wall, increased resistance and changes in airway distensibility.31 Thus, the reduction in value between groups could be associated with the progressive increase in airway resistance and the reduction of apparent compliance of the respiratory system.41
Similarly, the increase observed in Ax is related to the elastic properties of the respiratory system. It also reflects increases in the degree of obstruction of the peripheral airways,19 and the consequent reductions in apparent compliance.
In agreement with progressively more negative reactance values (Figure 3), the resonance frequency (fr) showed higher values in patients. These changes are related to the worsening of ventilation homogeneity and reduced lung compliance.41
There was a significant increase in Z4 in the sick groups. This parameter assesses the absolute value of the respiratory impedance, being associated with the work performed by the respiratory muscles to overcome the resistive and elastic loads, in order to promote airflow in the respiratory system.12 The increase observed in Zrs is consistent with the clinical changes usually seen in COPD, which include increasing dyspnea with the evolution of the disease.
Figure 4 describes the results of the eRIC model between the groups studied. R showed increases in all groups of patients studied when compared to the control group (Figure 4A). This increase is related to the presence of secretion in the central airways, typical of COPD, resulting in changes in the lung parenchyma.2 These changes are also related to increased inflammation and decreased radial traction in the airways.40 The most significant correlation of R with spirometric parameters was with FVC (Table 3), which indicates that this parameter may reflect the presence of lower mobilized lung volumes.
Rp is theoretically associated with peripheral airways. In agreement with this hypothesis, there was an inverse and significant correlation between Rp and descriptive spirometric parameters of peripheral obstruction (Table 3). The increase in Rp observed in all stages of COPD (Figure 4B) is associated with the fact that the effects of smoking start in the most peripheral airways, causing inflammation and narrowing of these airways, which causes an increase in resistance in this region.19 Previous work by our group on asthma and asbestosis has shown similar results.12,25 Recently, there has been a re-emergence of the interest in the study of small airways from a pathophysiological viewpoint and even for clinical management.44 The results presented in (Figure 4B) indicate that this methodology could be useful in identifying changes in this “silent zone”.
Similarly, Rt (Figure 4C) increased according to the severity of the disease. This resistance corresponds to the obstruction in the entire respiratory system, considering the central and peripheral components.40 The inverse correlations observed with the descriptive spirometric parameters of central and peripheral obstructions (Table 3) are consistent with this interpretation.
Respiratory inertance integrates the inertial properties of the whole respiratory system,25 including the mass of gas that is moved during tidal breathing. In the present study, I showed a significant reduction (Figure 4D). This can be explained by the concepts of choke points45 and apparent inertance.46 The oscillatory signal used by FOT to assess the impedance is prevented from passing through the choke points. It precludes FOT from considering the lung beyond the choke point so that the measured inertance reflects the airways that are proximal to the choke points. Thus, the increase in respiratory obstruction introduces a reduction in the apparent mass of the gas measured by the FOT, in the associated pressure necessary for the acceleration of the gas, and consequently, in the measured inertance. This proposition is consistent with the direct associations observed between inertance and spirometric indexes of central and peripheral airway obstruction (Table 3).
C showed reduced values in the COPD groups when compared to the control group (Figure 4E). This behavior may be associated with changes in the architecture and bronchial wall, which results in a decrease in the compliance of the respiratory system or an increase in the resistance of the peripheral airways.47 It may also be explained, at least in part, by the concept of apparent compliance, which is similar to that discussed previously in relation to I. Table 3 shows a direct association of C and spirometric indexes of central and peripheral airway obstruction. These results are in line with this proposition.
Considering the FrOr parameters, G showed a significant increase in the comparison between groups (Figure 5A). This result is consistent with the pathophysiology of COPD since, during the course of the disease, airway resistance increases due to increased secretion and changes in the lung parenchyma.18,48 In agreement with this interpretation, Table 4 shows that G presented significant correlations with all spirometric parameters, including those that describe peripheral airways, but mainly with the central airway descriptors (FEV1).
Elastance presented an interesting behavior, decreasing in groups of mild and moderate patients and posteriorly increasing in severe and very severe patients (Figure 5B). The reduction observed in mild and moderate patients may be explained, at least in part, by a predominant effect of tissue destruction (emphysema) in these groups of patients. In these stages, lung volume increases resulting in air trapping. In more severe stages of the disease, with increased airflow limitation and air trapping, hyperinflation begins to occur. In the presence of hyperinflation, at higher pulmonary volumes, the interaction between the lung tissue and the chest wall results in an increased respiratory elastance. This increase in severe groups may also reflect heterogeneity, which can be explained by the increase in structural changes in the lungs.25,49 These changes are related with increased airway inflammation, destruction of the lung parenchyma and inhomogeneous ventilation.25,50 The inverse associations observed with FVC and the spirometric parameters related with respiratory obstruction (Table 4) are consistent with the aforementioned hypotheses.
The increase in hysteresis indicates an increase in heterogeneity and changes in the pulmonary structure in the different groups under study (Figure 5C). The changes in bronchial architecture resulting from COPD lead to an increase in hysteresis, causing an irregular ventilation distribution, associated with imbalances in the pulmonary time constants.18,21,51 In agreement with this proposition, there was an inverse and significant correlation between hysteresis and FEF25-75, which indicates that this parameter is associated with changes in airways of smaller calibers (Table 4).
The number of pack-years consumed was similar among COPD groups (Table 1). This may explain the absence of significant correlations between the eRIC and FrOr model parameters and smoking load in these patients (Tables S2 and S3). In contrast, the correlations between the parameters derived from whole and fractional models and the spirometric parameters were moderate to good (Tables 3 and 4). These correlations are similar to the results observed in previous studies.3,11–14,32,41,52 These results indicate that these models provide complementary data to spirometry. This confirms the importance of the models studied in order to provide additional information about the mechanical characteristics of the respiratory system. It is also important to remember the marked methodological differences between FOT and spirometry. While FOT parameters are derived from normal breathing, spirometric variables are derived from forced maneuvers. This may explain, at least in part, the moderate associations between the FOT and spirometric parameters described in Tables 3 and 4.
An accuracy >0.80 is usually considered adequate for clinical use,35 and an AUC> 0.90 is considered a high accuracy. In this sense, Figure 7B shows that Rp stands out among the parameters of the eRIC model, presenting adequate accuracy for clinical use in light and elevated individuals in groups in more advanced stages. These results are consistent with the proposition that the lower airways are the most affected in patients with COPD, and that changes in them occur since the earliest stages of the disease.
Considering the parameters of the FrOr model, η was the one that obtained the highest diagnostic accuracy in the identification of mild COPD, among all the parameters studied (Figures 8 and 9). This finding is in line with previous studies showing that η was the more sensitive parameter in detecting an initial decline in lung function of adult patients with sickle cell anemia.53 An explanatory theory for this finding may be proposed observing Figure 6. The FrOr model presented the smallest errors in all of the groups under study. In the control group, this result reflects the ability of this model to characterize the positive frequency-dependence of the resistance observed experimentally in some healthy subjects. In patients, the underlying reason may be the ability of the FrOr models to adjust to fractional values of 20 dB/dec, in contrast with integer-order models, which are limited to integer multiples of 20 dB/dec.
The evidence presented in Figures 8 and 9 supports the notion that FrOr models may be useful in more advanced COPD. Parameters from this model (η) presented adequate diagnostic accuracy in moderate patients and high accuracy (G) in groups of severe and very severe patients. These results are consistent with previous studies concerning the differentiation between malignant and benign breast lesions detected on X-ray screening mammography,54 cancer detection,55 screening for hemodialysis patients,56 differentiation of low- and high-grade pediatric brain tumors,57 and Parkinson’s Disease severity assessment.58
As expected, the diagnostic accuracy of the traditional, eRIC and FrOr parameters increased in more advanced stages of the COPD (Figure 9). Rp was the most accurate in groups of patients with moderate and severe disease. This finding probably describes the ability of this parameter to adequately encapsulate the main physiological changes observed in these two classes of patients. In very severe patients, traditional, eRIC and FrOr parameters presented similar high diagnostic accuracy.
In summary, η (associated with heterogeneity of pulmonary ventilation)18,25 was the most accurate parameter in the identification of mild COPD, while Rp (related with peripheral resistance)19 was the most accurate in moderate and severe disease. In very severe disease, Xm, Ax, Z4, and Cdyn (all related with the homogeneity of the respiratory system)31 were the most accurate.
A growing body of evidence suggests that FOT may play a pivotal role in the diagnostic and management of COPD.59 Because the FOT is performed during tidal volume breathing and requires minimal cooperation, they appear highly suitable for these patients, mainly in the geriatric stage, who have difficulties performing traditional lung function tests.60 This method presents a long history of contributions in smoking-induced respiratory diseases,61 and there is evidence that this method allows a detailed analysis of respiratory mechanics, which could be useful as a complement to traditional methods.8,18,60 Further studies in larger groups of patients are required to confirm these evidences in COPD.59 This paper provides additional evidence that changes in impedance parameters might indicate early pathophysiological changes in the airways of patients with mild COPD. A detailed evaluation of the respiratory abnormalities in groups with increased degrees of severity was also provided, together with a diagnostic accuracy analysis that demonstrated a high performance in moderate, severe and very severe patients. These results confirm the high potential of respiratory oscillometry in COPD.
The findings in this study are subject to at least three limitations. First, COPD includes emphysema and chronic bronchitis. These different phenotypes may introduce different characteristics. The groups under study did not consider these particularities and further studies are needed to assess these specific phenotypes.
Secondly, one could argue that there are numerous respiratory models, that different models may be fitted by the same impedance data, and that this introduces great difficulties in comparing results from different studies. To minimize this problem, a simple four-element compartmental model and a simple fractional-order model were used for interpreting respiratory impedance measurements. This reduction of model complexity enables the use of these models by all interested researchers, as well as the adequate interpretation of FOT data in physiological terms, providing parameters that are able to provide a detailed description of lung structure and function.
Third, the present study included a relatively small sample size, and future studies should include a larger number of subjects. Interested readers may examine the biometric characteristics and inclusion and exclusion criteria adopted in the present study to evaluate if they are likely to obtain similar outcomes in their own patient population.
The present study was based on airway obstruction. The more recent “ABCD” Gold classification incorporated patient-reported outcomes and highlights the importance of exacerbations prevention.62 A detailed evaluation using respiratory oscillometry and model analysis could contribute to elucidate the changes in respiratory mechanics in this recent classification. We are planning to do these analyses in the next steps of this research.
Conclusion
This study set out to contribute for improved noninvasive mechanical tests of lung function in COPD. We examined the use of respiratory oscillometry associated with integer and fractional-order models in groups with increasing COPD severity. This study has shown initially that the course of increasing COPD severity was adequately described by the traditional parameters, as well as by the model parameters. This resulted in significant and consistent correlations among these parameters and spirometric indexes. Additionally, this evaluation enhanced our understanding of the respiratory abnormalities in different COPD stages. The diagnostic accuracy analyses provided evidence that FrOr modeling (η) allowed a highly accurate identification in patients with mild changes. Similar analysis in groups of moderate and severe patients showed that eRIC modeling provided the most accurate parameter (Rp), while in very severe patients, traditional, eRIC and FrOr parameters were able to reach high diagnostic accuracy. These exams require only tidal breathing and are easy to perform. Taken together, these practical considerations and the results of the present study suggest that respiratory oscillometry associated with eRIC and FrOr models may help to improve lung function tests in COPD.
Acknowledgments
This study was supported by the Brazilian Council for Scientific and Technological Development (CNPq), the Rio de Janeiro State Research Supporting Foundation (FAPERJ), and in part by the Coordenação de Aperfeiçoamento de Pessoal de Nível Superior-Brasil (CAPES)-Finance Code 001.
Disclosure
The authors report no conflicts of interest in this work.
References
1. Andreeva E, Pokhaznikova M, Lebedev A, et al. The RESPECT study: rESearch on the PrEvalence and the diagnosis of COPD and its Tobacco-related etiology: a study protocol. BMC Public Health. 2015;
2. The global strategy for the diagnosis, management and prevention of COPD, global initiative for chronic obstructive lung disease (GOLD); 2020. Available from: http://www.goldcopd.org.
3. Di Mango AM, Lopes AJ, Jansen JM, Melo PL. Changes in respiratory mechanics with increasing degrees of airway obstruction in COPD: detection by forced oscillation technique. Respir Med. 2006;100(3):399–410. doi:10.1016/j.rmed.2005.07.005
4. Barnes PJ. Small airways in COPD. N Engl J Med. 2004;350(26):2635–2637. doi:10.1056/NEJMp048102
5. Bourdin A, Burgel PR, Chanez P, Garcia G, Perez T, Roche N. Recent advances in COPD: pathophysiology, respiratory physiology and clinical aspects, including comorbidities. Eur Respir Rev. 2009;18(114):198–212. doi:10.1183/09059180.00005509
6. Johannessen A, Lehmann S, Omenaas ER, Eide GE, Bakke PS, Gulsvik A. Post-bronchodilator spirometry reference values in adults and implications for disease management. Am J Respir Crit Care Med. 2006;173(12):1316–1325. doi:10.1164/rccm.200601-023OC
7. Karkhanis VS, Joshi JM. Spirometry in chronic obstructive lung disease (COPD). J Assoc Physicians India. 2012;60(Suppl):22–26.
8. King GG, Bates J, Berger KI, et al. Technical standards for respiratory oscillometry. Eur Respir J. 2020;55:2. doi:10.1183/13993003.00753-2019
9. Bates JH, Irvin CG, Farre R, Hantos Z. Oscillation mechanics of the respiratory system. Compr Physiol. 2011;1(3):1233–1272.
10. Faria AC, Lopes AJ, Jansen JM, Melo PL. Evaluating the forced oscillation technique in the detection of early smoking-induced respiratory changes. Biomed Eng Online. 2009;8(1):22. doi:10.1186/1475-925X-8-22
11. Sá PM, Lopes AJ, Jansen JM, Melo PL. Oscillation mechanics of the respiratory system in never-smoking patients with silicosis: pathophysiological study and evaluation of diagnostic accuracy. Clinics. 2013;68(5):644–651. doi:10.6061/clinics/2013(05)11
12. de Sa PM, Castro HA, Lopes AJ, Melo PL. Early diagnosis of respiratory abnormalities in asbestos-exposed workers by the forced oscillation technique. PLoS One. 2016;11(9):e0161981.
13. Faria AC, Lopes AJ, Jansen JM, Melo PL. Assessment of respiratory mechanics in patients with sarcoidosis using forced oscillation: correlations with spirometric and volumetric measurements and diagnostic accuracy. Respiration. 2009;78(1):93–104. doi:10.1159/000213756
14. Miranda IA, Dias Faria AC, Lopes AJ, Jansen JM. On the respiratory mechanics measured by forced oscillation technique in patients with systemic sclerosis. PLoS One. 2013;8:4.
15. Rossi A, Butorac-Petanjek B, Chilosi M, et al. Chronic obstructive pulmonary disease with mild airflow limitation: current knowledge and proposal for future research – a consensus document from six scientific societies. Int J Chron Obstruct Pulmon Dis. 2017;12:2593–2610. doi:10.2147/COPD.S132236
16. Nilsson AM, Theander E, Hesselstrand R, Piitulainen E, Wollmer P, Mandl T. The forced oscillation technique is a sensitive method for detecting obstructive airway disease in patients with primary Sjogren’s syndrome. Scand J Rheumatol. 2014;43(4):324–328. doi:10.3109/03009742.2013.856466
17. Peters U, Hernandez P, Dechman G, Ellsmere J, Maksym G. Early detection of changes in lung mechanics with oscillometry following bariatric surgery in severe obesity. Appl Physiol Nutr Metab. 2016;41(5):538–547. doi:10.1139/apnm-2015-0473
18. Ribeiro CO, Faria ACD, Lopes AJ, Melo PL. Forced oscillation technique for early detection of the effects of smoking and COPD: contribution of fractional-order modeling. Int J Chron Obstruct Pulmon Dis. 2018;13:3281–3295. doi:10.2147/COPD.S173686
19. Lima AN, Faria ACD, Lopes AJ, Jansen JM, Melo PL. Forced oscillations and respiratory system modeling in adults with cystic fibrosis. Biomed Eng Online. 2015;14(1):11. doi:10.1186/s12938-015-0007-7
20. Ionescu CM. The Human Respiratory System: An Analysis of the Interplay Between Anatomy, Structure, Breathing and Fractal Dynamics. London: Springer-Verlag; 2013.
21. Ionescu CM, De Keyser R. Relations between fractional-order model parameters and lung pathology in chronic obstructive pulmonary disease. IEEE Trans Biomed Eng. 2009;56(4):978–987. doi:10.1109/TBME.2008.2004966
22. Ionescu C, Derom E, De Keyser R. Assessment of respiratory mechanical properties with constant-phase models in healthy and COPD lungs. Comput Methods Programs Biomed. 2010;97(1):78–85. doi:10.1016/j.cmpb.2009.06.006
23. Ionescu C, Desager K, De Keyser R. Fractional order model parameters for the respiratory input impedance in healthy and in asthmatic children. Comput Methods Programs Biomed. 2011;101(3):315–323. doi:10.1016/j.cmpb.2010.11.010
24. Ionescu CM, Desager K, Vandersteen G, De Keyser R. Respiratory mechanics in children with cystic fibrosis. Biomed Signal Proces. 2014;11:74–79. doi:10.1016/j.bspc.2014.02.008
25. Faria AC, Veiga J, Lopes AJ, Melo PL. Forced oscillation, integer and fractional-order modeling in asthma. Comput Methods Programs Biomed. 2016;128:12–26. doi:10.1016/j.cmpb.2016.02.010
26. Pereira CAC. Diretrizes brasileiras de espirometria. J Pneumol. 2002;28(3):S1–82.
27. Ribeiro FCV, Lopes AJ, Melo PL. Reference values for respiratory impedance measured by the forced oscillation technique in adult men and women. Clin Respir J. 2018;12(6):2126–2135. doi:10.1111/crj.12783
28. Miller MR, Hankinson J, Brusasco V, et al. Standardisation of spirometry. Eur Respir J. 2005;26(2):319–338. doi:10.1183/09031936.05.00034805
29. Lorino AM, Zerah F, Mariette C, Harf A, Lorino H. Respiratory resistive impedance in obstructive patients: linear regression analysis vs viscoelastic modelling. Eur Respir J. 1997;10(1):150–155. doi:10.1183/09031936.97.10010150
30. Brochard L, Pelle G, de Palmas J, et al. Density and frequency dependence of resistance in early airway obstruction. Am Rev Respir Dis. 1987;135(3):579–584.
31. MacLeod D, Birch M. Respiratory input impedance measurement: forced oscillation methods. Med Biol Eng Comput. 2001;39(5):505–516. doi:10.1007/BF02345140
32. Cavalcanti JV, Lopes AJ, Jansen JM, Melo PL. Detection of changes in respiratory mechanics due to increasing degrees of airway obstruction in asthma by the forced oscillation technique. Respir Med. 2006;100(12):2207–2219. doi:10.1016/j.rmed.2006.03.009
33. Nagels J, Landser FJ, van der Linden L, Clement J. Mechanical properties of lungs and chest wall during spontaneous breathing. J Appl Physiol. 1980;49(3):408–416. doi:10.1152/jappl.1980.49.3.408
34. Oostveen E, Peslin R, Gallina C, Zwart A. Flow and volume dependence of respiratory mechanical properties studied by forced oscillation. J Appl Physiol. 1989;67(6):2212–2218. doi:10.1152/jappl.1989.67.6.2212
35. Swets JA. Measuring the accuracy of diagnostic systems. Science. 1988;240(4857):1285–1293. doi:10.1126/science.3287615
36. Dawson B, Trapp RG. Basic & Clinical Biostatistics.
37. Conneely KN, Boehnke M. So many correlated tests, so little time! Rapid adjustment of P values for multiple correlated tests. Am J Human Genetics. 2007;81(6):1158–1168. doi:10.1086/522036
38. Croxton TL, Weinmann GG, Senior RM, Hoidal JR. Future research directions in chronic obstructive pulmonary disease. Am J Respir Crit Care Med. 2002;165(6):838–844. doi:10.1164/ajrccm.165.6.2108036
39. Fischer BM, Pavlisko E, Voynow JA. Pathogenic triad in COPD: oxidative stress, protease–antiprotease imbalance, and inflammation. Int J Chron Obstruct Pulmon Dis. 2011;6:413–421. doi:10.2147/COPD.S10770
40. Bohadana A, Teculescu D, Martinet Y. Mechanisms of chronic airway obstruction in smokers. Respir Med. 2004;98(2):139–151. doi:10.1016/j.rmed.2003.09.005
41. Faria ACD, da Costa AA, Lopes AJ, Jansen JM, de Melo PL. Forced oscillation technique in the detection of smoking‐induced respiratory alterations: diagnostic accuracy and comparison with spirometry. Clinics. 2010;65(12):1295–1304. doi:10.1590/S1807-59322010001200012
42. Oostveen E, MacLeod D, Lorino H, et al. The forced oscillation technique in clinical practice: methodology, recommendations and future developments. Eur Respir J. 2003;22(6):1026–1041. doi:10.1183/09031936.03.00089403
43. Su ZQ, Guan WJ, Li SY, et al. Significances of spirometry and impulse oscillometry for detecting small airway disorders assessed with endobronchial optical coherence tomography in COPD. Int J Chron Obstruct Pulmon Dis. 2018;13:3031–3044. doi:10.2147/COPD.S172639
44. Stockley JA, Cooper BG, Stockley RA, Sapey E. Small airways disease: time for a revisit? Int J Chron Obstruct Pulmon Dis. 2017;12:2343–2353. doi:10.2147/COPD.S138540
45. Dellaca RL, Duffy N, Pompilio PP, et al. Expiratory flow limitation detected by forced oscillation and negative expiratory pressure. Eur Respir J. 2007;29(2):363–374. doi:10.1183/09031936.00038006
46. Lima AN, Faria AC, Lopes AJ, Jansen JM, Melo PL. Forced oscillations and respiratory system modeling in adults with cystic fibrosis. Biomed Eng Online. 2015;14:11.
47. Dellacà RL, Santus P, Aliverti A, et al. Detection of expiratory flow limitation in COPD using the forced oscillation technique. Eur Respir J. 2004;23(2):232–240. doi:10.1183/09031936.04.00046804
48. Kaczka DW, Dellaca RL. Oscillation mechanics of the respiratory system: applications to lung disease. Crit Rev Biomed Eng. 2011;39(4):337–359. doi:10.1615/CritRevBiomedEng.v39.i4.60
49. Faria ACD, Carvalho ARS, Guimaraes ARM, Lopes AJ, Melo PL. Association of respiratory integer and fractional-order models with structural abnormalities in silicosis. Comput Methods Programs Biomed. 2019;172:53–63. doi:10.1016/j.cmpb.2019.02.003
50. Elbehairy AF, Guenette JA, Faisal A, et al. Mechanisms of exertional dyspnoea in symptomatic smokers without COPD. Eur Respir J. 2016;48(3):694–705. doi:10.1183/13993003.00077-2016
51. Amaral JL, Lopes AJ, Jansen JM, Faria AC, Melo PL. Machine learning algorithms and forced oscillation measurements applied to the automatic identification of chronic obstructive pulmonary disease. Comput Methods Programs Biomed. 2012;105(3):183–193.
52. Miyoshi S, Katayama H, Matsubara M, Kato T, Hamaguchi N, Yamaguchi O. Prediction of spirometric indices using forced oscillometric indices in patients with asthma, COPD, and interstitial lung disease. Int J Chron Obstruct Pulmon Dis. 2020;15:1565–1575. doi:10.2147/COPD.S250080
53. Marinho CL, Maioli MCP, Amaral J, Lopes AJ, Melo PL. Respiratory resistance and reactance in adults with sickle cell anemia: part 2-Fractional-order modeling and a clinical decision support system for the diagnosis of respiratory disorders. PLoS One. 2019;14(3):e0213257. doi:10.1371/journal.pone.0213257
54. Bickelhaupt S, Steudle F, Paech D, et al. On a fractional order calculus model in diffusion weighted breast imaging to differentiate between malignant and benign breast lesions detected on X-ray screening mammography. PLoS One. 2017;12(4):e0176077. doi:10.1371/journal.pone.0176077
55. Sinkus R, Siegmann K, Xydeas T, Tanter M, Claussen C, Fink M. MR elastography of breast lesions: understanding the solid/liquid duality can improve the specificity of contrast-enhanced MR mammography. Magn Reson Med. 2007;58(6):1135–1144. doi:10.1002/mrm.21404
56. Wu JX, Li CM, Chen GC, Ho YR, Lin CH. Peripheral arterial disease screening for hemodialysis patients using a fractional-order integrator and transition probability decision-making model. IET Syst Biol. 2017;11(2):69–76.
57. Sui Y, Wang H, Liu G, et al. Differentiation of low- and high-grade pediatric brain tumors with high b-value diffusion-weighted MR imaging and a fractional order calculus model. Radiology. 2015;277(2):489–496. doi:10.1148/radiol.2015142156
58. Jan Mucha J, Mekyska J, Galaz Z, et al. Identification and monitoring of parkinson’s disease dysgraphia based on fractional-order derivatives of online handwriting. Appl Sci. 2018;8:2566–2584. doi:10.3390/app8122566
59. Pang CS, Chen M, Hu J, Wen FQ, Pang CMC. Diagnostic value of oscillation technique for chronic obstructive pulmonary disease. Curr Sci. 2015;109(9):1697–1703. doi:10.18520/cs/v109/i9/1697-1703
60. Tse HN, Tseng CZ, Wong KY, Yee KS, Ng LY. Accuracy of forced oscillation technique to assess lung function in geriatric COPD population. Int J Chron Obstruct Pulmon Dis. 2016;11:1105–1118. doi:10.2147/COPD.S102222
61. Faria ACD. Forced oscillation technique in the detection of smoking-induced respiratory changes. In: Hudak RP, Majernik M, editors. Biomedical Engineering - Technical Applications in Medicine. Vol. 1. Croatia: InTech; 2012.
62. Perez-Alba E, Nuzzolo-Shihadeh L, Espinosa-Mora JE, Camacho-Ortiz A. Use of self-administered surveys through QR code and same center telemedicine in a walk-in clinic in the era of COVID-19. J Am Me Informatics Association. 2020;27:985–986. doi:10.1093/jamia/ocaa054
 © 2020 The Author(s). This work is published and licensed by Dove Medical Press Limited. The
full terms of this license are available at https://www.dovepress.com/terms
and incorporate the Creative Commons Attribution
- Non Commercial (unported, 3.0) License.
By accessing the work you hereby accept the Terms. Non-commercial uses of the work are permitted
without any further permission from Dove Medical Press Limited, provided the work is properly
attributed. For permission for commercial use of this work, please see paragraphs 4.2 and 5 of our Terms.
© 2020 The Author(s). This work is published and licensed by Dove Medical Press Limited. The
full terms of this license are available at https://www.dovepress.com/terms
and incorporate the Creative Commons Attribution
- Non Commercial (unported, 3.0) License.
By accessing the work you hereby accept the Terms. Non-commercial uses of the work are permitted
without any further permission from Dove Medical Press Limited, provided the work is properly
attributed. For permission for commercial use of this work, please see paragraphs 4.2 and 5 of our Terms.