Back to Journals » International Journal of General Medicine » Volume 17
Optimizing Levothyroxine Replacement: A Precision Dosage Model for Post-Thyroidectomy Patients
Authors Yang G ![]() , Pu J, Zhu S, Shi Y, Yang Y, Mao J, Sun Y, Zhao B
, Pu J, Zhu S, Shi Y, Yang Y, Mao J, Sun Y, Zhao B
Received 3 September 2023
Accepted for publication 11 January 2024
Published 1 February 2024 Volume 2024:17 Pages 377—386
DOI https://doi.org/10.2147/IJGM.S438397
Checked for plagiarism Yes
Review by Single anonymous peer review
Peer reviewer comments 3
Editor who approved publication: Dr Scott Fraser
Guanghua Yang,1,* Jiaxi Pu,1,* Sibo Zhu,2 Yong Shi,3 Yi Yang,3 Jiangnan Mao,3 Yongkang Sun,1 Bin Zhao1
1Department of General Surgery, Seventh People’s Hospital of Shanghai University of Traditional Chinese Medicine, Shanghai, 200137, People’s Republic of China; 2School of Life Sciences, Fudan University, Shanghai, 200438, People’s Republic of China; 3Cinoasia Institute, Shanghai, 200438, People’s Republic of China
*These authors contributed equally to this work
Correspondence: Bin Zhao, Department of General Surgery, Seventh People’s Hospital of Shanghai University of Traditional Chinese Medicine, No. 358, Datong Road, Gaoqiao, Pudong New Area, Shanghai, 200137, People’s Republic of China, Tel +86 13918468421, Email [email protected] Yongkang Sun, Department of Ultrasound, Seventh People’s Hospital of Shanghai University of Traditional Chinese Medicine, No. 358, Datong Road, Gaoqiao, Pudong New Area, Shanghai, 200137, People’s Republic of China, Tel +86 13601659860, Email [email protected]
Background: Thyroidectomy is commonly performed for benign or malignant thyroid tumors, often resulting in hypothyroidism. Levothyroxine (LT4) supplementation is crucial to maintain hormone levels within the normal range and suppress TSH for cancer control. However, determining the optimal dosage remains challenging, leading to uncertain outcomes and potential side effects.
Methods: We analyzed clinical examination data from 510 total thyroidectomy patients, including demographic information, blood tests, and thyroid function. Using R, we applied data preprocessing techniques and identified 274 samples with 98 variables. Principal Component Analysis, correlation analysis, and regression analysis were conducted to identify factors associated with optimal LT4 dosage.
Results: The analysis revealed that only eight variables significantly influenced the final satisfactory dosage of LT4 in tablets: Benign0/Malignant1 (benign or malignant), BQB (electrophoretic albumin ratio), TP (total protein), FDP (fibrin degradation products), TRAB_1 (thyroid-stimulating hormone receptor antibody), PT (prothrombin time), MONO# (monocyte count), and HCV0C (hepatitis C antibody). The resulting predictive model was: .
Conclusion: Parameters such as benign/malignant status, TRAB_1, and BQB ratio during medication can serve as observational indicators for postoperative LT4 dosage. The calculated linear model can predict the LT4 dosage for patients after thyroidectomy, leading to improved treatment effectiveness and conserving medical resources.
Keywords: thyroid, levothyroxine, dosage, model, prediction
Introduction
The thyroid is an organ in the human body that secretes thyroid hormones. After thyroidectomy, patients experience insufficient secretion of thyroid hormones and therefore require exogenous supplementation of thyroid hormone to maintain hormone levels within the normal range.1,2 Currently, the initial dose of levothyroxine (LT4) (eg, thyroxine) still cannot be precisely determined, and it is still a time-consuming and labor-intensive method by which the patient returns to the clinic periodically for thyroid function tests, and the doctor adjusts the dose according to the results to maintain a stable hormone level. Recent studies have shown that artificial intelligence methods can be used to address this practical issue.3 By statistically analyzing a large amount of data from traditional methods and screening for relevant influencing genes, a dosage model can be created to assist clinicians in making predictions.4 However, the predictions obtained using this approach are not very accurate and cannot completely replace traditional trial and error methods. Some studies have also suggested that patients with the rs225014 TT and rs225015 GG genotypes should be given lower doses for higher efficacy and lower toxicity.
After starting the supplementation of LT4, the dosage to be taken next is determined based on the follow-up examination of thyroid-stimulating hormone (TSH). Due to its relatively long half-life, it is also difficult for doctors to accurately prescribe based on patient test reports.5 Therefore, the time required to achieve a normal thyroid state varies. In the first follow-up after thyroidectomy, about 40% of patients successfully reach normal levels of TSH, triiodothyronine (T3), and thyroxine (T4), while the remaining 60% of patients show doses that are too low or too high.5,6 When the LT4 dosage is insufficient, patients may experience symptoms of hypothyroidism, including fatigue, sensitivity to cold, abnormal limb sensation, weight gain, constipation, and more.5,6 On the other hand, when the LT4 dosage is excessive, patients may experience symptoms of hyperthyroidism, such as weakness, excessive weight loss, heat intolerance, and tachycardia, which can cause significant discomfort until the LT4 dosage is properly adjusted.
Despite appropriate administration methods and patient compliance, there is still a significant proportion of patients who require longer dose adjustments to achieve normal thyroid function. This longer adjustment period in some patients is attributed to the development of unfavorable complications post-thyroidectomy, such as dyslipidemia with atherosclerosis and impaired endothelial function.7,8 Therefore, for the convenience of treatment, we studied precise administration methods, combining genetic testing results as a treatment method for postoperative recurrence of hypothyroidism, to facilitate doctors’ treatment while providing maximum satisfaction to patients. This study investigated the relationship between relevant clinical indicators and the dose of eugenol taken by patients after thyroidectomy. By demonstrating the time required for a group of patients undergoing thyroidectomy to achieve normalization of thyroid function, we used a random forest method to impute the selected clinical data variables and constructed linear regression models using the lm function to analyze each variable in the training set in relation to the satisfactory dose.
Materials and Methods
Collection of Clinical Information from Patients
This study is a retrospective cohort analysis based on the thyroid surgery database collected from the Seventh People’s Hospital in Shanghai, China. The cohort includes patients who underwent total thyroidectomy between 2015 and 2021 and gradually achieved normal thyroid function. All patients provided informed consent. Detailed records of various factors that may affect the dosage of thyroid hormone, such as age, weight, gender, TSH levels, and medical history, were collected. All patients received LT4 (eg, Synthroid) after surgery, with a dosage of 50μg (1 tablet) for benign patients and 75μg (1.5 tablets) for malignant patients. Outpatient follow-up visits were scheduled for all patients every 3–5 weeks to perform regular thyroid function tests. Patient physiological indicators and medical conditions were recorded, and the LT4 dosage was adjusted based on these factors until TSH, T3, and T4 levels remained within the reference range, indicating the patient’s personalized satisfactory dose of LT4. Our study complies with the Declaration of Helsinki.
Data Preprocessing
The original dataset consisted of 510 samples with 188 variables. Redundant variables from data collection were removed, and patient information with duplicate hospital numbers was excluded. Variables with missing values exceeding 20% were also excluded. Categorical variables were transformed into dummy variables. For each benign patient, if T3 and T4 levels were within the reference range during the nth (an unspecified, or variable, number of follow-up examinations or visits) follow-up, the dosage used during the (n-1)th follow-up was marked as the patient’s satisfactory dose. For malignant patients, if T3 and T4 levels were within the reference range and TSH < 2 during the nth follow-up, the dosage used during the (n-1)th follow-up was marked as the patient’s satisfactory dose. If multiple satisfactory doses existed, the average value was taken. After these processing steps, 274 samples and 98 variables remained.
PCA Analysis
Select the basic indicators of gender, hypertension, diabetes, surgical location, FT3, and thyrotropin receptor antibody to group, and perform singular value decomposition on the data after z-scale processing (using prcomp function). We then use the eigenvalues of the principal components to calculate the contribution of each principal component, and screen out the two principal components PC1 and PC2 with the highest contribution, which are used as the x-axis and y-axis of the principal component analysis results for drawing scatter plots. Among them, utilizing the coord in the ggplot2 package_ The fixed function sets the scale of the two principal components, PC1 and PC2, to maintain consistency.
Linear Model Construction
Using the random forest method in the mice package to fill in the screened clinical data, and then dividing the filled data into training set and test set in a ratio of 7:3. The training set is used to build the model, and the test set is used to evaluate the performance of the model. Using the lm function in R, construct a simple linear regression model for each variable in the training set with the satisfied dose (dose). Retain variables with p<0.1, and use the leaps package in R for subset regression to obtain the optimal model.
Model Evaluation
Use the final model to predict the results of the test set. Compare the model prediction results with the actual dose results of the test set, and use ggplot2 to draw a scatter plot. The closest dose will be replaced with that dose. For example, when the recommended dose used is a continuous variable (eg, 1.1 tablets), we will round the variable to a discrete variable (eg, 1 tablet, 1.5 tablets, 2 tablets with an interval of 0.5 tablets).
Results
Clinical Data Analysis and Study Design
In this retrospective cohort study, a total of 510 patients who underwent thyroidectomy and gradually achieved normal thyroid function at Shanghai Seventh People’s Hospital between 2015 and 2021 were included. The average age of the patients was 50.88 years. Among the patients, there were 141 males (27.65%) and 369 females (72.35%). 123 patients (24.12%) had a history of hypertension, and 29 patients (5.65%) had a history of diabetes (Table 1). Prior to participation in this study, all patients provided written informed consent, and the measurement standards for various clinical indicators are shown in Table 1. After data preprocessing and screening, a total of 274 samples and 98 variables remained. The specific analysis process is shown in Figure 1.
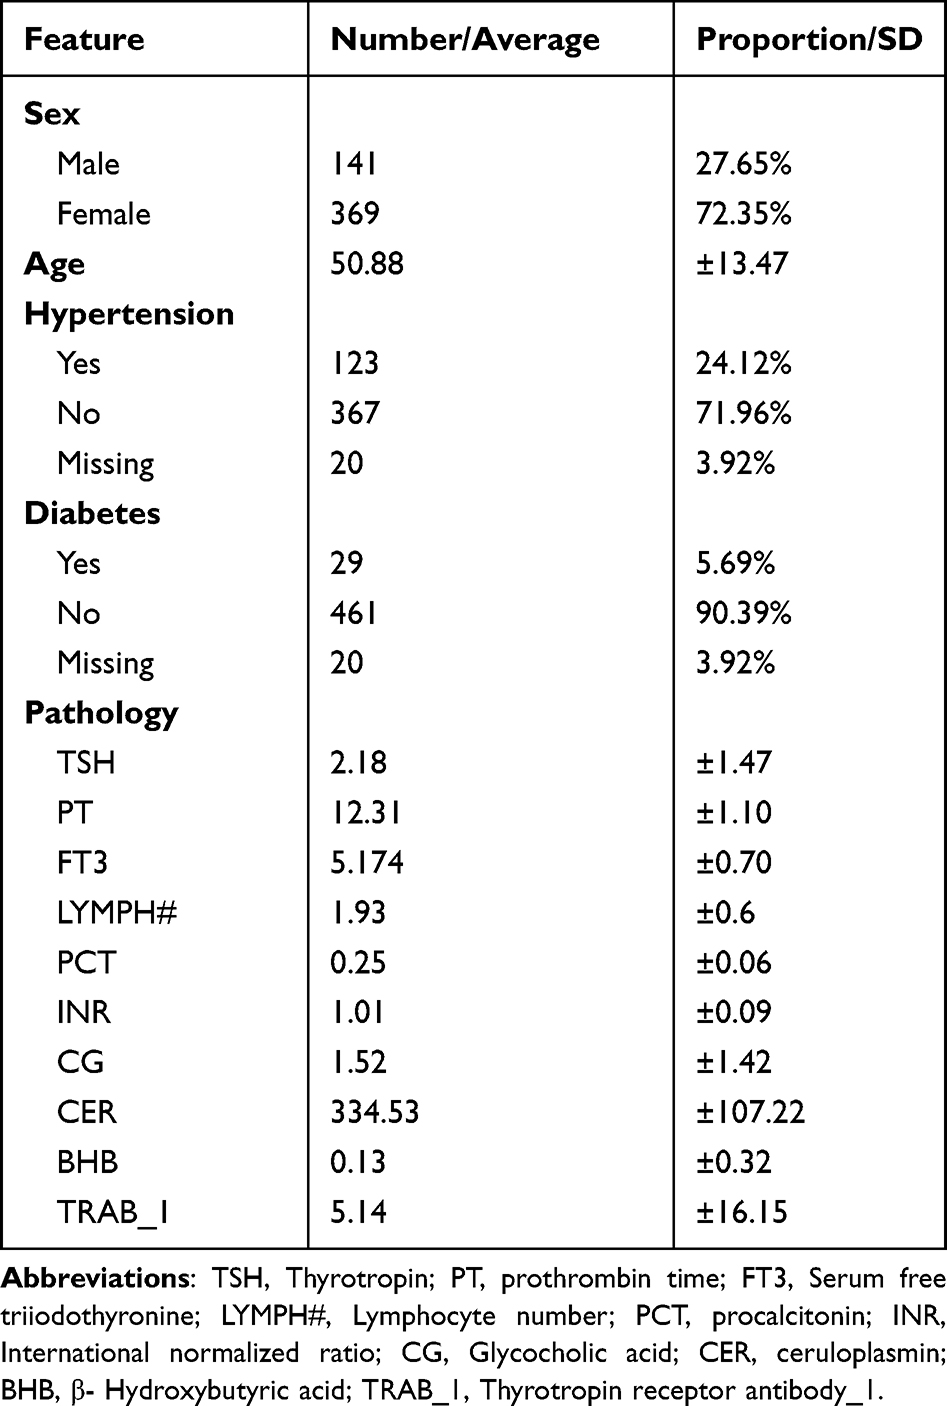 |
Table 1 Clinicopathological Data |
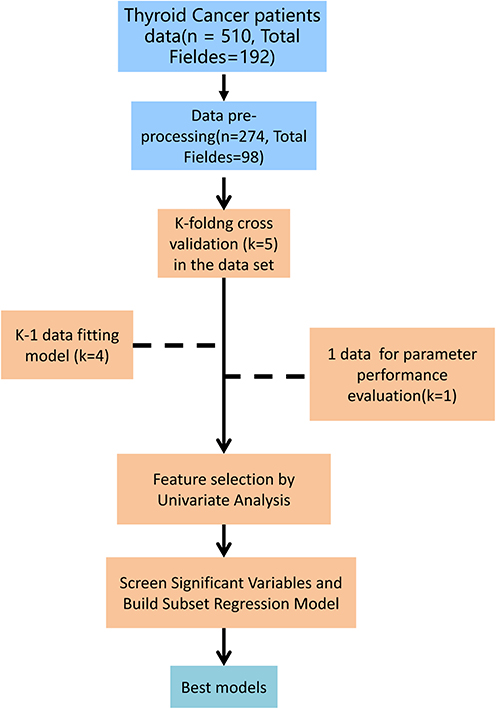 |
Figure 1 Analysis process. |
PCA Results
Performing PCA analysis to examine the clustering patterns of the groups formed based on several key variables, including gender, hypertension, diabetes, surgical location, FT3 level, and thyroid-stimulating hormone receptor antibody. The results indicate that the samples in each group are not well distinguished from each other (Figure 2), suggesting that individual variables have no decisive impact on the dosage of thyroid medication.
 |
Figure 2 PCA analysis shows that there is no formation of distinct clusters among the groups. The arrows indicate the variables that contribute significantly to PCA. |
Model Construction and Validation
The samples are randomly divided into five groups, and 5-fold cross-validation is performed to select the most optimal model as the final model. Each model undergoes single linear regression and leaps subset regression analysis, resulting in five models. Four parameters, including R-squared, RMSE, Spearman correlation coefficient between predicted and actual values, and the percentage of predicted values within ±20% of the actual values, are calculated for each model. Based on the observations of these four parameters and significant variables, the third model is chosen as the final predictive model. The model includes variables such as Benign0/Malignant1, BQB (electrophoretic albumin-globulin ratio), TP (total protein), FDP (fibrin degradation products), TRAB_1 (thyroid-stimulating hormone receptor antibody), PT (prothrombin time), MONO# (monocyte count), and HCV0C (hepatitis C virus antibody), which have statistical significance (Figure 3A). These variables have a significant impact on the final satisfactory dose (in tablets). Therefore, the variables Benign0/Malignant1, BQB, TP, FDP, TRAB_1, PT, MONO#, and HCV0C are selected to build the final satisfactory dose prediction model:  . The relevant code can be seen in Figure 3B.
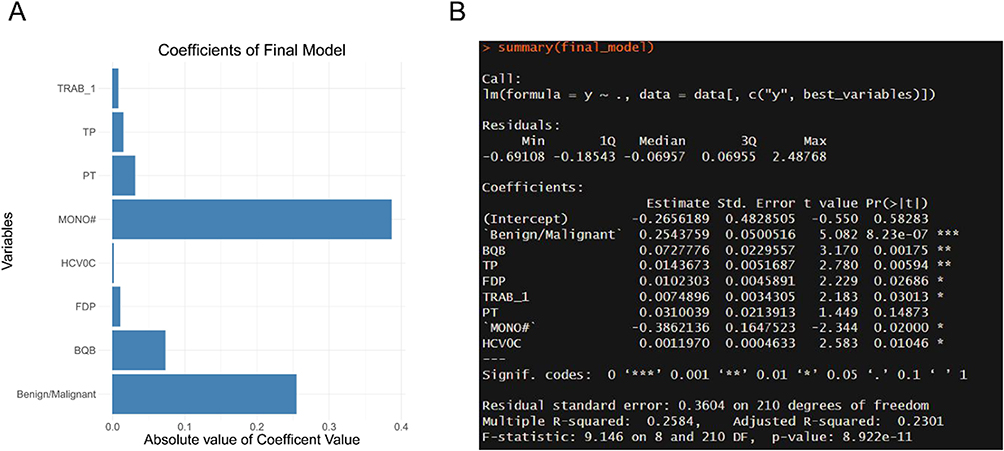 |
Figure 3 Predictive Model Variables and Key Codes. (A) Seven variables that had a significant effect on the final satisfactory dose (tablet); (B) Predictive Model Key Codes, model F-test statistic and p-value shown in the last line of the image, were significant. |
Model Evaluation
The predictive model was tested using the basis function plot: linearity test, the scattered points in the plot show little pattern, indicating a good linear relationship (Figure 4A); normality test, the points in the plot are basically distributed along the diagonal line, satisfying the assumption of normality (Figure 4B); homoskedasticity test, the variance of the dependent variable does not vary according to the level of the independent variable, and the points around the horizontal line at the lower left corner are randomly distributed (Figure 4C); information on individual observations, identifying outliers, high leverage points, and strong influence points (Figure 4D).
 |
Figure 4 Predictive model evaluation. (A) Linearity test, (B) Normality test, (C) Homoskedasticity test, (D) Information on individual observations. |
Model Validation
The two predictive models are compared with the initial dosage. The results show that among the 335 patients selected with complete follow-up data, 39 (11.6%) achieved normal stable TSH levels based on the initial medication dose (1 tablet) alone, while 41 (12.2%) reached stable TSH levels with just one dosage adjustment. When the 335 patients are treated based on the predictive models for the initial dosage, 166 (49.5%) of them achieved normal stable TSH levels with the initial medication dose alone, and 218 (65%) of them reached stable TSH levels with just one dosage adjustment (Table 2). A scatter plot of the actual values and model predicted values, created using ggplot2, shows a good correlation between the model’s predictions and the actual values (Figure 5). In addition, we conducted a retrospective observational analysis comparing the satisfaction levels of subjects receiving dosage instructions from a model-based approach versus those following physician’s experiential recommendations. The results of our analysis demonstrated a significant improvement in subject satisfaction with the model-based dosage approach compared to physician’s experiential recommendations (Table 3).
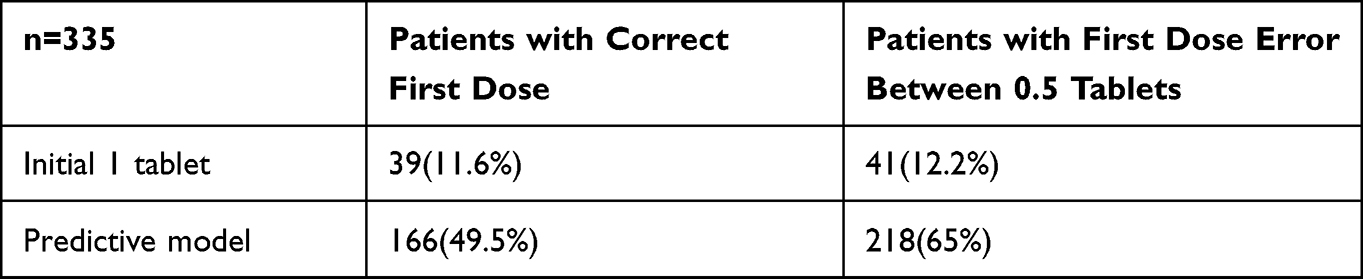 |
Table 2 Comparison of the Results of Different Modes of Administration |
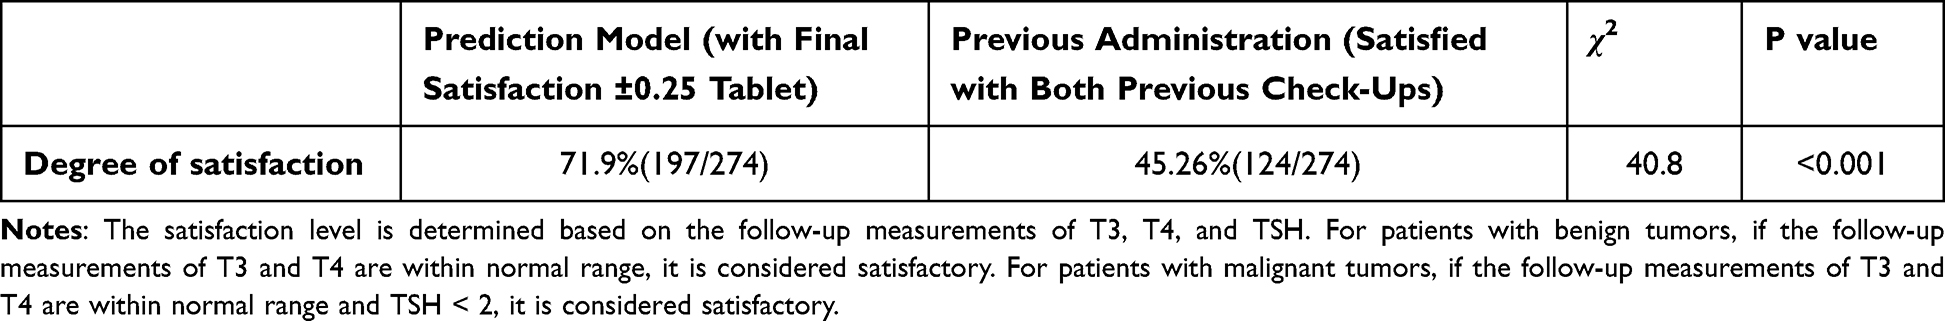 |
Table 3 Satisfaction Comparison |
 |
Figure 5 Actual vs Predicted Values ScatterPlot. |
Discussion
In recent years, the optimal dosage of LT4 administration after total thyroidectomy has been a focal point of research. Studies have highlighted the importance of determining the correct LT4 dosage to restore euthyroidism and prevent hypothyroidism or thyrotoxicosis, both of which can lead to various symptoms and complications. While most literature on LT4 dosage focuses on primary hypothyroidism, limited studies have specifically addressed thyroxin replacement therapy after total thyroidectomy.9 Most commonly, for post-thyroidectomy monitoring and adjustment of thyroid hormone replacement in benign diseases, LT4 is administered at an empirical dose of approximately 1.6 μg/kg and subsequently modified based on thyroid function test results and evaluation of patient symptoms.10 Newly developed approaches often take into account the following parameters: age,10 body weight,11 preoperative TSH concentration,12 gender,12 or body mass index.13 Despite researchers’ tremendous efforts to find a treatment plan that can accurately predict the exact dosage of LT4 for patients after total thyroidectomy, achieving complete precision in dosage remains elusive.
Our analysis results indicate that it takes an average of nearly 4 months for patients after thyroidectomy to reach normal thyroid function levels. The levels of TSH, history of diabetes, and dosage adjustments are often related in patients. The TSH levels and history of diabetes in patients are often related to dosage adjustments. Diabetes is a significant factor in increasing the incidence of post-thyroidectomy complications, and abnormal preoperative TSH levels in children indicate potential post-thyroidectomy TSH abnormalities.14–16 The replacement dosage of LT4 may vary due to reasons such as residual thyroid tissue producing endogenous thyroid hormones.17 To circumvent this influencing factor, only patients with benign thyroid disease underwent total thyroidectomy were collected for study. There have been relatively few studies predicting the required LT4 dosage in patients after thyroid surgery for benign thyroid diseases. In this study, starting with a dose of 100 mcg of LT4, 11.6% of patients received adequate dosage adjustments, while if our patients started with a baseline dose of 150 μg after surgery, 31% of patients would receive sufficient dosage adjustment (within 25 μg).
It took almost 4 months for our 510 thyroidectomy patients to achieve normal thyroid function, with 73% of patients requiring more than one dosage adjustment. 27% of patients had normal thyroid function at the initial follow-up visit. These findings suggest that a significant portion of patients experience prolonged hypothyroidism or hyperthyroidism symptoms. Previous work has shown an increased incidence of hypothyroidism with declining renal function, and the association between renal function and hypothyroidism can also explain why our kidney disease patients require longer time for LT4 dosage adjustments. When using the new LT4 dose prediction model, 65% of patients will receive a satisfactory dose (within an error of 0.5 tablets) in the first dosage adjustment, effectively reducing the number of outpatient follow-up visits and dosage adjustments. However, although this study used 5-fold Cross-Validation for validation, there was no independent validation set, so the extrapolation ability (representativeness, generalizability, and robustness) of the model cannot be determined yet.
Previous studies have shown a significant correlation between DIO2 rs225014 and rs225015 genotypes and TSH levels. However, DIO1, DIO3, UGT1A, thra, and TSHR are not associated with L-T4 treatment. For patients with rs225014 (TT) and rs225015 (GG) genotypes, lower doses should be used to provide more effective and less toxic treatment. In conclusion, the etiology of primary hypothyroidism varies, and differences in gene mutation rates among ethnic populations, research methods, and detection techniques can lead to different research results. Thus, it is necessary to formulate more reasonable study designs.
Our study also considers some important limitations. Firstly, the retrospective nature of our analysis introduces the possibility of information bias and the lack of control over confounding factors. Next, our aim to identify the predictive factors for dose adjustment prolongation of LT4 is limited by the available variables for each patient. Although we understand some factors that influence the absorption and metabolism of LT4, such as calcium carbonate, iodine, and concurrent food intake, there may still be unknown influencing factors that could not be included in the study. For example, the patient’s gut microbiome or proteome, as well as other variables such as malabsorption syndrome, have not been reliably encoded and collected. Finally, a limitation is the lack of information on compliance. Although all patients received the same verbal and written instructions and careful follow-up, it is difficult to determine patient compliance from retrospective chart reviews. Clearly, compliance affects the time it takes for thyroid dysfunction to manifest.
Conclusion
After thyroidectomy, it takes nearly 4 months for the thyroid function to return to normal. Clinical information such as Benign0/Malignant1, TRAB_1, and HCV0C are factors that prolong the satisfactory dosage adjustment period. The LT4 dose prediction model can effectively predict the dosage of medication and reduce the dosage adjustment period. This information is beneficial for establishing individualized medication guidelines for patients before surgery and reducing the duration of treatment with LT4.
Data Sharing Statement
The datasets used and/or analysed during the current study are available from the corresponding author upon reasonable request.
Ethics Approval
The study was approved by the Ethics Committee of Shanghai Seventh People’s Hospital (No. 2023-7th-HIRB-046).
Consent to Participate
Written informed consent was provided by all patients who participated in the study.
Author Contributions
All authors made a significant contribution to the work reported, whether that is in the conception, study design, execution, acquisition of data, analysis and interpretation, or in all these areas; took part in drafting, revising or critically reviewing the article; gave final approval of the version to be published; have agreed on the journal to which the article has been submitted; and agree to be accountable for all aspects of the work.
Funding
This research was financially supported by the Joint Research Project of Shanghai Pudong New District Health Committee (PW2023D-02); Pudong New Area Science and Technology Development Fund (PKJ2020-Y18); Budget project of Shanghai University of Traditional Chinese Medicine (2021LK057); and the talent training program (the Big Dipper) of Seventh People’s Hospital of Shanghai University of Traditional Chinese Medicine (BDX2022-04); National Natural Science Foundation of China (No. 82004446); Shanghai Committee of Science and Technology (22Y11923000, 20Y21901100); Clinical Research Plan of SHDC (SHDC2020CR4057).
Disclosure
The authors declare no competing interests in this work.
References
1. Xiao J, Ding R, Xu X, et al. Comparison and development of machine learning tools in the prediction of chronic kidney disease progression. J Transl Med. 2019;17(1):119. doi:10.1186/s12967-019-1860-0
2. Arici M, Oztas E, Yanar F, Aksakal N, Ozcinar B, Ozhan G. Association between genetic polymorphism and levothyroxine bioavailability in hypothyroid patients. Endocr J. 2018;65(3):317–323. doi:10.1507/endocrj.EJ17-0162
3. Jonklaas J. Update on the treatment of hypothyroidism. Curr Opin Oncol. 2016;28(1):18–25. doi:10.1097/CCO.0000000000000242
4. Chiovato L, Magri F, Carle A. Hypothyroidism in context: where we’ve been and where we’re going. Adv Ther. 2019;36(Suppl 2):47–58. doi:10.1007/s12325-019-01080-8
5. Atruktsang TS, Zaborek NA, Imbus JR, et al. Identifying predictors of prolonged levothyroxine dose adjustment after thyroidectomy. J Surg Res. 2019;242:166–171. doi:10.1016/j.jss.2019.03.049
6. Sukumar R, Agarwal A, Gupta S, et al. Prediction of LT4 replacement dose to achieve euthyroidism in subjects undergoing total thyroidectomy for benign thyroid disorders. World J Surg. 2010;34(3):527–531. doi:10.1007/s00268-009-0345-3
7. Walsh JP, Bremner AP, Bulsara MK, et al. Subclinical thyroid dysfunction as a risk factor for cardiovascular disease. Arch Intern Med. 2005;165(21):2467–2472. doi:10.1001/archinte.165.21.2467
8. Erbil Y, Ozbey N, Giris M, Salmaslioglu A, Ozarmagan S, Tezelman S. Effects of thyroxine replacement on lipid profile and endothelial function after thyroidectomy. Br J Surg. 2007;94(12):1485–1490. doi:10.1002/bjs.5915
9. Miccoli P, Materazzi G, Rossi L. Levothyroxine therapy in thyrodectomized patients. Front Endocrinol. 2021;11. doi:10.3389/fendo.2020.626268
10. Mistry D, Atkin S, Atkinson H, et al. Predicting thyroxine requirements following total thyroidectomy. Clin Endocrinol. 2011;74(3):384–387. doi:10.1111/j.1365-2265.2010.03940.x
11. Jin J, Allemang MT, McHenry CR. Levothyroxine replacement dosage determination after thyroidectomy discussion. Am J Surg. 2013;205(3):363–364.
12. Zaborek NA, Cheng A, Imbus JR, et al. Corrigendum to the optimal dosing scheme for levothyroxine after thyroidectomy: a comprehensive comparison and evaluation [Surgery. 2019 Jan;165(1):92–98.]. Surgery. 2022;172(1):477. doi:10.1016/j.surg.2022.04.014
13. Ojomo KA, Schneider DF, Reiher AE, et al. Using body mass index to predict optimal thyroid dosing after thyroidectomy. J Am Coll Surgeons. 2013;216(3):454–460. doi:10.1016/j.jamcollsurg.2012.12.002
14. Wiersinga WM. Thyroid hormone replacement therapy. Horm Res. 2001;56(Suppl 1):74–81. doi:10.1159/000048140
15. Hazkani I, Stein E, Edwards E, et al. Abnormal TSH prior to surgery in children with graves’ disease predicts abnormal TSH following thyroidectomy. Laryngoscope. 2023;133(9):2402–2406. doi:10.1002/lary.30485
16. Patel RV, Randhawa A, Randhawa KS, et al. The impact of diabetes on morbidity and mortality following thyroidectomy. Laryngoscope. 2023;133(12):3628–3632. doi:10.1002/lary.30902
17. Jongejan RMS, van Velsen EFS, Meima ME, et al. Change in thyroid hormone metabolite concentrations across different thyroid states. Thyroid. 2022;32(2):119–127. doi:10.1089/thy.2021.0453
 © 2024 The Author(s). This work is published and licensed by Dove Medical Press Limited. The
full terms of this license are available at https://www.dovepress.com/terms
and incorporate the Creative Commons Attribution
- Non Commercial (unported, 3.0) License.
By accessing the work you hereby accept the Terms. Non-commercial uses of the work are permitted
without any further permission from Dove Medical Press Limited, provided the work is properly
attributed. For permission for commercial use of this work, please see paragraphs 4.2 and 5 of our Terms.
© 2024 The Author(s). This work is published and licensed by Dove Medical Press Limited. The
full terms of this license are available at https://www.dovepress.com/terms
and incorporate the Creative Commons Attribution
- Non Commercial (unported, 3.0) License.
By accessing the work you hereby accept the Terms. Non-commercial uses of the work are permitted
without any further permission from Dove Medical Press Limited, provided the work is properly
attributed. For permission for commercial use of this work, please see paragraphs 4.2 and 5 of our Terms.
Recommended articles
Development and Validation of a Risk Nomogram Model for Predicting Constipation in Patients with Type 2 Diabetes Mellitus
Yuan HL, Zhang X, Peng DZ, Lin GB, Li HH, Li FX, Lu JJ, Chu WW
Diabetes, Metabolic Syndrome and Obesity 2023, 16:1109-1120
Published Date: 20 April 2023
Applying a Combined Model to Evaluate the Risk of Poor Treatment Outcomes in Rifampicin Resistant Tuberculosis Patients: A Multicenter Retrospective Study
Yang Y, Chen J, Liu L, Li L, Yang R, Lu K, Qiu Y, Yang X, Xu L
Infection and Drug Resistance 2024, 17:5287-5298
Published Date: 29 November 2024