")
Back to Journals » Cancer Management and Research » Volume 10
Optimized multiparametric flow cytometric analysis of circulating endothelial cells and their subpopulations in peripheral blood of patients with solid tumors: a technical analysis
Authors Zhou F, Zhou Y, Yang M, Wen J, Dong J, Tan W
Received 22 November 2017
Accepted for publication 14 January 2018
Published 8 March 2018 Volume 2018:10 Pages 447—464
DOI https://doi.org/10.2147/CMAR.S157837
Checked for plagiarism Yes
Review by Single anonymous peer review
Peer reviewer comments 2
Editor who approved publication: Dr Kenan Onel
Fangbin Zhou,1,2 Yaying Zhou,3 Ming Yang,1 Jinli Wen,3 Jun Dong,4 Wenyong Tan1
1Department of Oncology, The Second Clinical Medical College, Shenzhen People’s Hospital, Jinan University, Shenzhen, People’s Republic of China; 2Integrated Chinese and Western Medicine Postdoctoral Research Station, Jinan University, Guangzhou, People’s Republic of China; 3Clinical Medical Research Center, The Second Clinical Medical College, Shenzhen People’s Hospital, Jinan University, Shenzhen, People’s Republic of China; 4Department of Pathophysiology, Key Laboratory of the State Administration of Traditional Chinese Medicine, Medical College of Jinan University, Guangzhou, People’s Republic of China
Background: Circulating endothelial cells (CECs) and their subpopulations could be potential novel biomarkers for various malignancies. However, reliable enumerable methods are warranted to further improve their clinical utility. This study aimed to optimize a flow cytometric method (FCM) assay for CECs and subpopulations in peripheral blood for patients with solid cancers.
Patients and methods: An FCM assay was used to detect and identify CECs. A panel of 60 blood samples, including 44 metastatic cancer patients and 16 healthy controls, were used in this study. Some key issues of CEC enumeration, including sample material and anticoagulant selection, optimal titration of antibodies, lysis/wash procedures of blood sample preparation, conditions of sample storage, sufficient cell events to enhance the signal, fluorescence-minus-one controls instead of isotype controls to reduce background noise, optimal selection of cell surface markers, and evaluating the reproducibility of our method, were integrated and investigated. Wilcoxon and Mann–Whitney U tests were used to determine statistically significant differences.
Results: In this validation study, we refined a five-color FCM method to detect CECs and their subpopulations in peripheral blood of patients with solid tumors. Several key technical issues regarding preanalytical elements, FCM data acquisition, and analysis were addressed. Furthermore, we clinically validated the utility of our method. The baseline levels of mature CECs, endothelial progenitor cells, and activated CECs were higher in cancer patients than healthy subjects (P<0.01). However, there was no significant difference in resting CEC levels between healthy subjects and cancer patients (P=0.193).
Conclusion: We integrated and comprehensively addressed significant technical issues found in previously published assays and validated the reproducibility and sensitivity of our proposed method. Future work is required to explore the potential of our optimized method in clinical oncologic applications.
Keywords: circulating endothelial cells, CECs, CEC subpopulations, flow cytometry, methods
Background
Angiogenesis plays a crucial role in the development of various solid tumors,1 and antiangiogenic therapy is a novel modality of cancer treatment.2–5 However, not all treated patients benefit from anticancer drug therapy, which suggests the necessity of reliable biomarkers to predict patient response to therapeutic agents and to estimate prognosis.6,7 Theoretically, a biomarker from peripheral blood would be advantageous in routine clinical practice. In fact, previous studies have indicated that circulating endothelial cells (CECs) and their subpopulations may serve as potential cancer biomarkers.7,8
CECs are a rare cell population in peripheral blood with endothelial characteristics. Based on biological status, several CEC subpopulations may be detected in peripheral blood. These CEC subpopulations include mature CECs (mCECs), resting and activated CECs (rCECs and aCECs, respectively), and endothelial progenitor cells (EPCs).9 CECs contribute to angiogenesis, and increased CEC levels have been reported in patients with various malignancies. Kraan et al reviewed the potential clinical applications of CECs in cancer treatment.8 For some malignancies, baseline CEC levels served as biomarkers, and changes in their levels during treatment accurately predicted patient outcome to antiangiogenic-based therapy. The prognostic values of CECs and their subpopulations in antiangiogenic therapy for prostate, colorectal, and lung cancer patients have also been recently summarized.10–12 These results implicated the enumeration of CECs and their subpopulations as means to estimate prognosis and predict patient response and benefit from antitumor treatments. However, the role of CECs remains controversial due to inconsistent reporting among different clinical studies in the past few decades. For example, several studies have reported a correlation between baseline CEC levels and progression-free survival (PFS) in non-small cell lung cancer patients. Kawaishi et al indicated that patients who had a higher baseline CEC count showed longer PFS,13 while Ilie et al suggested that high baseline CEC count significantly correlated with shorter PFS.14 On the other hand, some researchers demonstrated no significant correlation between baseline CEC levels and PFS.15–17 These conflicting reports may be attributed to the lack of uniformity of the subjects studied, including blood sample size, patient treatment, and disease stage. Also, most importantly, there is little consensus on the immunophenotype and detection of CECs and their subpopulations. Thus, it is imperative to establish a promising and reliable method for CEC detection and identification.
In clinical studies, multiparametric flow cytometry has often been widely used for the enumeration of CECs and their subpopulations, alongside the concurrent determination of multiple stemness and endothelial markers. However, it requires rigorous operation to maximize signal-to-noise ratio. A plethora of published assays failed to comprehensively address key technical issues regarding each individual aspect of these methods and the excluded potential factors that may reduce objective signal and enhance background noise. For example, Hristov et al employed a lysis/no-wash procedure to measure CECs, as it may have prevented potential cell loss or activation during washing/centrifugation. However, this inevitably increased the risk of blocking the fluid system of the flow cytometer. Therefore, a comparison between a lysis/no-wash and a lysis/wash procedure is necessary to assess both negative and positive effects.18 Lanuti et al used 50 μL whole blood to detect CECs; however, for rare events, this volume was not sufficient to record 1×10⁶ total events to ensure statistical analysis. Thus, it is essential to validate the optimal volume of blood sample to be used for analysis.19 The diverse application of various combinations of surface markers, sampling, staining, lysis/wash, storage protocols, or gating strategies among different groups has produced heterogeneous outcomes.19–21 Herein, we integrated and investigated the key issues of each step of CEC enumeration, including preanalytical factors, flow cytometric method (FCM) data acquisition, and analysis, and we also attempted to establish a feasible and reliable FCM protocol for enumeration of CECs and their subpopulations in human peripheral blood.
Patients and methods
Subjects
The ethical committee of Shenzhen People Hospital approved this study, and all patients provided written informed consent prior to the study. Peripheral blood samples (2–5 mL) were obtained from healthy individuals (n=16, age=29–73 years, median age=45 years) and patients with different types of solid tumors (n=44, age=31–81 years, median age=51 years), including 16 patients with breast cancer, 12 with colorectal cancer, 6 with lung cancer, and 10 with other cancers from August 2016 to June 2017. Healthy individuals were not subjected to any medication or treatment and received normal physical examinations at the hospital. Metastatic cancer patients had previously undergone chemotherapy, but did not receive anti-vascular endothelial growth factor therapy.
Blood sampling and storage
Peripheral blood (2 mL) was sampled in a 5 mL standard vacutainer tube containing EDTA, heparin, or acid citrate dextrose (ACD), according to different experimental requirements. The first 2 mL of blood drawn was discarded to prevent the negative impact of venipuncture on CECs. Blood samples were processed immediately after sampling or stored at 4°C for various time points, as described below.
Antibodies for flow cytometry
Monoclonal antibodies (MoAbs) labeled with fluorochromes were purchased from different companies (Table 1). MoAbs with the most fluorescent and strongest binding fluorochromes were selected to maximize signal-to-noise ratio. Conjugated fluorochromes included peridinin chlorophyll A protein, phycoerythrin (PE), fluorescein isothiocyanate (FITC), allophycocyanin (APC), allophycocyanin–Cy7 (APC–Cy7), and phycoerythrin–Cy7 (PE–Cy7). Peridinin chlorophyll A protein-conjugated anti-CD34, PE-conjugated anti-CD106, and FITC-conjugated anti-CD146, along with their IgG1 isotypes, were purchased from BD Biosciences (San Jose, CA, USA). APC-conjugated anti-CD133 and its IgG1 isotype were purchased from Miltenyi Biotec (Bisley, UK). APC–Cy7-conjugated anti-CD45, PE–Cy7-conjugated anti-kinase insert domain receptor (KDR), and their IgG1 isotypes were purchased from BioLegend (San Jose, CA, USA). To increase the signal and reduce background noise, Fc receptors were used to minimize nonspecific staining by antibody binding, and erythrocytes were depleted using a commercially available reagent (lysing solution, BD Biosciences). For all staining and washing steps, cells were kept in PBS supplemented with 0.5% bovine serum albumin and 2 mM EDTA.
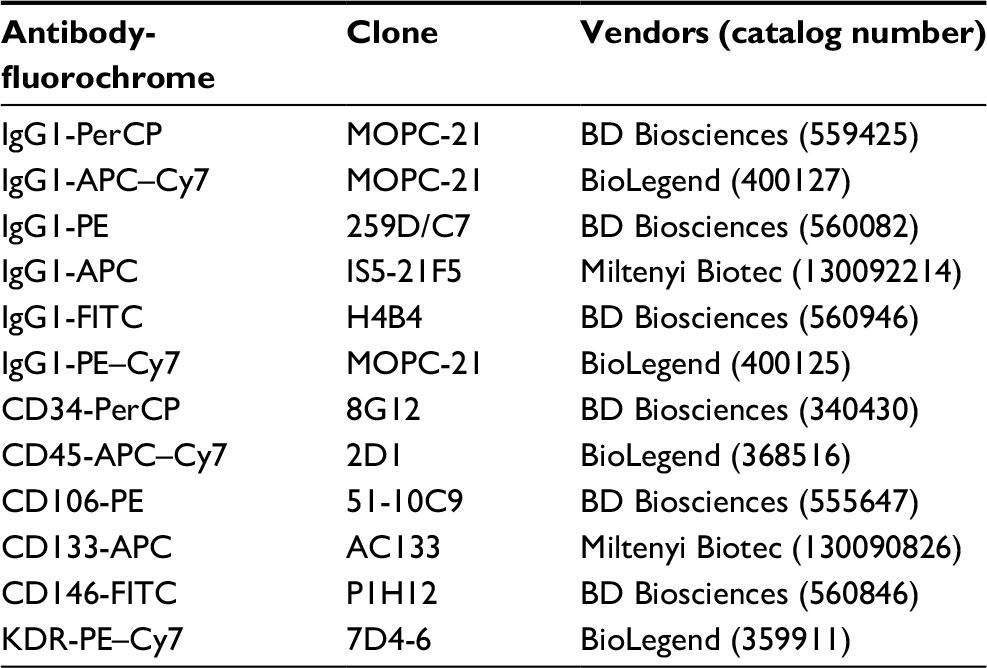 | Table 1 Antibody panel used for flow cytometric analysis of CECs and their subpopulations Abbreviations: APC, allophycocyanin; CECs, circulating endothelial cells; FITC, fluorescein isothiocyanate; KDR, kinase insert domain receptor; PE, phycoerythrin; PerCP, peridinin chlorophyll A protein. |
Immunostaining and flow cytometric analysis
Peripheral blood samples were distributed into 5 mL polypropylene tubes (BD Biosciences) and centrifuged at 500× g for 10 min at 4°C. The upper plasma phase was removed with a 1 mL pipette. Subsequently, Fc receptor-blocking reagent was added at a final concentration of 1 μg/mL. Samples were then incubated with a panel of MoAbs for 30 min at room temperature in the dark, and same conditions were applied to samples stained with the appropriate isotype control antibodies and fluorescence-minus-one (FMO) controls. For the lysis/wash step, stained samples were subjected to red blood cell (RBC) lysis in 5 mL lysis solution (BD Biosciences) and incubated for 8 min at room temperature. Samples were then washed twice with 5 mL cold PBS. Alternatively, for the lysis/no-wash step, cell pellets after centrifugation were directly resuspended without washing in 1 mL PBS for immediate flow cytometric analysis. An FACS Canto II (BD Biosciences) analyzer and BD FACSDiva analysis software were used to enumerate and analyze CECs and subpopulations.
Statistical analysis
Statistical analyses were performed using SPSS (Version 20.0; IBM Corporation, Armonk, NY, USA), Prism™ (GraphPad Software, Inc., La Jolla, CA, USA), and MedCalc for Windows (Version 17.8; MedCalc, Ostend, Belgium) software. Most of the analyzed data were not normally distributed; hence, the Wilcoxon test was used to determine statistical significance of differences between different anticoagulants, lysis/wash versus lysis/no-wash procedures of blood sample preparation, the stability of fresh versus stored blood samples, and the number and variability of CECs and their subpopulations between different sample volumes and CEC markers. Regression analysis and Bland–Altman plots were used for reproducibility tests. The Mann–Whitney U test was employed to validate statistical significance of differences in the number of CECs and their subpopulations between peripheral blood samples collected from cancer patients and healthy controls. All statistical tests were two-sided, and P<0.05 was considered statistically significant. Results are expressed as mean ± SD, unless otherwise specified.
Results
In human studies, the quantification of CECs and their subpopulations by multiparametric flow cytometry has focused on a combination of multiple antigens targeting both stemness and endothelial phenotypes. Rare-event analysis has been subjected to background noise, which may lead to false positives. Consequently, signal enhancement and noise reduction are critical. Hence, several preanalytical elements, FCM data acquisition, and analysis steps must be carefully considered if one aims to establish a reliable and reproducible enumeration method. In this study, we addressed the most critical issues relevant to each individual step, as shown in Figure 1.
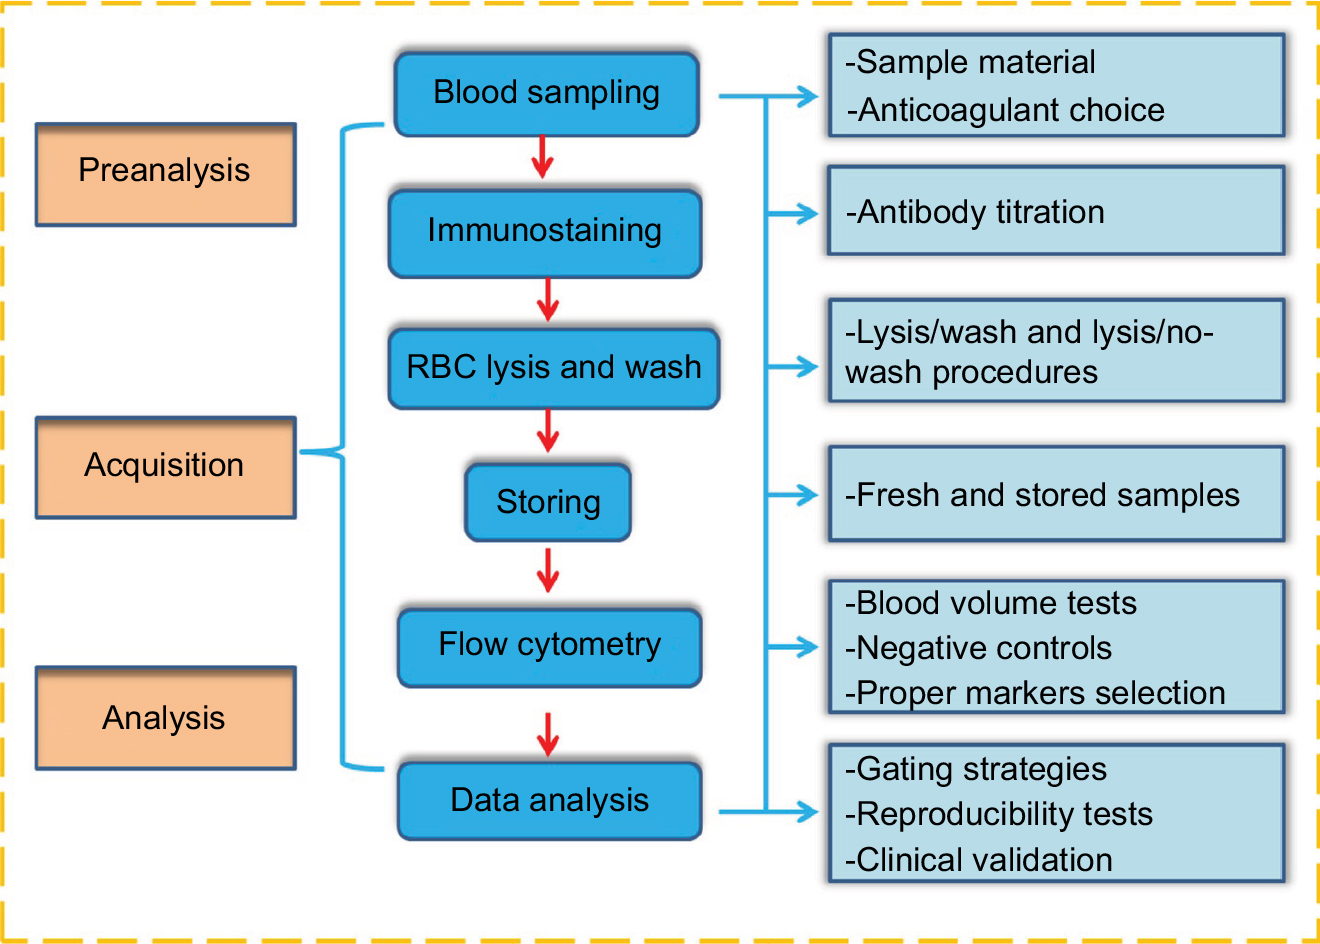 | Figure 1 Overview of the quantification of CECs and their subpopulations by flow cytometry. Notes: Left part (brown): three stages of CEC enumeration. Middle part (blue): the main steps taken for flow cytometry. Right part (cyan): critical issues relevant to each individual step of the method. Abbreviations: CECs, circulating endothelial cells; RBC, red blood cell. |
Preanalysis
Sample material and anticoagulant selection
CECs have been measured from whole blood and peripheral blood mononuclear cells (PBMCs) using density gradient centrifugation, or from antibody-positive, such as CD146+, cells using magnetically labeled beads prior to flow cytometry. Discrepancies between these approaches have been reported; more specifically, whole blood samples have been reported to yield the highest CEC counts due to cell loss observed in the other approaches.22 Moreover, the speed (>1×10⁶ events collected per minute) of current multiparametric flow cytometers enables viability and efficiency of using whole blood as the sample material. Thus, we chose to use whole blood in our optimized method.
We discarded the first 2 mL of sampled blood to prevent contamination by endothelial cells obtained during venipuncture. Blood from the same cancer patient was collected in tubes containing one of three anticoagulants, EDTA, heparin, or ACD. However, few reports have characterized the effects of these anticoagulants on CEC enumeration. Therefore, in this study, we obtained three replicates of each anticoagulant on blood samples from three patients, totaling 27 samples, to investigate their differences. As shown in Figure 2, the percentages of mononuclear cells (MNCs) were similar among the three anticoagulants (P>0.05), indicating CEC enumeration was acceptable with any anticoagulant. We selected to use blood collection tubes containing EDTA to maintain consistency with EDTA already present in the RBC lysis buffer described later.
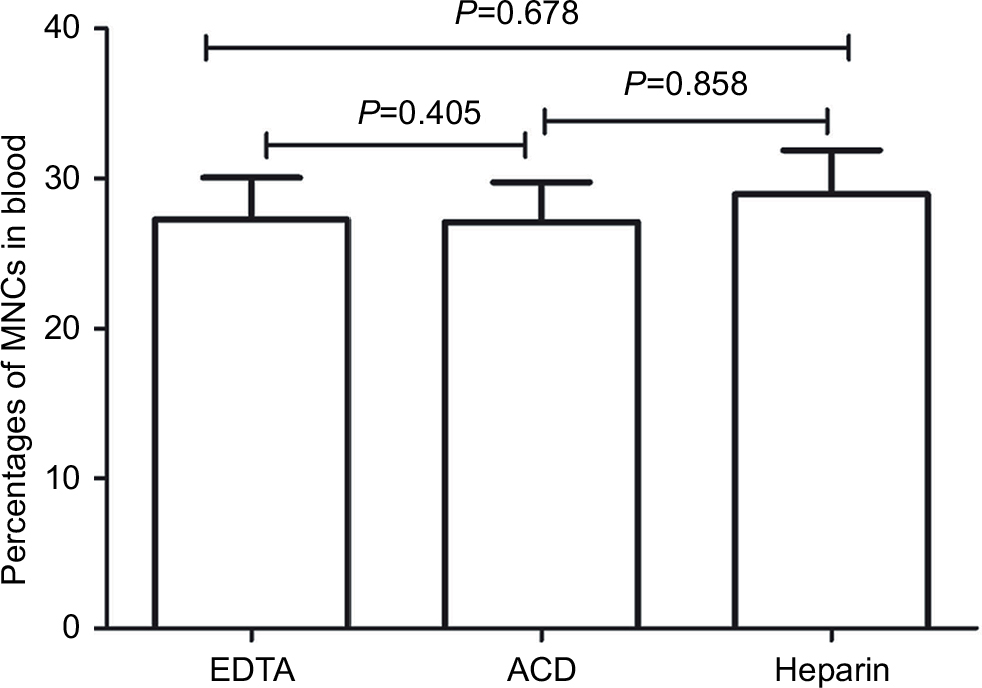 | Figure 2 Comparison of the effects of three anticoagulants on the enumeration of CECs. Note: Wilcoxon test was used to analyze data. Abbreviations: ACD, acid citrate dextrose; CECs, circulating endothelial cells; MNCs, mononuclear cells. |
Titration of antibodies
Although the operating manual of each antibody recommended an optimal concentration, we still validated their dose dependence by serial titration prior to them being used for detection of CECs and their subpopulations. Three replicates of blood samples from three cancer patients, totaling 27 samples, were obtained to investigate their differences. As shown in Figure 3, where the X-axis denotes serial titration of recommended concentrations of each antibody and the Y-axis denotes the percentage of antibody-positive cells in MNCs, signals varied between different antibodies. Some markers, such as CD34 and CD106, were typically dose dependent and reached saturation at a high dosage. The signals obtained from CD133 and KDR, also known as vascular endothelial growth factor receptor 2, produced multiple peaks at different high antibody dosages. CD45 and CD146 signals followed a parabolic-shaped curve and reached saturation at the recommended antibody concentration. These results illustrated that the optimal concentration of each antibody was not, in fact, always in accordance with the vendor’s recommendation, thus highlighting the necessity of validation prior to usage.
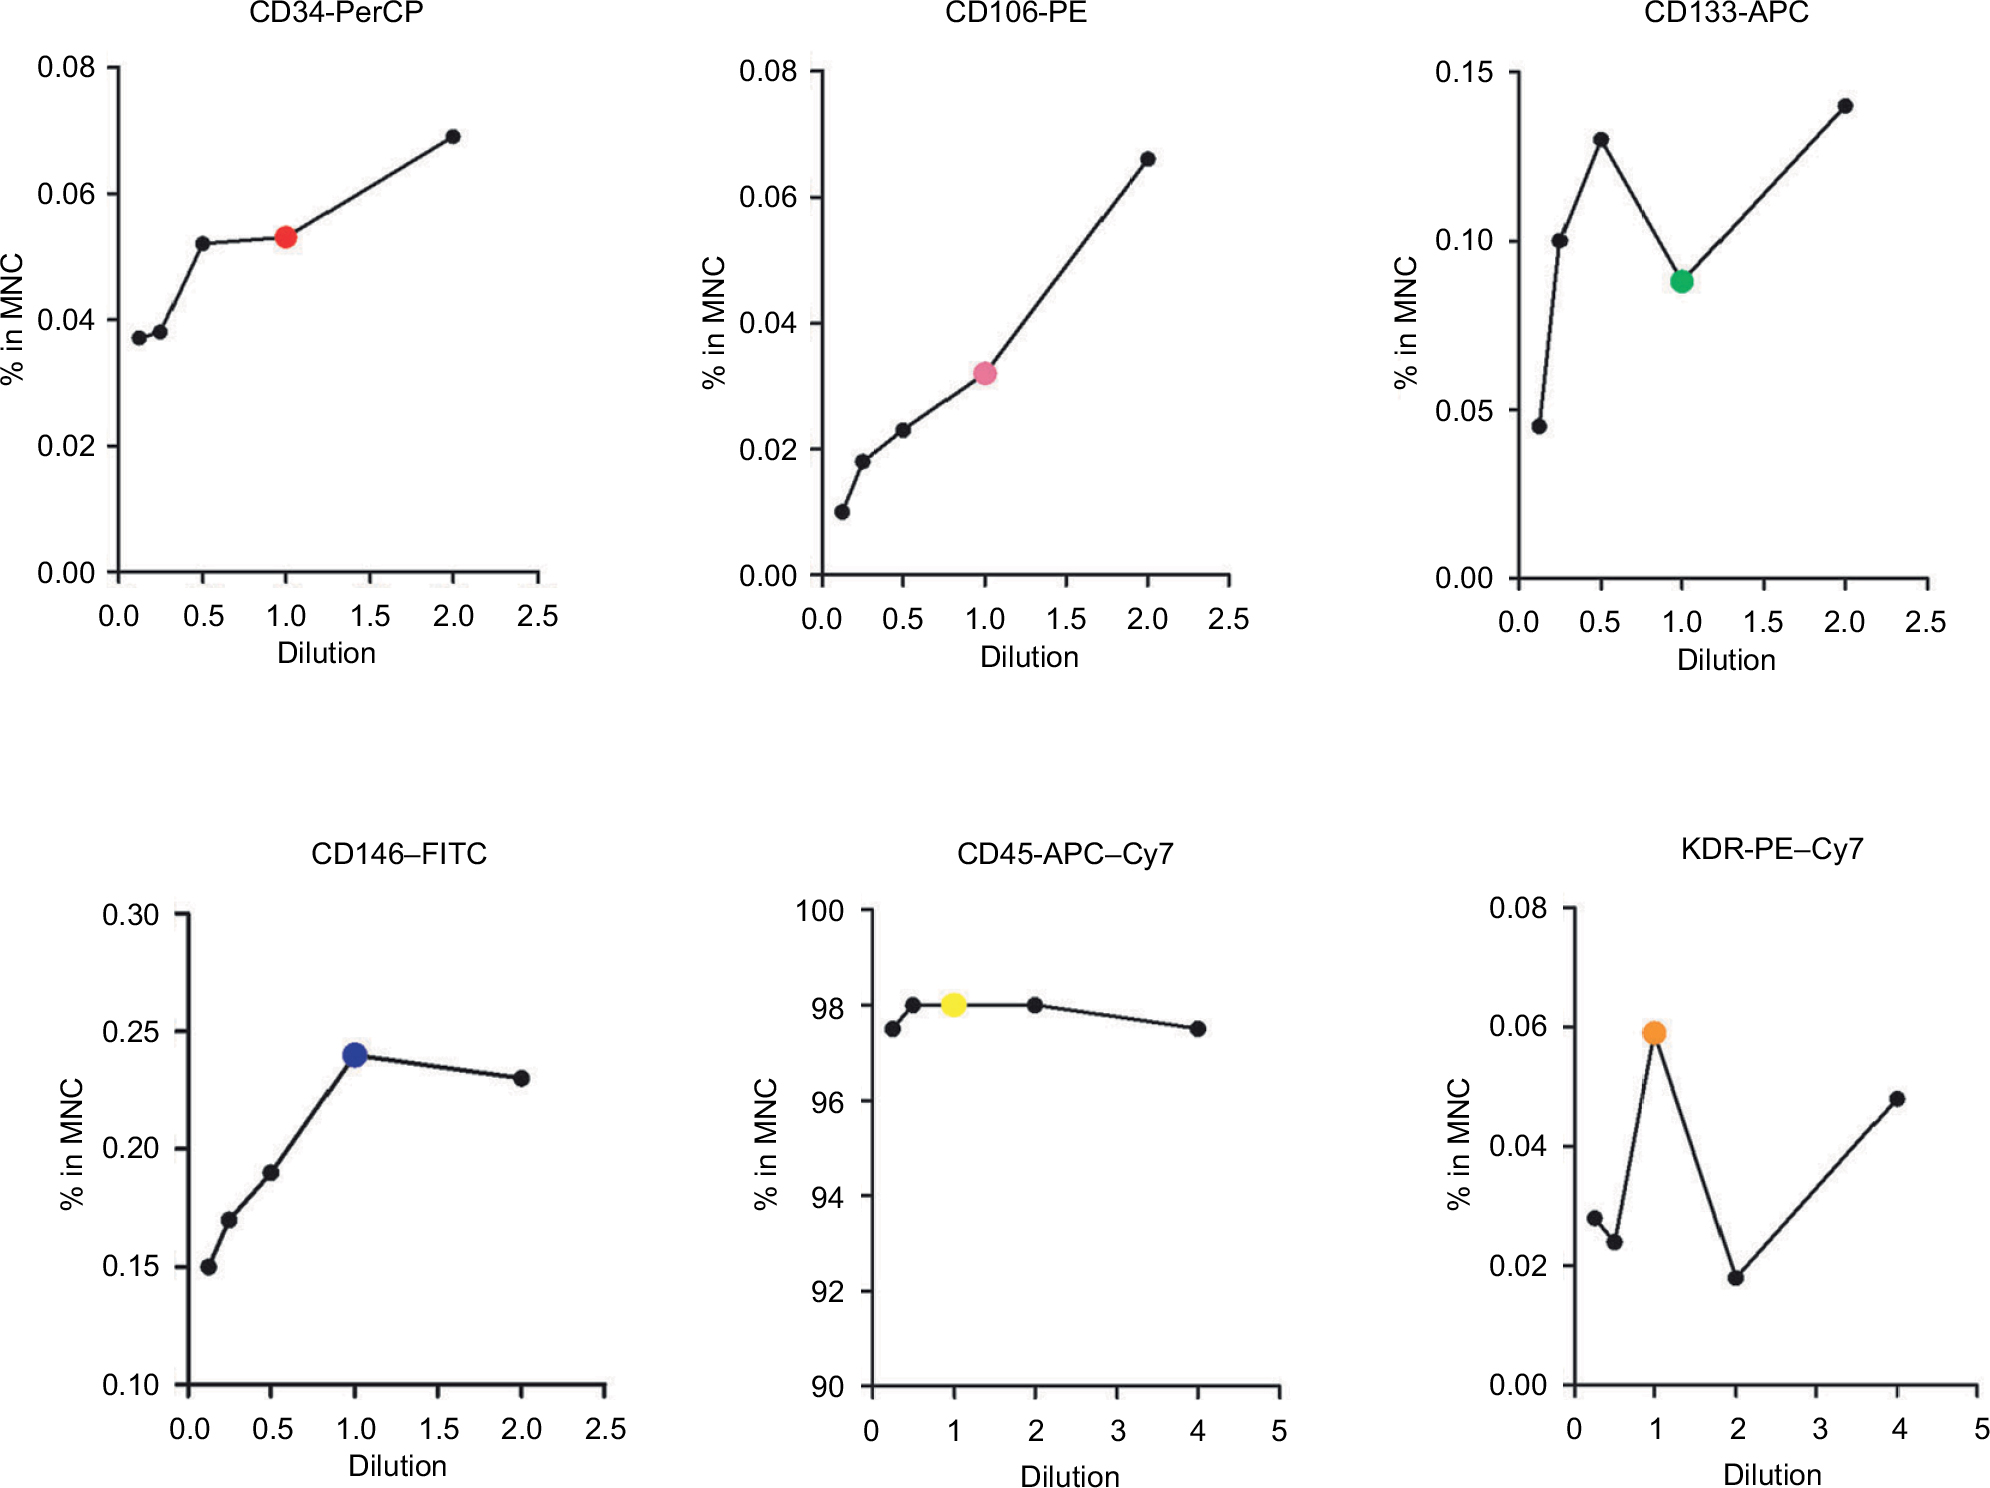 | Figure 3 Titration of each individual antibody. Notes: The color dots (red, pink, green, purple, yellow, and orange) represent each individual antibody’s recommended concentration by the vendors. One hundred microliters of blood samples was stained using 20 µL of each of the following antibodies without dilution: CD34-PerCP (50 µg/mL), CD106-PE (25 µg/mL), CD133-APC (50 µg/mL), CD146-FITC (25 µg/mL), CD45−APC–Cy7 (100 µg/mL), and KDR-PE–Cy7 (400 µg/mL). Abbreviations: APC, allophycocyanin; FITC, fluorescein isothiocyanate; KDR, kinase insert domain receptor; MNC, mononuclear cell; PE, phycoerythrin; PerCP, peridinin chlorophyll A protein. |
Lysis/wash versus lysis/no-wash procedures of blood sample preparation
The depletion of erythrocytes was essential to ensure accurate data acquisition in rare-event analysis. Moreover, some researchers have advocated a lysis/no-wash protocol in place of a lysis/wash step to reduce sample manipulation and improve cell yield. Contrastingly, washing led to systematic cell loss, while no washing decreased the signal-to-noise ratio; therefore, both required investigation.
We investigated the profile of MNCs using different procedures. We obtained three replicates of each procedure on blood samples from six cancer patients, totaling 36 samples. In samples subjected to the lysis/no-wash step, lymphocyte and monocyte populations were still detected on the Forward Scatter-A (FSC-A) versus Side Scatter-A plot (Figure 4B). However, they were not as equally distributed as the profile of samples treated with the lysis/wash step (Figure 4A). The percentages of lymphocyte and monocyte subpopulations in the FSC-A versus Side Scatter-A also slightly decreased (14.27%±8.18% versus 16.41%±9.66%, P=0.28; 7.11%±2.17% versus 8.48%±2.02%, P=0.06). However, the abundance of CD133+ cells, representative of stem cell markers (0.10%±0.08% versus 0.17%±0.16%, P=0.11), and CD146+ cells, representative of endothelial-specific markers (0.18%±0.10% versus 0.22%±0.10%, P=0.054), enumerated by both methods were similar (Figure 4). Additionally, it was noted that the blood samples prepared by the lysis/no-wash approach frequently blocked the fluid system in the flow cytometer, thus increasing the time required to acquire a given number of events.
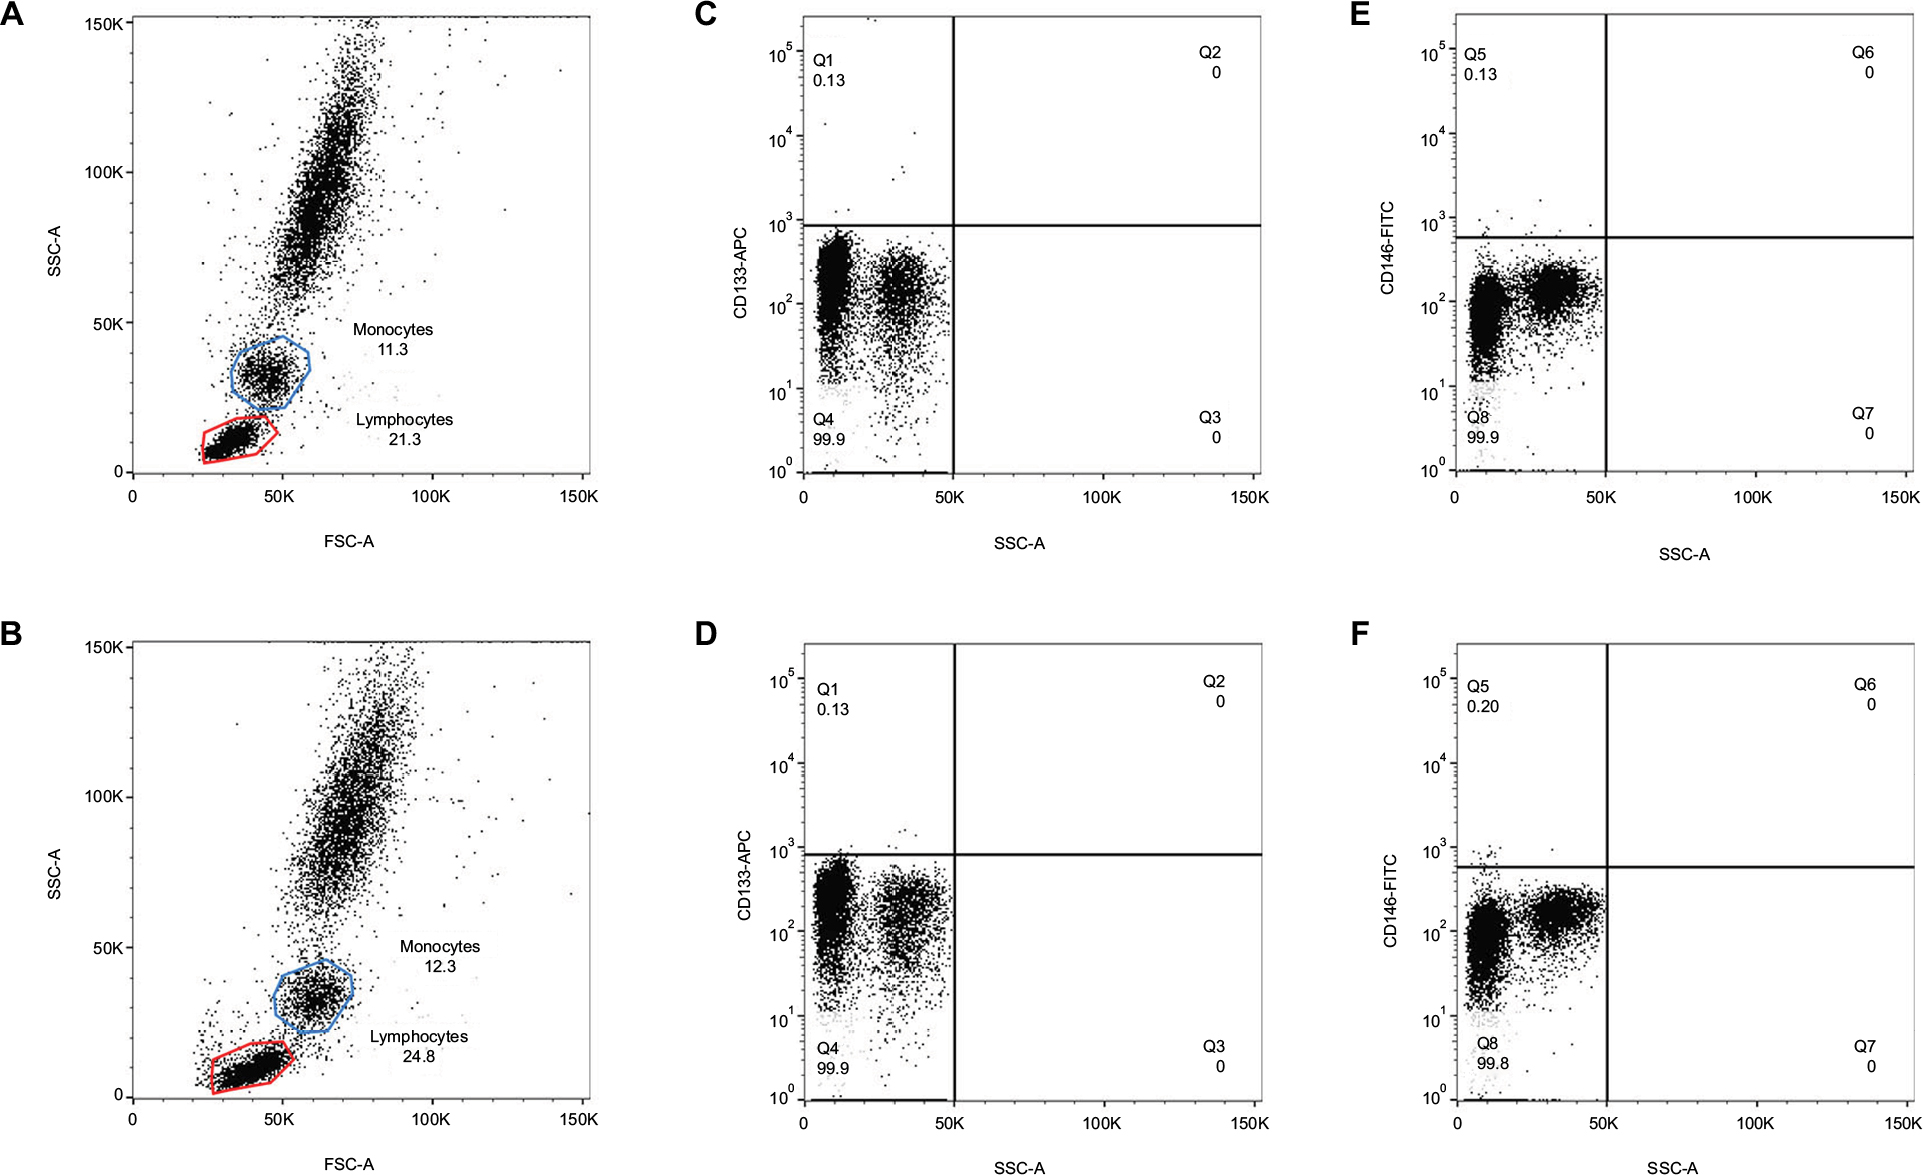 | Figure 4 Lysis/no-wash versus lysis/wash procedures of blood sample preparation. Notes: (A) Scatter plot of samples treated with lysis/wash procedure. (B) Scatter plot of samples treated with lysis/no-wash procedure. (C) The abundance of CD133+ cells in MNCs treated with lysis/wash procedure. (D) The abundance of CD133+ cells in MNCs treated with lysis/no-wash procedure. (E) The abundance of CD146+ cells in MNCs treated with lysis/wash procedure. (F) The abundance of CD146+ cells in MNCs treated with lysis/no-wash procedure. Data were analyzed by Wilcoxon signed-rank test. Abbreviations: APC, allophycocyanin; FITC, fluorescein isothiocyanate; FSC-A, Forward Scatter; MNCs, mononuclear cells; SSC-A, Side Scatter. |
Stability of fresh versus stored blood samples
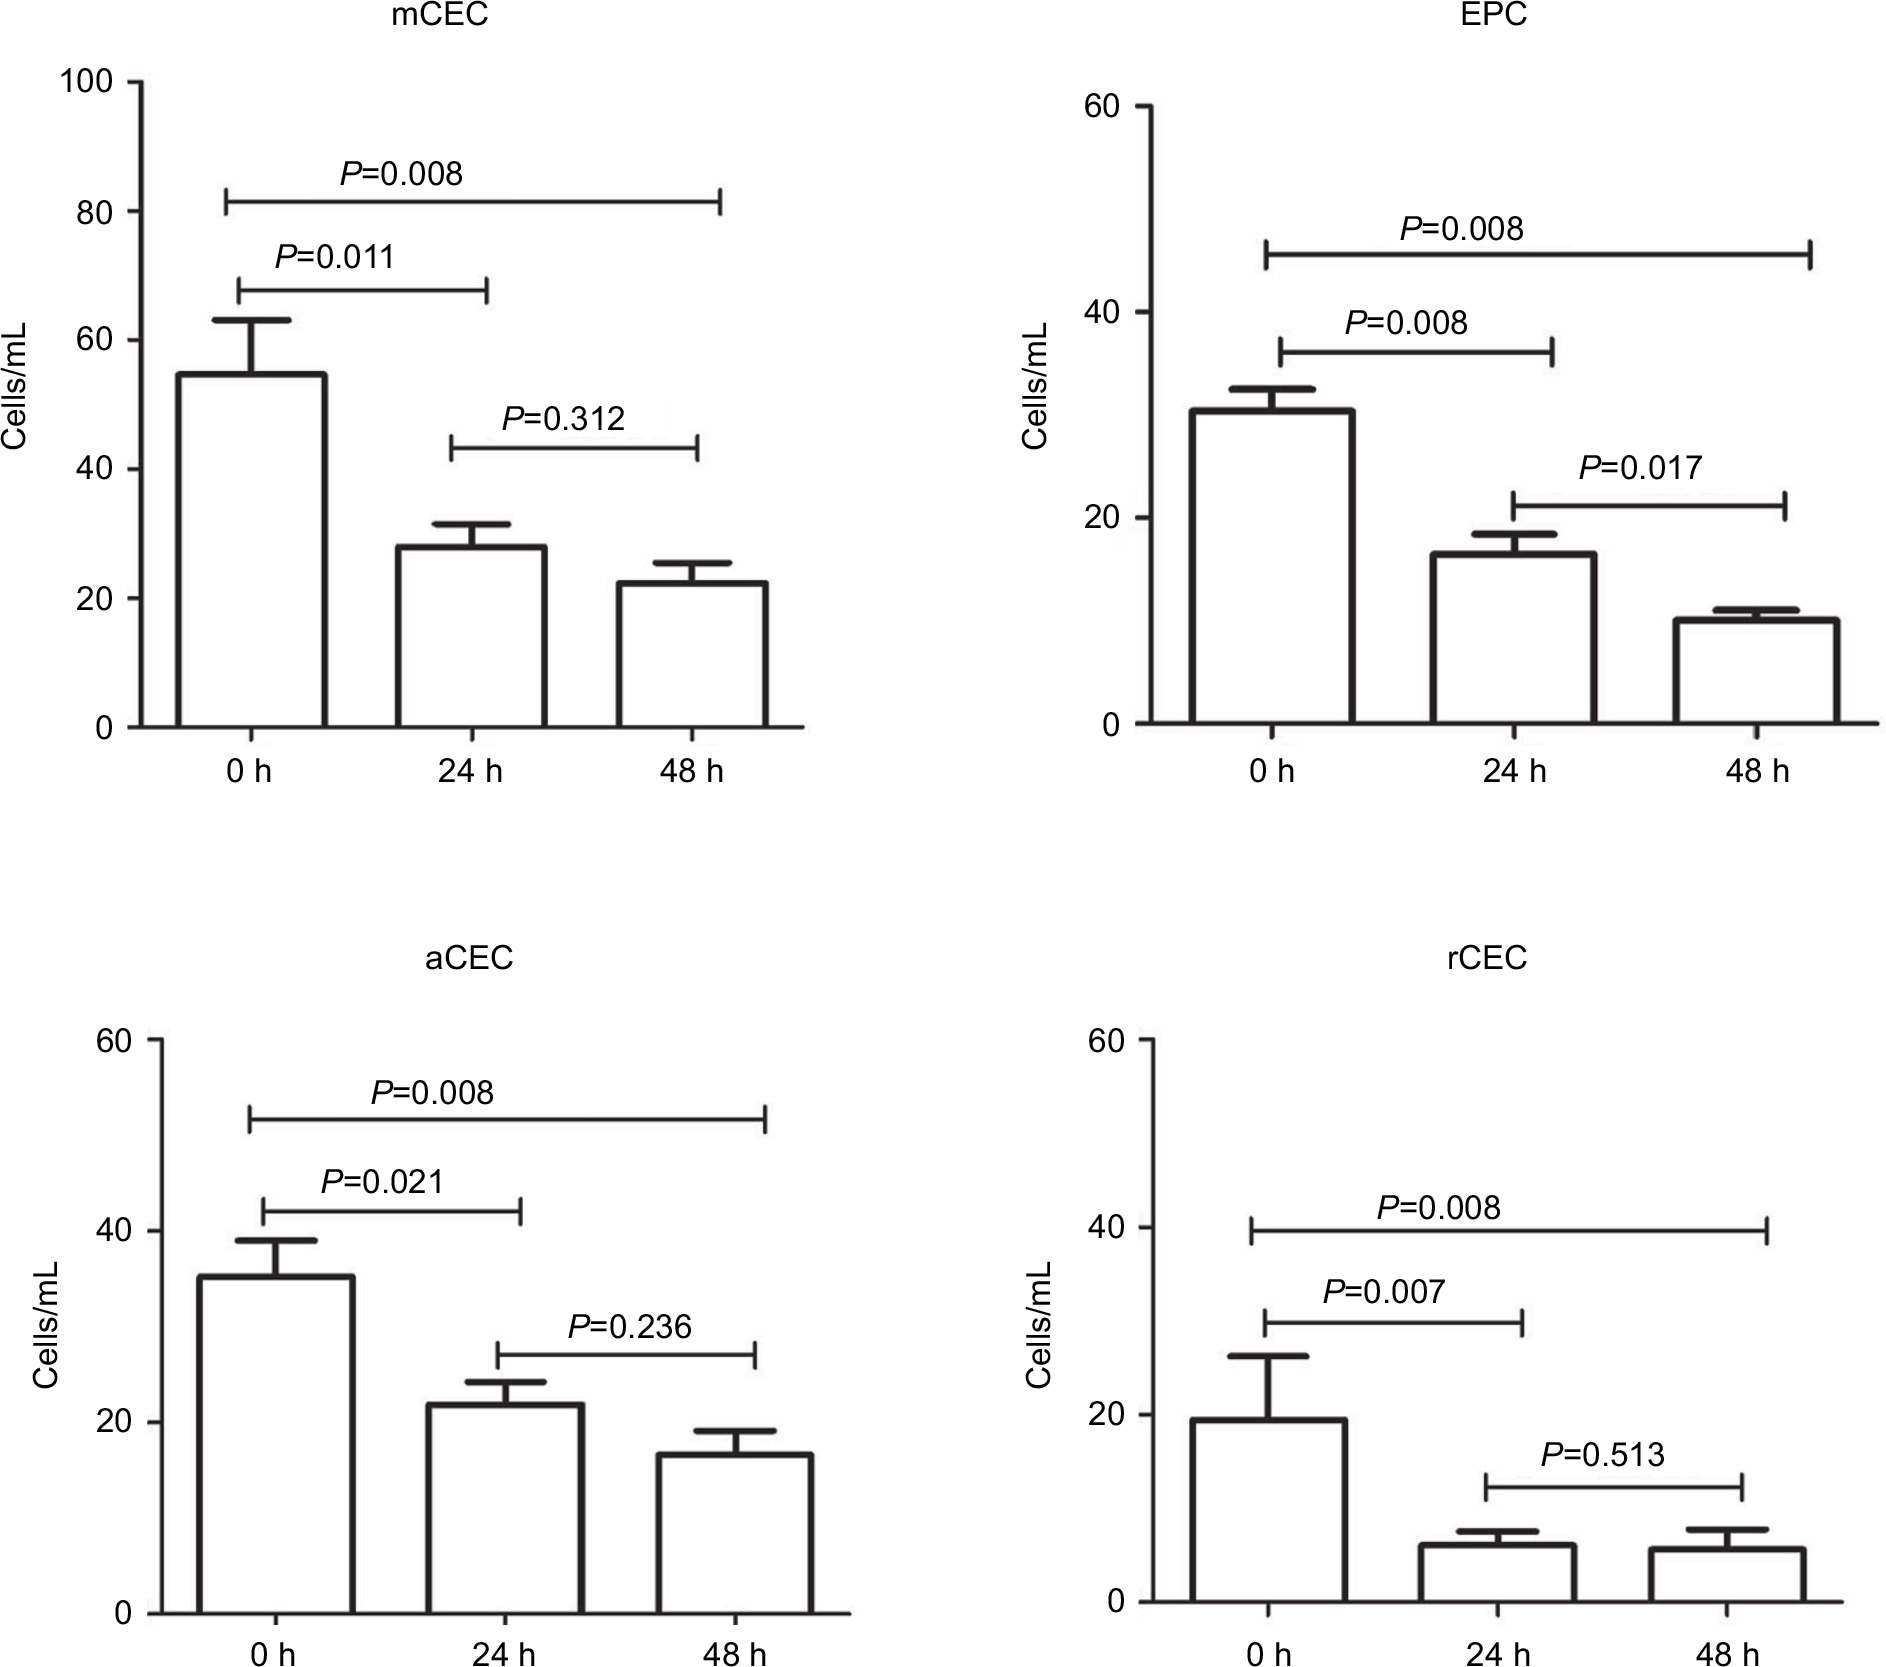
In clinical practice, blood samples have always been collected from patients at various time points during the day, and it has been difficult to immediately examine such blood after sampling. Therefore, we investigated the effect and stability of stored blood samples from cancer patients on the enumeration of CECs. In this study, the number of CECs and their subpopulations in fresh blood samples obtained from nine patients was measured after storing for 0, 24, and 48 h at 4°C. As shown in Figure S1, the percentage of lymphocytes remained equal at all time points, while the percentage of monocytes significantly decreased at 24 and 48 h. Furthermore, the number of each CEC subset decreased dramatically after storage for 24 and 48 h (Figure 5; Figure S2). For example, the number of mCECs in fresh blood samples at 0 h was 30.33±6.46 cells/mL, but it significantly decreased to 16.44±5.96 cells/mL (P=0.009) and 10.00±3.00 cells/mL (P=0.001) after storage for 24 and 48 h, respectively. Similar results were observed for the number of EPCs, aCECs, and rCECs in stored blood samples. These results reveal the shortcoming of CEC enumeration in the clinic due to short-term storage of blood samples, supporting the necessity to further analyze previously reported buffer systems that stabilized CEC viability and numbers in stored blood samples.23
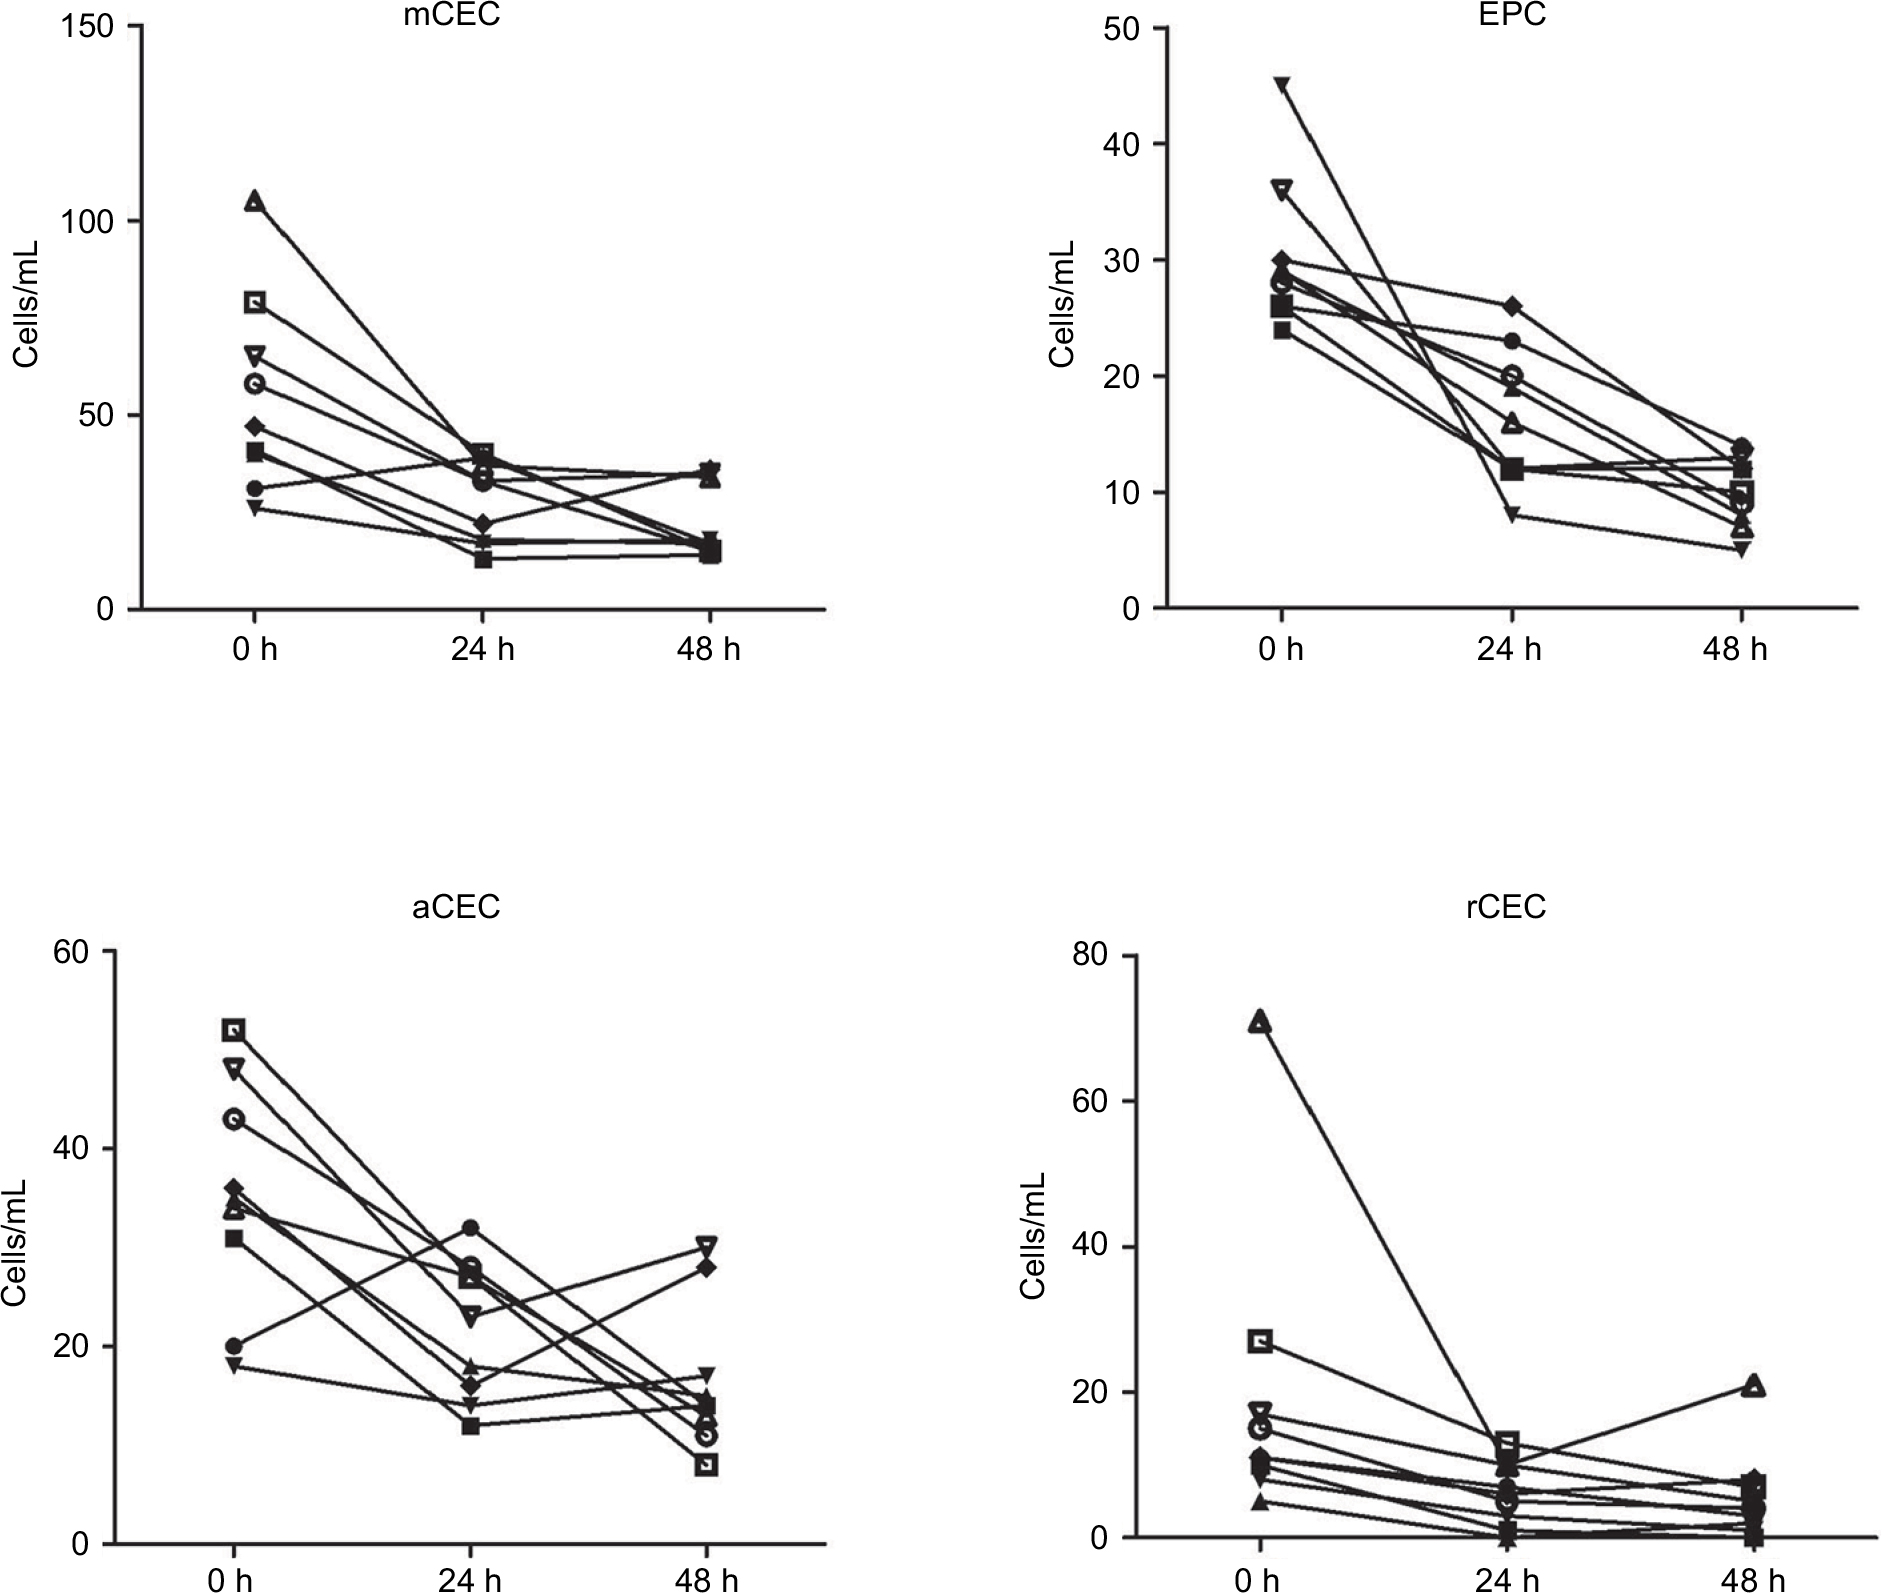 | Figure 5 Stability analysis of CECs and their subpopulations in fresh and stored blood samples. Note: The numbers of CECs and their subpopulations were quantified and analyzed after storage for 0, 24, and 48 h. Abbreviations: aCECs, activated CECs; CECs, circulating endothelial cells; EPC, endothelial progenitor cells; mCECs, mature CECs; rCECs, resting CECs. |
FCM data acquisition
For rare-event analysis, it was critical to optimize the signal-to-noise ratio, because the signal decreased with decreasing cell events acquired and false positives arose from autofluorescence or nonspecific binding of antibodies. Cytometer photomultiplier tube voltages and fluorescence compensation were adjusted accordingly for subsequent analysis.
Signal enhancement and acquisition of sufficient cell events
Acquiring adequate cell events was required for the detection of rare events. Low volumes of whole blood, such as 0.1 or 0.2 mL, that were routinely used to analyze common cells including circulating CD4+ T-helper cells, were not recommended. At least 1×10⁶–2×10⁶ cell events were obtained to ensure statistical analysis of CECs. The traditional immunomagnetic separation method used at least 1 mL of whole blood to quantify CECs.20,24 In this study, we compared the number and variability of CECs and their subpopulations between different volumes of whole blood from cancer patients. As shown in Table 2, a total of 1.0×10⁶ cell events were achieved using both 1.0 and 0.5 mL blood sample volumes. When normalized, the number of total cell events, CECs, and their subpopulations had no significant differences (P>0.05). Therefore, 0.5 mL whole blood was sufficient to measure CECs and their subpopulations, given sufficient cell events. However, it was noted that the variability (Δn%) of CECs and their subpopulations between 0.5 and 1.0 mL whole blood was somewhat high.
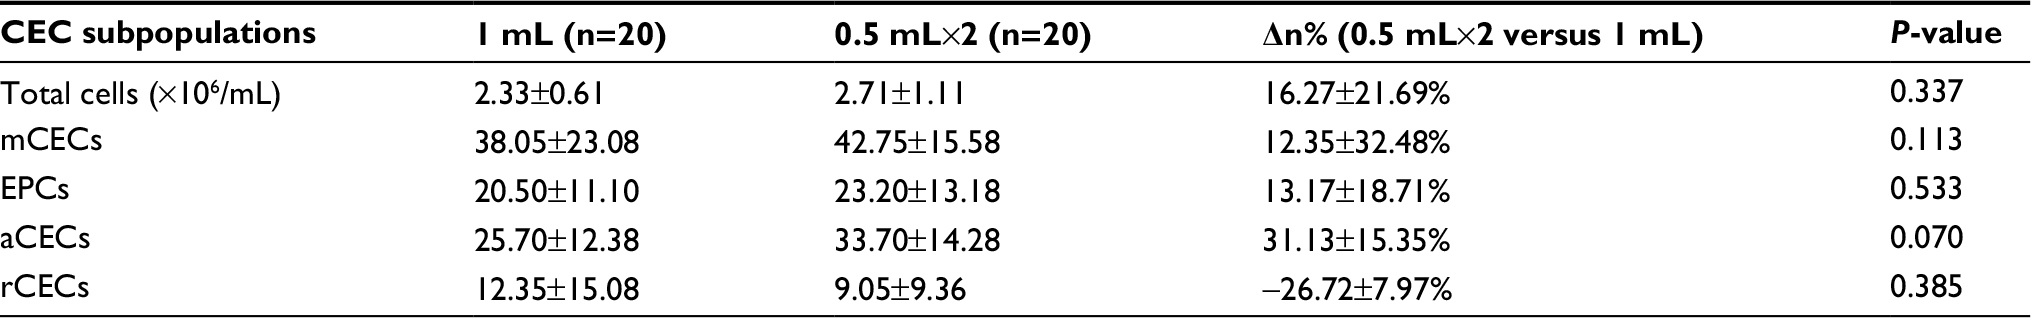 | Table 2 Comparison of the numbers and variabilities of CECs and their subpopulations between different volumes of whole blood Notes: Data are presented as mean ± SD. *P<0.05; Δn= (2*the number of 0.5 mL blood sample – the number of 1.0 mL blood sample)/the number of 1 mL blood sample*100%. Data were analyzed by the Wilcoxon test. Abbreviations: aCECs, activated CECs; CECs, circulating endothelial cells; EPC, endothelial progenitor cells; mCECs, mature CECs; rCECs, resting CECs. |
FMO versus isotype controls as negative controls
Reduction of background noise has been demonstrated to mitigate false positives. Optimal controls for background subtraction were required for detection of fluorescent-associated rare events due to noise created by autofluorescence and nonspecific binding of antibodies to cells. In this study, we compared the utilization of FMO controls, which consist of all antibodies in a panel minus the one being measured, to isotype controls. The effect of using each type of control on the measured event frequency was examined by FCM analysis of MNCs. For example, in Figure 6, the negative threshold of the isotype controls was higher than FMO controls on each single channel, possibly due to nonspecific binding and/or fluorescent contamination. When tandem fluorophores, such as PE–Cy7, were employed, isotype controls showed relatively higher background noise (Figure 6). Thus, gating with FMO controls decreased the frequency of false positives.
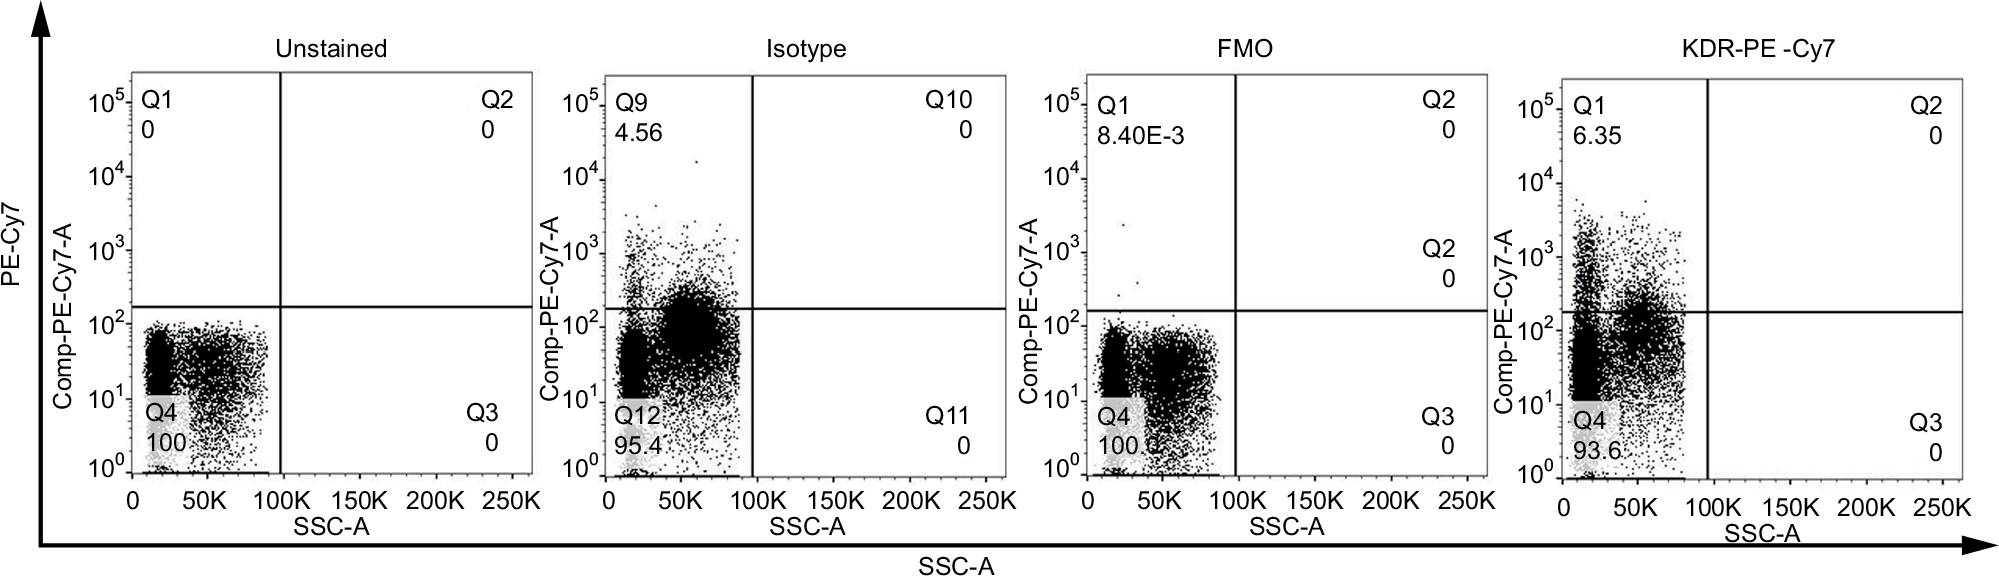 | Figure 6 Comparison of the effects of isotype controls and FMO controls. Note: Unstained sample, samples stained with isotypes controls, FMO controls, and KDR-PE–Cy7 were tested. Abbreviations: FMO, fluorescence-minus-one; KDR, kinase insert domain receptor; PE, phycoerythrin; SSC-A, Side Scatter-A. |
Selection of the appropriate number of cell surface markers
Increasing the complexity of combined antigens used has provided more precise enumeration of CECs and their subpopulations in the past, but this complexity has also lowered reproducibility, thus limiting the utility of CECs in clinical practice. For example, to detect mCECs, at least one positive endothelial cell marker and one negative progenitor marker would need to be selected. CD34 and CD133 are the most common progenitor cell markers, while CD31, CD146, and KDR are the most common endothelial cell markers in humans. Theoretically, the more endothelial and progenitor cell markers used in combination, the more accurate the identification of mCECs would be. However, this study demonstrated that this is not necessarily the case. Our results indicated that the detection threshold was inevitably low, and the variability was substantially increased after selection of an additional marker (Figure 7A). In this study, 15 cancer patients were recruited to evaluate the detection threshold of each combination of antigens. As the expression of CD146 is higher than KDR on mature cells, CD133−/KDR+ cells were rarer than CD133−/CD146+ cells in this cohort (P<0.01; Figure 7B). More importantly, the intersection of these two combinations, CD133−/CD146+/KDR+, presented a restrictive mCEC phenotype that was rarely observed in circulation and considered identifiable. As a result, the CD133−/CD146+ antigen combination was concluded as the optimal putative antigenic phenotype of mCECs, consistent with previous reports.
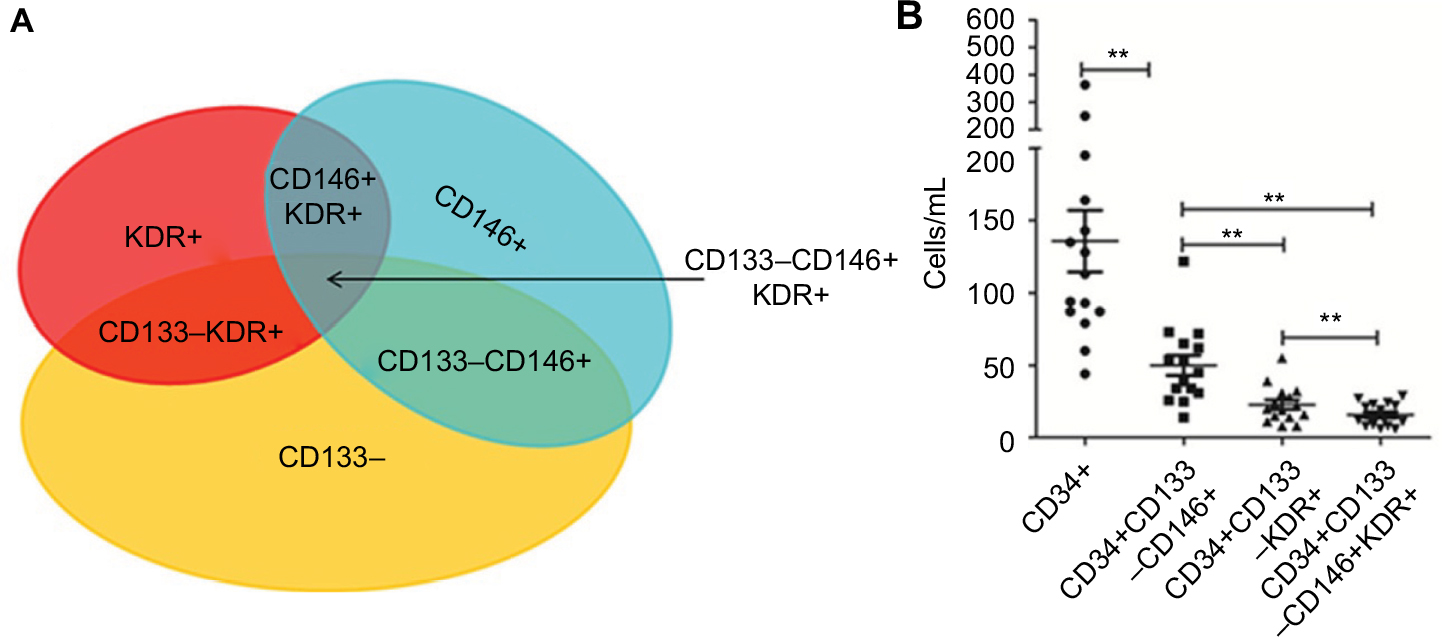 | Figure 7 Putative antigenic phenotype of mCECs. Notes: (A) A wide range of markers, including CD34+, CD133–, CD146+, and KDR+, are used to define the phenotype of mCECs. (B) The overlaps between different markers represent the detection threshold of each antigenic combination. *P<0.05; **P<0.01. Wilcoxon test was used to analyze data. Abbreviations: CECs, circulating endothelial cells; KDR, kinase insert domain receptor; mCECs, mature CECs. |
FCM analysis
After resolving key technical issues as previously described, we finally established an optimized multiparametric FCM to detect CECs and their subpopulations. Furthermore, key issues regarding the reproducibility and clinical validation of the method were addressed to ensure robust data collection and analysis.
Gating strategies for the measurement of CECs and their subpopulations
Fresh whole blood samples (1 mL) were collected in tubes containing EDTA and immediately stained with the optimized combination of antigens. The lysis/wash step was performed to remove the RBCs and increase the signal-to-noise ratio. Gating with FMO controls, instead of isotype controls, decreased the frequency of false positives. mCECs were defined as CD34+/CD45−/CD13−/CD146+; EPCs were identified as CD34+/CD45−/CD146+/CD133+; rCECs were identified as CD34+/CD45−/CD146+/CD106−; and aCECs were determined as CD34+/CD45−/CD146+/CD106+. Inflammatory cytokines such as interleukin-1 or tumor necrosis factor-α induce endothelial cells surface expression of CD106, also known as VCAM-1, which plays a vital role in a wide range of pathological processes involving tumor invasion and metastasis.25 CECs and their subpopulations were identified using successive gates, as shown in Figure 8. After the adjustment of cytometer photomultiplier tube voltages and fluorescence compensation, an initial step, which gated for large cells and clumps of cells that produced strong autofluorescence, was based on doublet gating via FSC-A/Forward Scatter-H (FSC-H) plot (Figure 8A). The MNCs gate excluded debris, dead cells, platelets, and granulocytes (Figure 8B). Next, a gate was applied on CD45− events to exclude hematopoietic cells (Figure 8C). FMO controls were set as negative controls to determine background fluorescence (Figure 8D). CD34+ cells were gated for further analysis (Figure 8E). CD133-APC/CD146-FITC plots were applied for the enumeration of mCECs and EPCs (Figure 8E), and CD106-PE/CD146-FITC plots were applied to enumerate aCECs and rCECs (Figure 8F).
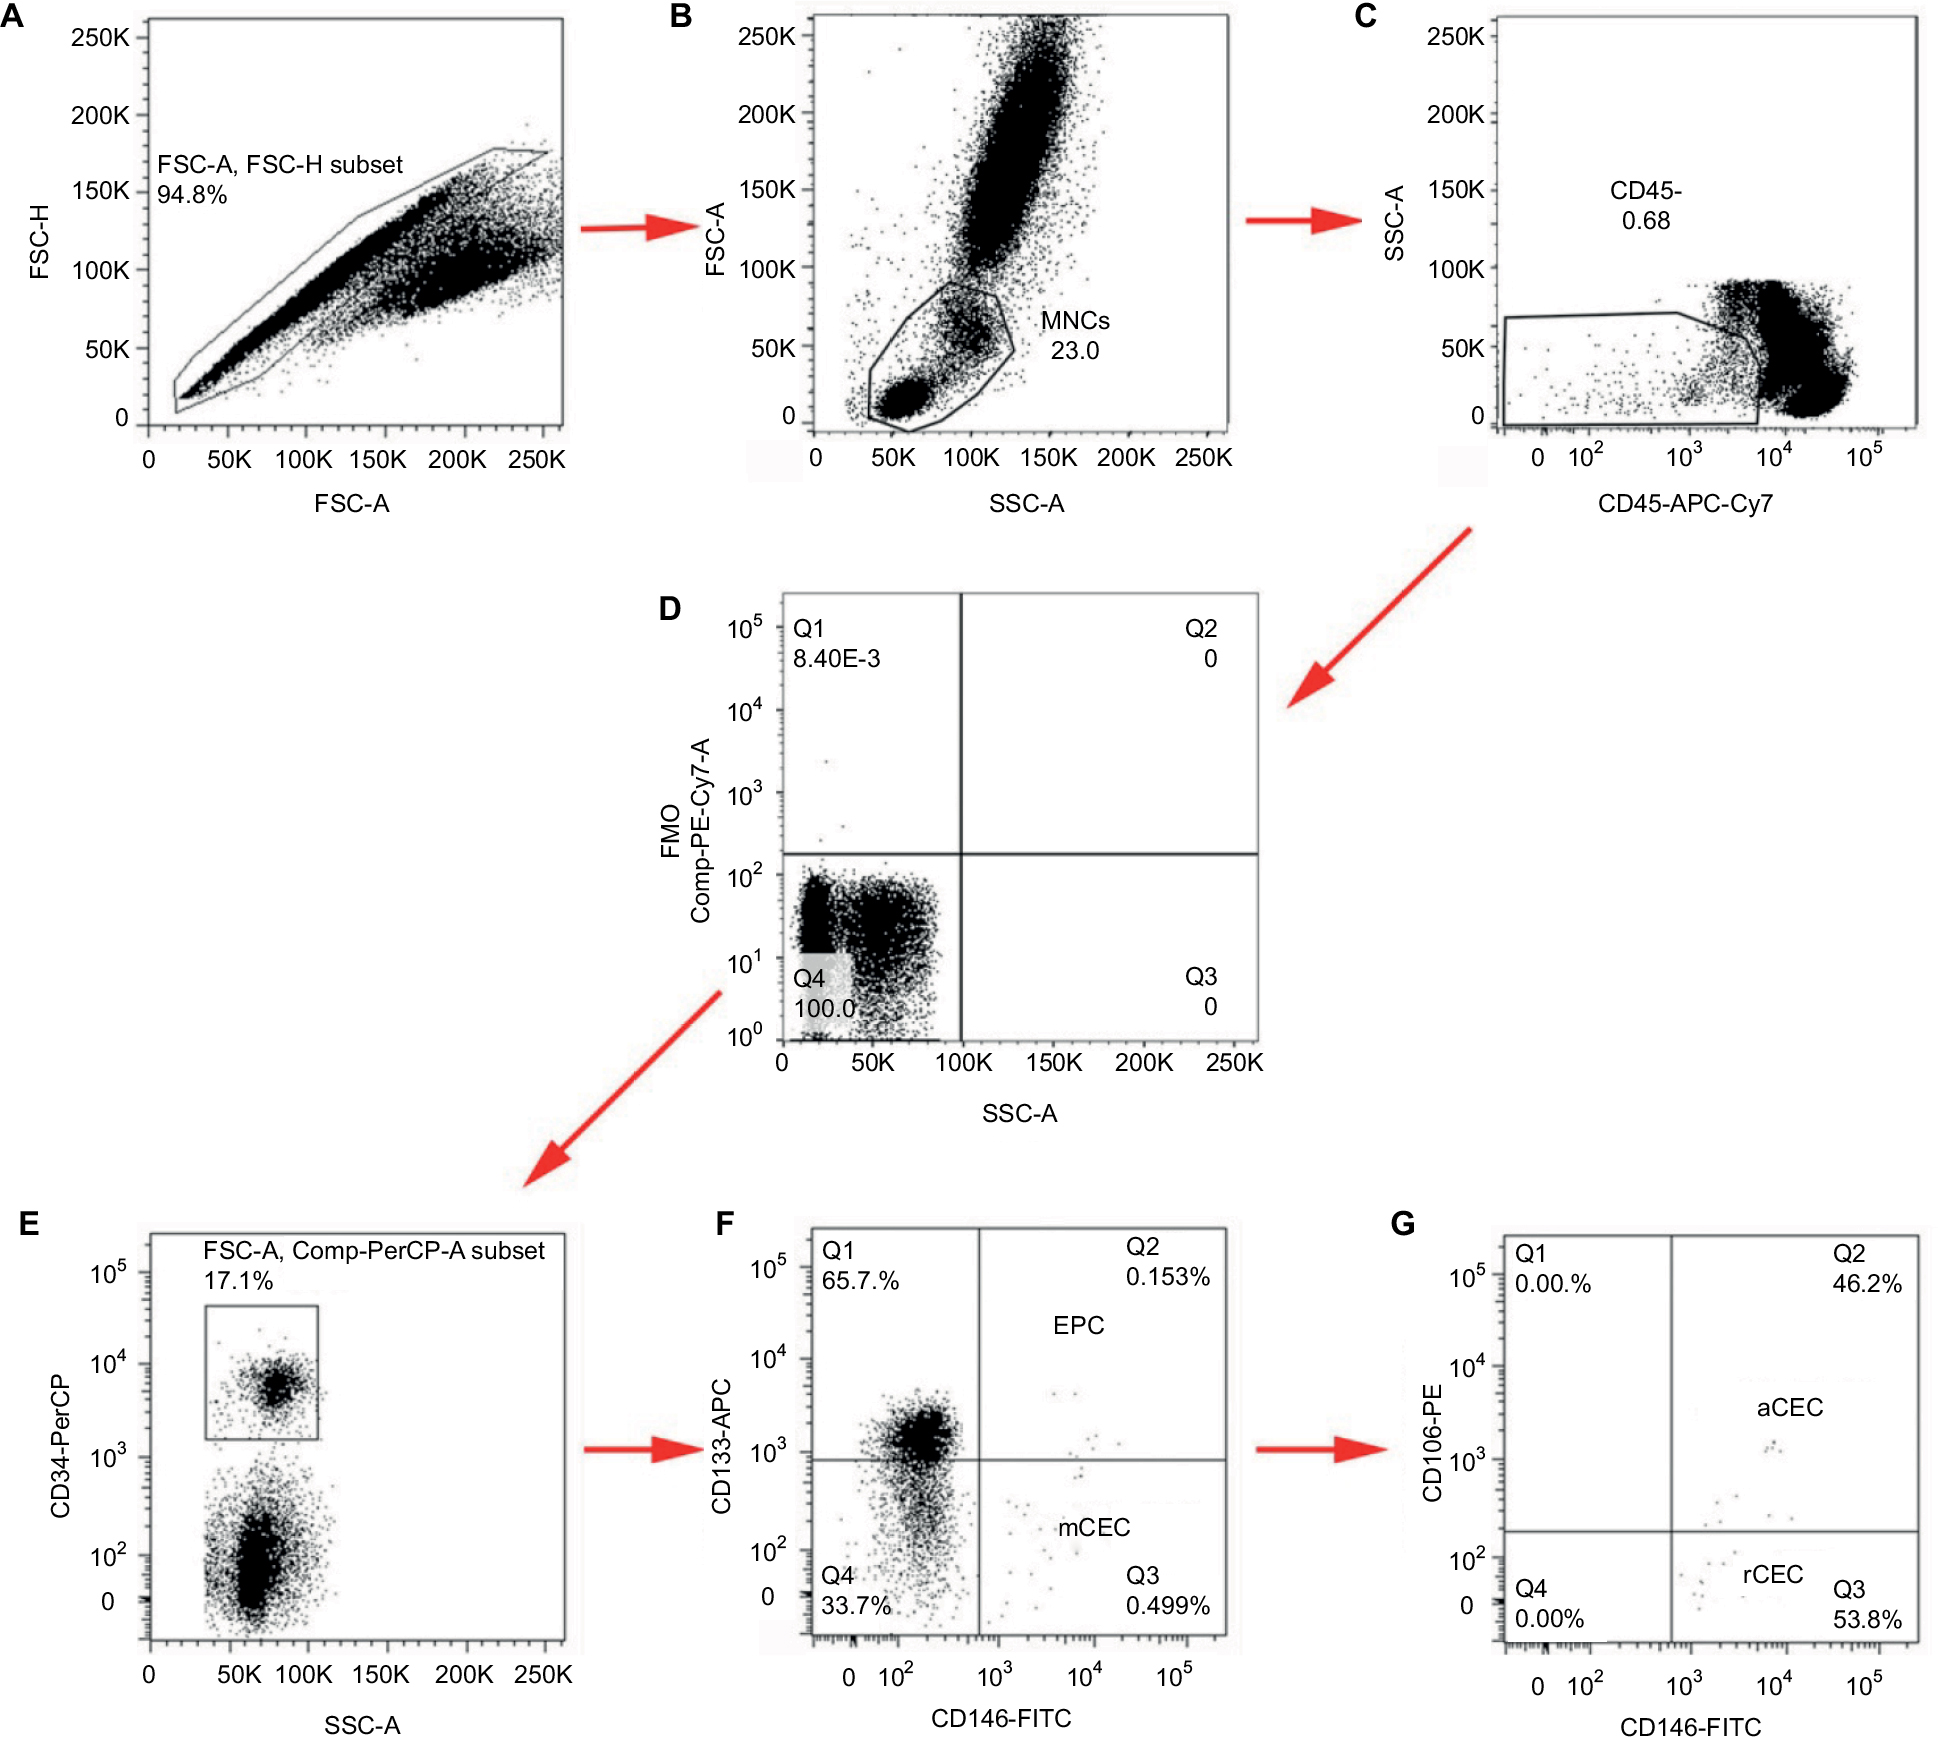 | Figure 8 Gating strategies for analysis of CECs and their subpopulations. Notes: (A) Singlet gate used to get rid of large cells and clumps of cells. (B) MNCs gate used to exclude debris, dead cells, platelets, and granulocytes. (C) Gate used to exclude hematopoietic cells coexpressing CD45 antigen. (D) FMO controls were set as negative controls. (E) Gate made to depict CD34+ cells. (F) CD34+ cells were stained with CD133 and CD146 to define EPC and mCEC, respectively. (G) aCEC and rCEC were further defined by the addition of CD106. Abbreviations: aCECs, activated CECs; APC, allophycocyanin; CECs, circulating endothelial cells; EPCs, endothelial progenitor cells; FITC, fluorescein isothiocyanate; FMO, fluorescence-minus-one; FSC-A, Forward Scatter; mCECs, mature CECs; MNCs, mononuclear cells; rCECs, resting CEC; SSC-A, Side Scatter. |
Reproducibility tests of the method
To evaluate the reproducibility of our optimized method, we examined the variability of CEC counts obtained from two duplicate test tubes of the same sample. In this study, 14 cancer patients were enrolled and the absolute number of CECs and their subpopulations was measured. As shown in Figure 9, regression analysis indicated that there was a strong association between two duplicate test tubes (P<0.0001, R2>0.900), among each CEC subset. Figure 10 illustrates the corresponding Bland–Altman plots. There were no significant differences between the CEC counts of the two duplicate test tubes.
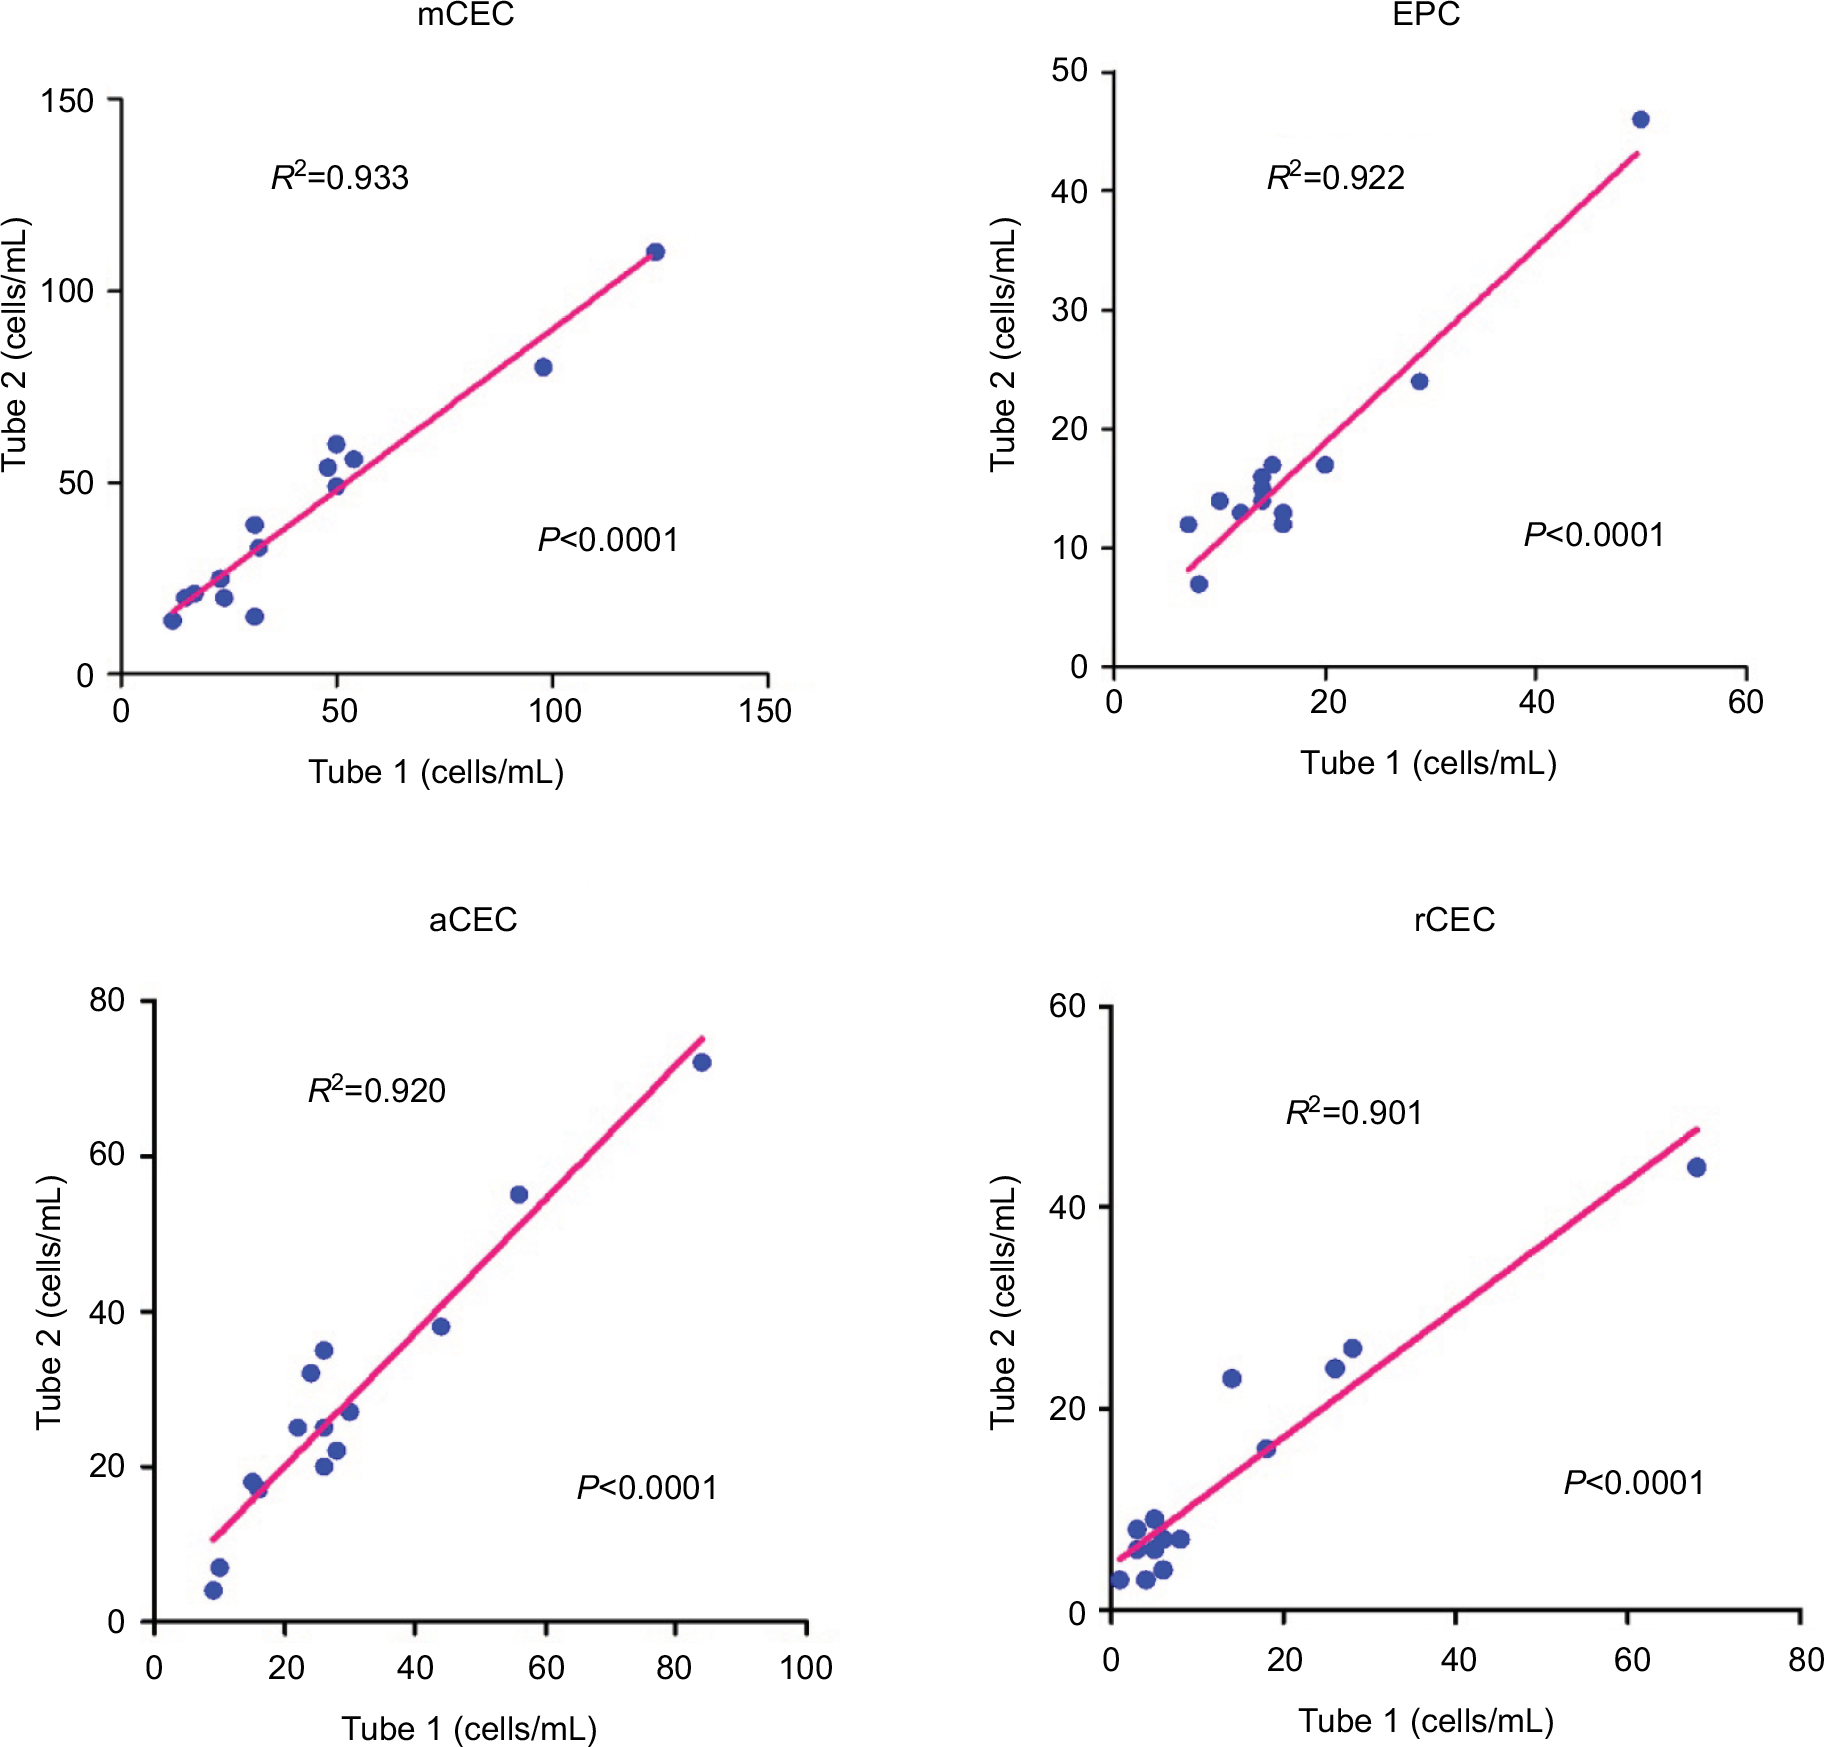 | Figure 9 Reproducibility tests. Correlations between two duplicate test tubes in observed absolute numbers of CECs and their subpopulations. Abbreviations: aCECs, activated CECs; CECs, circulating endothelial cells; EPC, endothelial progenitor cells; mCECs, mature CECs; rCECs, resting CECs. |
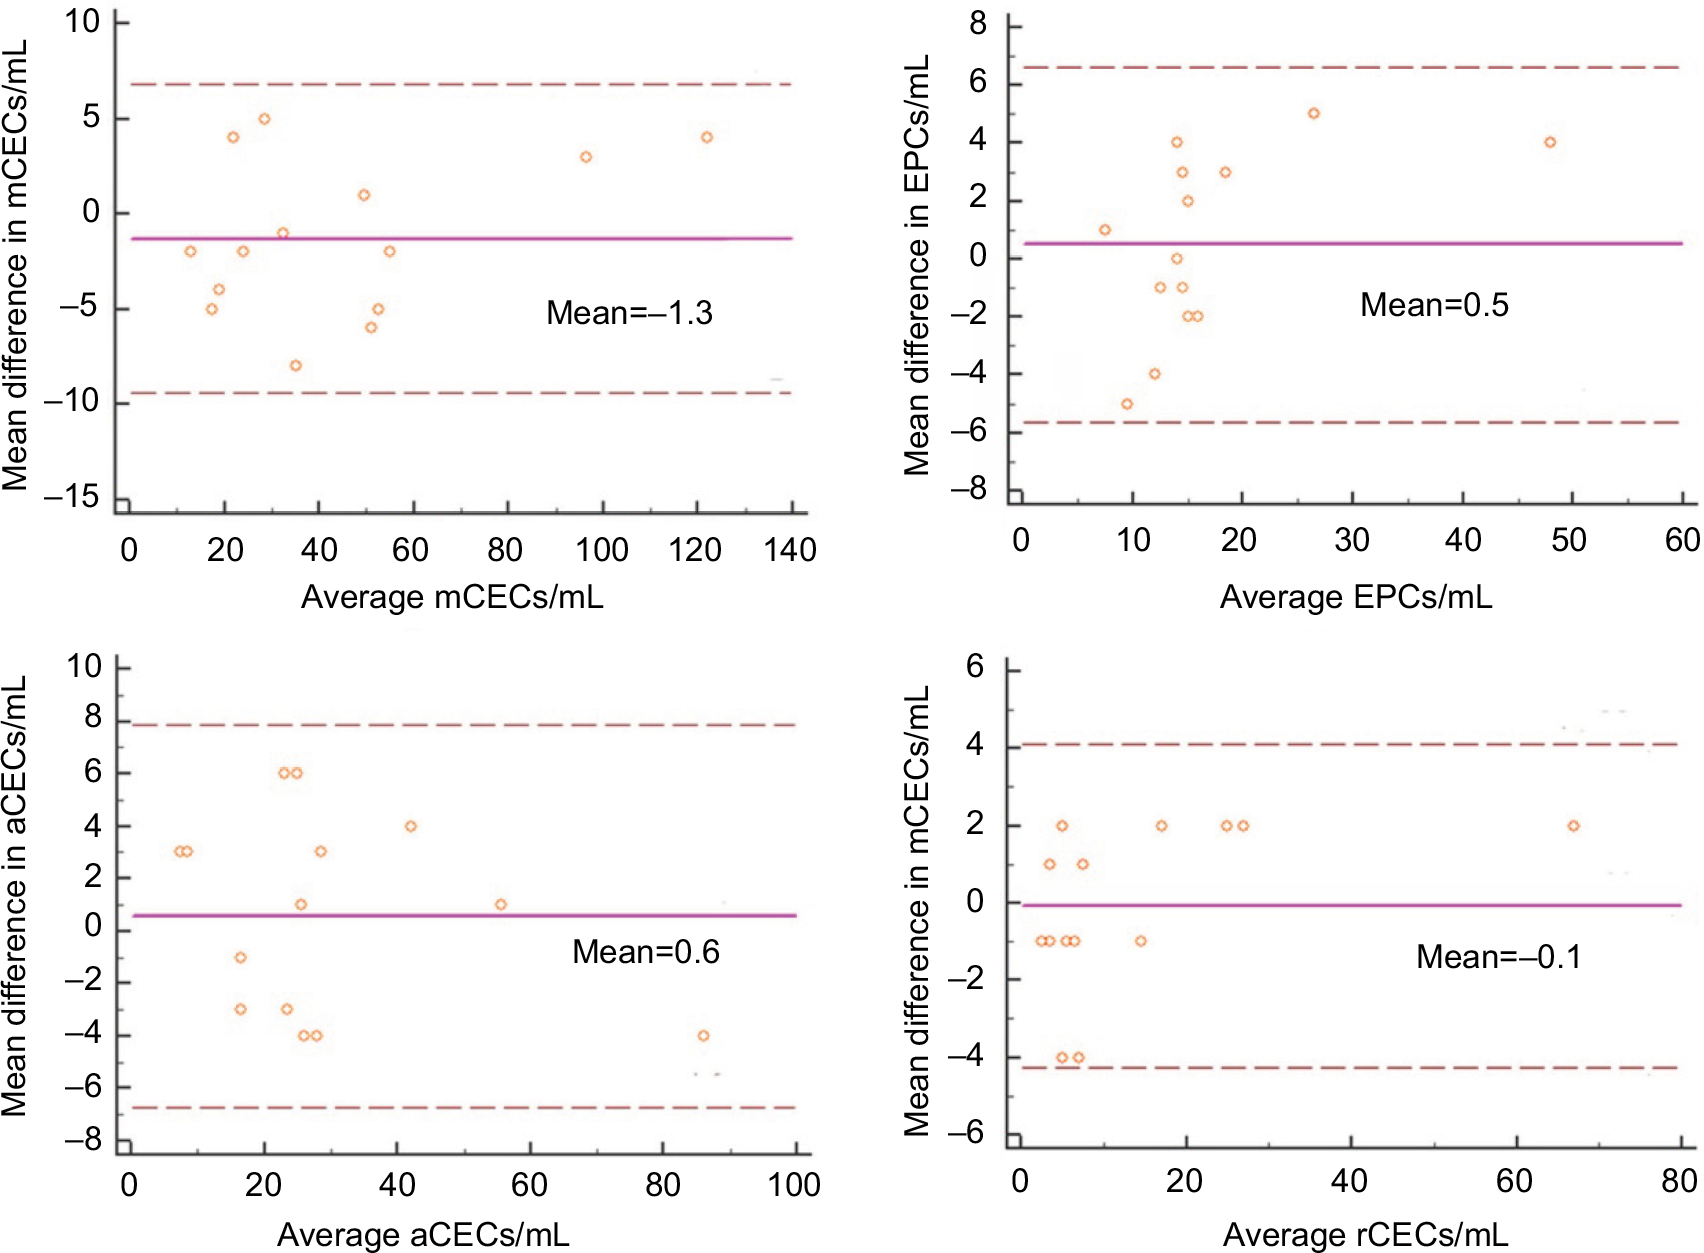 | Figure 10 Bland–Altman plots comparing the numbers of CECs and their subpopulations between duplicates. Abbreviations: aCECs, activated CECs; CECs, circulating endothelial cells; EPC, endothelial progenitor cells; mCECs, mature CECs; rCECs, resting CECs. |
Clinical validation: comparing CEC enumeration in cancer patients versus healthy controls
Next, we compared the number of CECs and their subpopulations between cancer patients and healthy individuals to validate the clinical utility of our method. In this study, 44 cancer patients and 16 healthy individuals were recruited. As shown in Table 3, significantly higher baseline levels of CECs and their subpopulations were measured in cancer patients, compared to healthy subjects. In detail, mCECs were 24.50±8.28 cells/mL in healthy subjects and 48.95±38.00 cells/mL in cancer patients (P=0.001); EPCs were 10.25±8.32 cells/mL in healthy subjects and 21.30±14.50 cells/mL in cancer patients (P=0.009); and aCECs were 15.75±7.08 cells/mL in healthy subjects and 30.59±17.80 cells/mL in cancer patients (P=0.001). There was no significant difference in rCEC levels between healthy subjects and cancer patients (8.75±7.11 versus 18.36±27.66 cell/mL, P=0.193).
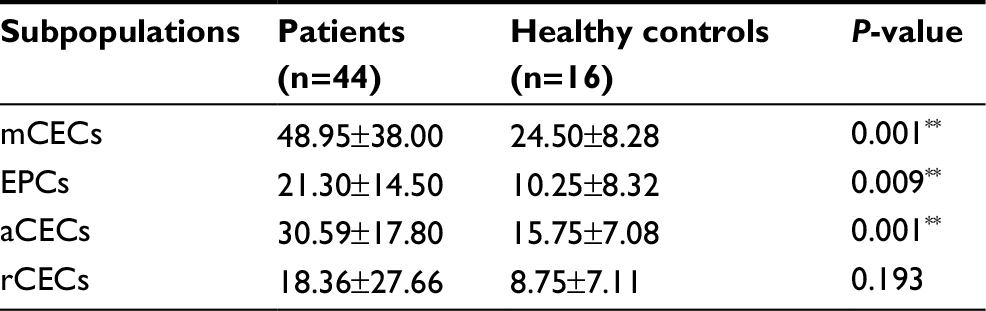 | Table 3 Comparison of the numbers of CECs and their subpopulations in cancer patients and healthy controls Notes: Data are presented as mean ± SD. **P<0.01. Data were analyzed by the Mann–Whitney test. Abbreviations: aCECs, activated CECs; CECs, circulating endothelial cells; EPC, endothelial progenitor cells; mCECs, mature CECs; rCECs, resting CECs. |
Moreover, we preliminarily compared the variations between these different cancer types. The numbers of EPC in breast cancer and others were significantly different compared to healthy controls, whereas the total number of CECs in colorectal and lung cancer patients was similar to controls (Figure S3). Similar results were observed for mCEC and aCEC. Otherwise, there was no significant difference in rCEC levels between healthy subjects and different cancer types. Furthermore, we investigated the differences at different stages of cancer. As shown in Figure S4, the numbers of EPC, mCEC, and aCEC were significantly increased in patients with metastatic cancers compared to healthy controls. The numbers of mCEC and aCEC were also significantly increased in non-metastatic cancers compared with healthy controls. However, there was no difference between metastatic and non-metastatic cancers.
Discussion
In this study, we optimized a five-color FCM method to measure CECs and their subpopulations in peripheral blood of patients with solid tumors by addressing several key technical issues. We investigated and integrated resolutions to preanalytical issues, including sample material and anticoagulant selection, titration of antibodies, comparison of lysis/no-wash versus lysis/wash procedures during blood sample preparation, and the stability of fresh and stored blood samples. Regarding FCM data acquisition, we focused on signal enhancement and background noise reduction. Acquiring sufficient cell events increased the signal measured, and gating with FMO controls as negative controls, in place of isotype controls, reduced background noise. Moreover, the utilization of an optimal number of cell surface markers improved the identification and quantification of CECs and their subpopulations. Finally, issues concerning FCM analysis were addressed by evaluating the reproducibility of our method.
Firstly, we selected whole blood instead of PBMCs or antibody-labeled cells as sample material for further analysis. The isolation of PBMCs by density gradient centrifugation led to significant cell loss.26 During enrichment of antibody-labeled cells, such as CD34+ cells, via magnetically labeled beads, cells with weaker signal were lost. Furthermore, the high performance of current multiparametric flow cytometers enabled higher practicality and efficiency in using whole blood as the sample material.22 Different anticoagulants have been used in the sample preparation of various previous studies;27,28 however, it was unknown whether the selection of anticoagulant affected enumeration of CECs. Nicholson and Green observed that between samples collected in EDTA-, ACD-, and heparin-containing tubes, lymphocyte immunophenotyping results were not significantly different, aside from a small difference due to EDTA at 48 h.29 Jamsa et al indicated that ACD and heparin affected flow cytometric analysis of leukocyte surface antigens similarly.30 Therefore, previous evidence supported that there was no significant difference between using these three anticoagulants. Furthermore, the percentage of MNCs was similar among the three anticoagulants, indicating the enumeration of CECs was accurate regardless of the anticoagulant. We selected EDTA as the anticoagulant to be used in our analyses to remain consistent with EDTA presence in the RBC lysis buffer, as recommended by the manufacturer.
Due to the heterogeneity of CECs and their subpopulations, immunostaining of multiple cell surface markers was required for accurate CEC enumeration.6 Although the vendors of the antibodies recommended working concentrations of each antibody, we validated the concentrations through titration experiments prior to use. Despite previous studies,20 this study indicated that the immunostaining efficiency of each antibody was highly variable, as shown in Figure 3, and the optimal concentrations did not necessarily coincide with the manufacturer’s recommendations. Dose titration tests before FCM analysis were, therefore, necessary and would be beneficial for establishing a reasonable strategy prior to analysis.
Some researchers previously advocated that a lysis/no-wash procedure was required when absolute cell counts, such as CD34+ hematopoietic stem cells, were measured.31 However, in rare-event analysis, the elimination of RBCs is necessary to enhance signal detection of targeted cells. Usually, there are two ways to exclude RBCs: centrifugation methods such as using Cell Preparation Tube (BD) to remove the RBC population and direct lysis of RBCs using lysing solutions. CPT can decrease the complexity of steps for MNC cell separation, thereby minimizing variability from sample processing. For rare-event analysis, improving the cell yield is required and one-step centrifugation method may help to achieve this goal. In addition, the washing step reduces nonspecific fluorescence, which is advantageous despite the potential for cell loss due to additional sample manipulation. We compared the lysis/no-wash and lysis/wash procedures in blood sample preparation and observed that there was no significant negative effect of the washing step, whereas the lysis/no-wash step resulted in blockage of the flow cytometer fluid.
Fresh blood samples provide the most optimal conditions for CEC enumeration, but we investigated the effect and stability of stored samples due to their abundance in clinical practice. Studies have demonstrated that storage time of samples influenced the intensity of fluorescence of surface markers.27,32 In this study, we validated this observation, showing that CEC subset counts decreased significantly after short-term storage at 24 and 48 h. To overcome this limitation, stabilizer reagents, such as TransFix (Cytomark, Buckingham, UK), may be utilized in the collection of blood samples to prolong stability and storage time.23
Maximizing the signal-to-noise ratio, while reducing false positives, is essential for accurate CEC enumeration. An adequate number of cell events are required for the detection of rare events. Some studies previously used low volumes of whole blood, such as 0.1 or 0.2 mL, to analyze CECs, which actually increased the coefficient of variation of CEC counts.33,34 Our results reported that at least 0.5 mL whole blood was sufficient to efficiently measure CECs. Optimal negative controls were necessary to assess background noise in rare-event analysis. Fluorochrome-matched isotype controls did not accurately measure nonspecific antibody binding, and it was previously reported that the same cell populations were stained, at varying levels, by different isotype controls.35 Alternatively, we demonstrated that FMO controls were more beneficial in delineating the threshold for antibody positivity. Gating with FMO controls decreased the frequency of false positives and was necessary to accurately identify positive cells in fully stained samples, following multicolor flow cytometry. In theory, the more endothelial and stemness markers used to detect cells, the more precise the identification of CECs and their subpopulations. In reality, our results showed that the addition of markers, such as KDR, significantly decreased the number of cell events, leading to a high standard error of the mean.35 Moreover, studies demonstrated that increased complexity of the combined antigens did not necessarily improve the detection performance in daily clinical practice, despite being more specific.36 Fadini et al advised that “simplified” biomarkers were more clinically feasible.37
Altogether, we established a five-color FCM to detect CECs and their subpopulations. To evaluate the reliability of our method, we tested its reproducibility by comparing duplicates of samples from 14 cancer patients. There was a strong association between the duplicates of each subset (P<0.0001, R2>0.900). Next, we clinically validated the utility of our method. As shown in Table 3, significantly higher baseline levels of CECs and their subpopulations, except rCECs, were measured in cancer patients compared to healthy subjects. Median mCEC values in cancer patients and healthy subjects were 48.95±38.00 and 24.50±8.28 cells/mL, respectively, which were consistent with the values reported by other groups.33,38 Further, we examined the levels of CEC subpopulations in the different sample groups and observed that aCECs and EPCs, but not rCECs, were significantly increased in cancer patients compared to healthy individuals. We also investigated differences in different types and stages of cancer and found that levels of CECs and their subpopulations were significantly different between various types and stages of cancer. However, it was noted that, due to the limitation in the number of each type and stage of cancer patients recruited, we did not certainly address whether levels of CECs and their subpopulations significantly varied between different types and stages of cancer. Mancuso et al21 and Jacques et al20 provided evidences that levels of CECs and their subpopulations were significantly different among them, but more investigation is required. Therefore, these results demonstrated the clinical application of our method.
There are several limitations and issues that we did not discuss in the current study. First, whether FCM analysis of CECs would benefit from the use of a cell viability stain, such as 7-aminoactinomycin D, remains a question. The addition of a cell viability dye may facilitate the exclusion of unlysed erythrocytes, platelets, aggregates, and endothelial microparticles from the analysis and, to some extent, resolve the discrepancies of CEC enumeration between different FCM methods. However, an FCM staining strategy that includes a cell viability dye will only consider viable CECs, which may lead to an underestimation of CEC levels, although it should be noted that researchers such as Wong et al demonstrated that the levels of CECs did not significantly differ when analyzed with or without the addition of 7-aminoactinomycin D.39,40 Second, most published FCM assays, including this study, utilized common progenitor and endothelial markers, such as CD34, CD133, and CD146, to identify CECs and their subpopulations, with only a few novel markers being investigated. Mancuso et al identified a subpopulation of CECs that expressed CD109, which was implicated as a potential prognostic factor for glioblastoma patients.41 More importantly, many tumor endothelial markers have been identified through genomic studies that distinguished antigens enriched in tumors from nonmalignant endothelia, thereby making it possible to identify CEC subpopulations that more closely reflect the pathological state of angiogenesis.42,43 For example, Kraan et al identified a tumor-associated endothelial marker, CD276, by comparing the antigen expression of normal and tumor tissue-derived endothelial cells, and CD276+ CECs were significantly higher in patients with advanced cancers.44 Mehran et al observed that circulating TEM+ endothelial cells may serve as more specific markers for cancer prognosis and tumor response than standard CECs.45 In addition, Jin et al revealed that 28 proteins were upregulated in tumor-derived endothelial cells through comparative proteomics analysis, of which transgelin-2 was implicated as a potential biomarker for tumor angiogenesis.46 These observations extended our knowledge and understanding of generalized CECs and must be explored further. Finally, in this study, only patients with solid tumors were recruited and hematologic malignancies such as leukemia were not included. Wierzbowska et al24 and Zahran et al25 observed that the levels of CECs and their subpopulations were higher in acute myeloid leukemia and correlate with disease status and response to treatment. Rigolin et al47 and Gora-Tybor et al48 found that higher levels of CECs were identified in patients with chronic lymphocytic leukemia compared to controls. Godoy et al49 concluded that the number of CECs was increased in chronic myeloid leukemia. All of these researches also used FCM methods to measure CECs and their subpopulations; however, whether our method could be applied to hematologic malignancies such as leukemia remains to be investigated and validated.
Conclusion
There is significant interest and progress in the development of CECs and their subpopulations as potential diagnostic biomarkers; however, the lack of a well-standardized definition and measurement of CECs limits their clinical utility. Our study integrated comprehensive resolutions to critical technical issues that previously published assays failed to address in FCM analysis of CECs. We demonstrated that our results would be instrumental in the optimal enumeration and characterization of CECs in solid tumors. Our findings provide a clinically feasible and robust method for FCM analysis of CECs and their subpopulations and contribute to the potential application of this method in clinical oncology.
Acknowledgments
This work was supported by Shenzhen Science Founding (JCYJ20160422162900408, JCYJ20170307095037263, JCYJ20140416122811939), Shenzhen San Ming Project (SYLY201724), and Chinese Postdoctoral Science Foundation (2017M612849) in China.
Author contributions
All authors contributed to the conception and design of the study, acquisition of data, or analysis and interpretation of data. FZ, YZ, MY, and JW collected data; FZ, YZ, MY, JW and JD contributed to the analysis, interpretation of data, and preparation of figures and tables; and FZ and WT drafted the manuscript. All the authors read and approved the final manuscript. All authors contributed to critically revising the manuscript for important intellectual content and agree to be accountable for all aspects of the work.
Disclosure
The authors report no conflicts of interest in this work.
References
Weis SM, Cheresh DA. Tumor angiogenesis: molecular pathways and therapeutic targets. Nat Med. 2011;17(11):1359–1370. | ||
Hurwitz H, Fehrenbacher L, Novotny W, et al. Bevacizumab plus irinotecan, fluorouracil, and leucovorin for metastatic colorectal cancer. N Engl J Med. 2004;350(23):2335–2342. | ||
Strumberg D, Scheulen ME, Schultheis B, et al. Regorafenib (BAY 73-4506) in advanced colorectal cancer: a phase I study. Br J Cancer. 2012;106(11):1722–1727. | ||
Ueda T, Uemura H, Tomita Y, et al. Efficacy and safety of axitinib versus sorafenib in metastatic renal cell carcinoma: subgroup analysis of Japanese patients from the global randomized Phase 3 AXIS trial. Jpn J Clin Oncol. 2013;43(6):616–628. | ||
Komatsu Y, Doi T, Sawaki A, et al. Regorafenib for advanced gastrointestinal stromal tumors following imatinib and sunitinib treatment: a subgroup analysis evaluating Japanese patients in the phase III GRID trial. Int J Clin Oncol. 2015;20(5):905–912. | ||
Bertolini F, Shaked Y, Mancuso P, Kerbel RS. The multifaceted circulating endothelial cell in cancer: towards marker and target identification. Nat Rev Cancer. 2006;6(11):835–845. | ||
Bertolini F, Mancuso P, Shaked Y, Kerbel RS. Molecular and cellular biomarkers for angiogenesis in clinical oncology. Drug Discov Today. 2007;12(19-20):806–812. | ||
Kraan J, Sleijfer S, Foekens JA, Gratama JW. Clinical value of circulating endothelial cell detection in oncology. Drug Discov Today. 2012;17(13–14):710–717. | ||
Zhou F, Zhou Y, Dong J, Tan W. Circulating endothelial cells and their subsets: novel biomarkers for cancer. Biomark Med. Epub 2017 Jun 9. | ||
Reeves F, Sapre N, Corcoran N, Hovens C. Tumor vascularity in prostate cancer: an update on circulating endothelial cells and platelets as noninvasive biomarkers. Biomark Med. 20113;7(6):879–891. | ||
Manzoni M, Comolli G, Torchio M, Mazzini G, Danova M. Circulating endothelial cells and their subpopulations: role as predictive biomarkers in antiangiogenic therapy for colorectal cancer. Clin Colorectal Cancer. 2015;14(1):11–17. | ||
Liu Y, Yuan D, Ye W, Lv T, Song Y. Prognostic value of circulating endothelial cells in non-small cell lung cancer patients: a systematic review and meta-analysis. Transl Lung Cancer Res. 2015;4(5):610–618. | ||
Kawaishi M, Fujiwara Y, Fukui T, et al. Circulating endothelial cells in non-small cell lung cancer patients treated with carboplatin and paclitaxel. J Thorac Oncol. 2009;4(2):208–213. | ||
Ilie M, Long E, Hofman V, et al. Clinical value of circulating endothelial cells and of soluble CD146 levels in patients undergoing surgery for non-small cell lung cancer. Br J Cancer. 2014;110(5):1236–1243. | ||
Najjar F, Alammar M, Bachour M, Al-Massarani G. Circulating endothelial cells as a biomarker in non-small cell lung cancer patients: correlation with clinical outcome. Int J Biol Markers. 2014;29(4):e337–e344. | ||
Sanchez Hernandez A, José Juan O, Vidal Martínez J, et al. Quantification of circulating endothelial cells as a predictor of response to chemotherapy with platinum and pemetrexed in patients with advanced non-squamous non-small cell lung carcinoma. Clin Transl Oncol. 2015;17(24):281–288. | ||
Najjar F, Alammar M, Bachour M, et al. Predictive and prognostic value of circulating endothelial cells in non-small cell lung cancer patients treated with standard chemotherapy. J Cancer Res Clin Oncol. 2015;141(1):119–125. | ||
Hristov M, Schmitz S, Nauwelaers F, Weber C. A flow cytometric protocol for enumeration of endothelial progenitor cells and monocyte subsets in human blood. J Immunol Methods. 2012;381(1–2):9–13. | ||
Lanuti P, Santilli F, Marchisio M, et al. A novel flow cytometric approach to distinguish circulating endothelial cells from endothelial microparticles: relevance for the evaluation of endothelial dysfunction. J Immunol Methods. 2012;380(1–2):16–22. | ||
Jacques N, Vimond N, Conforti R, et al. Quantification of circulating mature endothelial cells using a whole blood four-color flow cytometric assay. J Immunol Methods. 2008;337(2):132–143. | ||
Mancuso P, Antoniotti P, Quarna J, et al. Validation of a standardized method for enumerating circulating endothelial cells and progenitors: flow cytometry and molecular and ultrastructural analyses. Clin Cancer Res. 2009;15(1):267–273. | ||
Hedley BD, Keeney M. Technical issues: flow cytometry and rare event analysis. Int J Lab Hematol. 2013;35(3):344–350. | ||
Canonico B, Zamai L, Burattini S, et al. Evaluation of leukocyte stabilisation in TransFix-treated blood samples by flow cytometry and transmission electron microscopy. J Immunol Methods. 2004;295(1–2):67–78. | ||
Wierzbowska A, Robak T, Krawczyńska A, et al. Circulating endothelial cells in patients with acute myeloid leukemia. Eur J Haematol. 2005;75(6):492–497. | ||
Zahran AM, Aly SS, Altayeb HA, Ali AM. Circulating endothelial cells and their progenitors in acute myeloid leukemia. Oncol Lett. 2016;12(3):1965–1970. | ||
Van Craenenbroeck EM, Conraads VM, Van Bockstaele DR, et al. Quantification of circulating endothelial progenitor cells: a methodological comparison of six flow cytometric approaches. J Immunol Methods. 2008;332(1–2):31–40. | ||
Masouleh BK, Baraniskin A, Schmiegel W, Schroers R. Quantification of circulating endothelial progenitor cells in human peripheral blood: establishing a reliable flow cytometry protocol. J Immunol Methods. 2010;357(1–2):38–42. | ||
Flores-Nascimento MC, Alessio AM, de Andrade Orsi FL, Annichino-Bizzacchi JM. CD144, CD146 and VEGFR-2 properly identify circulating endothelial cell. Rev Bras Hematol Hemoter. 2015;37(2):98–102. | ||
Nicholson JK, Green TA. Selection of anticoagulants for lymphocyte immunophenotyping. Effect of specimen age on results. J Immunol Methods. 1993;165(1):31–35. | ||
Jamsa J, Huotari V, Savolainen ER, Syrjala H, Ala-Kokko T. Analysis of the temperature affects on leukocyte surface antigen expression. J Clin Lab Anal. 2011;25(2):118–125. | ||
Barnett D, Janossy G, Lubenko A, Matutes E, Newland A, Reilly JT. Guideline for the flow cytometric enumeration of CD34+ haematopoietic stem cells. Prepared by the CD34+ haematopoietic stem cell working party. General Haematology Task Force of the British Committee for Standards in Haematology. Clin Lab Haematol. 1999;21(5):301–308. | ||
Cui YX, Johnson T, Baumbach A, et al. Stepwise optimization of the procedure for assessment of circulating progenitor cells in patients with myocardial infarction. PLoS One. 2012;7:e30389. | ||
Ronzoni M, Manzoni M, Mariucci S, et al. Circulating endothelial cells and endothelial progenitors as predictive markers of clinical response to bevacizumab-based first-line treatment in advanced colorectal cancer patients. Ann Oncol. 2010;21(12):2382–2389. | ||
Calleri A, Bono A, Bagnardi V, et al. Predictive potential of angiogenic growth factors and circulating endothelial cells in breast cancer patients receiving metronomic chemotherapy plus bevacizumab. Clin Cancer Res. 2009;15(24):7652–7657. | ||
Van Craenenbroeck EM, Van Craenenbroeck AH, van Ierssel S, et al. Quantification of circulating CD34+/KDR+/CD45dim endothelial progenitor cells: analytical considerations. Int J Cardiol. 2013;167(5)1688–1695. | ||
Fadini GP, Losordo D, Dimmeler S. Critical reevaluation of endothelial progenitor cell phenotypes for therapeutic and diagnostic use. Circ Res. 2012;110(4):624–637. | ||
Fadini GP, Albiero M, Boscaro E, Agostini C, Avogaro A. Endothelial progenitor cells as resident accessory cells for post-ischemic angiogenesis. Atherosclerosis. 2009;204:20–22. | ||
Gruenwald V, Beutel G, Schuch-Jantsch S, et al. Circulating endothelial cells are an early predictor in renal cell carcinoma for tumor response to sunitinib. BMC Cancer. 2010;10:695. | ||
Wong CK, Namdarian B, Chua J, et al. Reply: on the clinical relevance of circulating endothelial cells and platelets in prostate cancer. Br J Cancer. 2013;108(6):1388. | ||
Wong CK, Namdarian B, Chua J, et al. Levels of a subpopulation of platelets, but not circulating endothelial cells, predict early treatment failure in prostate cancer patients after prostatectomy. Br J Cancer. 2012;107(9):1564–1573. | ||
Mancuso P, Calleri A, Gregato G, et al. A subpopulation of circulating endothelial cells express CD109 and is enriched in the blood of cancer patients. PLoS One. 2014;9:e114713. | ||
St Croix B, Rago C, Velculescu V, et al. Genes expressed in human tumor endothelium. Science. 2000;289(5482):1197–1202. | ||
Smirnov DA, Foulk BW, Doyle GV, Connelly MC, Terstappen LW, O’Hara SM. Global gene expression profiling of circulating endothelial cells in patients with metastatic carcinomas. Cancer Res. 2006;66(6):2918–2922. | ||
Kraan J, van den Broek P1, Verhoef C, et al. Endothelial CD276 (B7-H3) expression is increased in human malignancies and distinguishes between normal and tumour-derived circulating endothelial cells. Br J Cancer. 2014;111(1):149–156. | ||
Mehran R, Nilsson M, Khajavi M, et al. Tumor endothelial markers define novel subsets of cancer-specific circulating endothelial cells associated with antitumor efficacy. Cancer Res. 2014;74(10):2731–2741. | ||
Jin H, Cheng X, Pei Y, et al. Identification and verification of transgelin-2 as a potential biomarker of tumor-derived lung-cancer endothelial cells by comparative proteomics. J Proteomics. 2016;136:77–88. | ||
Rigolin GM, Maffei R, Rizzotto L, et al. Circulating endothelial cells in patients with chronic lymphocytic leukemia: clinical-prognostic and biologic significance. Cancer. 2010;116(8):1926–1937. | ||
Gora-Tybor J, Jamroziak K, Szmigielska-Kaplon A, et al. Evaluation of circulating endothelial cells as noninvasive marker of angiogenesis in patients with chronic lymphocytic leukemia. Leuk Lymphoma. 2009;50(1):62–67. | ||
Godoy CR, Levy D, Giampaoli V, et al. Circulating endothelial cells are increased in chronic myeloid leukemia blast crisis. Braz J Med Biol Res. 2015;48:509–14. |
Supplementary materials
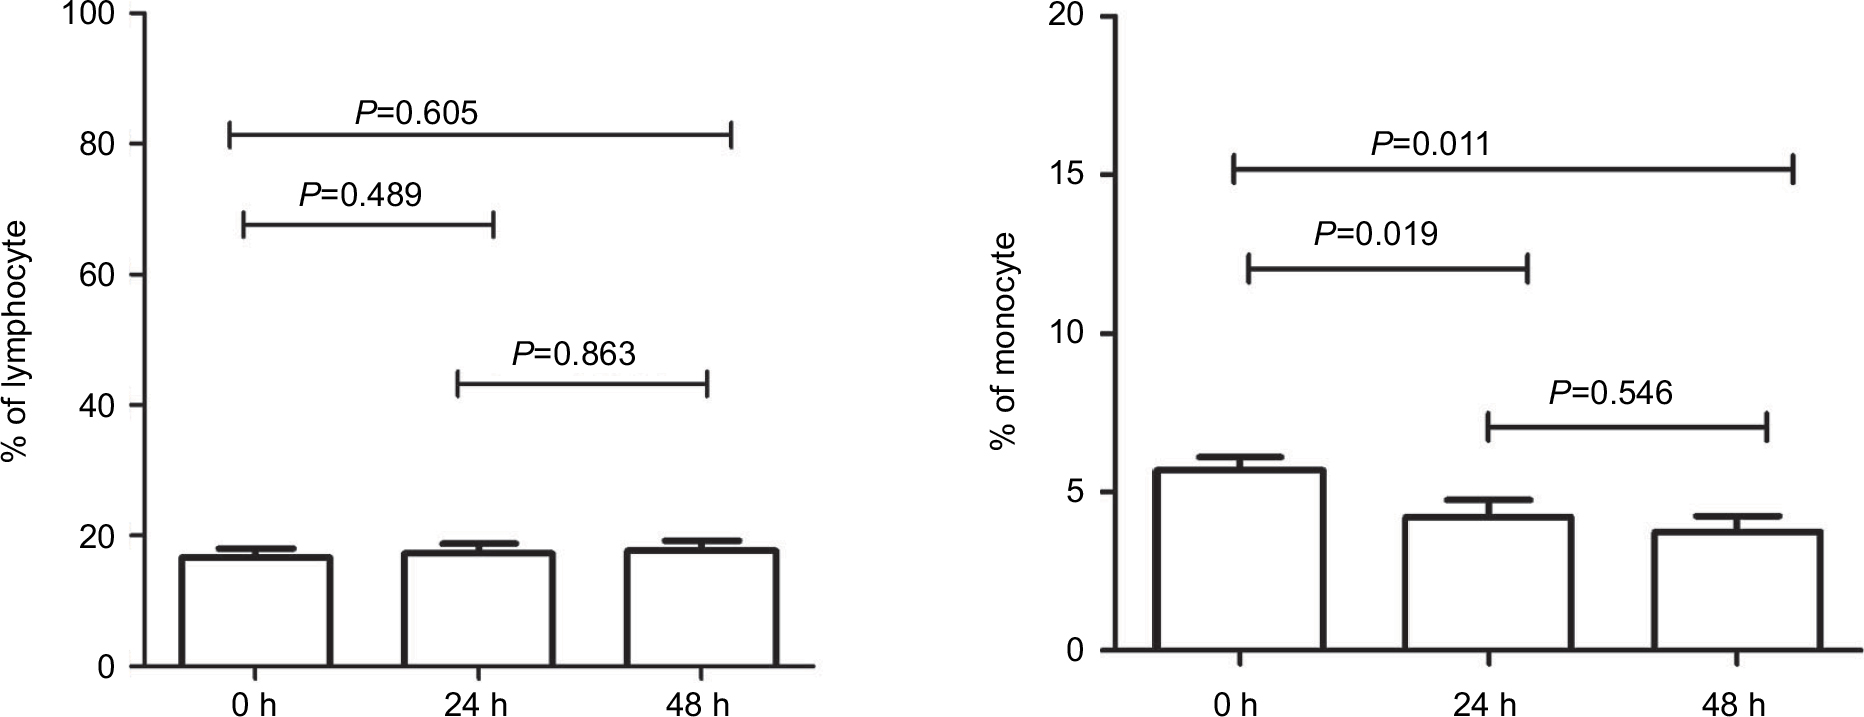 | Figure S1 Comparison of the percentages of lymphocytes and monocytes at 0, 24, and 48 h. |
 | Figure S2 Stability analysis of CECs and their subpopulations after storage for 0, 24, and 48 h. Wilcoxon test was used to analyze data. Abbreviations: aCECs, activated CECs; CECs, circulating endothelial cells; EPC, endothelial progenitor cells; mCECs, mature CECs; rCECs, resting CECs. |
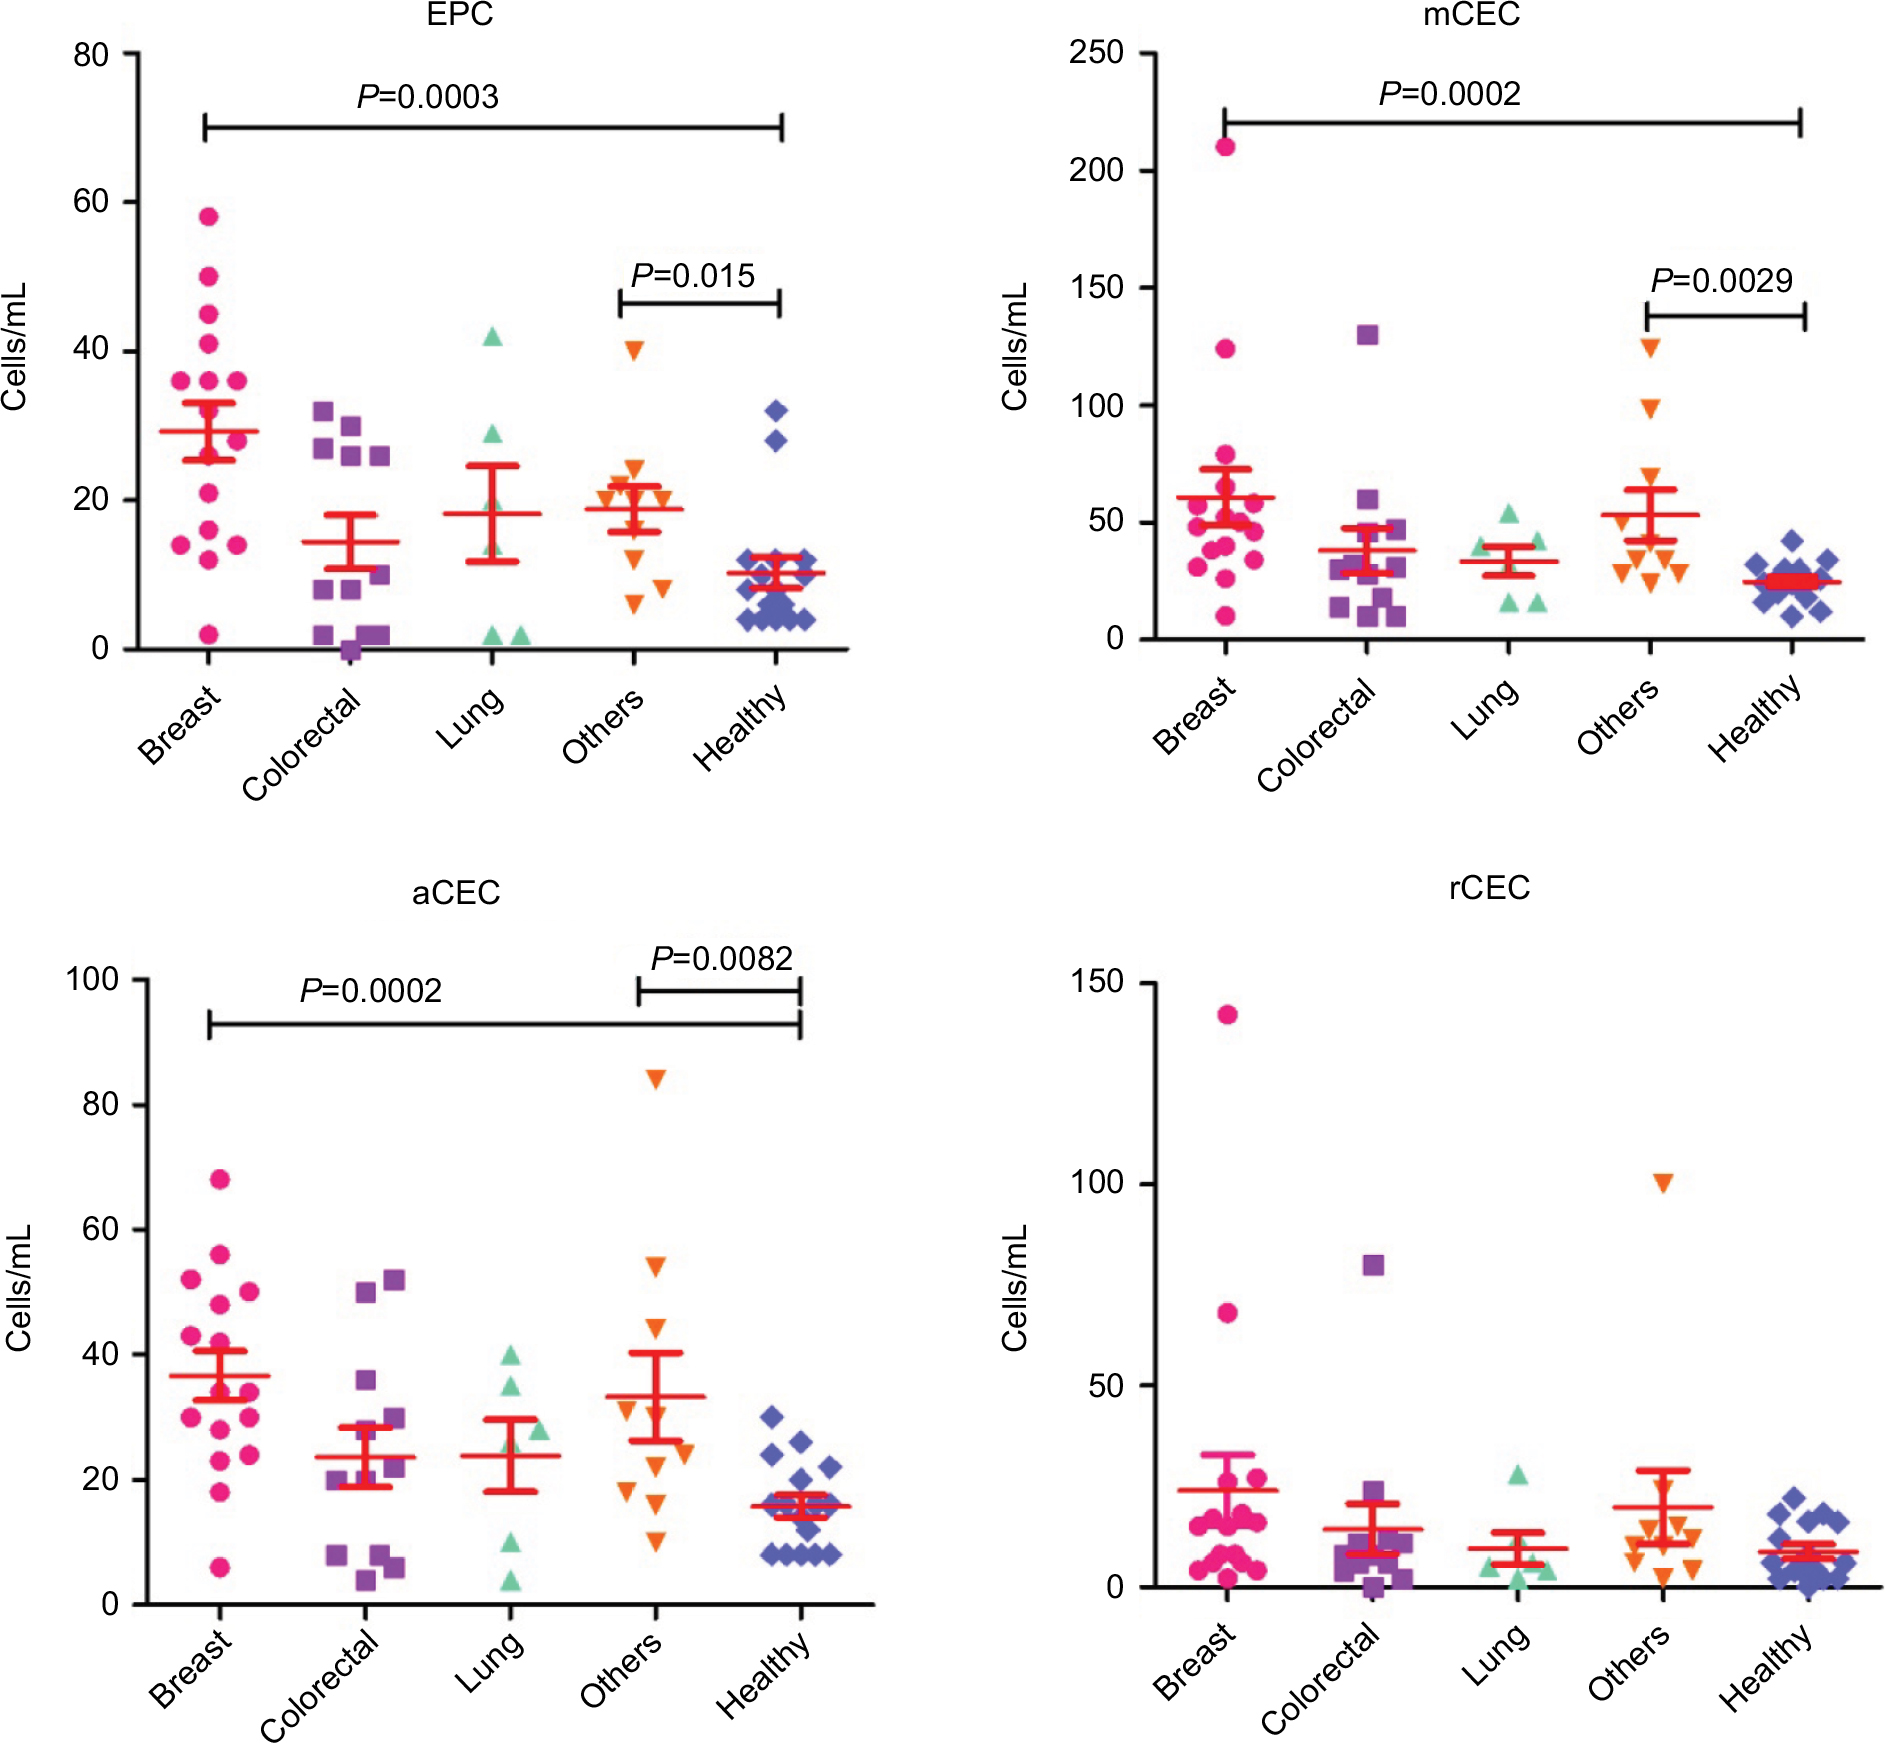 | Figure S3 Comparison of the variations of CECs and their subpopulations between different cancer types. Abbreviations: aCECs, activated CECs; CECs, circulating endothelial cells; EPC, endothelial progenitor cells; mCECs, mature CECs; rCECs, resting CECs. |
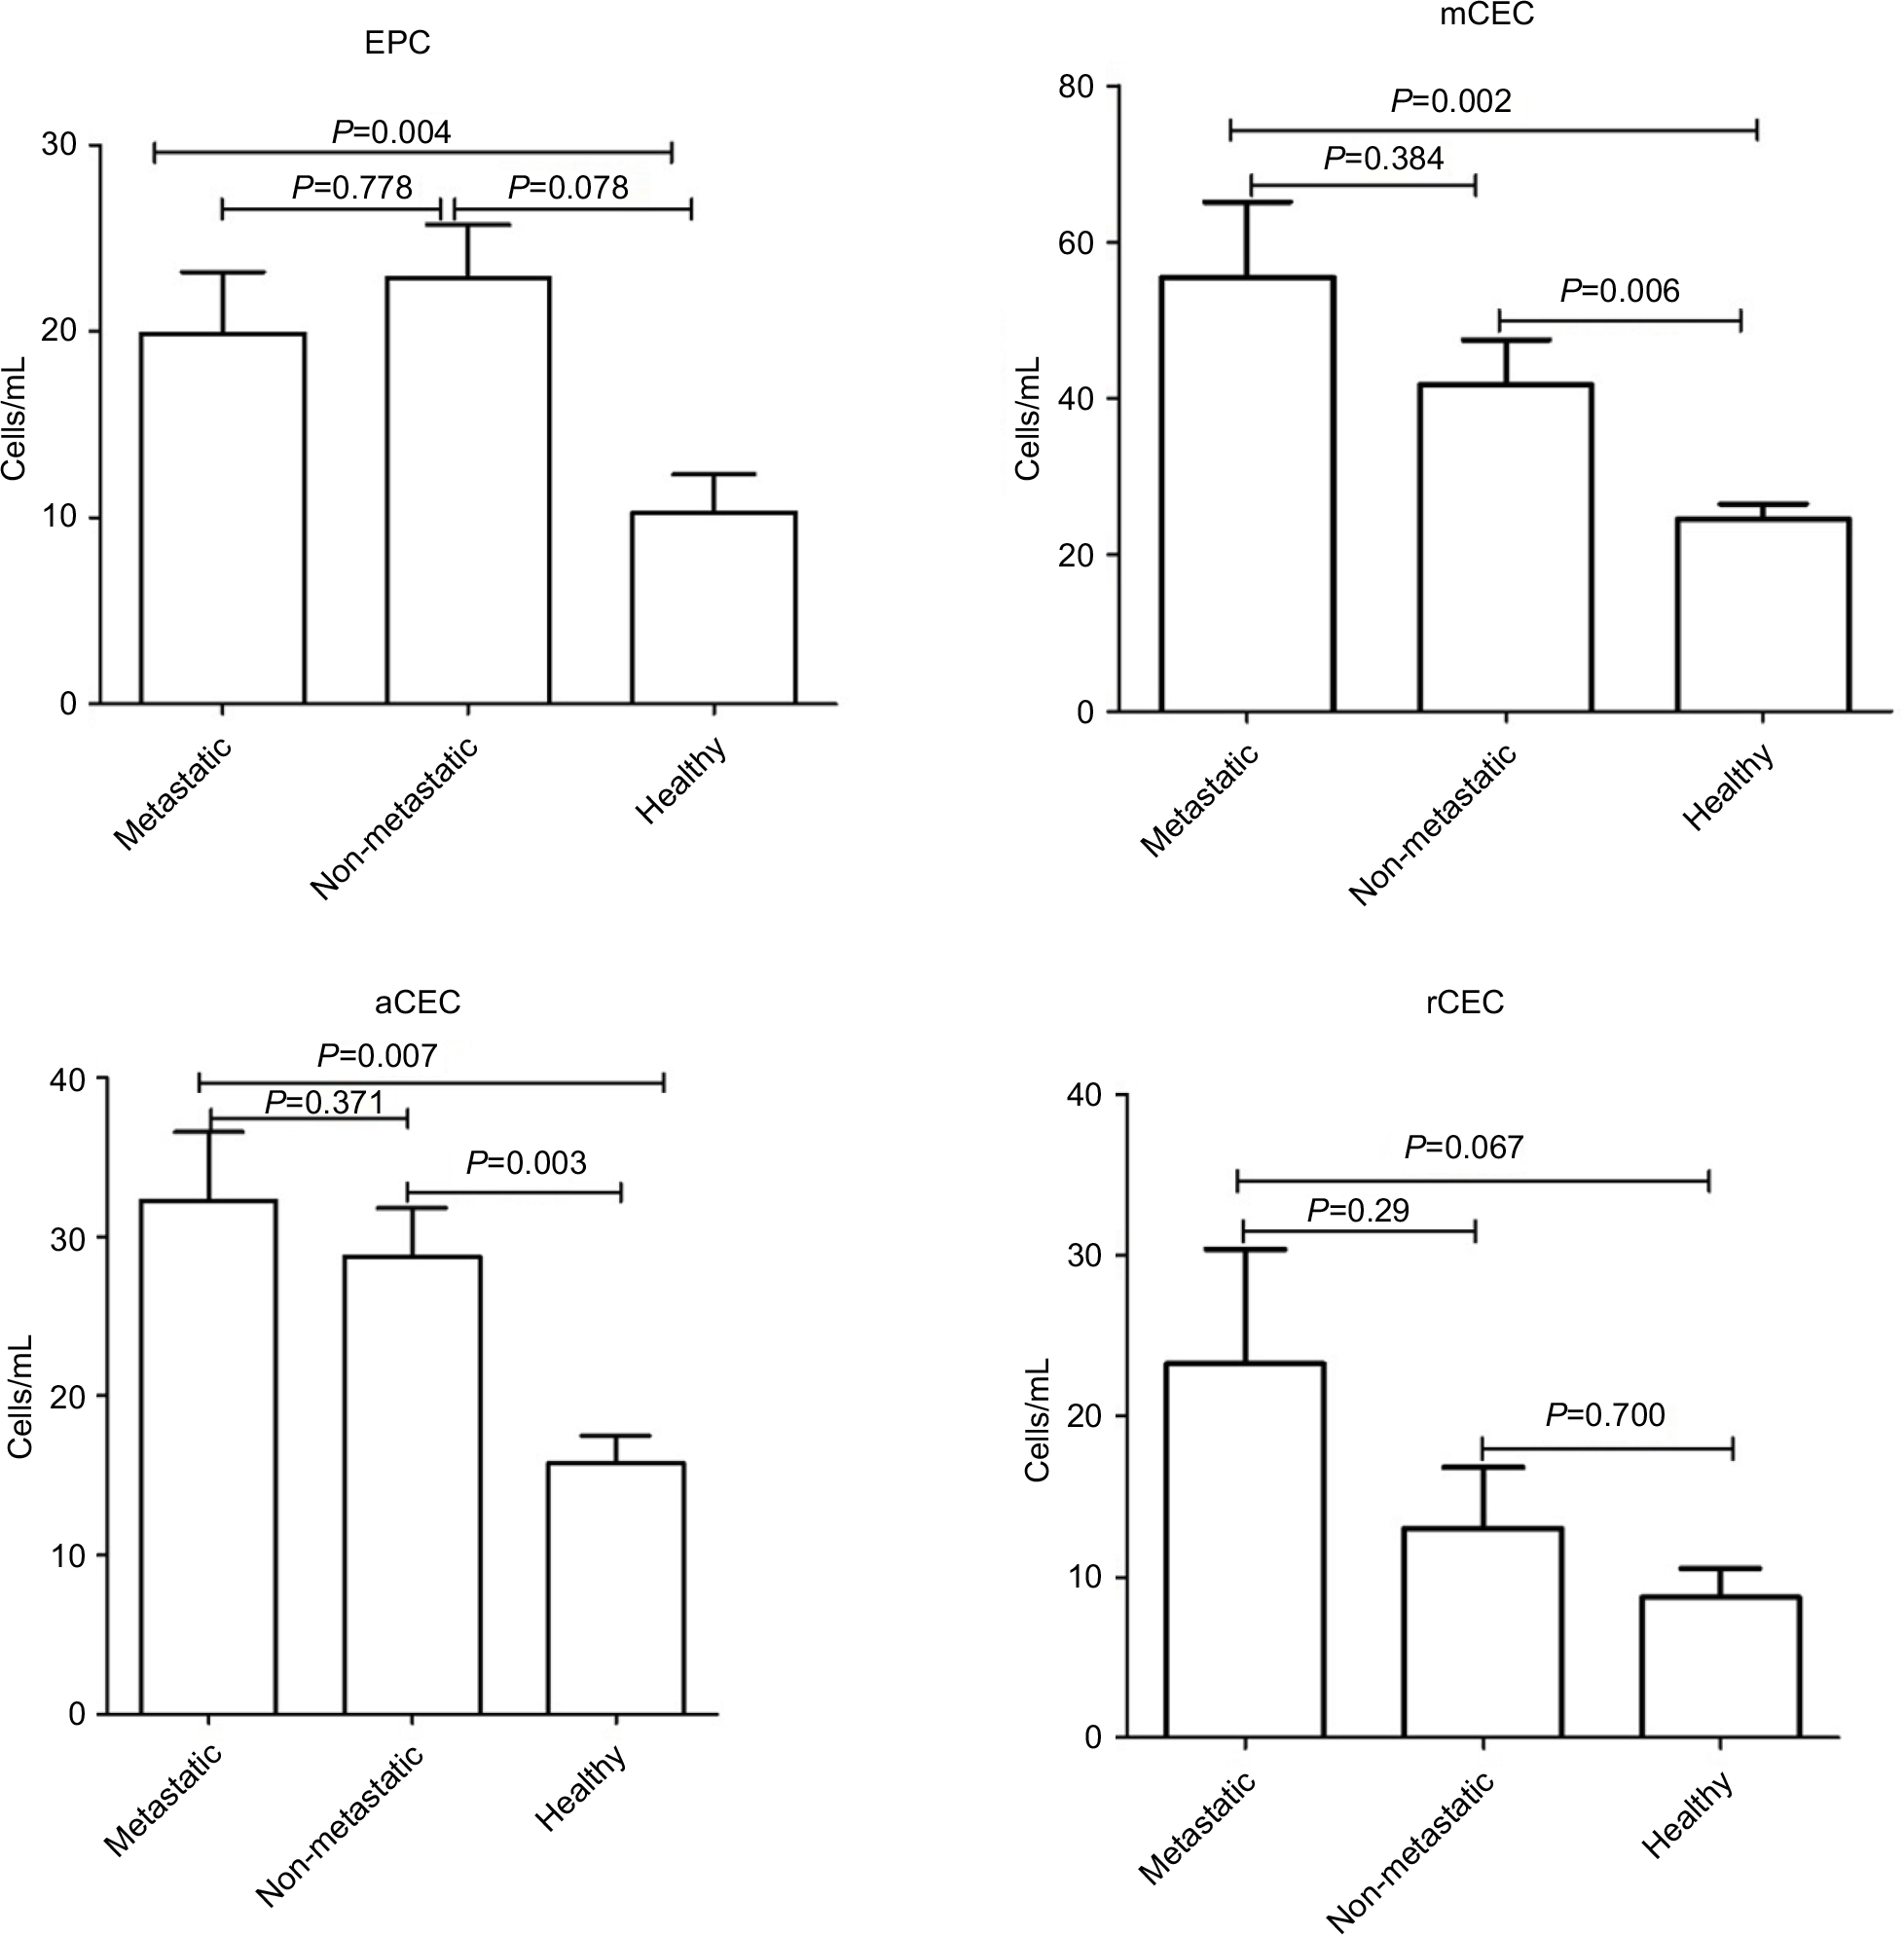 | Figure S4 Comparison of the differences in CECs and their subpopulations at different stages of cancer. Abbreviations: aCECs, activated CECs; CECs, circulating endothelial cells; EPC, endothelial progenitor cells; mCECs, mature CECs; rCECs, resting CECs. |
 © 2018 The Author(s). This work is published and licensed by Dove Medical Press Limited. The full terms of this license are available at https://www.dovepress.com/terms.php and incorporate the Creative Commons Attribution - Non Commercial (unported, v3.0) License.
By accessing the work you hereby accept the Terms. Non-commercial uses of the work are permitted without any further permission from Dove Medical Press Limited, provided the work is properly attributed. For permission for commercial use of this work, please see paragraphs 4.2 and 5 of our Terms.
© 2018 The Author(s). This work is published and licensed by Dove Medical Press Limited. The full terms of this license are available at https://www.dovepress.com/terms.php and incorporate the Creative Commons Attribution - Non Commercial (unported, v3.0) License.
By accessing the work you hereby accept the Terms. Non-commercial uses of the work are permitted without any further permission from Dove Medical Press Limited, provided the work is properly attributed. For permission for commercial use of this work, please see paragraphs 4.2 and 5 of our Terms.