Back to Journals » Therapeutics and Clinical Risk Management » Volume 17
Optimized Machine Learning Models to Predict In-Hospital Mortality for Patients with ST-Segment Elevation Myocardial Infarction
Authors Zhao J, Zhao P, Li C, Hou Y
Received 25 May 2021
Accepted for publication 26 August 2021
Published 4 September 2021 Volume 2021:17 Pages 951—961
DOI https://doi.org/10.2147/TCRM.S321799
Checked for plagiarism Yes
Review by Single anonymous peer review
Peer reviewer comments 2
Editor who approved publication: Professor De Yun Wang
Jia Zhao,1,2 Pengyu Zhao,3 Chunjie Li,2 Yonghong Hou3
1Graduate School, Tianjin Medical University, Tianjin, 300070, People’s Republic of China; 2Department of Cardiology, Tianjin Chest Hospital, Tianjin, 300222, People’s Republic of China; 3School of Electrical and Information Engineering, Tianjin University, Tianjin, 300072, People’s Republic of China
Correspondence: Chunjie Li; Yonghong Hou Tel +86(022)88185135
Fax +86(022)88185338
Email [email protected]; [email protected]
Purpose: This study aimed to optimize machine learning (ML) models for predicting in-hospital mortality in patients with ST-segment elevation acute myocardial infarction (STEMI).
Patients and Methods: A total of 5708 STEMI patients were enrolled and divided into two groups according to patients’ hospital outcomes. Both groups were randomly split into a training set (75%) and a testing set (25%). Four ML models were trained with data, which applied random under-sampling (RUS). The performance of optimized ML models was evaluated with respect to accuracy, sensitivity, specificity, G-mean and AUC. Two sets of features in chronological order were considered: a full set that included all variables during hospitalization and a simplified set that only included variables prior to reperfusion therapy, and the performance of the prediction models trained with these two sets of features was compared.
Results: For the comprehensive metric – G-mean, the models trained with RUS outperformed those without, 80.54% vs 23.31% on average in the full set and 75.72% vs 35.76% on average in the simplified set. For models trained with the full set, the SVM achieved the best performance with 85.62% accuracy, 84.21% sensitivity, 85.66% specificity, 84.93% G-mean and 0.919 AUC. For models trained with the simplified set, the SVM achieved 83.48% G-mean, which was comparable to the models trained using the full set. For the most critical metric – sensitivity, the SVM trained using the simplified set achieved 89.47%, which even exceed the SVM (84.21%), DT (81.58%) and RF (81.58%) trained using the full set.
Conclusion: Applying RUS can improve the performance of prediction models, and the models trained with simplified set, which only included variables prior to reperfusion therapy can accurately predict high-risk patients.
Keywords: STEMI, in-hospital mortality, prediction model, optimized machine learning algorithm, random under-sampling
Introduction
As a well-known dangerous disease, acute myocardial infarction (AMI) is the leading cause of global morbidity and mortality.1–4 AMI is traditionally classified as ST-segment (STEMI) or non-ST-segment elevation myocardial infarction (NSTEMI) based on electrocardiography (ECG) characteristics.5 Compared with NSTEMI patients, STEMI patients suffer from a higher risk of short-term mortality.6 Clinical guidelines for the treatment of STEMI patients recommend an invasive strategy with cardiac catheterization, revascularization when clinically appropriate, and thrombolysis.7 Especially for high-risk patients, more-aggressive interventional and pharmacologic therapy should be targeted. However, physicians tend to adopt non-invasive treatment strategies rather than aggressive treatment strategies in clinical practice (the “treatment-risk paradox”).8 To alleviate this problem, risk assessment is applied to clinical practice as an effective method. Clinically, the most commonly used risk assessment tools are the Thrombolysis in Myocardial Infarction (TIMI) risk score and the Global Registry of Acute Coronary Events (GRACE) risk score.9–11 However, the selected population of the GRACE risk score includes STEMI and NSTEMI patients. Therefore, it is not a model targeting at STEMI patients.10 Although the selected population for the TIMI risk score is STEMI patients, thrombolytic therapy is the main treatment strategy for the enrolled patients,9 while percutaneous coronary intervention (PCI) is the main treatment strategy for STEMI patients in China.12 Therefore, the TIMI risk score might be inadequate for current clinical practice. Furthermore, the TIMI risk score requires the history of diabetes, hypertension or angina.9 However, among hypertensive patients, only 42.6% are aware of their high blood pressure.13 In summary, existing tools are far from perfect. It is necessary to develop new risk prediction models using a dataset that can represent the real world.
The blossom of artificial intelligence (AI), such as machine learning, has provided a possible solution to this unmet need. In recent years, many ML models have been successfully applied to cardiovascular field.14 In Al-Zaiti et al,15 an ML model using 554 temporal-spatial features of the 12-lead ECG to predict underlying acute myocardial ischemia in patients with chest pain has been developed. It achieves 76% specificity and 77% sensitivity, exceeding commercial interpretation software (25%) and experienced clinicians (40%).15 In Ragunath et al,16 a deep neural network (DNN) has been developed to predict 1-year all-cause mortality by using ECG voltage–time traces. It achieves an area under the curve (AUC) of 0.88 on a held-out test set, which includes 168,914 patients and 14,207 events occurred.16 However, ECG cannot fully reflect the clinical situation of patients, a number of models based on laboratory and clinical features were developed. In Kwon et al,17 the performance of six typical ML models in predicting the 1-year mortality rate of anterior ST-segment elevation myocardial infarction patients was compared.2 It shows that the XGBoost performs best (92% accuracy, 99% specificity, 0.74 f1 score and 0.942 AUC); however, the sensitivity is only 60%. Another research developed a deep-learning-based risk stratification for the mortality of patients with AMI (DAMI).17 It achieved an AUC of 0.905 in predicting the in-hospital mortality of STEMI patients. However, the key performance metric-sensitivity that reflects the model’s capability to identify high-risk patients is not reported. Furthermore, researches have shown that the sensitivity is not high enough for some models with high AUC.18
To the best of our knowledge, existing models were trained with imbalanced data, that is there are far more negative samples (ie, survival patients) than positive samples (ie, dead patients), and the ratio is greater than 10:1. When trained with imbalanced data, ML models tend to predict the samples under test as the majority class.19 Consequently, many high-risk patients may be missed and cause disaster results. To mitigate the effect of data imbalance, two strategies are commonly used: cost-sensitive learning and data preprocessing. The latter is preferred as it is easy to implement. Among data preprocessing, the most versatile and effective method is random under-sampling (RUS), which involves the random elimination of majority class examples.20 In this study, we applied RUS to balance classes in the training data to improve the performance of models. Besides, existing models were trained either with full set of features containing all variables during hospitalization or simplified set of features selected by feature importance ranking. However, some high-ranking features may not be obtained prior to reperfusion therapy, which means the existing models were not able to make predictions at the time of initial evaluation and treatment. In this work, a simplified set of features which only included variables prior to reperfusion therapy was proposed, and models using these variables to predict high-risk patients were explored.
The aims of this work lied in 1) to propose a dataset that can represent the real-world STEMI patients, 2) to apply RUS to optimize prediction models, 3) to develop models that can predict high-risk patients at the time of initial evaluation and treatment.
Materials and Methods
This study was conducted with a hospital-based dataset. We consecutively enrolled 5708 STEMI patients in Tianjin Chest Hospital from January 2015 to April 2020. The enrollment criteria for patients are as follows: 1) persistent chest discomfort or other symptoms suggestive of ischemia; 2) ST-segment elevation (≥0.1 mV) in at least two contiguous leads; 3) an elevation of cardiac troponin values with at least one value above the 99th percentile upper reference limit.7 To be noted, some of the enrollment patients complicated with atrial fibrillation whose pulse rate was less than heart rate. The categories of patient data collection included demographics, presentation characteristics, admission pathway, treatment and hospital outcomes.
Since the cardiac function of STEMI patients often changes in short term, we selected two indicators to evaluate the cardiac function of patients. One was direct Killip classification, which was evaluated immediately after entering the emergency room, and the other was heart failure, which included Killip classification II/III/IV and was evaluated again before reperfusion therapy.
Categorical variables were reported as counts and percentages. Chi-squared test was used to evaluate the differences in categorical variables between groups. For continuous variables, the Kolmogorov–Smirnov test was used to test the normality of distribution. We utilized the mean ± standard deviation (SD) to present the normally distributed variables, while the median and interquartile ranges (IQR) to present the variables whose distributions were not normal. Mann–Whitney-U test was used to evaluate the differences in continuous variables between groups. All the tests were two-tailed.
In this study, the entire data were divided into survival groups and death groups according to patients’ hospital outcomes. Both groups were randomly split into a training set (75%) and a testing set (25%). The models were optimized with the training set only, using 10-fold Cross-Validation. In this process, the training set was divided into 10 parts, and each of these parts was used to train models and evaluate their performance. The performance of the final models was evaluated on the testing set, which was not used for training process at all. Besides, we considered two sets of features in chronological order: a full set and a simplified set. The full set contained all variables during hospitalization, while the simplified set contained only included variables prior to reperfusion therapy. The variables used in both sets are shown in Table 1. Four commonly used ML models (logistic regression (LR), support vector machine (SVM), decision tree (DT), random forest (RF)) were selected to predict the mortality of STEMI patients, while RUS was applied as data preprocessing to optimize the models. Furthermore, to explore the possibility of developing models that could identify the high-risk patients at the time of initial evaluation and treatment, the performance of the predictive models trained using simplified set is evaluated.
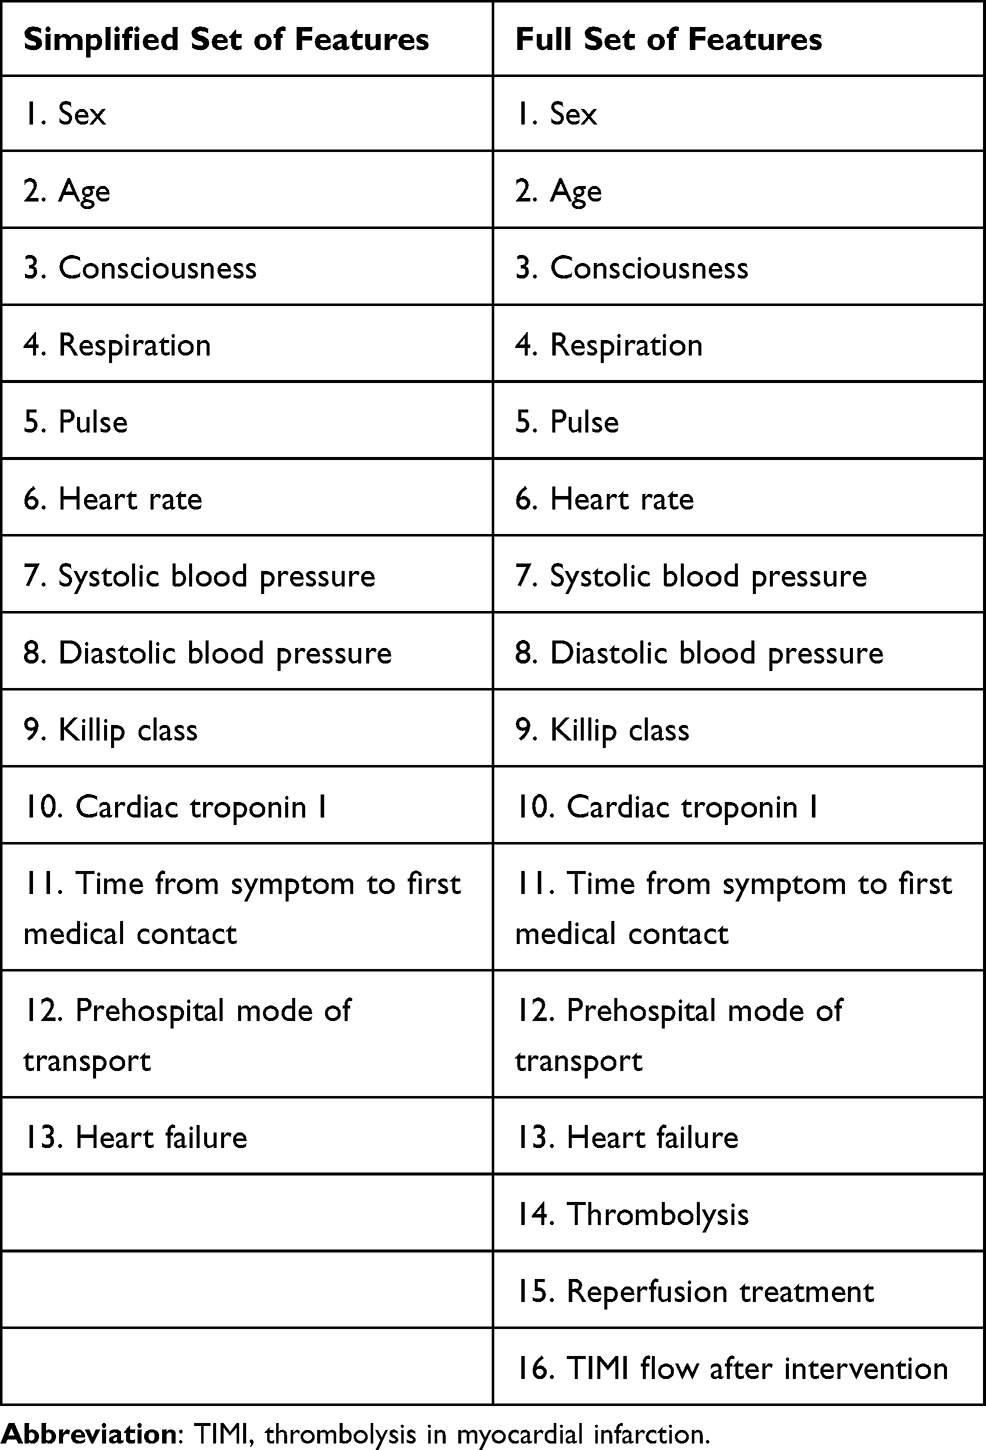 |
Table 1 Simplified Set and Full Set of Features |
The procedure for RUS was described as follows. First, the training set was split into majority class and minority class. Second, a number of samples in the majority class were removed randomly. The reduced majority class was then combined with the minority class, resulting in a balanced training set. Finally, the models were trained with the balanced training set.
The LR is a linear model that assumes a Bernoulli distribution of the outcome and a log-linear relationship with the predictors.21 LR predicts the binary response probability for the outcome class given the predictor values. In contrast with the three subsequent algorithms, LR lacks tuning parameters.
The SVM is a typical kernel-based supervised learning algorithm, and it aims to create a hyperplane among data points to maximize the classification interval. The kernel method enables us to model higher dimensional, non-linear models. In a non-linear problem, a kernel function can be used to add additional dimensions to the raw data and thus make it a linear problem in the resulting higher dimensional space. However, the choice of kernel function could greatly affect the performance of the SVM model.22 In this work, the optimal kernel function was selected by 10-fold cross-validation.
The DT is a supervised algorithm based on tree structure where each node indicates a feature, each branch represents decision rule and each leaf depicts an outcome. DT uses a divide-and-conquer algorithm to split a node into two sub-nodes, which is done with respect to outcome. On each iteration of the algorithm, it iterates the unused feature of the dataset and calculates entropy and information gain (IG) of this feature. The feature with highest IG forms the root node, which is partitioned into other sub-nodes and tested with another feature recursively until the leaf (outcome) is reached.23 However, a decision tree with full depth is vulnerable to overfitting. In this work, the optimal depth was determined by 10-fold cross-validation.
The RF is a supervised algorithm that constructs an ensemble of decision trees. Specifically, the RF combines bootstrap sampling of data for constructing each tree, and random selection of variables at each decision node, and finally majority voting on outcomes. The RF feature importance scores are determined by the Gini importance index. Specifically, the variable chosen as root split for many trees gets a higher Gini importance than a variable chosen less frequently or for descendant nodes.21 To be noted, the number of decision trees could greatly affect the performance of the RF model. In this work, the optimal number was determined by 10-fold cross-validation.
All descriptive statistics were performed using the SPASS software. The ML model selection, fitting and optimization were performed using Python (version 3.7) with the scientific libraries “scikit-learn”.
Four performance metrics: sensitivity, specificity, G-mean and AUC are used in this study. Sensitivity refers to the models’ ability to correctly identify high-risk patients, defined as
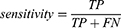
where TP is the number of true positives and FN is the number of false negatives.
Specificity reflects the models’ ability to correctly reject low-risk patients, defined as:
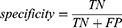
where TN is the number of true negatives and FP is the number of false positives.
The area under the curve (AUC) of the receiver operating characteristic curve (ROC) is used to evaluate the overall performance. However, some researches have shown that AUC could lead to an overoptimistic estimation of the algorithm’s performance in the case of highly skewed datasets.18 Therefore, G-mean is employed as performance metrics, defined as

Its key idea is to maximize the recognition of each of minority and majority classes while keeping these accuracies balanced.
Results
From January 2015 to April 2020, a total 5708 patients were included in our study, including 4198 men (73.55%) and 1510 women (26.45%). The median age of them was 63 years. In our study, 87.95% of them received reperfusion treatment and the main reperfusion strategy was primary PCI (77.73%). The overall in-hospital mortality rate was 2.70% (n = 154). The basic descriptive statistics and the differences between patients died and survived are summarized in Tables 2 and 3. The nonsurvivors were more likely to have lower systolic (SBP) and diastolic blood pressure (DBP), higher pulse, higher heart rate (HR), higher cardiac troponin I (cTnI), higher Killip classification and higher age. Compared with survivors, the nonsurvivors were mainly admitted through emergency medical services (EMS) or transferred from other hospitals, while had a lower proportion of reperfusion treatment. Besides, nonsurvivors experienced heart failure and unconscious more often, and the mortality was higher in women compared with men.
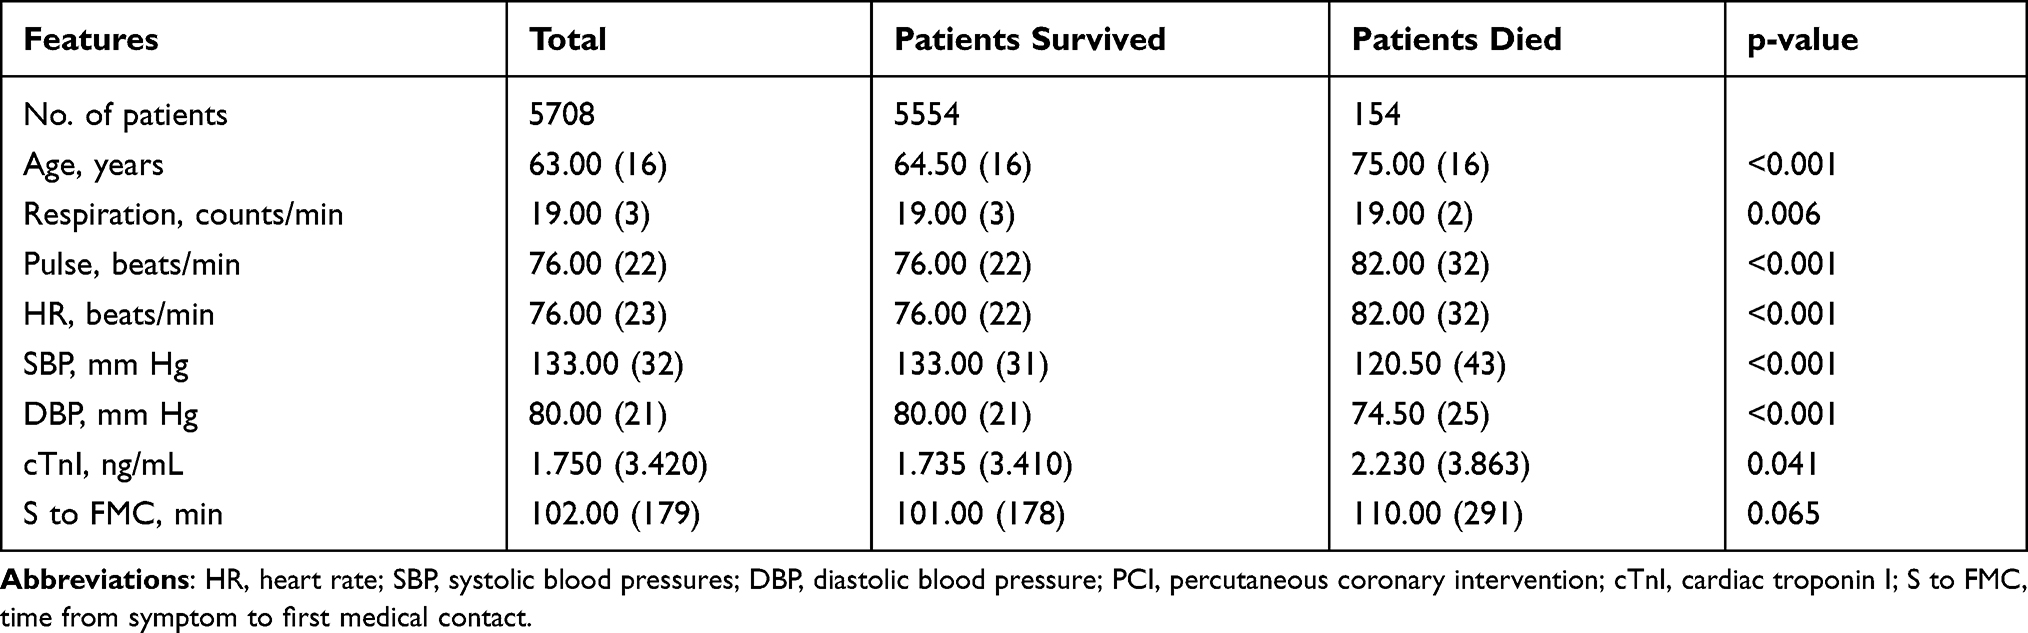 |
Table 2 Basic Characteristics of Continuous Numerical Variables |
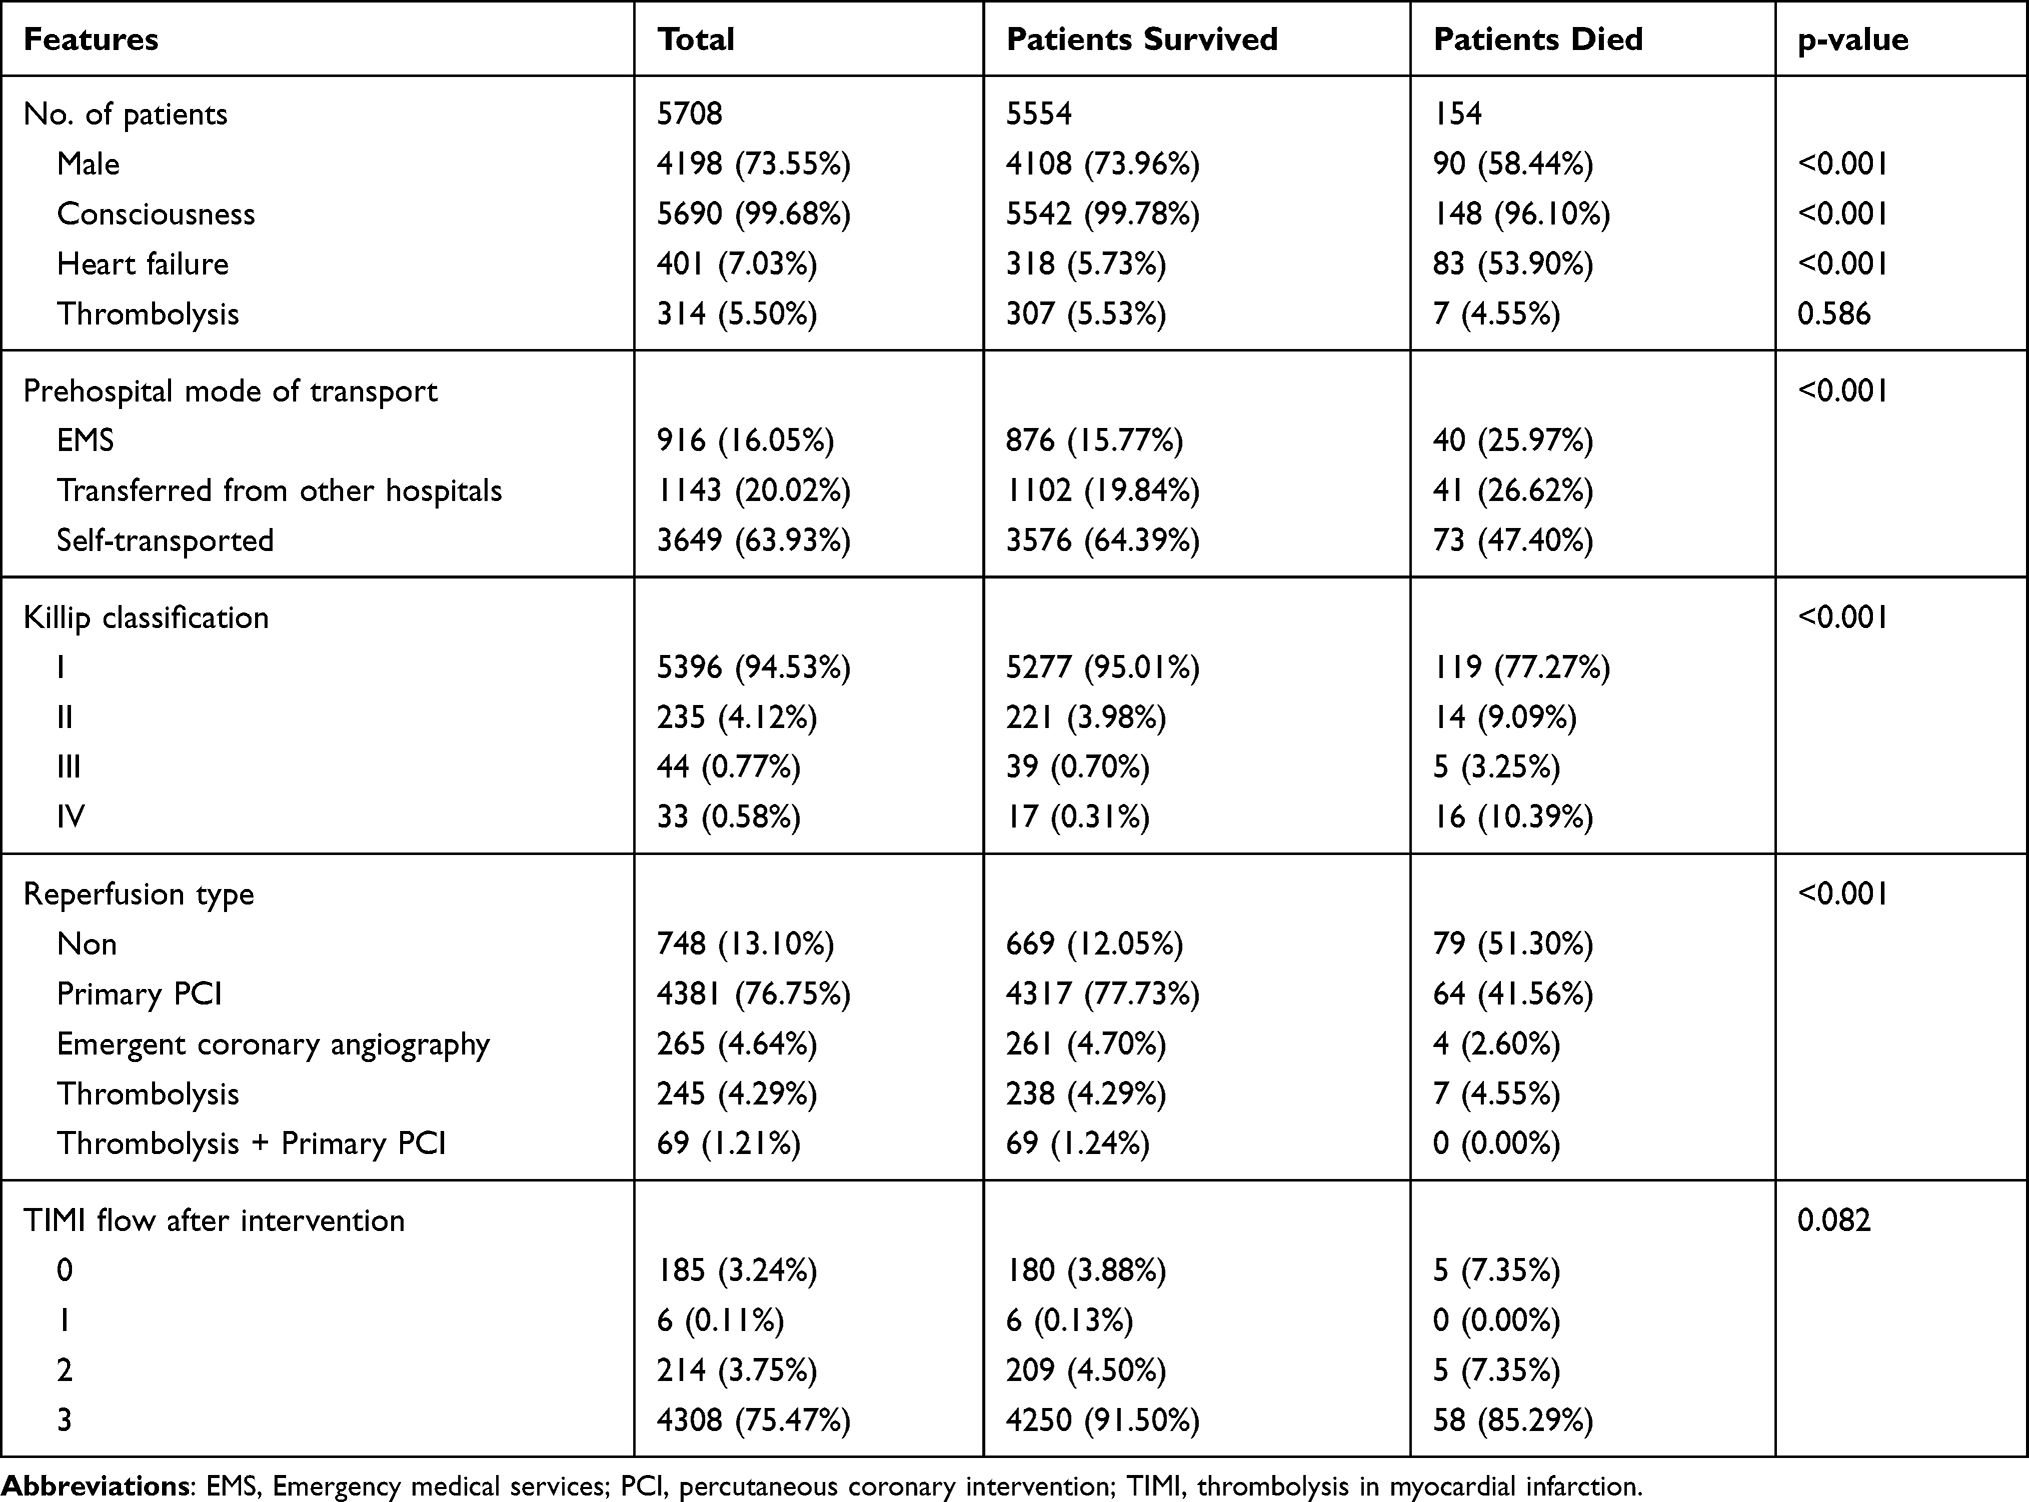 |
Table 3 Basic Characteristics of Categorical Variables |
The performance of the traditional and optimized ML models trained using the full set is shown in Table 4. Although the models trained without RUS had higher accuracy, 96.99% vs 77.35% on average, and higher specificity, 99.37% vs 77.16% on average, the sensitivity of them was extremely lower than models trained with RUS, 9.87% vs 84.21% on average. The AUC of the models trained with or without RUS did not have significant difference, 0.864 vs 0.841 on average and the ROC analysis results are presented in Figures 1 and 2. The G-mean of models trained with RUS was far higher than those without, 80.54% VS 23.31% on average. The SVM trained with RUS achieved the best performance in terms of G-mean (84.93%) and AUC (0.919). Specifically, it achieved 85.62% accuracy, 84.21% sensitivity, 85.66% specificity, and the confusion matrix is shown in Figure 3. It selected 32 out of 38 high-risk patients. Among the models trained without RUS, the SVM classifier also achieved best performance according to G-mean (45.52%). Specifically, it achieved 96.42% accuracy, 23.68% sensitivity, 98.41% specificity, and the confusion matrix is shown in Figure 4. It selected 9 out of 38 high-risk patients. The SVM trained with RUS selected 23 more high-risk patients than the SVM trained without RUS.
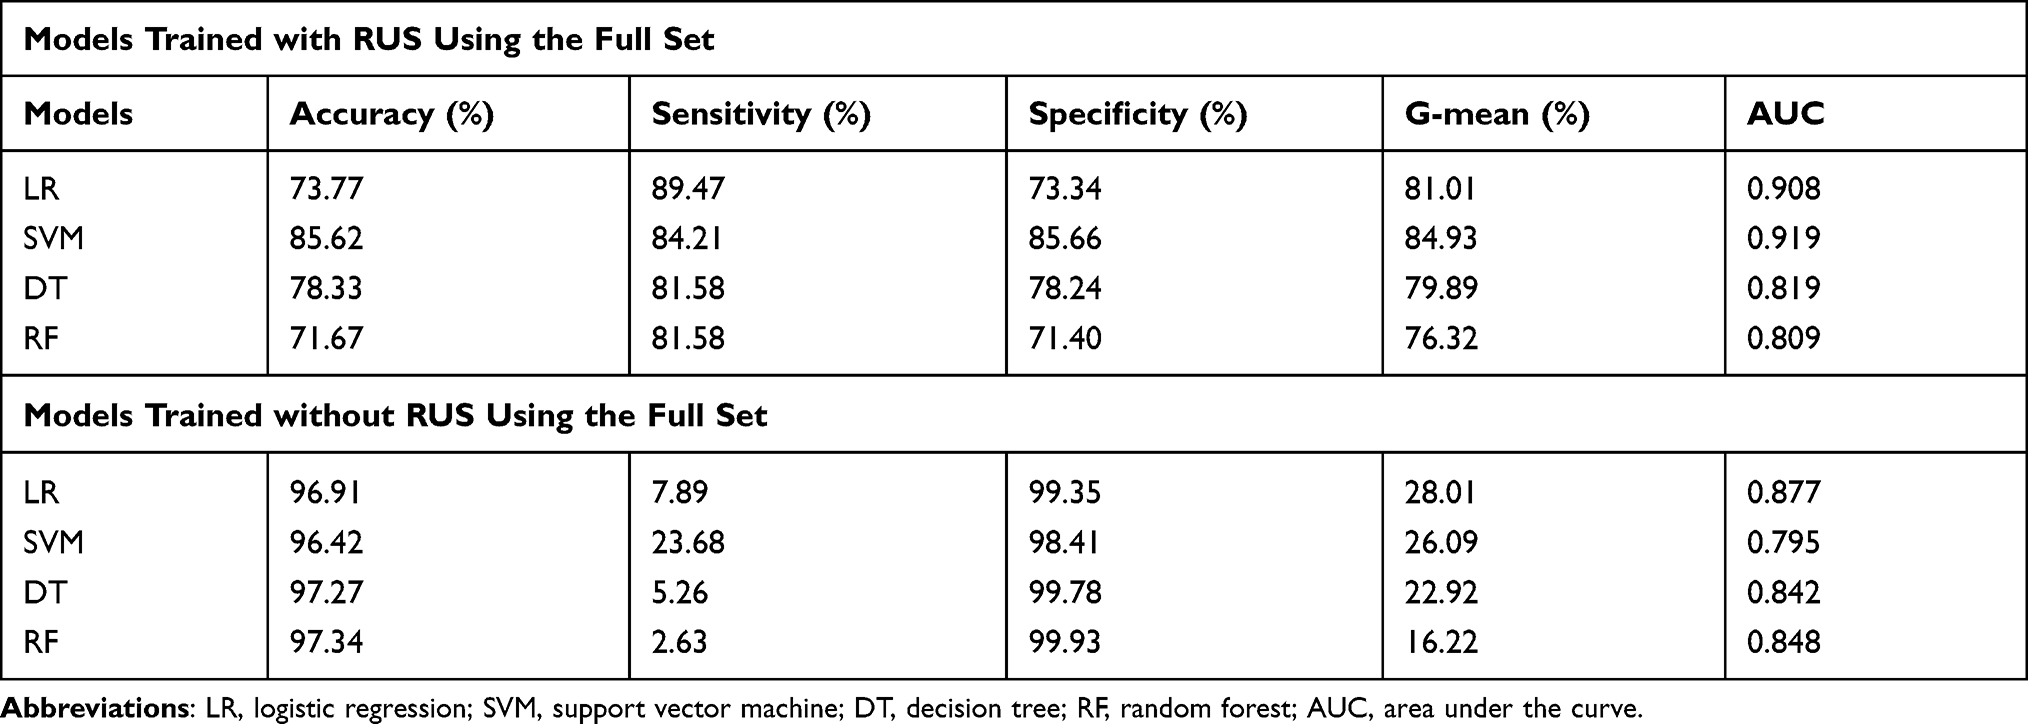 |
Table 4 Performance Comparison of the Traditional and Optimized ML Models Using the Full Set |
 |
Figure 1 ROC analysis results of models trained without RUS using the full set. Abbreviation: ROC curve, receiver operating characteristic curve. |
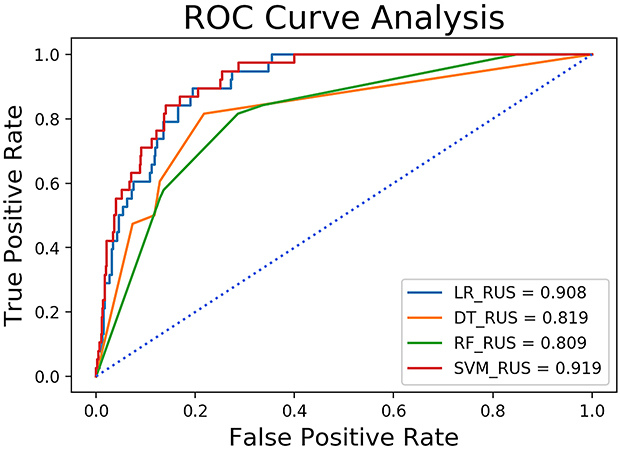 |
Figure 2 ROC analysis results of models trained with RUS using the full set. Abbreviation: ROC curve, receiver operating characteristic curve. |
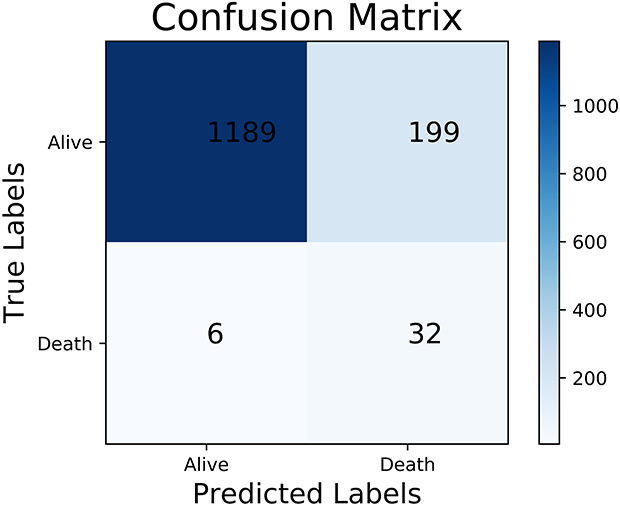 |
Figure 3 The confusion matrix of the SVM trained with RUS using the full set. Abbreviations: SVM, support vector machine; RUS, random under-sampling. |
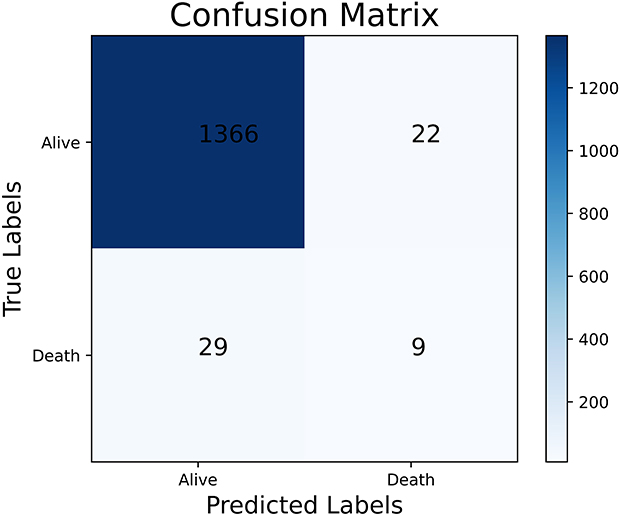 |
Figure 4 The confusion matrix of the SVM trained without RUS using the full set. Abbreviations: SVM, support vector machine; RUS, random under-sampling. |
The performance of the traditional and optimized ML models trained using the simplified set is shown in Table 5. The results were similar to those with the full set, the models trained with RUS had lower accuracy, 81.72% vs 96.79% on average, lower specificity, 82.61% vs 99.06% on average, higher sensitivity, 84.21% vs 9.87% on average, higher G-mean, 75.72% vs 35.76% on average and similar AUC, 0.753 vs 0.761 on average. As can be seen from Tables 4 and 5, the SVM trained with RUS using the simplified set achieved 83.48% G-mean, which was comparable to the models trained using the full set. For sensitivity, the SVM trained using the simplified set achieved 89.47%, which even exceeded the SVM (84.21%), DT (81.58%) and RF (81.58%) trained using the full set. The confusion matrix of the SVM trained with RUS using the simplified set is shown in Figure 5. It selected 34 out of 38 high-risk patients, which is 2 more than the SVM trained with RUS using the full set. Besides, the feature importance scores for predicting the in-hospital mortality were provided by the RF trained with RUS, as shown in Figure 6, where the cTnI had the highest importance score.
 |
Table 5 Performance Comparison of the Traditional and Optimized ML Models Using the Simplified Set |
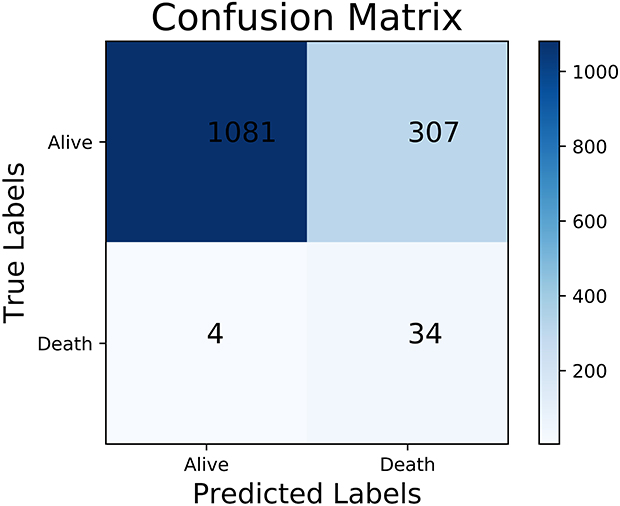 |
Figure 5 The confusion matrix of the SVM trained with RUS using the simplified set. Abbreviations: SVM, support vector machine; RUS, random under-sampling. |
 |
Figure 6 The feature importance scores for predicting the in-hospital mortality provided by the RF. Abbreviation: RF, random forest. |
Discussion
Although the mortality of the STEMI patients is high, the risk assessment tools widely used in clinical practice are far from perfect. With the thriving of ML, there were many researches that developed risk assessment models based on ML and the performance of their models is shown in Table 6.24–28 However, these models only focused on accuracy or AUC without reporting sensitivity and none of these researches dealt with the imbalanced data problem. When facing imbalanced scenarios, the models tended to predict the samples as majority class (survival patients) in order to maximize the accuracy, and the AUC would lead to an overoptimistic estimation of the models. Therefore, although these models had high accuracy or AUC, they might have low sensitivity. The sensitivity of prediction models is highly related to the prognosis of the patients. The models with low sensitivity tend to ignore the high-risk patients who require special attention, which would lead to an increased risk of death. For these reasons, we applied RUS to mitigate the effect of samples imbalance and used G-mean as another evaluation metrics.
 |
Table 6 Best Predictive Performance Results of the Models Developed by Other Articles |
The results showed that the overall performance of the models trained with RUS had been greatly improved. Whether in the full set or the simplified set, although the specificity of the models was slightly decreased, the sensitivity was greatly improved, which means more high-risk patients could be found. It is more important in clinical practice. However, there is little difference in the AUC of the models trained with or without RUS. It is obvious that AUC cannot reflect the performance of the models objectively. G-mean which takes both specificity and sensitivity into account can comprehensively evaluate the performance of models. The G-mean of the models trained with RUS was significantly higher than that of those without. This result further proved the effectiveness of RUS.
From a clinical perspective, the models trained using the full set of features have high sensitivity, they can identify high-risk patients accurately. In this way, those high-risk patients can be paid more attention after being escorted to the cardiac intensive care unit, which has an positive effect on reducing in-hospital mortality. Although the overall performance of the models trained using the features obtained prior to reperfusion therapy has been weakened compared with the models trained using the full set, the sensitivity is high enough to support the decision-making. According to the 2017 ESC Guidelines, the aggressive treatment strategies were recommended for high-risk patients. However, in clinical practice, the physicians and the relatives of patients tend to choose the non-invasive treatment due to overestimating the risk of reperfusion therapy and ignoring the risk of death from ischemia. It hinders delivery of effective care to the patients who need it most, leading to the mortality of a large number of high-risk patients (the “treatment-risk paradox”). The proposed models can identify high-risk patients at the time of initial evaluation, which allows the patients to receive reperfusion therapy in the early stage of myocardial infarction, decreasing the risk of therapy. Therefore, the proposed models can support the decision-making about intensive treatment for high-risk patients, which can improve treatment compliance.
The cTnI level was the most significant risk factor given by RF, and many studies29–31 have also reported that the level of cTnI has a high predictive value of the AMI patients’ outcome, which further demonstrates the reliability of our models. We believe that ML might better handle the correlation between the variables and RF is a particular expert in creating conditional relations. Moreover, our models were trained with a dataset that can reflect real-world STEMI patients and could give predictive results without medical history. Therefore, our models avoided collecting medical history, resulting in the improvement of usability.
However, our work still has the following two limitations: 1) Our work is a single-center study, only including the patients who were treated in Tianjin Chest Hospital. 2) It is inevitable that the patient enrollment and the data measurement are accompanied by bias. Nonetheless, the result of our study still provides an effective and robust method for predicting in-hospital mortality of STEMI patients.
Conclusion
Many medical problems are characterized by a highly imbalanced distribution of examples in classes. In this paper, we applied RUS to alleviate the effect of data imbalanced, which improved the performance of models. In the management of STEMI patients, the models trained using the full set of features can be applied to select high-risk patients after being escorted to the cardiac intensive care unit, and the models trained using the simplified set of features can be applied to assist physicians in choosing the optimal treatment. In summary, this study demonstrated the feasibility and effectiveness of the model with RUS, which can improve prognosis of patients.
Data Sharing Statement
The dataset used in this study is available in https://github.com/lab-540/STEMI-in-hospital-mortality
Ethics Approval and Consent to Participate
This study was conducted after the acquisition of written informed consent from the participating patients and upon the approval by the ethics committee of Tianjin Chest Hospital. The study protocol was approved by the local institutional review boards in accordance with the Declaration of Helsinki.
Acknowledgments
This study was funded by the National Key R&D Program of China (2016YFC1301100) and the Science and Technology Program Project of Jinnan District, Tianjin, China (2020111) . Besides, we thank professor Li Li for her consultation on data collection.
Disclosure
The authors report no conflicts of interest in this work.
References
1. Gaba P, Gersh BJ, Ali ZA, Moses JW, Stone GW. Complete versus incomplete coronary revascularization: definitions, assessment and outcomes. Nat Rev Cardiol. 2021;18(3):155–168. doi:10.1038/s41569-020-00457-5.
2. Li YM, Jiang LC, He JJ, Jia KY, Peng Y, Chen M. Machine learning to predict the 1-year mortality rate after acute anterior myocardial infarction in Chinese patients. Ther Clin Risk Manag. 2020;16:1–6. doi:10.2147/TCRM.S236498.
3. Roth GA, Johnson C, Abajobir A, et al. Global, regional, and national burden of cardiovascular diseases for 10 causes, 1990 to 2015. J Am Coll Cardiol. 2017;70(1):1–25. doi:10.1016/j.jacc.2017.04.052.
4. Reed GW, Rossi JE, Cannon CP. Acute myocardial infarction. Lancet. 2017;389(10065):197–210. doi:10.1016/S0140-6736(16)30677-8.
5. Chiesa M, Piacentini L, Bono E, et al. Whole blood transcriptome profile at hospital admission discriminates between patients with ST-segment elevation and non-ST-segment elevation acute myocardial infarction. Sci Rep. 2020;10(1):8731. doi:10.1038/s41598-020-65527-7.
6. Conti CR. Some issues related to STEMI and NSTEMI. Cardiovasc Innov Appl. 2020;4(4):287–289. doi:10.15212/CVIA.2019.0019.
7. Ibanez B, James S, Agewall S, et al. 2017 ESC Guidelines for the management of acute myocardial infarction in patients presenting with ST-segment elevation: the Task Force for the management of acute myocardial infarction in patients presenting with ST-segment elevation of the European Society of Cardiology (ESC). Eur Heart J. 2017;39(2):119–177.
8. Brooks JM, Chapman CG, Schroeder MC. Understanding treatment effect estimates when treatment effects are heterogeneous for more than one outcome. Appl Health Econ Health Policy. 2018;16(8):381–393. doi:10.1007/s40258-018-0380-z.
9. Morrow DA, Antman EM, Charlesworth A, et al. TIMI risk score for ST-elevation myocardial infarction: a convenient, bedside, clinical score for risk assessment at presentation: an intravenous nPA for treatment of infarcting myocardium early II trial substudy. Circulation. 2000;102(17):2031–2037. doi:10.1161/01.cir.102.17.2031.
10. Granger CB, Goldberg RJ, Dabbous O, et al. Global Registry of Acute Coronary Events Investigators. Predictors of hospital mortality in the global registry of acute coronary events. Arch Intern Med. 2003;163(19):2345–2353. doi:10.1001/archinte.163.19.2345.
11. Moraes PIM, Nicolau AM, Alves CMR, et al. GRACE and TIMI risk scores in hospitalized patients with ST-elevation acute myocardial infarction undergoing pharmaco invasive therapy: are they similar? Eur Heart J. 2017;38(suppl 1):1199. doi:10.1093/eurheartj/ehx493.P5581.
12. Zheng X, Curtis JP, Hu S, China PEACE Collaborative Group. Coronary catheterization and percutaneous coronary intervention in China: 10-year results from the China PEACE-Retrospective CathPCI Study. JAMA Intern Med. 2016;176(4):512–521. doi:10.1001/jamainternmed.2016.0166.
13. Wang J, Zhang L, Wang F; China National Survey of Chronic Kidney Disease Working Group. Prevalence, awareness, treatment, and control of hypertension in China: results from a national survey. Am J Hypertens. 2014;27(11):1355–1361. doi:10.1093/ajh/hpu053.
14. Itchhaporia D. Artificial intelligence in cardiology. Trends Cardiovasc Med. 2020. doi:10.1016/j.tcm.2020.11.007. Available from: https://www.sciencedirect.com/science/article/abs/pii/S1050173820301511. Accessed August 30, 2021.
15. Al-Zaiti S, Besomi L, Bouzid Z, et al. Machine learning-based prediction of acute coronary syndrome using only the pre-hospital 12-lead electrocardiogram. Nat Commun. 2020;11(1):3966. doi:10.1038/s41467-020-17804-2.
16. Raghunath S, Ulloa Cerna AE, Jing L, et al. Prediction of mortality from 12-lead electrocardiogram voltage data using a deep neural network. Nat Med. 2020;26(6):886–891. doi:10.1038/s41591-020-0870-z.
17. Kwon JM, Jeon KH, Kim HM, et al. Deep-learning-based risk stratification for mortality of patients with acute myocardial infarction. PLoS One. 2019;14(10):e0224502. doi:10.1371/journal.pone.0224502.
18. Stefanowski J. Overlapping, Rare Examples and Class Decomposition in Learning Classifiers from Imbalanced Data. In: Ramanna S, Jain LC, Howlett RJ, editors. Emerging Paradigms in Machine Learning. Berlin: Springer; 2013:277–306.
19. Guo HX, Li YJ, Shang J, Gu MY, Huang YY, Bing G. Learning from class-imbalanced data: review of methods and applications. Expert Systems Appl. 2017;73:220–239. doi:10.1016/j.eswa.2016.12.035.
20. Tahir MA, Kittler J, Mikolajczyk K, Yan F, editors. A Multiple Expert Approach to the Class Imbalance Problem Using Inverse Random under Sampling. 8th International Workshop on Multiple Classifier Systems. Univ Iceland, Reykjavik, ICELAND. Springer, Berlin, Heidelberg; 2009: 10–12. doi:10.1007/978-3-642-02326-2_9.
21. Wallert J, Tomasoni M, Madison G, Held C. Predicting two-year survival versus non-survival after first myocardial infarction using machine learning and Swedish national register data. BMC Med Inform Decis Mak. 2017;17(1):99. doi:10.1186/s12911-017-0500-y.
22. Huang S, Cai N, Pacheco PP, Narrandes S, Wang Y, Xu W. Applications of support vector machine (SVM) learning in cancer genomics. Cancer Genomics Proteomics. 2018;15(1):41–51. doi:10.21873/cgp.20063.
23. Kotsiantis SB. Decision trees: a recent overview. Artif Intell Rev. 2013;39(4):261–283. doi:10.1007/s10462-011-9272-4.
24. Bansal A, Kapadia S, Ellis S, et al. Machine learning techniques to predict in-hospital cardiovascular outcomes in elderly patients presenting with acute myocardial infarction. J Am Coll Cardiol. 2020;75(11 suppl 1):3603. doi:10.1016/S0735-1097(20)34230-3
25. Yakovlev A, Metsker O, Kovalchuk S, Bologova E. Prediction of in-hospital mortality and length of stay in acute coronary syndrome patients using machine-learning methods. J Am Coll Cardiol. 2018;71(11 suppl S):242. doi:10.1016/S0735-1097(18)30783-6.
26. Mansoor H, Bian J. Risk prediction for in-hospital mortality in women with ST-elevation myocardial infarction: a machine learning approach. J Am Coll Cardiol. 2017;69(11 suppl S):171. doi:10.1016/S0735-1097(17)33560-X
27. Yang JG, Li YX, Li X, Chen TG, Xie GT, Yang YJ. An explainable machine learning-based risk prediction model for in-hospital mortality for Chinese STEMI patients: findings from china myocardial infarction registry. J Am Coll Cardiol. 2019;73(9 suppl 1):261. doi:10.1016/S0735-1097(19)30869-1.
28. Yang JG, Li X, Chen T, Li YX, Xie GT, Yang YJ. Machine learning models to predict in-hospital mortality for ST-elevation myocardial infarction: from china acute myocardial infarction (cami) registry. J Am Coll Cardiol. 2018;71(11 suppl S):236. doi:10.1016/S0735-1097(18)30777-0.
29. Morrow DA, Cannon CP, Jesse RL, et al. National Academy of Clinical Biochemistry. National Academy of Clinical Biochemistry Laboratory Medicine Practice Guidelines: clinical characteristics and utilization of biochemical markers in acute coronary syndromes. Clin Chem. 2007;53(4):552–574. doi:10.1373/clinchem.2006.084194.
30. Shah ASV, Anand A, Strachan FE, et al. High-STEACS Investigators. High-sensitivity troponin in the evaluation of patients with suspected acute coronary syndrome: a stepped-wedge, cluster-randomised controlled trial. Lancet. 2018;392(10151):919–928. doi:10.1016/S0140-6736(18)31923-8.
31. Chin CW, Shah AS, McAllister DA, et al. High-sensitivity troponin I concentrations are a marker of an advanced hypertrophic response and adverse outcomes in patients with aortic stenosis. Eur Heart J. 2014;35(34):2312–2321. doi:10.1093/eurheartj/ehu189.
 © 2021 The Author(s). This work is published and licensed by Dove Medical Press Limited. The
full terms of this license are available at https://www.dovepress.com/terms
and incorporate the Creative Commons Attribution
- Non Commercial (unported, 3.0) License.
By accessing the work you hereby accept the Terms. Non-commercial uses of the work are permitted
without any further permission from Dove Medical Press Limited, provided the work is properly
attributed. For permission for commercial use of this work, please see paragraphs 4.2 and 5 of our Terms.
© 2021 The Author(s). This work is published and licensed by Dove Medical Press Limited. The
full terms of this license are available at https://www.dovepress.com/terms
and incorporate the Creative Commons Attribution
- Non Commercial (unported, 3.0) License.
By accessing the work you hereby accept the Terms. Non-commercial uses of the work are permitted
without any further permission from Dove Medical Press Limited, provided the work is properly
attributed. For permission for commercial use of this work, please see paragraphs 4.2 and 5 of our Terms.