Back to Journals » International Journal of General Medicine » Volume 14
Optimization of Minimum Segment Width Parameter in the Intensity-Modulated Radiotherapy Plan for Esophageal Cancer
Authors Hong J, Han JH, Luo HL, Song YQ
Received 27 August 2021
Accepted for publication 16 November 2021
Published 16 December 2021 Volume 2021:14 Pages 9913—9921
DOI https://doi.org/10.2147/IJGM.S336269
Checked for plagiarism Yes
Review by Single anonymous peer review
Peer reviewer comments 3
Editor who approved publication: Dr Scott Fraser
Jun Hong,* Ji-Hua Han,* Hong-Lei Luo, Ya-Qi Song
Department of Radiation Oncology, The Affiliated Huaian No.1 People’s Hospital of Nanjing Medical University, Jiangsu, Huai’an, 223300, People’s Republic of China
*These authors contributed equally to this work
Correspondence: Ya-Qi Song; Hong-Lei Luo
Department of Radiation Oncology, The Affiliated Huaian No.1 People’s Hospital of Nanjing Medical University, Jiangsu, Huai’an, 223300, People’s Republic of China
Tel +86 18912089369
Email [email protected]; [email protected]
Purpose: This study was designed to explore the optimal minimum segment width (MSW) in the intensity-modulated radiotherapy (IMRT) plan for esophageal cancer.
Patients and Methods: The imaging data of 20 esophageal cancer patients were selected for this study. Four IMRT plans were designed for each patient with MSWs of 0.5, 1.0, 1.5, and 2.0 cm. The conformity index (CI) and homogeneity index (HI) of the planning target volumes (PTV), organs at risk (OARs), control points (CP), monitor units (MU), plan delivery time (DT), and gamma passing rates (GPR) were collected and compared to appraise the treatment plan quality and delivery efficiency.
Results: Lower-MSW plans had larger CI and smaller HI values, and lower dose parameters of OARs and PTVs. The HI, CI, and dose parameter of OARs in the 0.5 and 1.0 cm MSW groups were similar and much better than those of the 1.5 and 2.0 cm MSW groups. Meanwhile, the plan in the 0.5 cm MSW group had significantly higher MUs, CPs, and DTs, and a significantly lower relative dose of GPR with a 3% dose difference and 3 mm distance to agreement criteria than the other three groups.
Conclusion: The 0.5 and 1 cm MSW groups had better dosimetric parameters and IMRT plan quality than the other groups. However, plans with 0.5 cm MSW had worse delivery accuracy and efficiency than the other three groups. Thus, MSW of 1.0 cm was the optimal choice to ensure good quality, delivery accuracy, and treatment efficiency in IMRT plans for esophageal cancer.
Keywords: esophageal cancer, minimum segment width, delivery efficiency, plan quality, intensity-modulated radiotherapy
Introduction
Intensity-modulated radiotherapy (IMRT) is the most important radiation technique of the past decade, accomplishing not only better conformity and homogeneity of the target volume but also better protection of normal tissue near the cancer tissue compared with traditional two- and three-dimensional conformal radiation therapy.1–4 The minimum segment width (MSW) parameter plays an important role in designing an IMRT plan. The choice of different segment settings might affect the optimization of the target area as well as the modulation and, accordingly, the plan delivery and verification passing rate.5,6 Until now, few studies have reported the influence of MSW optimization on IMRT plan quality, delivery, and efficiency,7 and no related research on esophageal cancer has been found. In this study, 20 patients suffering from local-regional stage esophageal cancer were enrolled to explore the impact of MSW values on IMRT plan quality and delivery efficiency to provide a clinical reference for the IMRT plan design for esophageal cancer.
Materials and Methods
Patients
A total of 20 patients with local–regional stage (cT2-3N1-2M0, stage III, the American Joint Committee on Cancer 8th staging) esophageal squamous cell cancer being treated with IMRT between January 2018 and December 2019 were enrolled in this study. Clinical and image characters of these patients were listed in Table 1.
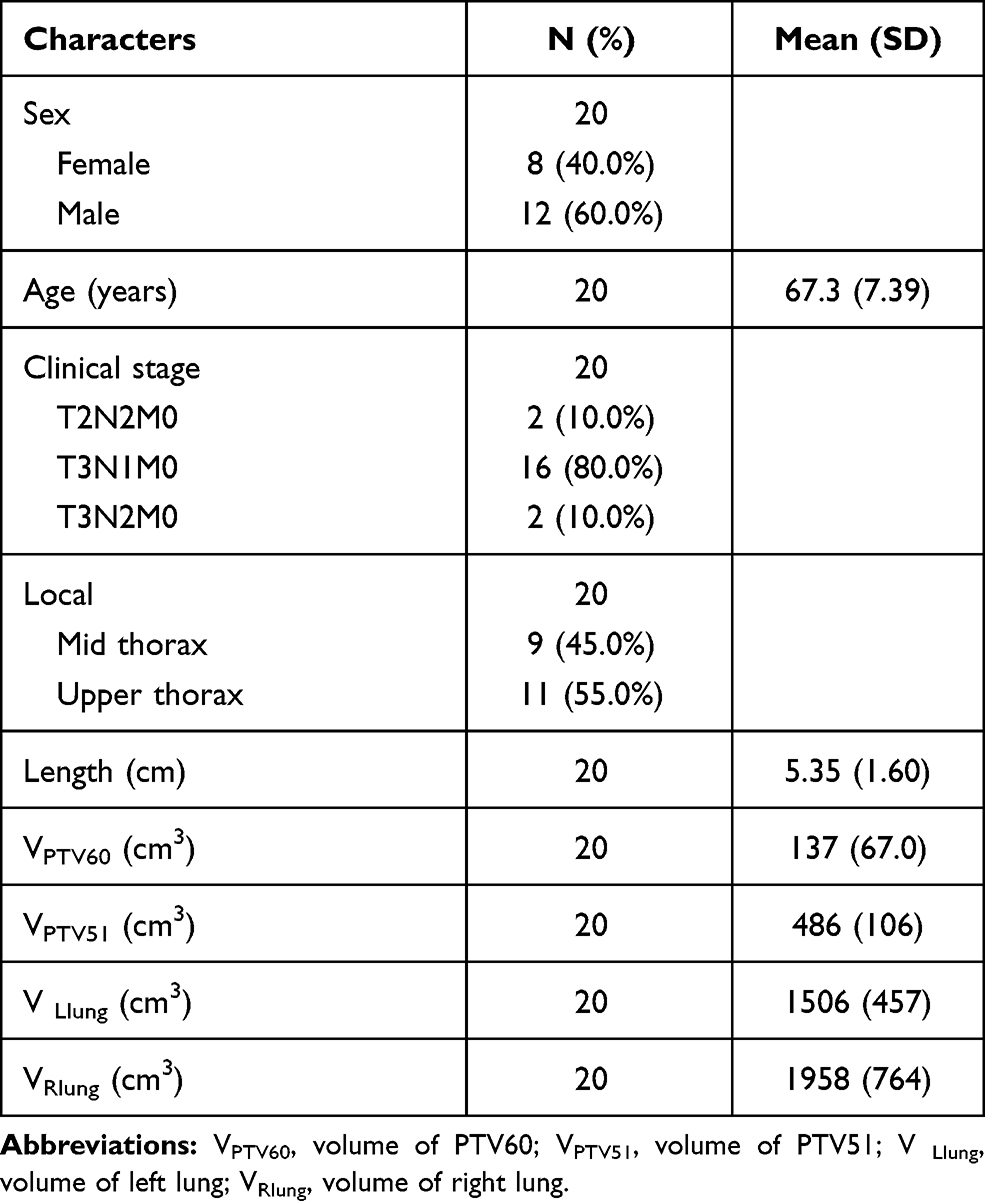 |
Table 1 Summary of Clinical and Image Characters |
This study was conducted in accordance with the Declaration of Helsinki and approved by the review board of the Affiliated Huaian No. 1 People’s Hospital of Nanjing Medical University. All the treatment plans in this study were used for research only; they were not used for treatment. No human subjects or personal identifying information were used in this study; no informed consent was required.
Radiation Treatment Plan
Each patient was positioned on a treatment board with both of their arms falling naturally near their body or raising above their head, immobilized with a thermoplastic mold, and scanned using the Siemens Somatom Confidence RT Pro (Siemens Healthcare GmbH, Erlangen, Germany) large-aperture Computed Tomography (CT) simulation with a 5 mm slice thickness. The free-breathing CT images were then transferred to the Monaco treatment planning system version 5.11 (Elekta, Sweden)8 for contouring of the organs at risk (OARs), gross tumor volume (GTV), and clinical target volume (CTV) according to the guidelines for radiotherapy of esophageal cancer in China9 and the International Commission on Radiation Units and Measurements report No. 83 (2010).10,11 The planning target volumes with a dose of 51 Gy (PTV51) and 60 Gy (PTV60) were defined as the CTV and GTV, respectively, with a 5–10 mm margin in all directions. The prescribed doses of PTV60 and PTV51 were 60 Gy/30 fx and 51 Gy/30 fx, respectively. The dose constraints of the OARs were as follows: 1) heart: V40 < 30%, V30 < 40%, Dmean < 26 Gy; 2) lungs: V20 < 28%, V30 < 20%, Dmean < 14 Gy; and 3) spine: Dmax < 45 Gy.
Each plan was designed by the Monte Carlo algorithm with five fixed fields12 (0°, 50°, 150°, 210°, 300°) and 0.3 cm of the calculation grid. The calculation uncertainty of the entire plan was 1%. The collimator and table angles were 0 degrees, individual leaf width was 0.5 cm, the dose rate with a range of 0–600MU/min was automatically generated by the Monaco treatment planning system. All plans were automatically optimized according to the function listed in Table 2, without manual intervention of any parameter except for the MSW. The beam’s eye view of an example plan with detailed dynamic multileaf collimator (dMLC) information was shown in Supplementary Figure 1. The MSWs were selected as 0.5, 1.0, 1.5, and 2.0 cm, and four plans were computed with the different MSWs for each patient.13 Each plan was normalized to 95% volume of PTV60 to be covered with 60 Gy. The radiotherapy plans were delivered with a 6 MV x-ray and dMLC via the Versa HD linear accelerator.
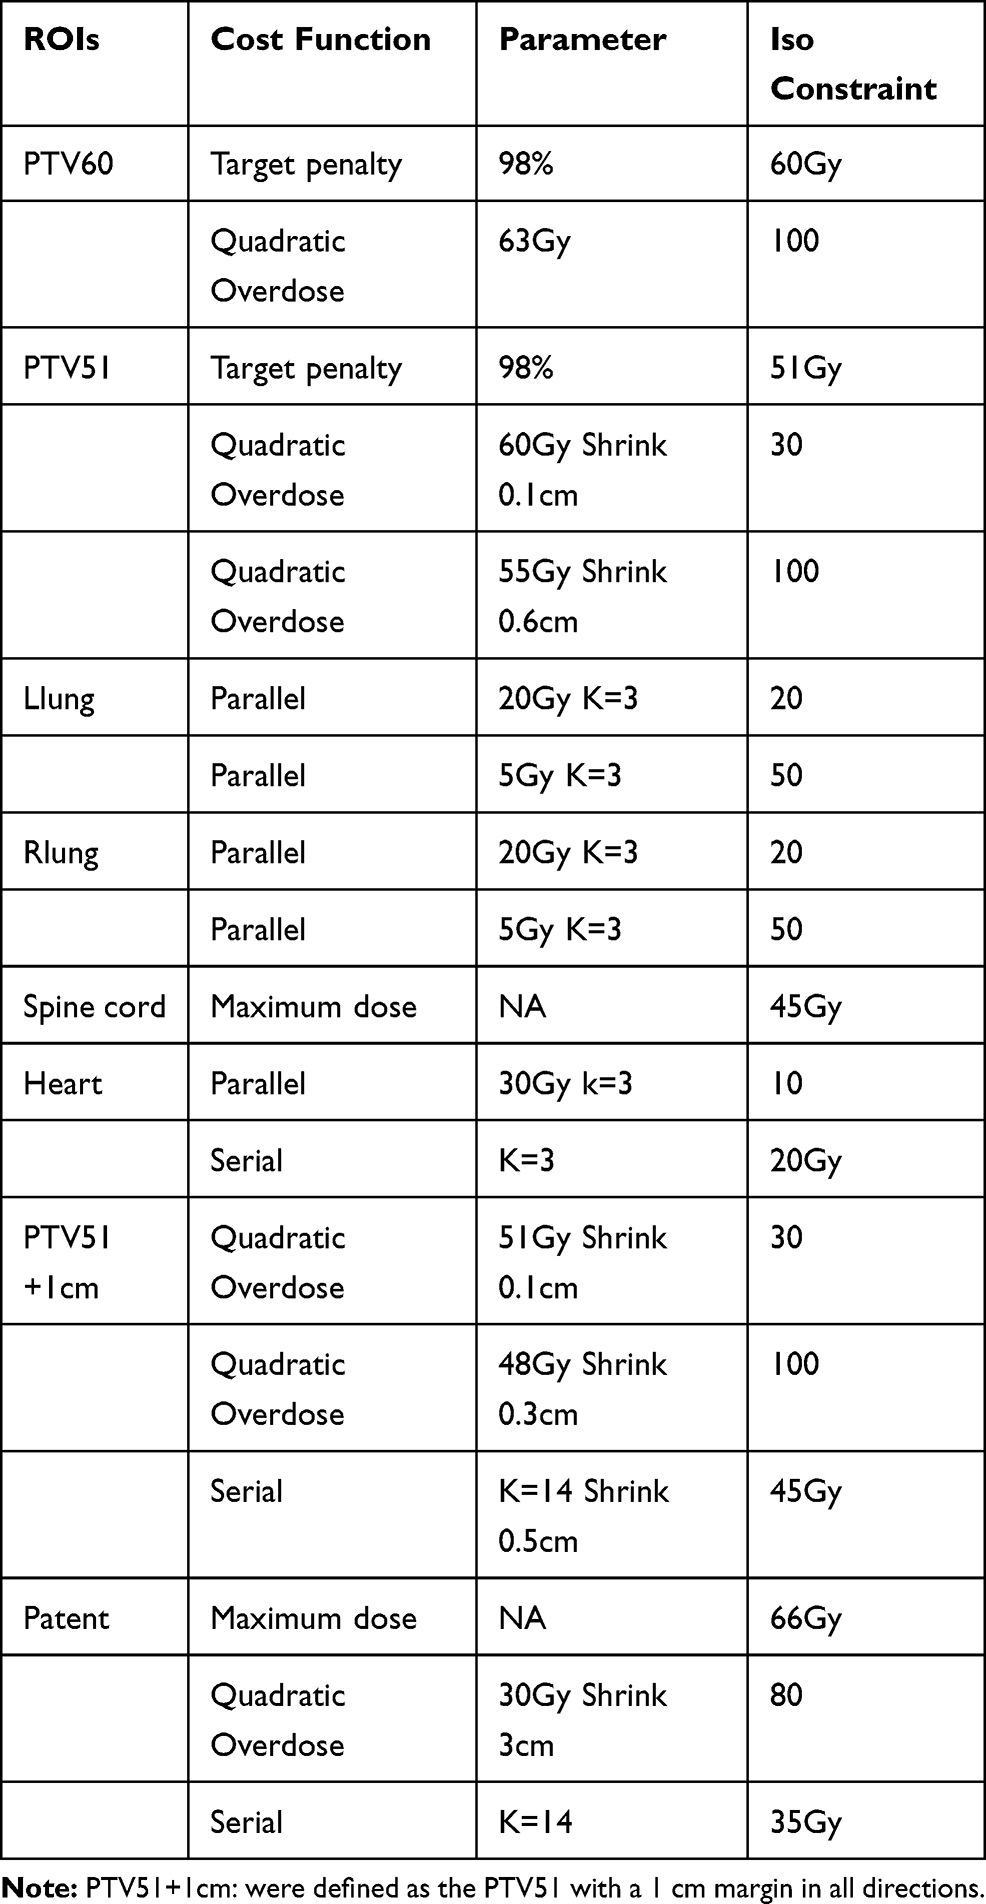 |
Table 2 The Cost Functions of IMRT Planning for ESCC |
Parameters for Plan Evaluation
The parameters used to evaluate the treatment plans included the dose parameters of the PTVs and OARs, homogeneity index (HI), conformity index (CI), monitor units (MU), control points (CP), gamma passing rates (GPR) of the dosimetric distributions, and the “beam on” delivery time (DT). The CI, HI, and dose parameters were defined as follows:
- CI14
The CI of PTV was defined as follows:
CI = (Vtref/VT) × (Vtref/Vref),
Vtref was the TV covered by the 95% isodose line, VT was the volume of the target, and Vref was the treated volume covered by the 95% isodose line. The CI value was distributed from zero to one, and values closer to one were positively related to better conformity.
The HI of PTV was defined with the following equation:
HI = D5/D95,
D5 and D95 represented the doses that covered 5% and 95% of the volume of the PTV, respectively, on the dose–volume histogram. The HI value was negatively correlated with a more homogeneous target dose.
Here, V20, V30, and V40 were defined as the volume percent receiving 20, 30, and 40 Gy, respectively, of the corresponding OARs; Dmax and Dmean referred to the 2% volume dose and the mean dose of the OARs.
The dosimetric distributions were measured by ArcCHECK (Sun Nuclear Corporation, Melbourne, Florida)17 using the SNC software to analyze the GPR between the treatment planning system (TPS) calculated dose and the measured dose for points contributing to at least 10% of the max dose in the plan. The standard 2% dose difference (DD) and 2 mm distance to agreement (DTA) and 3 mm/3% were used. The relative dose (RD) or absolute dose (AD) of GPR with 2 mm/2% and 3 mm/3% was collected for analysis.18–20
Statistical Analysis
Continuous variables were presented as the mean ± standard deviation. As the smallest value, 0.5 cm was defined as the reference, and the ratio of the other three groups to the reference group was calculated. The generalized linear mixed model was performed to analyze the differences among the four groups by calculating the 95% confidence interval. Box plots and forest plots between the 0.5 cm MSW group and the other three groups were also drawn. A p value of <0.05 was considered statistically significant. All data were analyzed by R version 4.0.2 (R Foundation for Statistical Computing, Vienna, Austria).21,22
Results
Dosimetric Parameters of Targets and OARs
The dosimetric parameters of targets containing D95 of PTV51 and CI and HI values of PTV51 and PTV60 were listed in Supplementary Tables 1 and 2 and displayed with box plots and forest plots in Figures 1 and 2. The D95 of PTV51 and CI values of PTV51 and PTV60 decreased and the HI values of PTV51 and PTV60 increased as the MSW value increased. As an increase in the CI implied better conformity and an increase in the HI implied less homogeneity, the results indicated that the conformity and homogeneity deteriorated as the MSW increased.
 |
Figure 1 Box plot (A) of the parameters of organ at risks (OARs). Forest plot (B) of the OARs between different MSW groups. |
 |
Figure 2 Box plot (A) of the HI and CI of PTV60 and PTV51. Forest plot (B) of HI and CI of the PTV60 and PTV51 between different MSW groups. |
The dosimetric parameters of the OARs, including the V20, V30, and Dmean of both lungs, V30, V40, and Dmean of the heart, and Dmax of the spine, were shown in Supplementary Tables 1 and 2 and Figure 1. The parameters were similar in the 1.0 and 0.5 cm MSW groups. However, the V30 of the right lung and Dmax of the spine in the 1.5 cm MSW group were significantly higher than those in the 0.5 cm MSW group. Meanwhile, the V20 of the left lung, V30 of both lungs, and Dmax of the spine in the 2.0 cm MSW group were significantly higher than those in the 0.5 cm MSW group.
MU, CP, and DT
The MU and CP of the four groups were shown in Supplementary Tables 1 and 2 and Figure 3. There was 668.896 ± 57.9 MU in the 0.5 cm MSW group; this value was reduced by 14.2%, 18.8%, and 13.9% in the 1.0, 1.5, and 2.0 cm MSW groups, respectively.
 |
Figure 3 Box plot (A) and forest plot (B) of MU, CP and delivery time among different MSW groups. |
The CP decreased as the MSW value increased. There was 144.25 ± 1.164 CP in the 0.5 cm MSW group; this value was reduced by 4.8%, 9.8%, and 19.1% in the 1.0, 1.5, and 2.0 cm MSW groups, respectively.
The DT of the four groups were illustrated in Supplementary Tables 1 and 2 and Figure 3. The DT of the 0.5 cm MSW group was 208.754 ± 21.616, significantly higher than that of the 1.0, 1.5, and 2.0 cm MSW groups, which was reduced by 12.1%, 13.0%, and 8.7%, respectively.
GPR
The RD and AD of the GPR were illustrated in Supplementary Tables 1 and 2 and Figure 4. The RD of the GPR with 2 mm/2% and 3 mm/3% of the 0.5 cm MSW group were 95.52 ± 1.696 and 98.78 ± 0.916, respectively, significantly lower than those of the other groups. The AD of the GPR with 2 mm/2% and 3 mm/3% of the 0.5 cm MSW group were 95.04 ± 2.397 and 98.51 ± 1.039, respectively, lower than those of the other groups, but not significantly. The other three groups had similar AD and RD values of the GPRs with 2 mm/2% and 3 mm/3%.
 |
Figure 4 Box plot (A) and forest plot (B) of GPR among different MSW groups. |
Discussion
Esophageal squamous cell carcinoma (ESCC) is one of the most common malignancies in China.23–25 Radiation therapy is a vital treatment method for this disease, especially for local advanced ESCC.26,27 Thus, it is important for radiation oncologists to optimize the radiotherapy plan and improve the treatment effect of ESCC. The MSW plays an important role in the shapes and sizes of the segments (ie, CPs) produced by multileaf collimators in IMRT plans. So far, the mechanism of its influence on the treatment plan remains unclear, but several studies have demonstrated that it can influence two main aspects of the plans. Small MSWs improve the quality by raising the TV coverage and protecting OARs;7,28,29 they also prolong the treatment DT and reduce the treatment plan’s efficiency.5,7,30,31 Plans with smaller MSWs require higher treatment accuracy and are more easily affected by errors in the setup and multileaf collimator position.5 Therefore, an appropriate MSW value is essential for radiotherapy plans. Previous research on the optimization of subfield segment width mainly focused only on plan quality28,29,31 or efficiency.5,30 Few studies have comprehensively analyzed the both plan aspects. So far, we have found only one study on plan quality and efficiency in cervical cancer by Wang.7 No such comprehensive research on esophageal cancer has been found. Therefore, we designed this study to comprehensively explore the effect of four different MSW values on the quality and efficiency of IMRT plans for esophageal cancer.
Our study results showed increasing HI and decreasing CI values of the PTVs as the MSWs increased. The HI and CI values of the 0.5 and 1.0 cm MSW groups were similar and much better than those of the 1.5 and 2.0 cm MSW groups (see Figure 1). As for the dose parameters of the OARs, the plans with smaller MSWs had a lower OARs radiation dose. The dose parameters in the 0.5 and 1.0 cm MSW groups was similar. Compared with the 0.5 cm MSW group, the V30 of right lung (9.884% vs 9.347%) and Dmax of the spine (42.444 Gy vs 41.905 Gy) in the 1.5 cm MSW group and the V20 of the left lung (20.599% vs 19.388%), V30 of the left (9.267% vs 8.838%) and right lungs (9.919% vs 9.347%), and Dmax of the spine (43.615 Gy vs 41.905 Gy) in the 2.0 cm MSW group were significantly higher (see Figure 2). These results indicated that the parameters, including the HI and CI values of the PTVs and dose parameters of the PTVs and OARs, performed best in the 0.5 and 1.0 cm MSW groups and worst in the 2.0 cm MSW group. These results differed from those of a previous study on cervical cancer7 in which the dosimetric parameters in the PTVs and OARs remained similar as the MSW value increased.
In addition, similar to Wang’s study on the CP and MU in cervical cancer plans,7 we also found that the number of MU and CP decreased as the MSW value increased. The mean numbers of MU in the 0.5, 1.0, 1.5, and 2.0 cm MSW groups were 668.896, 573.022, 540.501, and 574.883, respectively. There was significantly more MU in the 0.5 cm MSW group than in the other groups, and the MU of the other three groups did not show significant differences. The mean DT of the 0.5, 1.0, 1.5, and 2.0 cm MSW groups were 208.754, 182.504, 180.019, and 189.638 seconds, respectively. The 0.5 cm MSW group needed a longer DT than the other three groups. The MU and DT trends in the four groups were consistent, which agreed with the fact that more MU require a longer DT. The mean numbers of CP in the 0.5, 1.0, 1.5, and 2.0 cm MSW groups were 144.25, 137.35, 130.1, and 116.7, respectively. There was significantly more CP in the 0.5 cm MSW group than in the other groups, proving that the 0.5 cm MSW made worse efficiency than the 1.0, 1.5, and 2.0 cm MSWs.
Additionally, the mean GPR of the for groups were all higher than 98.5% with 3% DD and 3 mm DTA criteria, and higher than 94.5% with 2% DD and 2 mm DTA criteria. There were no significant differences in the GPR among the different MSW groups, except for the RD of the GPR with 3% DD and 3 mm DTA criteria in the 0.5 cm MSW group, which was significantly lower than those in the other three groups (see Figure 4). This illustrated that the measured dose might have been less aligned with the calculated dose in the 0.5 cm MSW group than in the other groups. These trends also appeared in Wang’s research.7 All of the above results agreed with the hypothesis that larger MSWs could decrease the number of small fields, reduce system errors in verification, and make dosimetry verification and plan delivery easier.
Conclusion
In summary, smaller MSWs could lead to better target coverage and HI/CI values, while larger MSWs could decrease the number of CP and MU, raise the GPR, reduce the plan DT, and hence improve the plan delivery efficiency. Our study showed that esophageal cancer IMRT plans with a MSW of 1.0 cm had an advantage in balancing plan quality and efficiency, and was an optimal choice in clinical practice.
Disclosure
The authors report no conflicts of interest in this work.
References
1. Jagsi R, Griffith KA, Moran JM, et al. A randomized comparison of radiation therapy techniques in the management of node-positive breast cancer: primary outcomes analysis. Int J Radiat Oncol Biol Phys. 2018;101(5):1149–1158. doi:10.1016/j.ijrobp.2018.04.075
2. Chun SG, Hu C, Choy H, et al. Impact of intensity-modulated radiation therapy technique for locally advanced non–small-cell lung cancer: a secondary analysis of the NRG Oncology RTOG 0617 Randomized Clinical Trial. J Clin Oncol. 2016;35(1):56–62. doi:10.1200/JCO.2016.69.1378
3. Gardner SJ, Kim J, Chetty IJ. Modern radiation therapy planning and delivery. Hematol Oncol Clin North Am. 2019;33(6):947–962. doi:10.1016/j.hoc.2019.08.005
4. Pacelli R, Caroprese M, Palma G, et al. Technological evolution of radiation treatment: implications for clinical applications. Semin Oncol. 2019;46(3):193–201. doi:10.1053/j.seminoncol.2019.07.004
5. Moon YM, Bae SI, Choi CW, et al. Effect of minimum segment width on gamma passing rate considering MLC position error for volumetric modulated arc therapy. J Korean Phys Soc. 2019;74(7):724–730. doi:10.3938/jkps.74.724
6. Chen S, Yi BY, Yang X, Xu H, Prado KL, D’Souza WD. Optimizing the MLC model parameters for IMRT in the RayStation treatment planning system. J Appl Clin Med Phys. 2015;16(5):322–332. doi:10.1120/jacmp.v16i5.5548
7. Wang Y, Chen L, Zhu F, Guo W, Zhang D, Sun W. A study of minimum segment width parameter on VMAT plan quality, delivery accuracy, and efficiency for cervical cancer using Monaco TPS. J Appl Clin Med Phys. 2018;19(5):609–615. doi:10.1002/acm2.12422
8. Team EW. Elekta’s Monaco 5.11 treatment planning system takes center stage at 2016 American Association of Physicists in Medicine Annual Meeting. Elekta AB.
9. Gong H, Li B. Guidelines for Radiotherapy of Esophageal Carcinoma (2020 Edition): Branch of Radiation Oncology Therapists, Chinese Medical Association; Society of Radiation Oncology Therapy, Chinese Medical Association; Cancer Radiotherapy Committee of China Anti‐Cancer Association. Precis Radiat Oncol. 2021;5(2):54–72.
10. Hodapp N. Der ICRU-Report 83: Verordnung, Dokumentation und Kommunikation der fluenzmodulierten Photonenstrahlentherapie (IMRT). Strahlenther Onkol. 2012;188(1):97–100. doi:10.1007/s00066-011-0015-x
11. Grégoire V, Mackie TR. State of the art on dose prescription, reporting and recording in Intensity-Modulated Radiation Therapy (ICRU report No. 83). Cancer/Radiothérapie. 2011;15(6):555–559. doi:10.1016/j.canrad.2011.04.003
12. Rocha H, Dias JM, Ventura T, Ferreira BDC, Lopes MDC. Beam angle optimization in IMRT: are we really optimizing what matters? Int Trans Oper Res. 2019;26(3):908–928. doi:10.1111/itor.12587
13. Huang L, Zhuang T, Mastroianni A, Djemil T, Cui T, Xia P. Impact of small MU/segment and dose rate on delivery accuracy of volumetric-modulated arc therapy (VMAT). J Appl Clin Med Phys. 2016;17(3):203–210. doi:10.1120/jacmp.v17i3.6046
14. Paddick I. A simple scoring ratio to index the conformity of radiosurgical treatment plans. J Neurosurg. 2000;93(Suppl 3):219–222. doi:10.3171/jns.2000.93.supplement_3.0219
15. Semenenko VA, Reitz B, Day E, Qi XS, Miften M, Li XA. Evaluation of a commercial biologically based IMRT treatment planning system. Med Phys. 2008;35(12):5851–5860. doi:10.1118/1.3013556
16. Weiss E, Siebers JV, Keall PJ. An analysis of 6-MV versus 18-MV photon energy plans for intensity-modulated radiation therapy (IMRT) of lung cancer. Radiother Oncol. 2007;82(1):55–62. doi:10.1016/j.radonc.2006.10.021
17. ArcCHECK® - Sun Nuclear. Available from: https://www.sunnuclear.com/products/arccheck. Accessed November 25, 2021.
18. Ezzell GA, Burmeister JW, Dogan N, et al. IMRT commissioning: multiple institution planning and dosimetry comparisons, a report from AAPM Task Group 119. Med Phys. 2009;36(11):5359–5373.
19. Aristophanous M, Suh Y, Chi PC, Whittlesey LJ, LaNeave S, Martel MK. Initial clinical experience with ArcCHECK for IMRT/VMAT QA. J Appl Clin Med Phys. 2016;17(5):20–33. doi:10.1120/jacmp.v17i5.6118
20. Woon W, Ravindran PB, Ekayanake P, Lim YY, Khalid J. A study on the effect of detector resolution on gamma index passing rate for VMAT and IMRT QA. J Appl Clin Med Phys. 2018;19(2):230–248. doi:10.1002/acm2.12285
21. R Core Team. R: A Language and Environment for Statistical Computing. Vienna, Austria: R Foundation for Statistical Computing; 2020.
22. Pinheiro J, Bates D, DebRoy S, Sarkar D; R Core Team. nlme: linear and nonlinear mixed effects models. R Package Version. 2020;3:1–89.
23. Chen W, Zheng R, Baade PD, et al. Cancer statistics in China, 2015. CA Cancer J Clin. 2016;66(2):115–132. doi:10.3322/caac.21338
24. Feng R-M, Zong Y-N, Cao S-M, Xu R-H. Current cancer situation in China: good or bad news from the 2018 global cancer statistics?. Cancer Commun Lond Engl. 2019;39(1):22.
25. Esophageal cancer statistics in China. Estimates based on 177 cancer registries – PubMed; 2011.
26. Chun SG, Skinner HD, Minsky BD. Radiation therapy for locally advanced esophageal cancer. Surg Oncol Clin N Am. 2017;26(2):257–276. doi:10.1016/j.soc.2016.10.006
27. Zhou N, Rajaram R, Hofstetter WL. Management of locally advanced esophageal cancer. Surg Oncol Clin N Am. 2020;29(4):631–646. doi:10.1016/j.soc.2020.06.003
28. Chang J, Yenice KM, Jiang K, Hunt M, Narayana A. Effect of MLC leaf width and PTV margin on the treatment planning of intensity-modulated stereotactic radiosurgery (IMSRS) or radiotherapy (IMSRT). Med Dosim. 2009;34(2):110–116.
29. Wu QJ, Wang Z, Kirkpatrick JP, et al. Impact of collimator leaf width and treatment technique on stereotactic radiosurgery and radiotherapy plans for intra- and extracranial lesions. Radiat Oncol Lond Engl. 2009;4:3. doi:10.1186/1748-717X-4-3
30. Nithiyanantham K, Kadirampatti Mani G, Subramani V, et al. Influence of segment width on plan quality for volumetric modulated arc based stereotactic body radiotherapy. Rep Pract Oncol Radiother. 2014;19(5):287–295.
31. Nill S, Tücking T, Münter MW, Oelfke U. Intensity modulated radiation therapy with multileaf collimators of different leaf widths: a comparison of achievable dose distributions. Radiother Oncol. 2005;75(1):106–111. doi:10.1016/j.radonc.2005.02.007
 © 2021 The Author(s). This work is published and licensed by Dove Medical Press Limited. The
full terms of this license are available at https://www.dovepress.com/terms
and incorporate the Creative Commons Attribution
- Non Commercial (unported, 3.0) License.
By accessing the work you hereby accept the Terms. Non-commercial uses of the work are permitted
without any further permission from Dove Medical Press Limited, provided the work is properly
attributed. For permission for commercial use of this work, please see paragraphs 4.2 and 5 of our Terms.
© 2021 The Author(s). This work is published and licensed by Dove Medical Press Limited. The
full terms of this license are available at https://www.dovepress.com/terms
and incorporate the Creative Commons Attribution
- Non Commercial (unported, 3.0) License.
By accessing the work you hereby accept the Terms. Non-commercial uses of the work are permitted
without any further permission from Dove Medical Press Limited, provided the work is properly
attributed. For permission for commercial use of this work, please see paragraphs 4.2 and 5 of our Terms.