")
Back to Journals » Drug Design, Development and Therapy » Volume 17
Optimal Teicoplanin Dosage Regimens in Critically Ill Patients: Population Pharmacokinetics and Dosing Simulations Based on Renal Function and Infection Type
Authors Wang Y, Yao F, Chen S, Ouyang X, Lan J , Wu Z, Wang Y, Chen J, Wang X, Chen C
Received 5 April 2023
Accepted for publication 5 July 2023
Published 1 August 2023 Volume 2023:17 Pages 2259—2271
DOI https://doi.org/10.2147/DDDT.S413662
Checked for plagiarism Yes
Review by Single anonymous peer review
Peer reviewer comments 2
Editor who approved publication: Dr Tuo Deng
Yifan Wang,1,2,* Fen Yao,2,* Shenglong Chen,3 Xin Ouyang,4 Jinhua Lan,5 Zheng Wu,2 Yirong Wang,2 Jingchun Chen,2 Xipei Wang,6,7 Chunbo Chen1
1Department of Critical Care Medicine, Shenzhen People’s Hospital, The Second Clinical Medical College of Jinan University, The First Affiliated Hospital of Southern University of Science and Technology, Shenzhen, 518020, People’s Republic of China; 2School of Biology and Biological Engineering, South China University of Technology, Guangzhou, 510006, People’s Republic of China; 3Department of Critical Care Medicine, Guangdong Provincial People’s Hospital, Guangdong Academy of Medical Sciences, Guangzhou, 510080, People’s Republic of China; 4Department of Intensive Care Unit of Cardiovascular Surgery, Guangdong Cardiovascular Institute, Guangdong Provincial People’s Hospital, Guangdong Academy of Medical Sciences, Guangzhou, 510080, People’s Republic of China; 5Department of Pharmacy, General Hospital of Southern Theatre Command, Guangzhou, 510010, People’s Republic of China; 6Research Center of Medical Sciences, Guangdong Provincial People’s Hospital, Guangdong Academy of Medical Sciences, Guangzhou, 510080, People’s Republic of China; 7Guangdong Provincial Key Laboratory of Clinical Pharmacology, Guangdong Cardiovascular Institute, Guangdong Provincial People’s Hospital, Guangdong Academy of Medical Sciences, Guangzhou, 510080, People’s Republic of China
*These authors contributed equally to this work
Correspondence: Chunbo Chen, Department of Critical Care Medicine, Shenzhen People’s Hospital, The Second Clinical Medical College of Jinan University, The First Affiliated Hospital of Southern University of Science and Technology, Shenzhen, 518020, People’s Republic of China, Email [email protected] Xipei Wang, Research Center of Medical Sciences, Guangdong Provincial People’s Hospital, Guangdong Academy of Medical Sciences, Guangzhou, 510080, People’s Republic of China, Email [email protected]
Purpose: To develop a population pharmacokinetic model describing teicoplanin concentrations in patients hospitalized in intensive care unit (ICU) and to perform Monte Carlo simulations to provide detailed dosing regimens of teicoplanin.
Methods: This single-center, prospective, observational study was conducted on 151 patients in ICU with 347 plasma samples. The population pharmacokinetics model was established and various covariates were evaluated. The probability of target attainment (PTA) of various proposal dosing regimens was calculated by Monte Carlo simulations.
Results: The two-compartment model adequately described teicoplanin concentration-time data. The estimated glomerular filtration rate (eGFR) associated with systemic clearance (CL) was the only covariate included in the final model. The estimate of CL was 0.838 L/h, with the eGFR adjustment factor of 0.00823. The volume of the central compartment (Vc), inter-compartmental clearance (Q) and volumes of the peripheral compartments (Vp) were 14.4 L, 3.08 L/h and 51.6 L, respectively. The simulations revealed that the standard dosage regimen was only sufficient for the patients with severe renal dysfunction (eGFR ≤ 30 mL/min/1.73 m2) to attain target trough concentration (Cmin, PTA 52.8%). When eGFR > 30 mL/min/1.73 m2, increasing dose and the administration times of loading doses were the preferred options to achieve target Cmin based on the renal function and types of infection.
Conclusion: The most commonly used standard dosage regimen was insufficient for all ICU patients. Our study provided detailed dosing regimens of teicoplanin stratified by eGFR and types of infection for ICU patients.
Keywords: teicoplanin, pharmacokinetics, Monte Carlo simulation, intensive care unit, renal function
Introduction
Gram-positive bacteria are one of the most common pathogens in intensive care unit (ICU), which is often associated with high mortality and an increase in the duration and cost of hospitalization.1 Currently, the use of glycopeptide antibiotic for this infection is preferred in the clinic. Teicoplanin, as a glycopeptide antibiotic, has been used to treat Gram-positive bacteria, especially for methicillin-resistant Staphylococcus aureus (MRSA).2 A meta-analysis study revealed that no significant discrepancy in antimicrobial activity between teicoplanin and vancomycin, but fewer adverse effects such as nephrotoxicity and infusion reaction were observed with teicoplanin.3 Therefore, teicoplanin is commonly used clinically instead of vancomycin for the treatment of patients with renal dysfunction.
Due to the high plasma protein binding rate (over 90%), teicoplanin has a long elimination half-life of 169 hours.4,5 The loading dose of teicoplanin during the first few days of treatment was necessary to attain target trough concentration (Cmin) and optimal loading dose was associated with higher cure rate.6,7 At the same time, maintenance dose should not be overlooked.8 The standard dose [loading dose of 400 mg (6 mg/kg) every 12 hours for the first three doses followed by maintenance dose of 400 mg once daily (400mg q12h×3, 400mg qd)] was used to keep Cmin ≥ 10 mg/L for the treatment of most infections caused by Gram-positive bacteria such as skin and soft tissue infection, pneumonia, intra-abdominal infection and urinary tract infection. For the deep-seated infection such as bacteremia, bone and joint infections and infective endocarditis, 800 mg (12 mg/kg) every 12 hours for the first three doses followed by 800 mg once daily (800 mg q12h×3, 800 mg qd) and Cmin between 15 and 30 mg/L was enough to be effective.9 However, it has been reported that the standard dosing regimen (400 mg q12h×3, 400 mg qd) was insufficient to achieve 10 mg/L within the initial three days in more than 50% patients.10 Recently, some studies indicated that more intensive dosage regimens (≥600 mg) or dose adjustment based on the body weight (≥10 mg/kg) could promptly achieve the therapeutic drug concentrations.11–13
To the best of our knowledge, although the pharmacokinetics of teicoplanin in different populations and different clinical situations have been extensively reported, there were few reports in ICU patients.4,14,15 Studies on dose–response relationships were generally conducted in healthy volunteers or patients with rather mild illness. However, the drug concentrations extrapolated from healthy volunteers were much higher than the observed ones in critically ill patients.16,17 Moreover, the pharmacokinetics of antimicrobial drugs are easily affected by pathophysiological changes which caused by critical disease, such as reduced drug clearance resulting from acute liver and kidney injury or systemic inflammatory response syndrome, augmented renal clearance (ARC) resulting from hyperdynamic sepsis.15,18,19 At present, there is no detailed dosing regimen of teicoplanin based on population pharmacokinetic characteristics of critically ill patients. Therefore, the objectives of this study were (1) to establish a population PK model of teicoplanin in Chinese adult critically ill patients, (2) to clarify the factors affecting the PK parameters, and (3) to explore the optimal dosing strategy using Monte Carlo simulation for teicoplanin in ICU patients, especially those patients with renal dysfunction.
Patients and Methods
Patients and Data Collection
This single-center, prospective, observational study was performed in ICU of Guangdong Provincial People’s Hospital from July 2018 to January 2020. The inclusion criteria were applied: age ≥18 years, receiving teicoplanin (Targocid, Sanofi Co, Guangdong, China) intravenously, diagnosed or suspected clinically with Gram-positive infections. Exclusion criteria were patients who lacked any of the demographic and laboratory data described below. Demographic and clinical characteristics were collected including age, sex, body weight, serum creatinine concentrations (Scr), serum albumin concentrations (ALB). Creatinine clearance (Ccr) was calculated by the Cockcroft-Gault formula. The estimated glomerular filtration rate (eGFR) was calculated by CKD-EPI (Chronic Kidney Disease Epidemiology Collaboration) equation.20 In addition, other clinical information including teicoplanin doses and dosing intervals, each time point of sample collection, the continuous renal replacement therapy (CRRT) status, baseline acute physiology and chronic health evaluation (APACHE) II scores were also recorded.
Dosing Regimen
With complex physiologic alterations, ICU patients are more flexible to alter dosage of teicoplanin. Therefore, the patients were classified into four groups, group 1 at a loading dose of 400 mg every 12 hours for three doses, followed a maintenance dose of 400 mg every 24 hours (n = 35), group 2 at a loading dose of 600 mg every 12 hours for 3 to 5 doses, then at a maintenance dose of 400–600 mg every 24 hours (n = 17), group 3 at a loading dose of 800 mg every 12 hours for 3 to 5 doses, then at a maintenance dose of 400–800 mg every 24 hours (n = 8), group 4 at irregular doses and irregular intervals (n = 91). The infusion time was 1 h.
Blood Sampling, Handling, Storage, and Measurement
During the application of teicoplanin, blood samples were collected before one loading dose, at the end of the infusion of the maintenance dose and before the next maintenance dose. Venous blood was placed in the EDTA anticoagulant tube at 3000 r/min centrifugation for 10 minutes. Supernatant plasma was collected and cryopreserved at −80°C for further analysis.
Determination of Plasma Concentration
The plasma samples were determined using a validated high-performance liquid chromatography-tandem mass spectrometry (HPLC-MS/MS) method. Teicoplanin is a mixture of five main compounds (A2-1, A2-2, A2-3, A2-4 and A2-5). A2-2 is the most active compound accounting for about 50%. We chose A2-2 to be detected in place of all components, which signal is strong and stable.21 Plasma samples (50 μL) were extracted by protein precipitation with acetonitrile (200 μL), using daptomycin as internal standard (IS). Chromatographic separation was performed at 40 °C using a Welch Ultimate XB C18 column (50 mm × 2.1 mm, 3 μm particle size). A linear gradient elution was used at 0.3 mL/min and started at mobile phase A (water with 0.5% formic acid) and mobile phase B (acetonitrile). The total run time was 4.5 min. Firstly, the composition of the mobile phase was 90% A and 10% B (0–1.1 min). Subsequently, the composition changed to 10% A and 90% B (1.2–2.5 min). Finally, it changed to 90% A and 10% B (2.6–5.5 min). The concentration of teicoplanin in plasma was determined by ESI ion source and positive ion mode multi-reaction monitoring method (MRM). The ion transitions were performed at m/z 940.5→316.2 for teicoplanin A2-2 and m/z 811.0→313.0 for daptomycin, with the collision voltage of 20 eV and 42 eV, respectively. The linear relationship of the method was good in the range of 1.0–100.0 mg/L, and the lower limit of quantification (LLOQ) was 1.0 mg/L. The relative standard deviation (RSD) of intra-batch and inter-batch precision was ≤10.9%, and the normalized matrix effect of teicoplanin was 92.7–109.3% and the RSD was ≤12.0%. Plasma samples were found to be stable for at least 41 days at −20 °C. No interference was found in the clinical sample analysis.
PK Modeling
During the preliminary PK analysis, we tested one- and two-compartment PK models and determined base model according to the results of Goodness-of-fits (GOF) plots. Next, we assessed the potential covariates including patients’ demographic and clinical characteristics such like sex, age, body weight, ALB, Scr, Ccr, eGFR, the CRRT status and APACHE II scores. The covariate model was assessed by comparing the decrease of objective function value (OFV). The significance levels for the forward selection and backward elimination were set at P < 0.05 (ΔOFV −3.84) and P < 0.001 (ΔOFV −10.828), respectively. We exercised caution to select mutually independent covariates only.
Model Evaluation and Validation
The validity of the population PK model was assessed by visual inspection using GOF plots. The plot of observations versus population predictions (OBS-PRED) was used to evaluate the population typical values. And the plot of observations versus individual population predictions (OBS-IPRED) was used to evaluate the between-subject variability (BSV). The deviation of model prediction was evaluated using the plots of conditional weight residual error versus PRED (CWRES-PRED) and CWRES versus time after first dose (CWRES-TAFD).
To evaluate the robustness of parameters estimated from the final model, we performed the bootstrap resampling method. Firstly, resampling randomly as the same number from the original dataset to generate 1000 new bootstrap samples. Comparing the median and 95% confidence interval (95% CI, percentiles 2.5 and 97.5%) estimated by bootstraps with the parameters of final model, if the parameters were close to the median and within the 95% CI, the model had good robustness. To assess the predictive performance, a visual predictive check (VPC) was performed. In addition, we used the normalized prediction distribution error (NPDE) plots to check for holistic normal distribution characteristics and trends in the data errors.22
To assess external validity, bias and precision were calculated by computing prediction error (PE), mean prediction error (MPE) and root mean square error (RMSE) between the measured teicoplanin concentrations of the external dataset and those predicted by the final model. The calculation formulas were as follows:
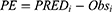

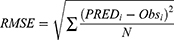
where PREDi is ith predicted concentrations, Obsi is ith observed concentrations, N denotes the total number of observations.
Simulations and the Probability of Target Attainment (PTA)
Monte Carlo simulations were performed for dosing regimen optimization in ICU patients with various renal function levels (eGFR ≤30 mL/min/1.73 m2, 30–60 mL/min/1.73 m2, 60–90 mL/min/1.73 m2 and 90–130 mL/min/1.73 m2). Based on the recommendations in previous studies, we set different target Cmin for different types of infections: both of the Cmin at 72 h after the initial loading dose (Cmin 72 h) and the steady-state Cmin at 168 h after the initial loading dose (Css 168 h) are ≥10 mg/L for most infections caused by Gram-positive bacteria such as skin and soft tissue infection, pneumonia, intra-abdominal infection and urinary tract infection, ≥15 mg/L for deep-seated infection such as bacteremia, bone and joint infections and infective endocarditis.2,23 The PTA was calculated as the proportion of simulated patients achieving the target value in percentage. Considering that the drug combination might increase the risk of adverse drug reaction, a dosing regimen was defined as optimal if the PTA was >50%. The recommended concentrations of Monte Carlo simulation should be lower than the concentration inducing adverse effects (thrombocytopenia, ≥40 mg/L; nephrotoxicity, ≥60 mg/L) to ensure medication safety.24
Statistical Analysis
All statistical analyses were conducted using IBM SPSS Statistics for Windows v.22 (IBM Corp., Armonk, NY, USA). Data were described as the median and range for continuous variables and as the number (%) for categorical variables, as appropriate. Statistical significance was defined as a P value of <0.05. Population pharmacokinetic analysis was performed using a non-linear mixed effects model implemented in NONMEM software (version 7.3 ICON Development Solutions, Ellicott City, MD, USA) with the FORTRAN compiler. The first-order conditional estimation (FOCE) method with interaction was used for the analysis. The execution, management and validation of the model were performed with the aid of Pirana version 2.9.0. Graphical analyses were performed using R version 3.5.0 (R Foundation, Vienna, Austria).
Results
Population PK Model
A total of 347 serum teicoplanin concentrations obtained from 151 patients were collected. Modeling building was carried out with a data set of 304 samples from 108 patients (More than two samples were collected from each patient). External validation was performed with a data set of 43 samples from 43 patients (Only one sample was collected due to drug withdrawal, discharge or death of the patient). Demographic and physiological characteristics of patients from the external validation group largely resembled those of the model building group. Patient data are summarized in Table 1. There were 102 males and 49 females. Overall, patients in our study were of older age and severe renal impairment.
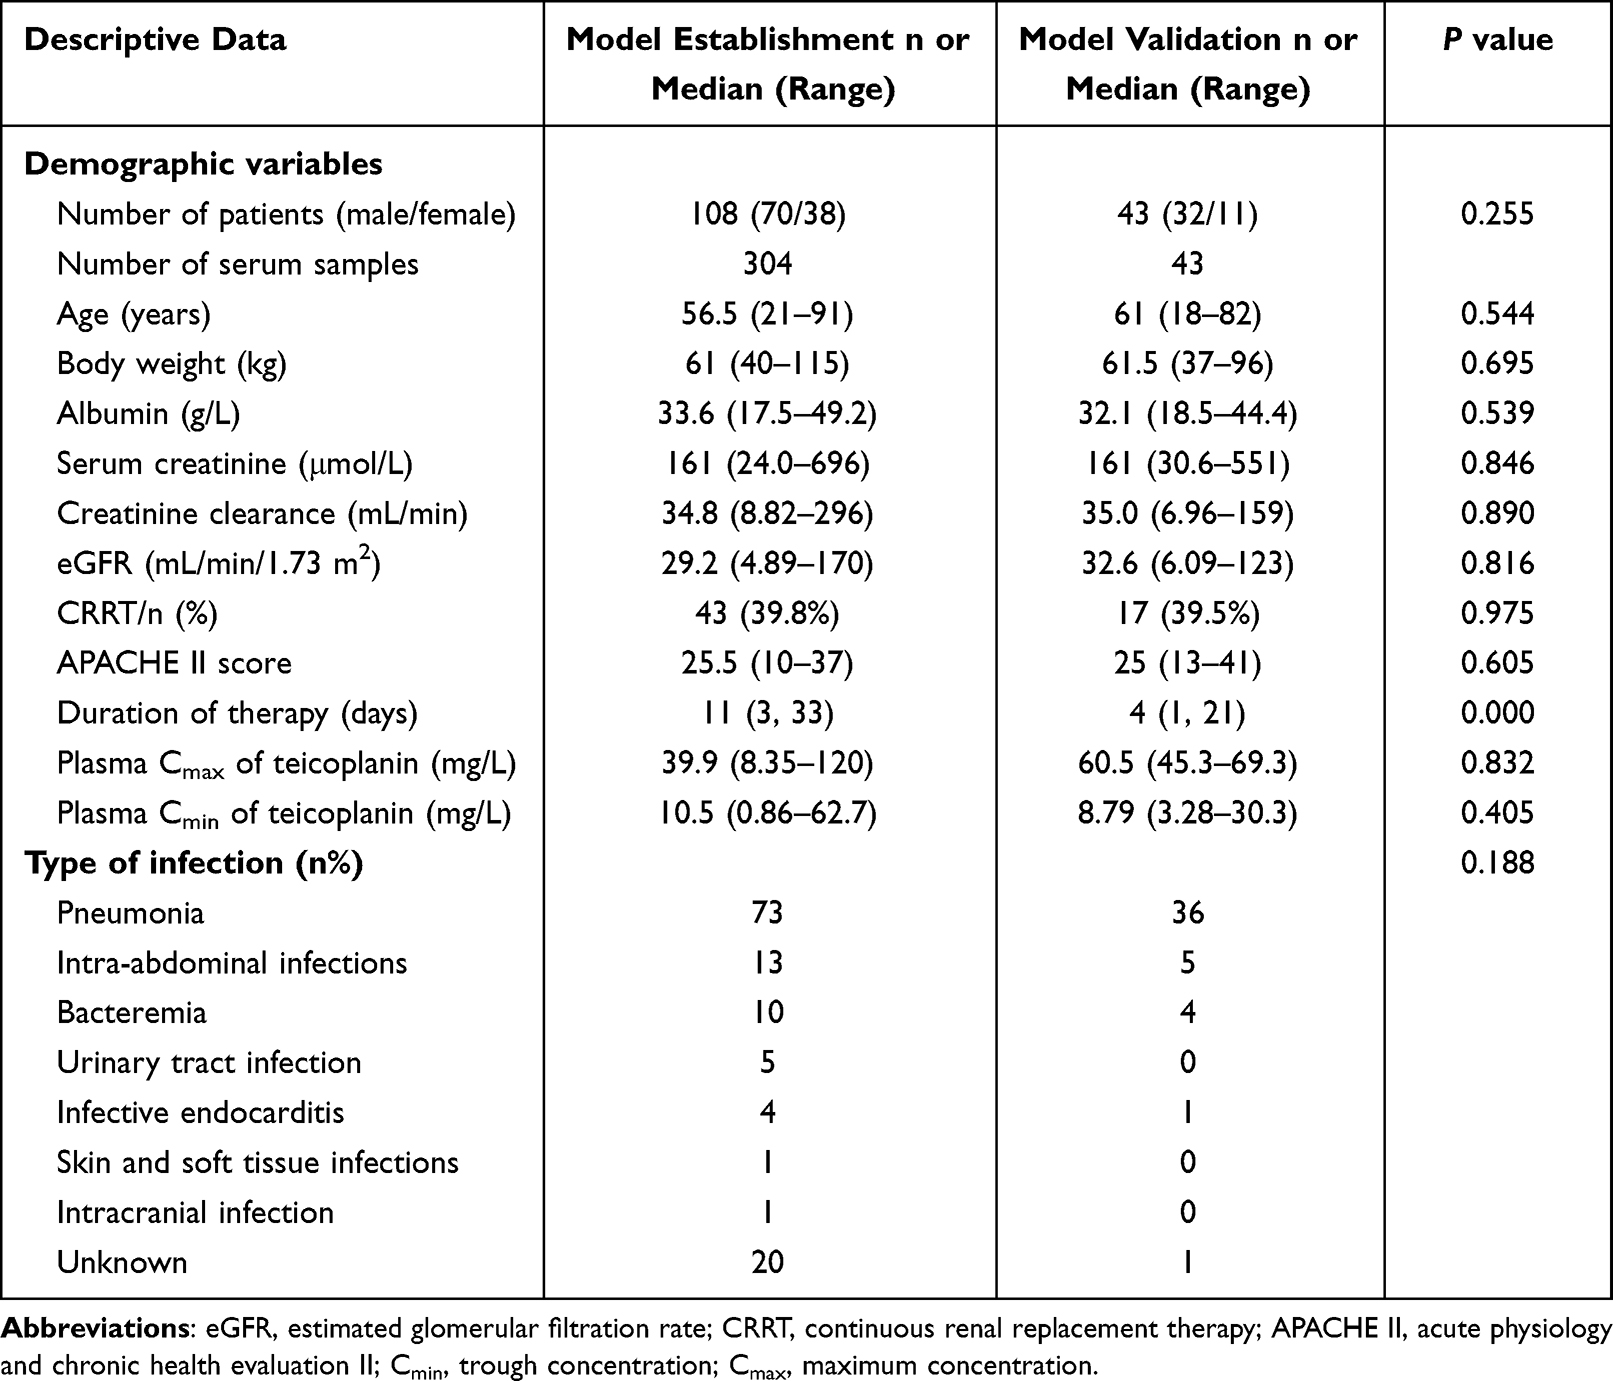 |
Table 1 Clinical Data for the Study Population of Patients Receiving Teicoplanin |
During the establishment of base model, the data showed a better fit to two-compartment model. Exponential and proportional error models were selected to describe the inter-individual and residual variability, respectively. During stepwise covariate modeling, eGFR was a covariate significantly associated with inter-individual variability of systemic clearance (CL) (ΔOFV −23.189). There were no significant covariates that explained the volume of the central compartment (Vc). Other covariates including age, body weight, ALB or CRRT status showed no significant influence (ΔOFV < 3.84) on any parameters. All the tested models are described in Table S1. Detailed parameter estimates of the final PK model are presented in Table 2. The estimates of CL, Vc, Q and Vp were 0.838 L/h, 14.4 L, 3.08 L/h and 51.6 L, respectively. Taking the significant covariates into account, the inter-individual variabilities in these parameters assessed as coefficients of variation were 37.7%, 26.6%, 0% and 62.2%, respectively, and the intra-individual variability was 37.1%.
 |
Table 2 Population Pharmacokinetic Parameters Estimates from the Final Model and Bootstrap Analysis |
Model Evaluation and Validation
Regarding model validation, the GOF plots (Figure 1) and the VPC plot (Figure S1) confirmed graphically good predictive performance and no significant bias in the selected pharmacokinetic model. The results of the bootstraps are listed in Table 2 (successful rate of 100%). Comparing the parameter values of final model with the median values of the bootstraps, they were very similar and the parameter values of final model were contained within the 95% CI, demonstrating the robustness of the established PK model. The NPDE plots are presented in Figure 2. There was no obvious trend observed in the plots, indicating no major prediction discrepancy in the final model. According to the result of external validation, the bias (MPE) was −2.22 mg/L (95% CI, 10.71–36.42 mg/L) and the RMSE was 8.88 mg/L, which means no major prediction error between the predicted values and the observation in the external dataset.
 |
Figure 1 GOF plots for the final PK model. Notes: (A) Observations vs population prediction (OBS-PRED). (B) Observations vs individual predicted concentrations (OBS-IPRED). (C) Conditional weight residual error (CWRES) vs PRED (CWRES-PRED). (D) CWRES vs time after first dose (CWRES-TAFD). |
 |
Figure 2 NPDE metrics for the final PK model. Notes: (A) Quantile–quantile plot of NPDE. (B) Histogram of the distribution of NPDE. (C) NPDE vs TAFD. (D) NPDE vs PRED. In (A), the blue shaded region represents the 95% prediction interval for a standard normal random variable. The red dotted line represents the 50th percentile of the standard normal random variable and the dots representing the NPDE computed for this dataset. The blue solid line represents the unity line. In (C and D), the observed concentrations are shown as filled circles, and the solid lines represent the 5th, 50th, and 95th percentiles of observed data. Red or blue-shaded areas represent the median and 95% prediction interval. |
Dosing Simulations
Monte Carlo simulations and PTA for Cmin 72 h and Css 168 h values stratified by eGFR for different types of infection are shown in Figures 3 and 4. The median [interquartile range (IQR)] Cmin 72 h and Css 168 h values are shown in Tables S2-1 and S2-2. Loading dose regimens were designed to achieve Cmin 72 h and maintenance dose regimens were designed to achieve Css 168 h. Not surprisingly, the PTA increased with increasing doses. The detailed loading dose and maintenance dose regimens based on the PTA are shown in Table 3.
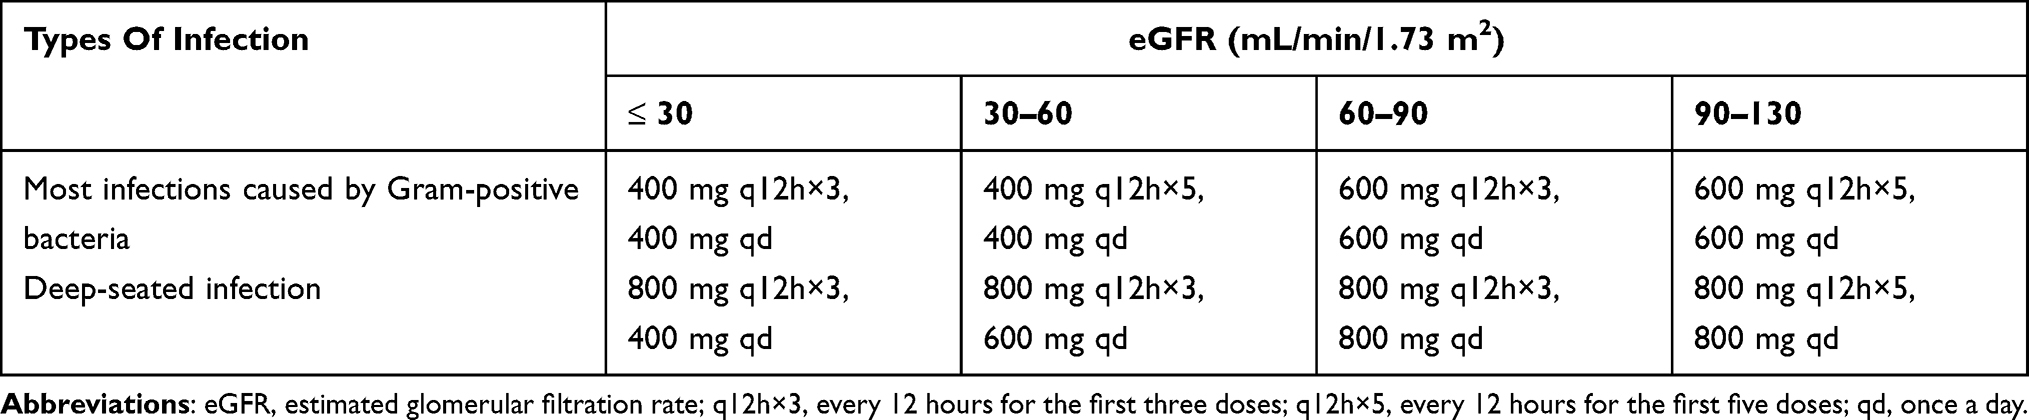 |
Table 3 Detailed Dosing Regimens of Teicoplanin Stratified by eGFR and the Types of Infection in Critically Ill Patients |
 |
Figure 3 Monte Carlo simulations and PTA for Cmin 72 h and Css 168 h values stratified by eGFR for dosing regimens in patients with most infections caused by Gram-positive bacteria such like skin and soft tissue infection, pneumonia, intra-abdominal infection and urinary tract infection. Notes: The horizontal broken line represents the PTA of 50%. The vertical broken line represents Cmin ≥ 10 mg/L. PTA, probability of target attainment; eGFR, estimated glomerular filtration rate; q12h×3, every 12 hours for the first three doses; q12h×5, every 12 hours for the first five doses; qd, once a day; Cmin, trough concentration. |
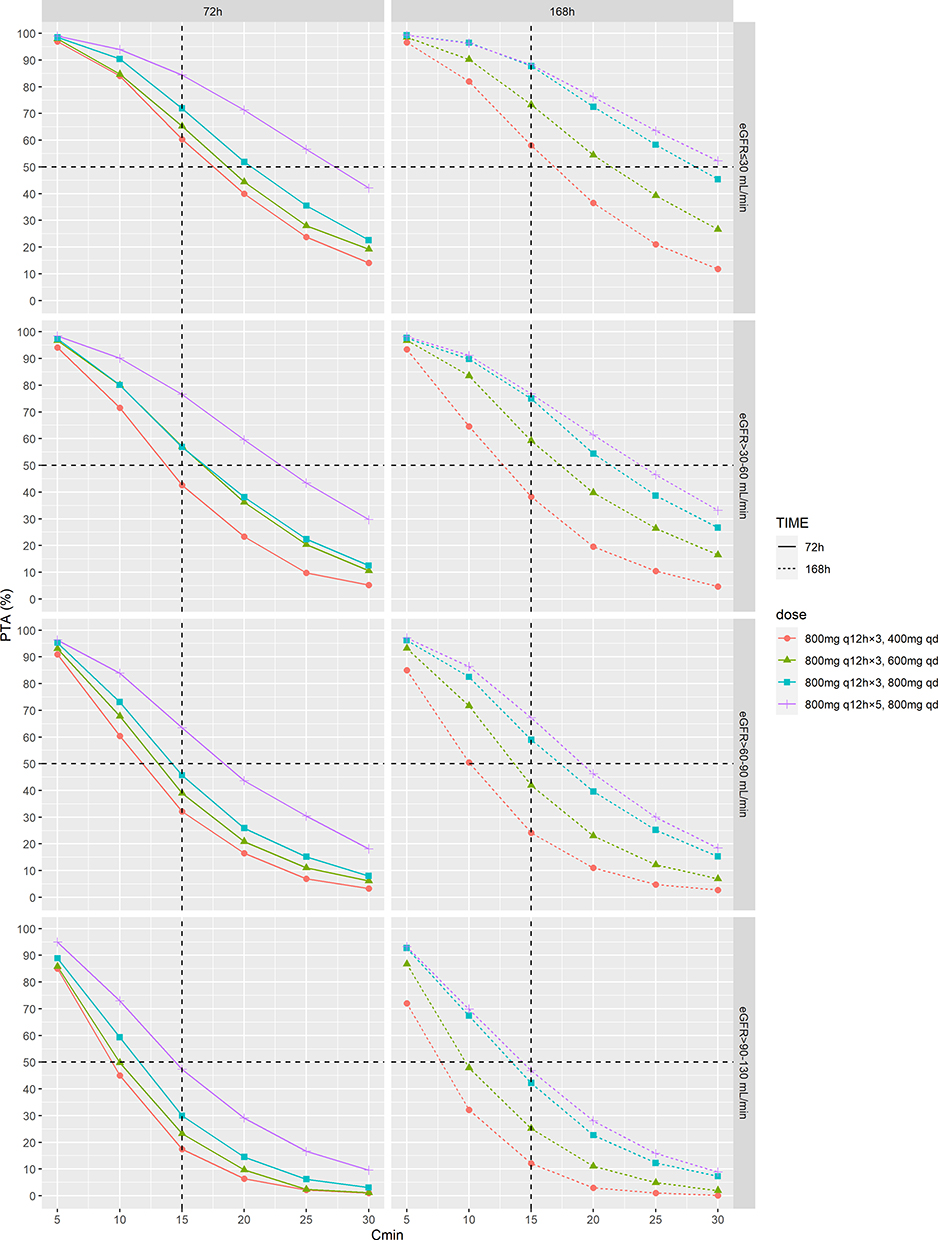 |
Figure 4 Monte Carlo simulations and PTA for Cmin 72 h and Css 168 h values stratified by eGFR for dosing regimens in patients with deep-seated infection such as bone and joint infections, bacteremia and infective endocarditis. Notes: The horizontal broken line represents the PTA of 50%. The vertical broken line represents Cmin ≥ 15 mg/L. PTA, probability of target attainment; eGFR, estimated glomerular filtration rate; q12h×3, every 12 hours for the first three doses; q12h×5, every 12 hours for the first five doses; qd, once a day; Cmin, trough concentration. |
For most infections caused by Gram-Positive Bacteria such like skin and soft tissue infection, pneumonia, intra-abdominal infection and urinary tract infection, the standard dosage regimen (400 mg q12h×3, 400 mg qd) was enough for patients with severe renal dysfunction (eGFR ≤ 30 mL/min/1.73 m2) with the PTA of 52.8% (in 72h) and 74.9% (in 168h). In patients with moderate renal dysfunction (eGFR 30–60 mL/min/1.73 m2), it is recommended to increase the number of loading doses from three to five doses (400 mg q12h×5, 400 mg qd) with the PTA of 56.9% (in 72h) and 60.7% (in 168h). The recommended dose regimen (600 mg q12h×3, 600 mg qd) was necessary for patients with mild renal dysfunction (eGFR 60–90 mL/min/1.73 m2) to achieve the target of 10 mg/L with the PTA of 55.7% (in 72h) and 66.4% (in 168h). And for patients with normal renal function (eGFR 90–130 mL/min/1.73 m2), the 2-day loading dose regimen (600 mg q12h×5, 600 mg qd) was necessary to achieve the same concentration. The PTA were 57.7% (in 72h) and 53.4% (in 168h).
For deep-seated infection such as bone and joint infections, bacteremia and infective endocarditis, at a reduced maintenance dose (800 mg q12h×3, 400 mg qd) for patients with severe renal dysfunction (eGFR ≤ 30 mL/min/1.73 m2), the PTA were 59.2% (in 72h) and 57.9% (in 168h). And for patients with moderate renal dysfunction (eGFR 30–60 mL/min/1.73 m2), the dose regimen (800 mg q12h×3, 600 mg qd) was the preferred option with the PTA of 52.2% (in 72h) and 60.4% (in 168h). For patients with mild renal dysfunction (eGFR 60–90 mL/min/1.73 m2), the recommended dose regimen (800 mg q12h×3, 800 mg qd) was necessary to achieve 15 mg/L with the PTA of 44.2% (in 72h) and 56.3% (in 168h). And for patients with normal renal function (eGFR 90–130 mL/min/1.73 m2), the increased administration times of loading doses (800 mg q12h×5, 800 mg qd) result in the adequate concentration with the PTA of 47.8% (in 72h) and 44.8% (in 168h).
Discussion
The present study developed a population PK model for teicoplanin and found out the influential factors in critically ill patients with renal impairment. The PK of teicoplanin was best described by the two-compartment model and eGFR was the only significant covariate of CL, which markedly improved model fitting. The standard dosage regimen was only enough for the patients with severe renal dysfunction (eGFR ≤ 30 mL/min/1.73 m2) based on the dosing simulation. Increasing dose and the administration times of loading doses were necessary to achieve target Cmin for ICU patients (eGFR > 30 mL/min/1.73 m2) with different types of infection. This prospective study provided the most detailed teicoplanin administration regimen for ICU patients.
The PK model of teicoplanin at the present study was described using a two-compartment model with first-order elimination, whereas previous studies have used one-compartment or multicompartmental models.23,25,26 We found that the GOF plots of the two-compartment model provided a much better fit than those of the one-compartment model. Then, the results from the covariate analysis showed that eGFR was the only significant covariate influencing teicoplanin PK.5,14 Although there were a lot of patients with severe renal failure undergoing CRRT in our study, the CRRT status did not affect the elimination of teicoplanin. However, in recent years, a number of studies have shown that the CRRT modality can influence teicoplanin.27 For these patients, teicoplanin PK had large variability and we recommend therapeutic drug monitoring.28 Due to the high plasma protein binding rate, previous studies of teicoplanin population PK models revealed that the ALB level was a significant covariate on the distribution of volume of teicoplanin.10 Especially in patients with haematological malignancy, low ALB values exhibited a reduction in the concentration of albumin-bound drug in circulation and suboptimal total concentrations.29 However, in the present study, patients’ ALB were within the normal range (33.6 g/L), and it was not difficult to speculate no influence of ALB on the PK of teicoplanin. During the covariate inclusion, eGFR (−20.374) were found to be significant for CL (p < 0.001). Therefore, eGFR for evaluating the renal function of ICU patients is the most optimal method for dose adjustment of teicoplanin.14
The PK analysis in the present study showed a similar range of parameter estimates with those reported in the literature except for the CL, which indicated slightly larger values than those reported by others.10,30 The possible reason is the presence of large-volume fluid resuscitation in critically ill patients following surgery.31 Previous studies reported that in patients treated with a standard dose (400 mg q12h×3, 400 mg qd) the Cmin 72 h value was 9.55 mg/L, which was consistent with the result of Monte Carlo simulations in the present study.32 The standard dosage regimen was only enough for most infections caused by Gram-positive bacteria in critically ill patients with severe renal dysfunction (eGFR ≤ 30 mL/min/1.73 m2). It is worth noting that the renal function levels of most patients in our cohort were in this range, which reminded us that individualized dosage adjustments should be based on the special features of the population. Therefore, more attention should be paid to the renal function during the treatment in critically ill patients. Absolutely, the appropriate dosage regimens were simulated for other patient populations as well.
A previous study reported that for deep-seated infections such as endocarditis and bone infections the Cmin of teicoplanin should achieve 20 mg/L.29,33 However, critically ill patients often accompanied with multiple infection and received a wide range of drugs, increasing the risk of drug interactions. Previous studies suggested that the maintenance dose adjustment according to the renal function was necessary to guarantee the target Cmin 10 mg/L, especially for patients with renal dysfunction. For patients with moderate renal dysfunction (eGFR 30–80 mL/min/1.73 m2), the maintenance dose should be halved. And for patients with severe renal dysfunction (eGFR ≤ 30 mL/min/1.73 m2), the maintenance dose should be a third.34 In contrast, the simulation results in the present study showed that the above dose regimen was insufficient especially for deep-seated infections. The possible reason is the pathophysiological changes which caused by critical disease. Higher dose regimen (15 mg/kg or 1000 mg) was recommended to achieve the target Cmin range of 15–30 mg/L for patients with normal renal function (eGFR > 100 mL/min/1.73 m2) in previously reported models, which was not clinically applicable.5,30 Hence, in the present study, we set the target Cmin of 15 mg/L for deep-seated infections. Increasing the administration times of loading doses was usually preferred for clinician.
Our study has several limitations need to be considered. Firstly, this analysis was based on data obtained in a single center of critically ill patients. The results of this study were not recommended to extrapolate to any patients outside the characteristics of the studied cohort (eg with highly augmented renal function). Secondly, although the sample size was sufficient for PK study, a larger sample size may enable inclusion of more covariates. Unbound teicoplanin concentrations should be detected in future prospective studies to further confirm its influence of ALB on the PK of teicoplanin. The influence of CRRT conditions (blood flow rate, dialysate flow rate or filter information) for eGFR should also be analyzed and discussed.35 Finally, details on the type of pathogenic bacteria and actual MIC values of teicoplanin were lacking. The variations of bacterial susceptibility correlated strongly with the clinical benefit of teicoplanin and should be considered in the dosing regimen.36
Conclusion
In conclusion, we successfully developed and externally validated a population PK model for teicoplanin in critically ill patients. We identified that eGFR was the significant covariate influencing teicoplanin clearance and performed the dosing simulations. The simulations revealed the standard dosage regimen (400 mg q12h×3, 400 mg qd) was only enough for most infections in patients with severe renal dysfunction (eGFR ≤ 30 mL/min/1.73 m2). Dose individualization based on the renal function and types of infection was necessary to guarantee the target Cmin for the critically ill patients. In the meantime, therapeutic drug monitoring is recommended for these patients. Our findings provided guidance for the clinical efficacy of teicoplanin.
Ethical Approval
This study protocol, including sampling, was approved by the Research Ethics Committee of the Guangdong Provincial People’s Hospital. All patients provided signed informed consent. This study was performed following the guidelines of the Helsinki Declaration.
Acknowledgments
We thank all study participants and clinical staff involved in this study.
Funding
Author Chunbo Chen is currently receiving a grant (201803010058) from the Guangzhou Science and Technology Program, a grant (82172162) from the National Natural Science Foundation of China, and a grant (DFJH2020028) under the Major Program of Summit Project, Guangdong Province High-level Hospital Construction Project of Guangdong Provincial People’s Hospital, Guangdong Academy of Medical Sciences. Author Xipei Wang is currently receiving a grant (202102080011) from the Science and Technology Program of Guangzhou, the grants (82070254 and 82170415) from the National Natural Science Foundation of China and a grant (2021A1515011554) from the Natural Science Foundation of Guangdong.
Disclosure
The authors declare that there are no conflicts of interest in this work.
References
1. Wang S, Lin F, Ruan J, et al. Pharmacokinetics of multiple doses of teicoplanin in Chinese elderly critical patients. Expert Rev Clin Pharmacol. 2018;11(5):537–541. doi:10.1080/17512433.2018.1449107
2. Kasai H, Tsuji Y, Hiraki Y, et al. Population pharmacokinetics of teicoplanin in hospitalized elderly patients using cystatin C as an indicator of renal function. J Infect Chemother. 2018;24(4):284–291. doi:10.1016/j.jiac.2017.12.002
3. Svetitsky S, Leibovici L, Paul M. Comparative efficacy and safety of vancomycin versus teicoplanin: systematic review and meta-analysis. Antimicrob Agents Chemother. 2009;53(10):4069–4079. doi:10.1128/AAC.00341-09
4. Roberts JA, Stove V, De Waele JJ, et al. Variability in protein binding of teicoplanin and achievement of therapeutic drug monitoring targets in critically ill patients: lessons from the DALI Study. Int J Antimicrob Agents. 2014;43(5):423–430. doi:10.1016/j.ijantimicag.2014.01.023
5. Ogami C, Tsuji Y, Muraki Y, et al. Population pharmacokinetics and pharmacodynamics of teicoplanin and C-reactive protein in hospitalized patients with gram-positive infections. Clin Pharmacol Drug Dev. 2020;9(2):175–188. doi:10.1002/cpdd.684
6. Ueda T, Takesue Y, Nakajima K, et al. Enhanced loading regimen of teicoplanin is necessary to achieve therapeutic pharmacokinetics levels for the improvement of clinical outcomes in patients with renal dysfunction. Eur J Clin Microbiol Infect Dis. 2016;35(9):1501–1509. doi:10.1007/s10096-016-2691-z
7. Li H, Gao L, Zhou L, et al. Optimal teicoplanin loading regimen to rapidly achieve target trough plasma concentration in critically ill patients. Basic Clin Pharmacol Toxicol. 2020;126(3):277–288. doi:10.1111/bcpt.13338
8. Lee CH, Tsai CY, Li CC, et al. Teicoplanin therapy for MRSA bacteraemia: a retrospective study emphasizing the importance of maintenance dosing in improving clinical outcomes. J Antimicrob Chemother. 2015;70(1):257–263. doi:10.1093/jac/dku335
9. Wilson AP. Clinical pharmacokinetics of teicoplanin. Clin Pharmacokinet. 2000;39(3):167–183. doi:10.2165/00003088-200039030-00001
10. Ogawa R, Kobayashi S, Sasaki Y, et al. Population pharmacokinetic and pharmacodynamic analyses of teicoplanin in Japanese patients with systemic MRSA infection. Int J Clin Pharmacol Ther. 2013;51(5):357–366. doi:10.5414/CP201739
11. Seki M, Yabuno K, Miyawaki K, et al. Loading regimen required to rapidly achieve therapeutic trough plasma concentration of teicoplanin and evaluation of clinical features. Clin Pharmacol. 2012;4:71–75. doi:10.2147/CPAA.S37528
12. Matsumoto K, Kanazawa N, Watanabe E, et al. Development of initial loading procedure for teicoplanin in critically ill patients with severe infections. Biol Pharm Bull. 2013;36(6):1024–1026. doi:10.1248/bpb.b12-00911
13. Nakamura A, Takasu O, Sakai Y, et al. Development of a teicoplanin loading regimen that rapidly achieves target serum concentrations in critically ill patients with severe infections. J Infect Chemother. 2015;21(6):449–455. doi:10.1016/j.jiac.2015.02.002
14. Chen CY, Xie M, Gong J, et al. Population pharmacokinetic analysis and dosing regimen optimization of teicoplanin in critically ill patients with sepsis. Front Pharmacol. 2023;14:1132367. doi:10.3389/fphar.2023.1132367
15. Hagihara M, Umemura T, Kimura M, et al. Exploration of optimal teicoplanin dosage based on pharmacokinetic parameters for the treatment of intensive care unit patients infected with methicillin-resistant Staphylococcus aureus. J Infect Chemother. 2012;18(1):10–16. doi:10.1007/s10156-011-0272-8
16. Huttner A, Von Dach E, Renzoni A, et al. Augmented renal clearance, low β-lactam concentrations and clinical outcomes in the critically ill: an observational prospective cohort study. Int J Antimicrob Agents. 2015;45(4):385–392. doi:10.1016/j.ijantimicag.2014.12.017
17. Sako KI, Nakamaru Y, Ikawa K, et al. Population pharmacokinetics of teicoplanin and its dosing recommendations for neutropenic patients with augmented renal clearance for hematological malignancies. Ther Drug Monit. 2021;43(4):519–526. doi:10.1097/FTD.0000000000000906
18. Wang X, Wang Y, Yao F, et al. Pharmacokinetics of linezolid dose adjustment for creatinine clearance in critically ill patients: a multicenter, prospective, open-label, observational study. Drug Des Devel Ther. 2021;15:2129–2141. doi:10.2147/DDDT.S303497
19. Hou Y, Deng Y, Hu L, et al. Assessment of 17 clinically available renal biomarkers to predict acute kidney injury in critically ill patients. J Transl Int Med. 2021;9(4):273–284. doi:10.2478/jtim-2021-0047
20. Levey AS, Stevens LA, Schmid CH, et al. A new equation to estimate glomerular filtration rate. Ann Intern Med. 2009;150(9):604–612. doi:10.7326/0003-4819-150-9-200905050-00006
21. Chae H, Lee JJ, Cha K, et al. Measurement of teicoplanin concentration with liquid chromatography-tandem mass spectrometry method demonstrates the usefulness of therapeutic drug monitoring in hematologic patient populations. Ther Drug Monit. 2018;40(3):330–336. doi:10.1097/FTD.0000000000000498
22. Comets E, Brendel K, Mentré F. Computing normalised prediction distribution errors to evaluate nonlinear mixed-effect models: the npde add-on package for R. Comput Methods Programs Biomed. 2008;90(2):154–166. doi:10.1016/j.cmpb.2007.12.002
23. Yamada T, Nonaka T, Yano T, et al. Simplified dosing regimens of teicoplanin for patient groups stratified by renal function and weight using Monte Carlo simulation. Int J Antimicrob Agents. 2012;40(4):344–348. doi:10.1016/j.ijantimicag.2012.05.025
24. Hanai Y, Takahashi Y, Niwa T, et al. Clinical practice guidelines for therapeutic drug monitoring of teicoplanin: a consensus review by the Japanese Society of Chemotherapy and the Japanese Society of Therapeutic Drug Monitoring. J Antimicrob Chemother. 2022;77(4):869–879. doi:10.1093/jac/dkab499
25. Fu WQ, Tian TT, Zhang MX, et al. Population pharmacokinetics and dosing optimization of unbound teicoplanin in Chinese adult patients. Front Pharmacol. 2022;13:1045895. doi:10.3389/fphar.2022.1045895
26. Li N, Zhu L, Xu G, et al. Optimal teicoplanin dosage regimens for methicillin-resistant Staphylococcus aureus infections in endocarditis patients and renal failure patients. J Chemother. 2017;29(6):358–364. doi:10.1080/1120009X.2017.1334031
27. Chen J, Li S, Wang Q, et al. Optimizing antimicrobial dosing for critically ill patients with MRSA infections: a new paradigm for improving efficacy during continuous renal replacement therapy. Pharmaceutics. 2022;14(4):842. doi:10.3390/pharmaceutics14040842
28. Lim SK, Lee SA, Kim CW, et al. High variability of teicoplanin concentration in patients with continuous venovenous hemodiafiltration. Hemodial Int. 2019;23(1):69–76. doi:10.1111/hdi.12704
29. Byrne CJ, Parton T, McWhinney B, et al. Population pharmacokinetics of total and unbound teicoplanin concentrations and dosing simulations in patients with haematological malignancy. J Antimicrob Chemother. 2018;73(4):995–1003. doi:10.1093/jac/dkx473
30. Cazaubon Y, Venisse N, Mimoz O, et al. Population pharmacokinetics of teicoplanin administered by subcutaneous or intravenous route and simulation of optimal loading dose regimen. J Antimicrob Chemother. 2017;72(10):2804–2812. doi:10.1093/jac/dkx242
31. Abdul-Aziz MH, Alffenaar JC, Bassetti M, et al. Antimicrobial therapeutic drug monitoring in critically ill adult patients: a position paper. Intensive Care Med. 2020;46(6):1127–1153. doi:10.1007/s00134-020-06050-1
32. Brink AJ, Richards GA, Cummins RR, et al. Recommendations to achieve rapid therapeutic teicoplanin plasma concentrations in adult hospitalised patients treated for sepsis. Int J Antimicrob Agents. 2008;32(5):455–458. doi:10.1016/j.ijantimicag.2008.05.012
33. Byrne CJ, Roberts JA, McWhinney B, et al. Population pharmacokinetics of teicoplanin and attainment of pharmacokinetic/pharmacodynamic targets in adult patients with haematological malignancy. Clin Microbiol Infect. 2017;23(9):674.e7–674.e13. doi:10.1016/j.cmi.2017.02.032
34. Pea F, Brollo L, Viale P, et al. Teicoplanin therapeutic drug monitoring in critically ill patients: a retrospective study emphasizing the importance of a loading dose. J Antimicrob Chemother. 2003;51(4):971–975. doi:10.1093/jac/dkg147
35. Breilh D, Honore PM, De BD, et al. Pharmacokinetics and pharmacodynamics of anti-infective agents during continuous veno-venous hemofiltration in critically ill patients: lessons learned from an ancillary study of the IVOIRE trial. J Transl Int Med. 2019;7(4):155–169. doi:10.2478/jtim-2019-0031
36. Lodise TP, Graves J, Evans A, et al. Relationship between vancomycin MIC and failure among patients with methicillin-resistant Staphylococcus aureus bacteremia treated with vancomycin. Antimicrob Agents Chemother. 2008;52(9):3315–3320. doi:10.1128/AAC.00113-08
 © 2023 The Author(s). This work is published and licensed by Dove Medical Press Limited. The full terms of this license are available at https://www.dovepress.com/terms.php and incorporate the Creative Commons Attribution - Non Commercial (unported, v3.0) License.
By accessing the work you hereby accept the Terms. Non-commercial uses of the work are permitted without any further permission from Dove Medical Press Limited, provided the work is properly attributed. For permission for commercial use of this work, please see paragraphs 4.2 and 5 of our Terms.
© 2023 The Author(s). This work is published and licensed by Dove Medical Press Limited. The full terms of this license are available at https://www.dovepress.com/terms.php and incorporate the Creative Commons Attribution - Non Commercial (unported, v3.0) License.
By accessing the work you hereby accept the Terms. Non-commercial uses of the work are permitted without any further permission from Dove Medical Press Limited, provided the work is properly attributed. For permission for commercial use of this work, please see paragraphs 4.2 and 5 of our Terms.