Back to Journals » Diabetes, Metabolic Syndrome and Obesity » Volume 15
Optical Coherence Tomography Angiography Biomarkers Predict Anatomical Response to Bevacizumab in Diabetic Macular Edema
Authors Elnahry AG ![]() , Noureldine AM, Abdel-Kader AA, Sorour OA, Ramsey DJ
, Noureldine AM, Abdel-Kader AA, Sorour OA, Ramsey DJ ![]()
Received 29 November 2021
Accepted for publication 25 January 2022
Published 9 February 2022 Volume 2022:15 Pages 395—405
DOI https://doi.org/10.2147/DMSO.S351618
Checked for plagiarism Yes
Review by Single anonymous peer review
Peer reviewer comments 4
Editor who approved publication: Professor Ming-Hui Zou
Ayman G Elnahry,1 Alia M Noureldine,1 Ahmed A Abdel-Kader,1 Osama A Sorour,2 David J Ramsey3
1Department of Ophthalmology, Faculty of Medicine, Cairo University, Cairo, Egypt; 2Department of Ophthalmology, Faculty of Medicine, Tanta University, Tanta, Egypt; 3Division of Ophthalmology, Lahey Hospital & Medical Center, Tufts University School of Medicine, Boston, MA, USA
Correspondence: Ayman G Elnahry
Department of Ophthalmology, Faculty of Medicine, Cairo University, Cairo, 11956, Egypt
, Tel +20 1224927604
, Fax +20 223682030
, Email [email protected]
Purpose: To identify biomarkers that may predict an early anatomical response to the treatment of diabetic macular edema (DME) with intravitreal bevacizumab (IVB) by means of optical coherence tomography angiography (OCTA).
Methods: This study is a retrospective study of treatment-naïve patients with DME who underwent 6 × 6 mm OCTA imaging of the macula at baseline and after three monthly IVB injections. Thirty-six eyes of 23 patients were included. Eyes that demonstrated evidence of an early anatomical response, consisting of a > 10% decrease in central macular thickness (CMT) (n = 18), were compared with those eyes that failed to show such an improvement (n = 18).
Results: At baseline, early-response eyes had worse starting best-corrected visual acuity (BCVA, LogMAR 0.84 ± 0.41 versus LogMAR 0.51 ± 0.15, p = 0.004) and a larger CMT (490 ± 135 μm versus 356 ± 33 μm, p = 0.001), but smaller foveal avascular zones (FAZ) (0.309 ± 0.098mm versus 0.413 ± 0.095 mm, p = 0.003) compared with eyes that proved refractory to three monthly injections of IVB. The vascular density (VD) in both the foveal superficial and deep capillary plexuses was significantly greater in eyes that showed an early-treatment response compared with eyes that were non-responders (24.86 ± 6.90% versus 19.98 ± 7.13%, p = 0.045 and 32.30 ± 4.88% versus 26.95 ± 7.25%, p = 0.028, respectively). Early-treatment response to IVB was predicted by starting CMT (r2= 0.266, p = 0.001), FAZ size (r2= 0.234, p = 0.003), and VD in the superficial parafovea (r2= 0.217, p = 0.004) and deep fovea (r2= 0.157, p = 0.037).
Conclusion: Projection-resolved OCTA may be useful in predicting an early anatomical response of DME to treatment with IVB.
Keywords: anti-VEGF agents, bevacizumab, biomarkers, diabetic macular edema, macular ischemia, macular perfusion, optical coherence tomography angiography
Introduction
The worldwide prevalence of diabetes mellitus (DM) is rapidly increasing, and it is currently estimated that roughly 440 million people globally will have DM by the year 2030.1 In the USA, DM is reported to be the leading cause of blindness in people between the ages of 20 and 74.2 Approximately 29% of the diabetic adults have diabetic retinopathy (DR), while 3% have diabetic macular edema (DME).3 In Egypt, the prevalence of DM has almost tripled in the last two decades,4 and a study of Egyptian diabetic patients revealed that nearly 42% had some degree of DR, and 5% were legally blind.5
DME is the most common cause of vision loss attributable to DM. Intravitreal injections of agents targeting the cytokine vascular endothelial growth factor (VEGF) have become the first line of treatment for DME patients.6,–8 However, not all patients with DME respond equally well to anti-VEGF injections, and some agents are costlier than others.6–9 Identifying which patients are at risk of a delayed or poor response to treatment may help manage treatment expectations and prepare clinicians for the need to consider alternative therapies.9–11
Optical coherence tomography (OCT) imaging has been used to identify several biomarkers proposed as being predictive of a functional and anatomical response of patients with DME to anti-VEGF treatment, including the presence of disorganization of the inner layers of the retina12 and the morphological pattern of DME.13 Optical coherence tomography angiography (OCTA) is a relatively new extension of OCT that generates non-invasive, depth-resolved images of the retinal microvasculature. This allows for the detection of various features of DR including size of the foveal avascular zone (FAZ), vascular density (VD) of the superficial (SCP) and deep capillary plexuses (DCP), and extent of retinal nonperfusion.14,15 Recent studies have shown an association between several OCTA-derived parameters and the functional and anatomical response of patients with DME to anti-VEGF treatment, including a larger FAZ area and lower VD measurements in patients who show a poor anatomical response.16,17 However, some of these studies used older OCTA software with outdated segmentation boundaries and minimal projection artifact removal.16,18,19 This makes it difficult to compare these published results to current OCTA studies and limits their applicability to the treatment of patients with DR in clinical practice. The present study uses up-to-date OCTA software with projection artifact removal to identify potential OCTA biomarkers that may be predictive of an early anatomical response to intravitreal bevacizumab (IVB) injections in treatment-naïve eyes with DME.
Methods
This study is a retrospective analysis of treatment naïve patients with DM that underwent three consecutive monthly IVB for the treatment of DME. Only patients who completed OCTA imaging within 10 days of the first injection and around 1 month after the third injection are included. Patients were treated in the retina clinic of Cairo University between June 2018 and September 2019. The research adhered to the tenets of the Declaration of Helsinki and was approved by the institutional review board of Cairo University. Criterion for the inclusion of patients was best-corrected visual acuity (BCVA) below 6/9 (20/30) with evidence of DME (central macular thickness [CMT] >275 µm based on studies in Egyptian patients with DM)14 at baseline. Exclusion criteria included those eyes with significant media opacities, history of other retinal diseases that could impact the results of imaging of the retinal vasculature such as retinal vein occlusions, central serous chorioretinopathy, myopic degeneration, history of glaucoma or uveitis, presence of an epiretinal membrane, or vitreomacular traction syndrome. No subject had any prior history of intravitreal injections, macular laser treatment, or vitreoretinal surgery, and no other treatments were administered during the study.
A retina specialist reviewed the charts and extracted demographic and clinical data related to ocular health and diabetic retinopathy diagnosis, severity, and treatment. Severity of diabetes was based on ICD-10-CM codes. The HbA1c value was used as an indicator of the severity of diabetes. Patients were assessed at each time point by Snellen visual acuity (VA) and central retinal thickness, as well as VD by means of spectral domain OCTA.
Acquisition of Optical Coherence Tomography Angiography
Imaging was performed within the 10 days preceding the first intravitreal injection and approximately 1 month after the third intravitreal injection of bevacizumab using AngioVue software (version 2017.1.0.149) on a RTVue XR Avanti spectral domain-OCTA system (Optovue, Inc., Fremont, CA). The macula was imaged for each eye by acquiring a scanning area of 6 × 6 mm centered on the fovea. The SCP and DCP were segmented by using the built-in OCTA software, as previously described.20 Eyes were excluded if there was a low signal strength index (SSI; <5), blink artifacts, poor fixation resulting in motion or image doubling artifacts, localized loss of signal from media opacities, or major segmentation errors. Minor segmentation errors were manually corrected by using the built-in machine software with the corresponding structural OCT B-scans as a guide.
Treatment Response
Eyes were divided into two groups based on their anatomical response to IVB injections. Eyes demonstrating a >10% decrease in CMT after three monthly injections of IVB treatment were considered to have evidence of an early anatomical response to treatment and were compared to those eyes that failed to show such improvement or had a worsening of their CMT despite treatment.21,22 Various OCTA biomarkers were compared between both groups at baseline and following three monthly injections of IVB.
Analysis of OCTA Images
Automated VD measurements for the SCP and DCP were obtained before and after the three injections of IVB by using the built-in Early Treatment Diabetic Retinopathy Study (ETDRS) map, which was manually centered on the foveal avascular zone (FAZ) and divided the macula into nine areas. VD was defined as the total number of pixels occupied by blood vessels within an area divided by the total number of pixels in that area multiplied by 100. Other automated measurements, including whole-image vascularity (VD in the whole 6 × 6 mm image) and total parafoveal and perifoveal VD were also directly obtained from the machine. The changes in values 1 month after the third injection were calculated. A single investigator who was blinded to the treatment response (A.G.E) manually measured the FAZ area by means of ImageJ (National Institutes of Health, Bethesda, Maryland) using the full retinal thickness image before and after the three injections for each group.
Statistical Analysis
SPSS® Statistics version 22.0 (IBM Corp, Armonk, NY) was used to analyze data. Data are presented as mean (± SD) for continuous variables. For the analysis, visual acuities were transformed from presenting Snellen acuities to a log minimum angle of resolution (LogMAR) scale. After testing normality with Shapiro–Wilk test, normally distributed data were analyzed and compared by means of the Student’s t-test, while non-parametric Mann–Whitney U and Wilcoxon Signed Ranks tests were used for analyzing and comparing non-normally distributed data. The chi-square test was used to analyze categorical data. The relationship between VD and each ocular parameter was assessed by univariate linear regression analysis. Significance of the obtained results was judged at the 5% level (p < 0.05). A multiple regression analysis was performed to create a predictive model for factors related to early treatment response. A nonlinear, weighted least-squares model was used to construct a receiver operator characteristic (ROC) curve. The ROC curve was obtained by plotting sensitivity against 1 – specificity, calculated for each value observed. The area under the ROC curve (AUC) was used to compare the performance of the parameters used to segregate eyes with a treatment response from those that displayed stable or worse conditions.
Results
Thirty-nine eyes of 25 patients with DME that received three monthly anti-VEGF injections of bevacizumab were identified. However, three of the eyes from two patients had excessive imaging artifacts and/or insufficient signal strength necessitating their exclusion. This left 36 eyes of 23 patients for inclusion in the final analysis of the study. Twenty of these eyes were in female patients (56%). The mean age of the patients was 54.4 (± 6.7) years. Five eyes from three patients had Type 1 diabetes (14%). Two eyes were pseudophakic (6%). Eighteen of these eyes from 14 patients were found to have an early treatment response, while 18 eyes from 13 patients showed no improvement or even worsened (three eyes, 17%) after treatment with IVB. Four patients each had an eye in both groups, indicating an asymmetric response to treatment. No patient had an increase in retinopathy severity level, laser, or other ophthalmic treatments over the course of the study. During follow-up, no ocular or systemic side effects were observed that could be attributed to intravitreal injections. Additional characteristics of the study population are presented in Table 1. There were no demographic differences between early response and treatment refractory eyes.
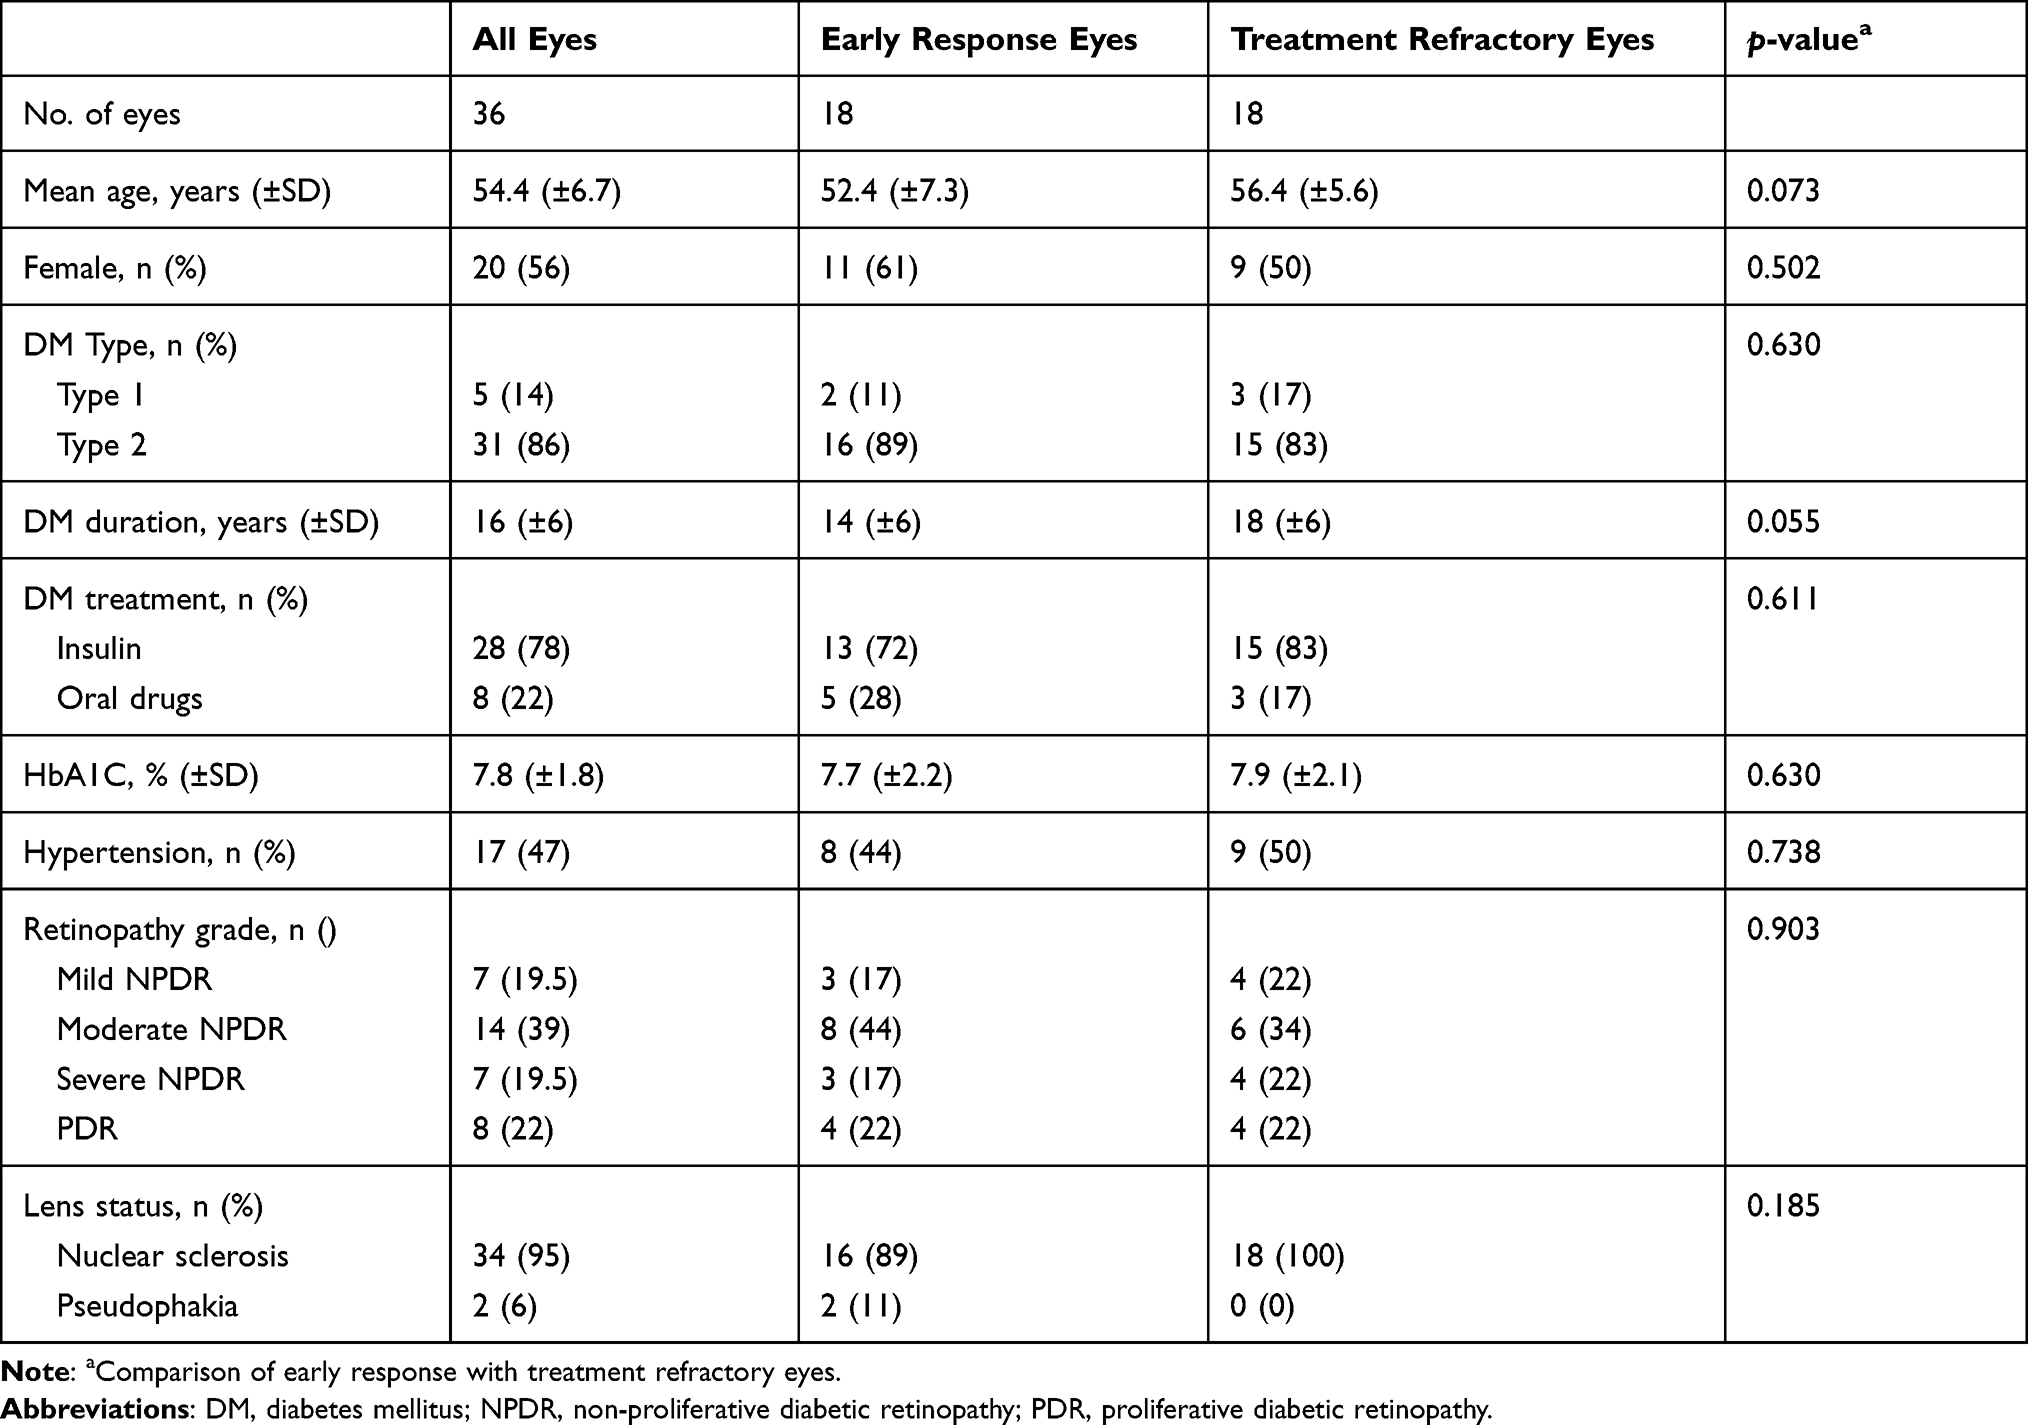 |
Table 1 Baseline Demographic Characteristics |
Visual and Anatomical Outcomes
After treatment with three IVB injections, there was an improvement in both BCVA (∆LogMAR −0.21 ± 0.27, p < 0.001) and CMT (∆CMT −89 ± 137 µm, p < 0.001) (Table 2). However, not all eyes responded equally well to treatment. Eyes with an early anatomical response gained significantly more acuity compared with eyes that showed no anatomical improvement or even worsened after treatment with IVB (∆LogMAR −0.35 ± 0.32 versus ∆LogMAR −0.07 ± 0.07, p < 0.0001). At the same time, early response eyes had worse starting visual acuity compared with their counterparts (LogMAR 0.84 ± 0.41 versus LogMAR 0.51 ±0.15, p = 0.003), and larger starting CMTs (490 ± 135 µm versus 353 ± 70 µm, p = 0.018), which may have partially accounted for the larger changes observed (Table 3). The baseline FAZ was also smaller in eyes that responded early (0.309 ±0.098 mm2 versus 0.413 ± 0.095 mm2, p = 0.003) and the baseline VD was greater in the fovea of these patients (SCP 24.86 ± 6.9% versus 19.98 ± 7.1% [p = 0.045], and DCP 32.30% ± 4.88% versus 26.95 ± 7.25% [p = 0.028]). Finally, the VD of the superior parafovea of the SCP, which has been suggested to be an important biomarker for DR and its progression,17,23 was also denser among the eyes in the early response group (44.14% ± 6.08% versus 38.22% ± 5.47%, p = 0.004). Interestingly, these initial differences in the FAZ size and in some of the VD measurements on OCTA resolved between the two groups after treatment; however, some differences in VD measurements between both groups, such as the total and temporal parafoveal VD, persisted (Table 3). The magnitude of the effect of the three IVB injections on OCTA parameters was also different between the groups (Supplementary Table S1).
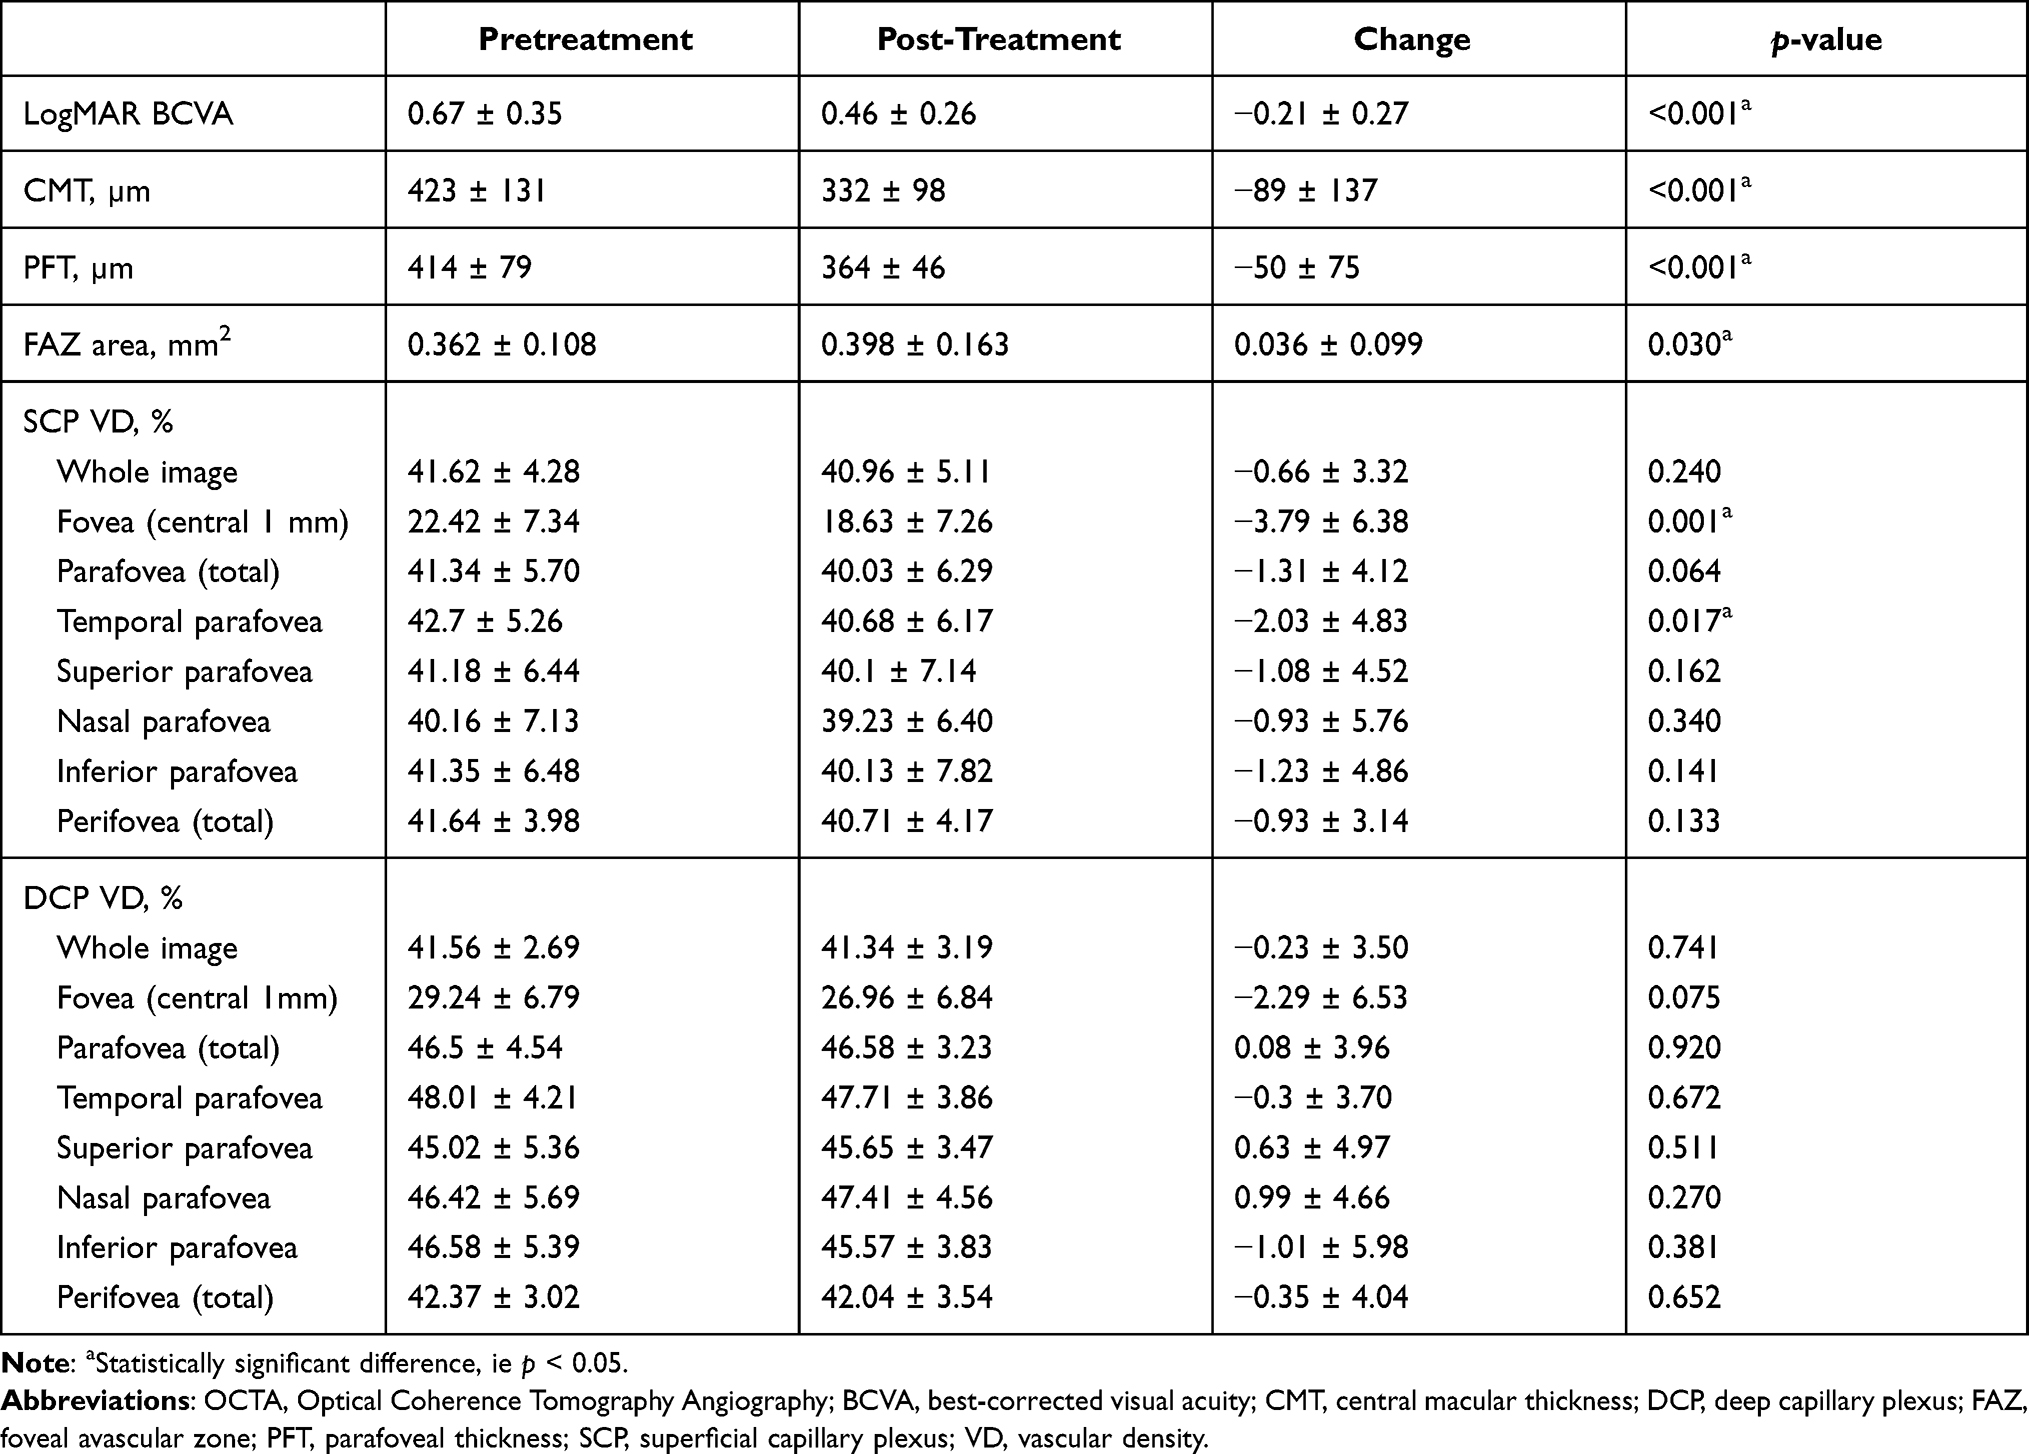 |
Table 2 Comparison of Pretreatment and Post-Treatment OCTA Metrics in All Included Eyes |
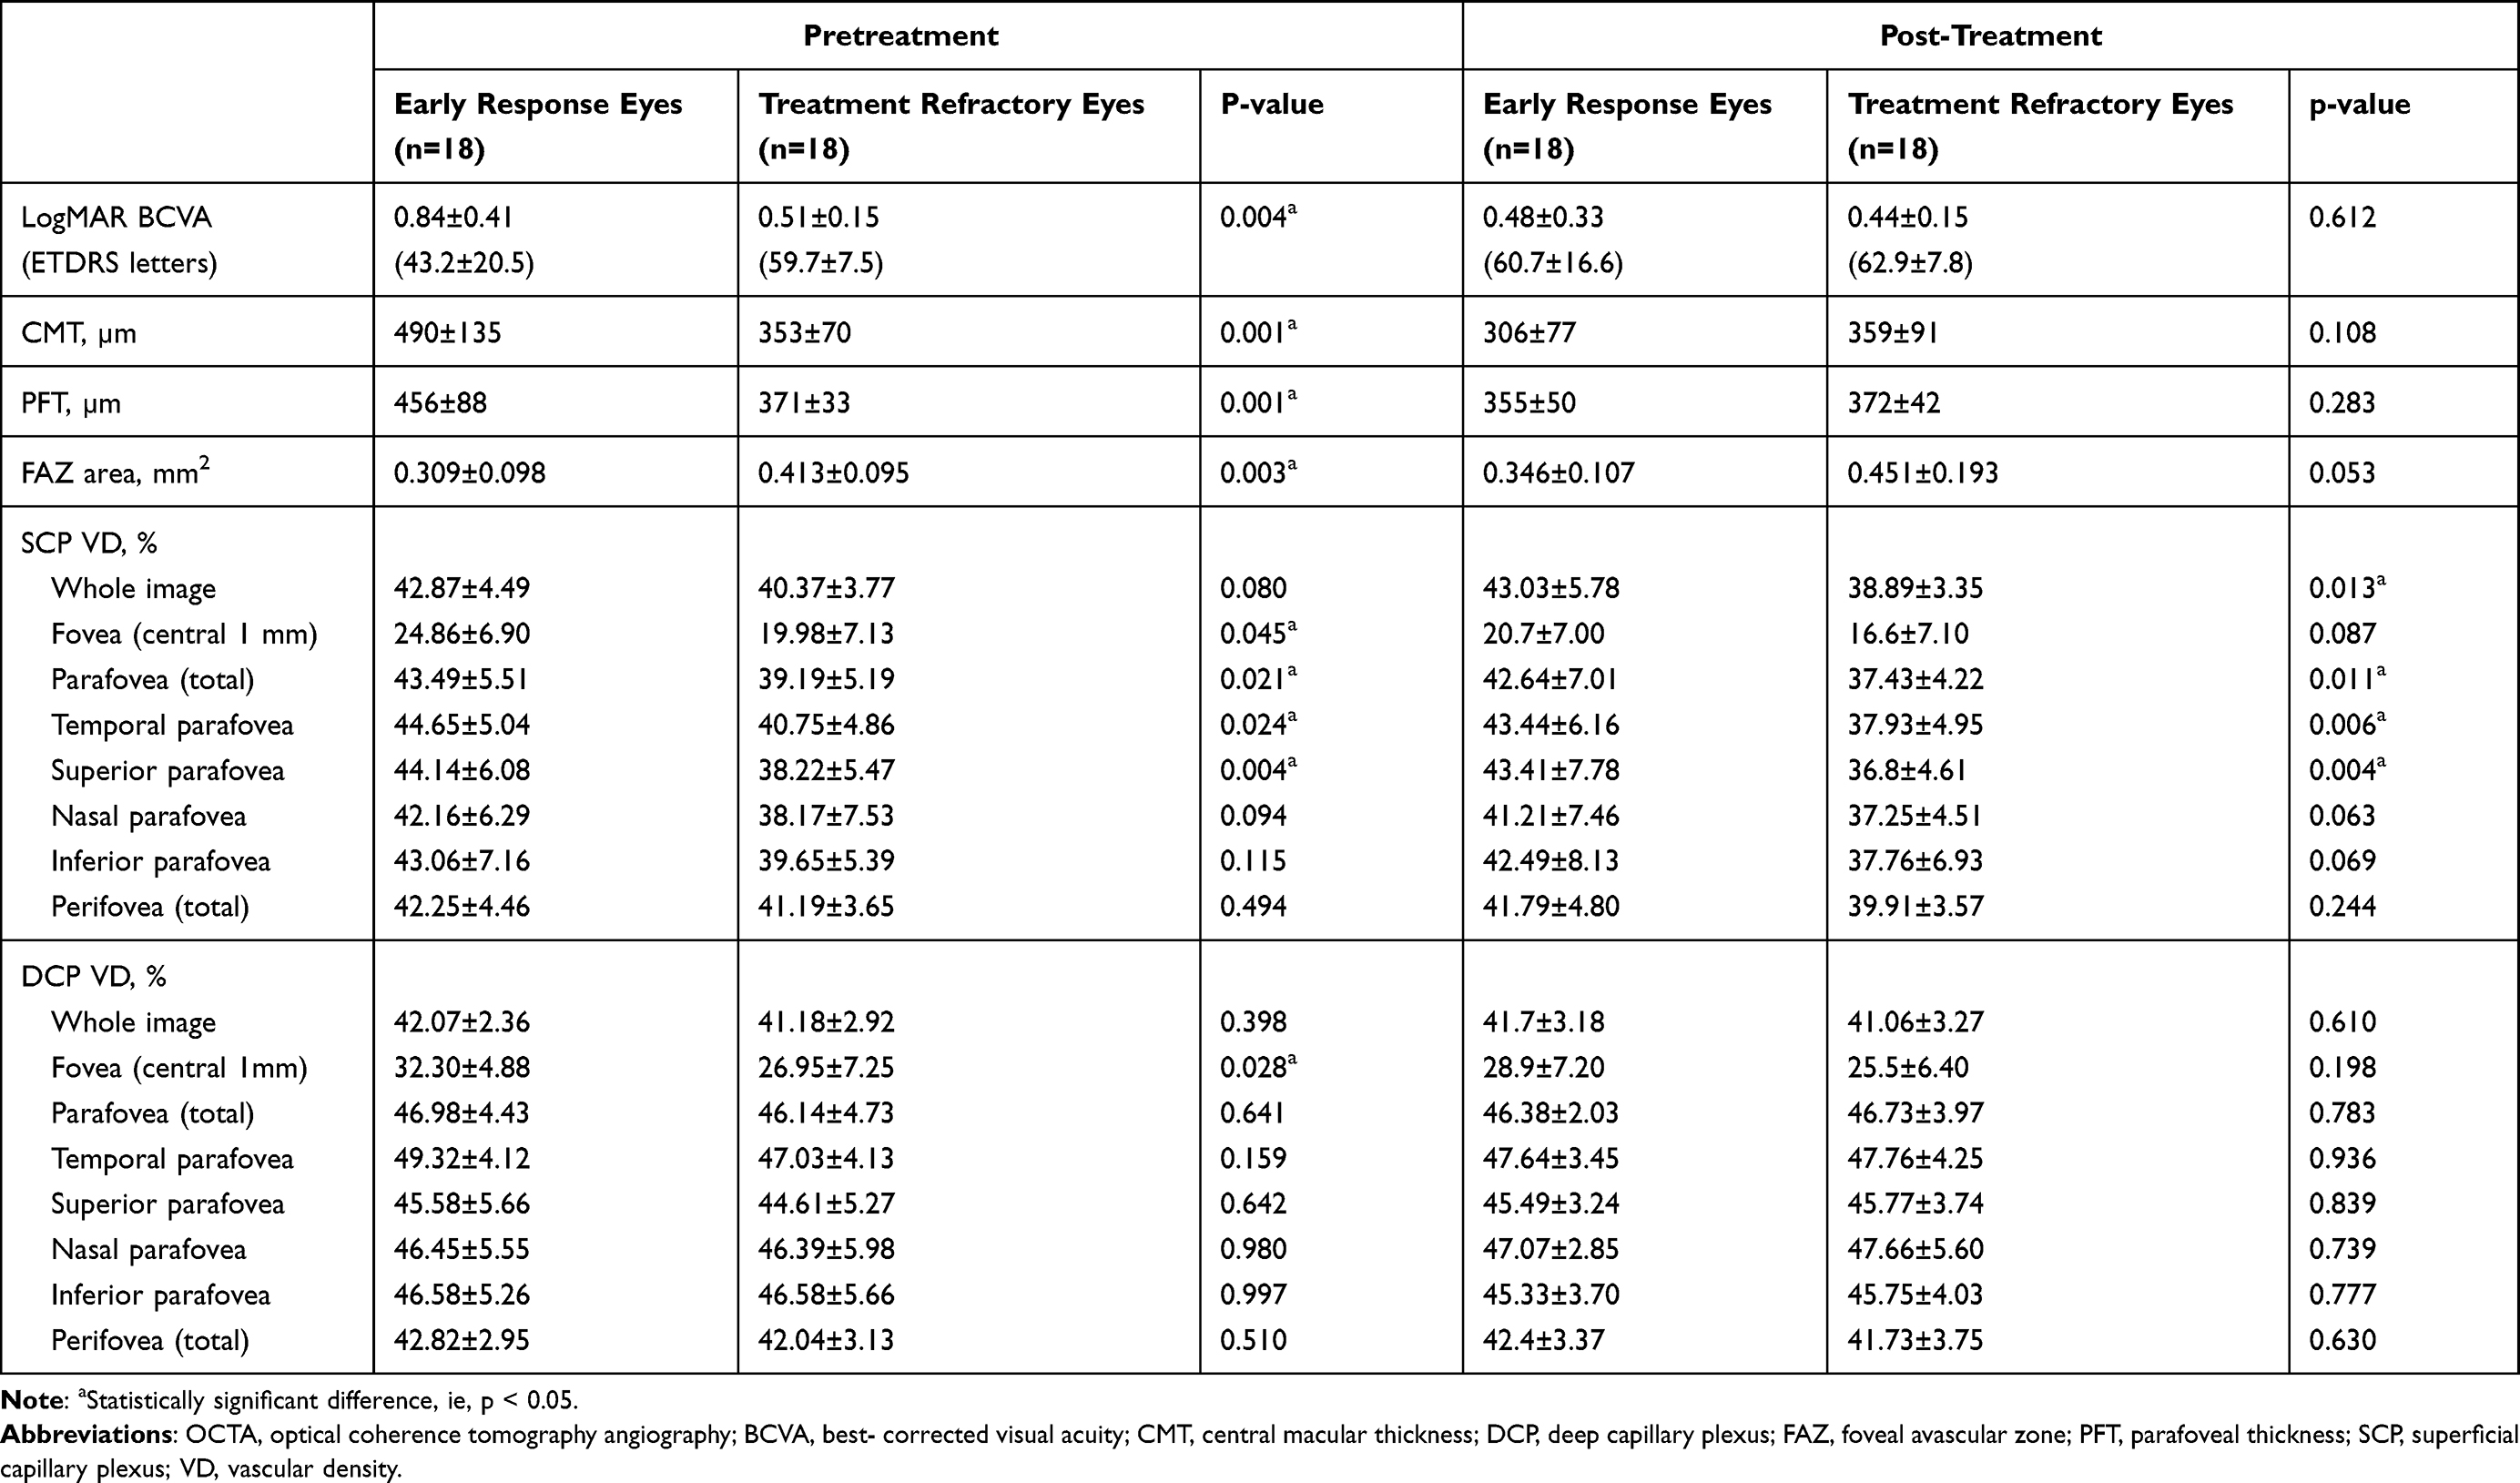 |
Table 3 Comparison of Pretreatment and Post-Treatment OCTA Metrics Between Groups |
Factors Related to Early Response to Bevacizumab
Several OCTA metrics demonstrated a significant correlation with ∆CMT in response to three monthly injections of IVB. Starting CMT was the strongest predictor of a decrease in CMT (r2 = 0.362, p < 0.0001). VD in the superior parafovea of the SCP (r2 = 0.198, p = 0.007) and fovea of the DCP (r2 = 0.283, p = 0.034), as well as FAZ size (r2 = 0.120, p = 0.038), all showed weak correlations with ∆CMT. Several variables also correlated with early treatment response as defined in our study. Starting CMT (r2 = 0.266, p = 0.001), FAZ size (r2 = 0.234, p = 0.003), and the VD in the superior parafovea of the SCP (r2 = 0.217, p = 0.004) and fovea in the DCP (r2 = 0.157, p = 0.037) all showed weak correlations. Finally, visual outcome was correlated with starting CMT (r2 = 0.154; p = 0.018) and ∆CMT in univariate analysis (r2 = 0.221; p = 0.004), but not VD or FAZ on OCTA. Univariate analysis for eyes in the study population failed to find an association of ∆CMT with several other factors including age, gender, lens status, and the type and severity of diabetes.
Hierarchical regression was used to assess variables that might influence treatment outcome. Adding the superior parafoveal SCP VD on OCTA to the starting CMT increased the prediction of ∆CMT to adjusted r2 = 0.480 (∆r2 = 0.118, p = 0.010). Similarly, adding the total parafoveal SCP VD on OCTA to the starting CMT increased the prediction of early treatment response to IVB to adjusted r2 = 0.411 (∆r2 = 0.145, p = 0.008). Age, gender, starting visual acuity, type, and severity of diabetes were excluded owing to a lack of significant unique predictive ability in the stepwise regression. Multivariate analysis did not identify any variables that increased prediction of ∆BCVA beyond CMT.
The diagnostic performance of each of the individual variables was evaluated using ROC curve analysis to determine its capacity to predict early anatomical response to treatment with intravitreal bevacizumab. The ROC curve was used to identify the best starting CMT and parafoveal SCP VD cutoff point that maximized sensitivity and specificity for this discrimination. Figure 1 illustrates the AUC of starting CMT with and without the parafoveal SCP VD. The ROC curve for starting CMT predicting an early treatment response (AUC, 0.724; 95% CI, 0.640 to 0.807; p = 0.05) was improved significantly by the additional factor of parafoveal SCP VD included in the full predictive model (AUC, 0.887; 95% CI, 0.830 to 0.943; p < 0.001). For our study population, the full model showed a sensitivity of 86.67% (95% CI, 59.54% to 98.34%) and specificity of 76.19% (95% CI, 52.83% to 91.78%), with a positive predictive value of 72.22% (95% CI, 54.12% to 85.14%) and negative predictive value of 88.89% (95% CI, 68.29% to 96.74%). The overall accuracy of the model was 80.56% (95% CI, 63.98% to 91.81%; p < 0.001).
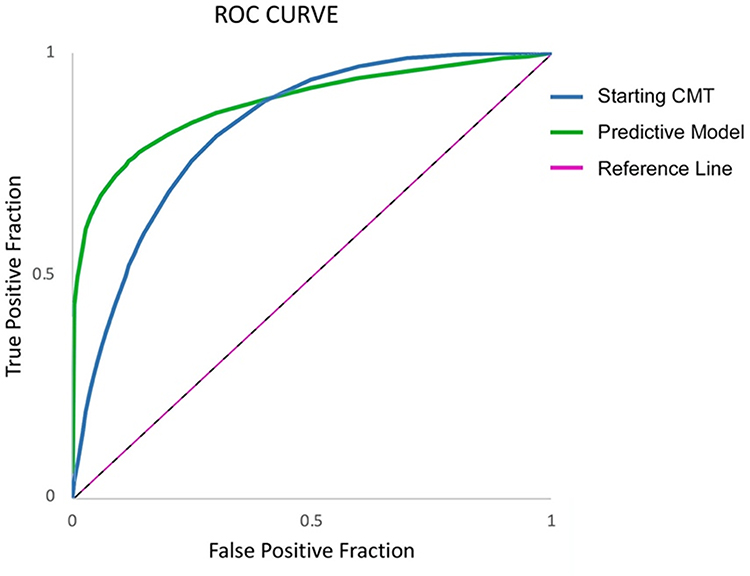 |
Figure 1 Comparison of area under receiver operating characteristic curve between the starting CMT (blue) versus the full predictive model (green) for discriminating eyes with an early treatment response from those without. |
Discussion
Our study demonstrates that OCTA features may predict an early anatomical response in treatment-naïve eyes that receive IVB for DME. Eyes that have a decrease in CMT after three IVB injections gain more vision as opposed to those that fail to improve, or even worsen, on treatment. Although starting CMT is the strongest predictor of both anatomical and visual response,24 our study shows that OCTA-derived vascular parameters independently predict the likelihood that macular edema will improve when treated with IVB. This is important because irreversible structural damage may take place when swelling is inadequately managed. Identifying eyes that are unlikely to respond to IVB could prompt clinicians to choose alternative anti-VEGF agents, or use intravitreal steroids or focal laser treatment instead. When compared with eyes that demonstrated an initial anatomical response, our study shows that eyes poorly responsive to three initial IVB injections often have worse baseline and post-treatment VD measurements, especially at the level of the superior parafovea of the SCP, as measured by projection-resolved OCTA (Table 3). This indicates that eyes that fail to respond to IVB may have more macular ischemia at the outset of treatment. This may result from the production of higher levels of VEGF leading to incomplete inhibition by anti-VEGF treatment and persistence of DME.25,26
Up to 50% of the eyes with DME do not respond fully to treatment with anti-VEGF agents, necessitating adjuvant therapies to manage the condition.27 Although a large fraction of eyes in our study failed to respond initially to IVB, this is similar to the rate described in some previous studies16 but is higher than the rate reported in randomized clinical trials for DME. For example, only 10% of the eyes in RISE and RIDE Studies showed a similar limited initial anatomical response to ranibizumab.21 Despite bevacizumab being the parent molecule of ranibizumab, which is a recombinant humanized monoclonal antigen-binding fragment, these differences in efficacy may be caused by pharmacology related to the choice of anti-VEGF agent.6,7,21 It also may be related to racial and/or ethnic variation in the treatment response or underlying severity of diabetes and its management in different populations.5 Understanding and predicting the response to therapy specific to the population being treated is important for managing both the patient’s and provider’s expectations of potential outcomes. In certain cases, this information might lead to initiating a different form of treatment or even a decision to forgo treatment altogether in certain patients for whom the burden of injections and their costs outweigh the expected visual gains.9
A few recent studies have analyzed the association of OCTA parameters with the response of DME to anti-VEGF treatment. These studies have identified the FAZ and/or VD as predictive of visual17,28 or structural16 outcomes. However, several of these studies16,28 employed software with outdated automated segmentation boundaries for the SCP and DCP, and also did not remove projection artifacts which may have substantially influenced DCP measurements.18,19 Flow projection artifacts result from flickering shadows of superficial blood flow projected onto deeper retinal layers that are erroneously interpreted as flow. This results in the vascular patterns from more superficial plexuses to be duplicated on the deeper layers, which makes it impossible to obtain a clear image of the deeper vascular plexuses without software to remove projection artifacts.18,19 In our study, the removal of projection artifacts made possible a better characterization of these retinal vascular layers to predict treatment response.
Some prior studies have looked only at post-treatment OCTA metrics instead of baseline characteristics of the retina in relation to treatment outcomes.16 This limits the clinical utility of these findings as biomarkers. Other studies found that baseline OCTA metrics did not show any correlation with anatomical improvement, but nonetheless showed that baseline parafoveal VD in the SCP predicted visual improvement,17 which is similar to the findings in our study. Finally, a majority of prior OCTA studies have used the 3 × 3 mm macular scan, which only covers the parafovea.16,17,28 This precludes a direct comparison of results of these studies with ours. Nevertheless, our study found similar findings for the FAZ area and VD in the parafovea in the SCP post treatment (Table 3). We chose the 6 × 6 mm scanning protocol because this covers the entirety of the anatomical macula. In view of the fact that the VD of the parafovea, especially the VD of the superior parafovea of the SCP, proved to be the most significant metric correlated with early structural improvement, it would appear that denser scans could provide significant insight into DME, despite their more limited field of view. On the other hand, from a clinical standpoint, imaging the entire macula has the advantage of providing information relevant to monitoring clinically significant macular edema threatening to vision and alerts us to other diabetic changes such as encroaching areas of nonperfusion that may have important implications for patient management.
Previous studies have reported that FAZ size, which is more clearly delineated on OCTA than it is with other imaging methods,14,29 correlates with visual improvement with anti-VEGF treatment.28 Other studies have used OCTA to evaluate the effect of intravitreal injections of anti-VEGF agents on the FAZ size and VD measurements in the macula of patients with DME and yielded conflicting results, but these studies did not separately compare changes in responders and non-responders.17,20,30–34 In the current study, we found a significant increase in the FAZ area in eyes that showed a reduction in CMT after three IVB injections, compared with those that did not respond to treatment (Supplementary Table S1). The differential change in vascularity between eyes that showed an early treatment response, versus those that did not, could be a cause or consequence of the different anatomical response of each group, which calls for further study in a larger number of eyes.
One of the merits of our study is the inclusion of eyes without a history of prior treatments that could lead to iatrogenic vision loss, such as from the expansion of prior laser scars or progressive loss of retinal function resulting from long-term growth factor suppression related to anti-VEGF agents themselves, as has been observed in macular degeneration.35 Relying on the anatomical rather than the functional response to treatment also provides an objective, reliable, and reproducible approach to assessing treatment outcome, which is also known to correlate moderately with BCVA.22 Limitations of our study include the small number of eyes, a modest follow-up period that does not allow for assessment of eyes with a delayed response to treatment,21,36 and the inclusion of patients with differing stages of DR. Several patients had both eyes included in our study, and interestingly, four of those patients had one eye in each of the response groups, indicating that eyes of the same patient may respond differently to treatment. This should be further assessed in future studies.
Conclusion
OCTA shows promise of providing insight into the likelihood that treatment-naïve eyes with DME will demonstrate an early anatomical response to IVB. The removal of projection artifacts to allow for more accurate segmentation of the retinal vascular layers allows more accurate identification of possible biomarkers of treatment response. Our findings that the VD in the superficial parafovea and deep fovea, as well as FAZ size, uniquely predict early-treatment response to IVB support the conclusion that eyes with more severe ischemia detected by OCTA at baseline are less responsive to anti-VEGF treatment. Larger studies, preferably with longer follow-up periods, are needed to clarify the relationship between the numerous OCTA-derived vascular parameters and the response of eyes with DME to treatment. Future advances in OCTA scanning technology may further increase the ability of this non-invasive tool to predict treatment outcome based on vascular features.
Abbreviations
BCVA, best-corrected visual acuity; CMT, central macular thickness; DCP, deep capillary plexus; DM, diabetic mellitus; DME, diabetic macular edema; DR, diabetic retinopathy; FAZ, foveal avascular zone; IVB, intravitreal bevacizumab; OCTA, optical coherence tomography angiography; SCP, superficial capillary plexus; VD, vascular density; VEGF, vascular endothelial growth factor.
Data Sharing Statement
The data used in this study are available from the corresponding author upon reasonable request.
Ethics Approval and Consent to Participate
This study and report were approved by Cairo University Research Ethics Committee (Study ID: N-79-2017) and followed the tenets of the Declaration of Helsinki. All patients signed a written informed consent before inclusion of their data in the study.
Acknowledgments
An abstract for the initial results of this study was presented at the 2021 ARVO Imaging in the Eye virtual conference. The authors would like to thank Professors Khaled El Rakhawy, Shiyoung Roh, and Sarkis Soukiasian, as well as Carol Spencer, Lahey Hospital Librarian, for research support. D.J. Ramsey is the Harry N. Lee Family Chair in Innovation at the Lahey Hospital & Medical Center, Beth Israel Lahey Health.
Author Contributions
All authors made a significant contribution to the work reported, whether that is in the conception, study design, execution, acquisition of data, analysis, and interpretation, or in all these areas; took part in drafting, revising, or critically reviewing the article; gave final approval of the version to be published; have agreed on the journal to which the article has been submitted; and agree to be accountable for all aspects of the work.
Funding
There were no sources of funding for this work. Financial support: D.J.R. was supported by the Harry N. Lee Family Chair in Innovation at the Lahey Hospital & Medical Center, Beth Israel Lahey Health.
Disclosure
The authors report no conflicts of interest for this work.
References
1. Shaw JE, Sicree RA, Zimmet PZ. Global estimates of the prevalence of diabetes for 2010 and 2030. Diabetes Res Clin Pract. 2010;87:4–14. doi:10.1016/j.diabres.2009.10.007
2. Klein BE. Overview of epidemiologic studies of diabetic retinopathy. Ophthalmic Epidemiol. 2007;14:179–183. doi:10.1080/09286580701396720
3. Zhang X, Saaddine JB, Chou CF, et al. Prevalence of diabetic retinopathy in the United States, 2005–2008. JAMA. 2010;304:649–656. doi:10.1001/jama.2010.1111
4. Hegazi R, El-Gamal M, Abdel-Hady N, Hamdy O. Epidemiology of and risk factors for type 2 diabetes in Egypt. Ann Glob Health. 2015;81:814–820. doi:10.1016/j.aogh.2015.12.011
5. Herman WH, Aubert RE, Engelgau MM, et al. Diabetes mellitus in Egypt: glycaemic control and microvascular and neuropathic complications. Diabet Med. 1998;15:1045–1051. doi:10.1002/(SICI)1096-9136(1998120)15:12<1045::AID-DIA696>3.0.CO;2-L
6. Wells JA, Glassman AR Ayala AR, et al. Diabetic retinopathy clinical research network, aflibercept, bevacizumab, or ranibizumab for diabetic macular edema. N Engl J Med. 2015;372:1193–1203.
7. Nguyen QD, Brown DM, Marcus DM, et al. Ranibizumab for diabetic macular edema: results from 2 phase III randomized trials: RISE and RIDE. Ophthalmology. 2012;119:789–801. doi:10.1016/j.ophtha.2011.12.039
8. Mitchell P, Bandello F, Schmidt-Erfurth U, et al. The RESTORE study: ranibizumab monotherapy or combined with laser versus laser monotherapy for diabetic macular edema. Ophthalmology. 2011;118:615–625. doi:10.1016/j.ophtha.2011.01.031
9. Ramsey DJ, Poulin SJ, LaMonica LC, et al. Early conversion to aflibercept for persistent diabetic macular edema results in better visual outcomes and lower treatment costs. Clin Ophthalmol. 2021;15:31–39. doi:10.2147/OPTH.S286665
10. Lazic R, Lukic M, Boras I, et al. Treatment of anti-vascular endothelial growth factor-resistant diabetic macular edema with dexamethasone intravitreal implant. Retina. 2014;34:719–724. doi:10.1097/IAE.0b013e3182a48958
11. Fickweiler W, Schauwvlieghe AS, Schlingemann RO, et al. Predictive value of optical coherence tomographic features in the bevacizumab and ranibizumab in patients with Diabetic Macular Edema (BRDME) Study. Retina. 2018;38:812–819. doi:10.1097/IAE.0000000000001626
12. Sun JK, Lin MM, Lammer J, et al. Disorganization of the retinal inner layers as a predictor of visual acuity in eyes with center-involved diabetic macular edema. JAMA Ophthalmol. 2014;132:1309–1316. doi:10.1001/jamaophthalmol.2014.2350
13. Seo KH, Yu SY, Kim M, Kwak HW. Visual and morphologic outcomes of intravitreal ranibizumab for diabetic macular edema based on optical coherence tomography patterns. Retina. 2016;36:588–595. doi:10.1097/IAE.0000000000000770
14. AttaAllah HR, Mohamed AAM, Ali MA. Macular vessels density in diabetic retinopathy: quantitative assessment using optical coherence tomography angiography. Int Ophthalmol. 2019;39:1845–1859. doi:10.1007/s10792-018-1013-0
15. Alam M, Zhang Y, Lim JI, Chan RV, Yang M, Yao X. Quantitative optical coherence tomography angiography features for objective classification and staging of diabetic retinopathy. Retina. 2018;40:322–332. doi:10.1097/IAE.0000000000002373
16. Lee J, Moon BG, Cho AR, Yoon YH. Optical coherence tomography angiography of DME and its association with anti-VEGF treatment response. Ophthalmology. 2016;123:2368–2375. doi:10.1016/j.ophtha.2016.07.010
17. Hsieh YT, Alam MN, Le D, et al. OCT angiography biomarkers for predicting visual outcomes after ranibizumab treatment for diabetic macular edema. Ophthalmol Retina. 2019;3:826–834. doi:10.1016/j.oret.2019.04.027
18. Ashraf M, Sampani K, Abu-Qamar O, et al. Optical coherence tomography angiography projection artifact removal: impact on capillary density and interaction with diabetic retinopathy severity. Transl Vis Sci Technol. 2020;9:10. doi:10.1167/tvst.9.7.10
19. Campbell JP, Zhang M, Hwang TS, et al. Detailed vascular anatomy of the human retina by projection-resolved optical coherence tomography angiography. Sci Rep. 2017;7:42201. doi:10.1038/srep42201
20. Elnahry AG, Abdel-Kader AA, Raafat KA, Elrakhawy K. Evaluation of changes in macular perfusion detected by optical coherence tomography angiography following 3 intravitreal monthly bevacizumab injections for diabetic macular edema in the IMPACT Study. J Ophthalmol. 2020;2020:5814165. doi:10.1155/2020/5814165
21. Pieramici DJ, Wang PW, Ding B, Gune S. Visual and anatomic outcomes in patients with diabetic macular edema with limited initial anatomic response to ranibizumab in RIDE and RISE. Ophthalmology. 2016;123:1345–1350. doi:10.1016/j.ophtha.2016.02.007
22. Parravano M, Costanzo E, Querques G. Profile of non-responder and late responder patients treated for diabetic macular edema: systemic and ocular factors. Acta Diabetol. 2020;57:911–921. doi:10.1007/s00592-020-01496-7
23. Kim YK, An Y, Park SP. Intraocular and interocular differences in parafoveal vascular density in diabetic patients without diabetic retinopathy. Retina. 2021;41:170–180. doi:10.1097/IAE.0000000000002781
24. Bressler SB, Ayala AR, Bressler NM, et al. Persistent macular thickening after ranibizumab treatment for diabetic macular edema with vision impairment. JAMA Ophthalmol. 2016;134:278–285. doi:10.1001/jamaophthalmol.2015.5346
25. Wessel MM, Nair N, Aaker GD, Ehrlich JR, D’Amico DJ, Kiss S. Peripheral retinal ischaemia, as evaluated by ultra-widefield fluorescein angiography, is associated with diabetic macular oedema. Br J Ophthalmol. 2012;96:694–698. doi:10.1136/bjophthalmol-2011-300774
26. Takamura Y, Tomomatsu T, Matsumura T, et al. The effect of photocoagulation in ischemic areas to prevent recurrence of diabetic macular edema after intravitreal bevacizumab injection. Invest Ophthalmol Vis Sci. 2014;55:4741–4746. doi:10.1167/iovs.14-14682
27. Duh EJ, Sun JK, Stitt AW. Diabetic retinopathy: current understanding, mechanisms, and treatment strategies. JCI Insight. 2017;2:e93751. doi:10.1172/jci.insight.93751
28. Busch C, Wakabayashi T, Sato T, et al. Retinal microvasculature and visual acuity after intravitreal aflibercept in diabetic macular edema: an optical coherence tomography angiography study. Sci Rep. 2019;9:156. doi:10.1038/s41598-018-38248-1
29. Elnahry AG, Ramsey DJ. Optical coherence tomography angiography imaging of the retinal microvasculature is unimpeded by macular xanthophyll pigment. Clin Exp Ophthalmol. 2020;48:1012–1014. doi:10.1111/ceo.13824
30. Statler B, Conti TF, Conti FF, et al. Twenty-four-month OCTA assessment in diabetic patients undergoing fixed-interval intravitreal aflibercept therapy. Ophthalmic Surg Lasers Imaging Retina. 2020;51:448–455. doi:10.3928/23258160-20200804-05
31. Elnahry AG, Abdel-Kader AA, Habib AE, Elnahry GA, Raafat KA, Elrakhawy K. Review on recent trials evaluating the effect of intravitreal injections of anti-VEGF agents on the macular perfusion of diabetic patients with diabetic macular edema. Rev Recent Clin Trials. 2020;15:188–198. doi:10.2174/1574887115666200519073704
32. Sorour OA, Sabrosa AS, Alibhai AY, et al. Optical coherence tomography angiography analysis of macular vessel density before and after anti-VEGF therapy in eyes with diabetic retinopathy. Int Ophthalmol. 2019;39:2361–2371. doi:10.1007/s10792-019-01076-x
33. Elnahry AG, Elnahry GA. Optical coherence tomography angiography of macular perfusion changes after anti-VEGF therapy for diabetic macular edema: a systematic review. J Diabetes Res. 2021;2021:6634637. doi:10.1155/2021/6634637
34. Sorour OA, Elsheikh M, Chen S, et al. Mean macular intercapillary area in eyes with diabetic macular oedema after anti-vascular endothelial growth factor therapy and its association with treatment response. Clin Exp Ophthalmol. 2021;49:714–723. doi:10.1111/ceo.13966
35. Li A, Rieveschl NB, Conti FF, et al. Long-term assessment of macular atrophy in patients with age-related macular degeneration receiving anti-vascular endothelial growth factor. Ophthalmol Retina. 2018;2:550–557. doi:10.1016/j.oret.2017.10.010
36. Pieramici D, Singh RP, Gibson A, et al. Outcomes of diabetic macular edema eyes with limited early response in the VISTA and VIVID studies. Ophthalmol Retina. 2018;2:558–566. doi:10.1016/j.oret.2017.10.014
 © 2022 The Author(s). This work is published and licensed by Dove Medical Press Limited. The
full terms of this license are available at https://www.dovepress.com/terms
and incorporate the Creative Commons Attribution
- Non Commercial (unported, 3.0) License.
By accessing the work you hereby accept the Terms. Non-commercial uses of the work are permitted
without any further permission from Dove Medical Press Limited, provided the work is properly
attributed. For permission for commercial use of this work, please see paragraphs 4.2 and 5 of our Terms.
© 2022 The Author(s). This work is published and licensed by Dove Medical Press Limited. The
full terms of this license are available at https://www.dovepress.com/terms
and incorporate the Creative Commons Attribution
- Non Commercial (unported, 3.0) License.
By accessing the work you hereby accept the Terms. Non-commercial uses of the work are permitted
without any further permission from Dove Medical Press Limited, provided the work is properly
attributed. For permission for commercial use of this work, please see paragraphs 4.2 and 5 of our Terms.