
Back to Journals » Diabetes, Metabolic Syndrome and Obesity » Volume 18


Opaganib Promotes Weight Loss and Suppresses High-Fat Diet-Induced Obesity and Glucose Intolerance
Authors Maines LW, Keller SN, Smith RA, Smith CD 
Received 28 December 2024
Accepted for publication 22 March 2025
Published 1 April 2025 Volume 2025:18 Pages 969—983
DOI https://doi.org/10.2147/DMSO.S514548
Checked for plagiarism Yes
Review by Single anonymous peer review
Peer reviewer comments 2
Editor who approved publication: Prof. Dr. Liang Wang
Lynn W Maines, Staci N Keller, Ryan A Smith, Charles D Smith
Apogee Biotechnology Corporation, Hummelstown, PA, USA
Correspondence: Charles D Smith, Apogee Biotechnology Corporation, 1214 Research Blvd, Suite 2015, Hummelstown, PA, 17036, USA, Email [email protected]
Introduction: Sphingolipid metabolism has been implicated in many diseases including cancer, pathologic inflammation, viral infection, neurologic pathologies and metabolic pathologies, including obesity and diabetes. We have previously shown that opaganib (aka ABC294640) inhibits three key enzymes in the sphingolipid metabolism pathway: sphingosine kinase-2, dihydroceramide desaturase and glucosylceramide synthase. We and others have demonstrated anticancer, anti-inflammatory and antiviral activities of opaganib in multiple experimental models. Furthermore, opaganib has been studied in clinical trials with patients having cancer or severe Covid-19. In the present studies, the effects of opaganib in the well-established model of High-Fat Diet (HFD)-induced obesity have been studied.
Methods: Male or female C57BL/6 mice were fed Control Diet (CD) or HFD and treated with vehicle or opaganib by oral gavage once daily, 5 days per week. Body weights were monitored and glucose tolerance was measured periodically for up to 16 weeks. In some experiments, obese HFD-fed mice were treated with vehicle, opaganib alone, semaglutide alone or opaganib plus semaglutide.
Results: Treatment with opaganib markedly suppressed weight gain in male mice fed the HFD but not in mice given the CD. Compared with mice given CD, mice on the HFD demonstrated poor glucose tolerance at 8, 12 and 16 weeks, consistent with the progression of obesity. Importantly, opaganib treatment of the HFD-fed mice abolished this developing glucose intolerance at all times of measurement. Opaganib treatment also reduced the elevation of hemoglobin A1c and the deposition of inguinal fat in HFD-fed mice. Similar results were obtained with female mice, indicating equivalent efficacy of opaganib in both sexes. Additionally, opaganib and semaglutide were equally effective in promoting body weight loss and improving glucose tolerance in obese mice. Opaganib administered either concurrently with semaglutide or as a single drug following cessation of semaglutide treatment eliminated weight rebound.
Conclusion: Overall, the data indicate that opaganib effectively suppresses the loss of metabolic control in mice on HFD, suggesting that opaganib may be useful alone or in combination with existing therapies for weight management and improve conditions associated with obesity and diabetes.
Plain Language Summary: Opaganib is a first-in-class clinical-stage drug that alters the metabolism of certain sphingolipids that regulate key cellular processes. In studies described herein, we present data for the first time demonstrating that opaganib suppresses weight gain in male and female mice fed a high-fat diet, and that this is associated with improved glucose tolerance and decreased deposition of fat. Opaganib also promotes weight loss in obese mice, alone and in combination with semaglutide and prevents weight gain rebound after removal of semaglutide. Therefore, opaganib may be useful alone or in combination with existing therapies for weight management and improve conditions associated with obesity and diabetes.
Keywords: obesity, diabetes, opaganib, ABC294640, sphingolipid, glucose tolerance
Introduction
Metabolic disease, including obesity and type 2 diabetes (T2D), constitutes a major progressive health crisis, particularly in Western nations. Although the clinical pathology and physiology of these conditions are well described, the molecular mechanisms underlying the disease process remain incompletely understood. Sphingolipids are key signaling regulators in tissues affected by diabetes and are essential components in the molecular etiology of this disease (reviewed in1–3). Sphingosine kinases (SphKs) are enzymes that catalyze the phosphorylation of sphingosine to form sphingosine 1-phosphate (S1P). S1P is a bioactive sphingolipid involved in various cellular processes such as cell proliferation, survival, migration and inflammation (reviewed in4,5). In the context of diabetes and obesity, the roles of sphingolipids are multifaceted, including insulin resistance, β-cell disruption, adipocyte function, inflammation and immune regulation, vascular complications and energy metabolism.6–9 In particular, the dysregulation of SphKs and the resulting alterations in S1P production can contribute to the pathogenesis of obesity and diabetes. Targeting sphingolipid metabolism pathways, therefore may offer therapeutic strategies for managing diabetes and obesity and their associated complications.
Opaganib [3-(4-chlorophenyl)-N-(pyridin-4-ylmethyl)-1-adamantane carboxamide, hydrochloride salt; also known as ABC294640] is an orally active, isozyme-selective inhibitor of SphK2, and is competitive with respect to sphingosine.10,11 Opaganib depletes S1P and elevates ceramide in tumor cells, suppresses signaling through pERK, pAKT and NFκB, and promotes apoptosis.10–14 Because it acts as a sphingosine mimetic, opaganib also inhibits DES1, thereby increasing levels of dhCer15 and promoting autophagy in cells. Opaganib has antitumor activity in a wide range of mouse models (reviewed in4) and has shown promise in oncology16,17 and Covid-1918–20 clinical trials. Additionally, opaganib has in vivo anti-inflammatory activity in several rodent models, including: ulcerative colitis, Crohn’s disease, colitis-driven colon cancer, vascular permeability, rheumatoid arthritis, osteoarthritis, liver transplantation, hepatic ischemia-reperfusion injury and acute kidney injury (Reviewed in18), as well as bacterial pneumonia,21 lupus nephritis,22 psoriasis,23 renal fibrosis,24 pulmonary fibrosis25 and gastrointestinal acute radiation syndrome.26 Because the sphingolipid-metabolizing enzymes inhibited by opaganib are centrally involved in metabolic dysregulation in diabetes, we assessed the effects of opaganib on obesity and glucose tolerance in HFD-fed mice. The resulting data provide evidence that this first-in-class clinical drug targeting the sphingolipid pathway effectively suppresses the deleterious effects of HFD in both male and female mice. Therefore, opaganib may be useful alone or in combination with existing therapies for weight management and improve conditions associated with obesity and diabetes.
Materials and Methods
Materials
Opaganib (GMP-grade) was synthesized according to French et al.10 Male and female C57BL/6J mice (8-week-old, average 25.3 g for males and 19.0 g for females) and male Diet-Induced Obese (DIO) C57BL/6 mice (16-week old, average 43.2 g) were purchased from Jackson Laboratories (Bar Harbor, ME, USA). High-fat diet (HFD) in which 60% of calories are derived from fat (D12492) was purchased from Research Diets (New Brunswick, NJ, USA). Control Diet (CD) was standard rodent chow which contains 5% crude fat. Semaglutide (HY-114118) was purchased from MedChemExpress (Monmouth Junction, NJ, USA).
Obesity Models
Animal studies have been carried out in accordance with the Guide for the Care and Use of Laboratory Animals by the US National Institutes of Health with oversight from the Penn State College of Medicine IACUC. After acclimation for 1 week, mice were placed on HFD or CD ad libitum. Typically, HFD-fed mice were randomized into treatment groups (number of mice per group is described later for each experiment) receiving Vehicle (0.375% Tween in PBS) or 100 mg/kg opaganib by oral gavage (0.1 mL volume) once per day 5-days per week (Monday-Friday) for up to 16 weeks. Similarly, CD mice were administered 0 (Vehicle) or 100 mg/kg opaganib by gavage once per day 5-days per week. Food consumption was monitored by weighing the chow remaining for each cage twice weekly. Mice were weighed twice per week, and every animal was monitored for signs of toxicity such as respiratory difficulties or gastrointestinal distress. The dose of opaganib used in these studies has been broadly used in murine models of cancer and inflammation and known to be safe. At the end of 16 weeks, mice were euthanized by CO2 asphyxiation followed by cervical dislocation.
To assess the reversibility of HFD-induced pathology, treatment crossover experiments were performed. Specifically, at week 8 or 9, some of the HFD-Vehicle and HFD-Opaganib mice were crossed over to the opposite treatment regimen, and the remaining mice were maintained on their original treatments. Consequently, the experimental groups after crossover included: HFD-Vehicle → Vehicle; HFD-Vehicle → Opaganib; HFD-Opaganib → Vehicle and HFD-Opaganib → Opaganib. Mice were maintained and monitored for an additional 8 weeks.
In some experiments, DIO-mice (16 or 18-weeks on HFD) were randomized into treatment groups receiving Vehicle, 100 mg/kg opaganib by oral gavage, 40 μg/kg semaglutide in water by intraperitoneal injection or opaganib plus semaglutide. All treatments were administered daily 5-days per week (Monday-Friday), and all mice were provided with both HFD and CD ad libitum for 8 weeks. The health of each mouse was assessed daily, and mice were weighed twice per week.
Blood Glucose Analyses
To measure blood glucose levels, mice were fasted overnight (12 ± 1 hr) while drinking water was continued to be provided ad libitum. In the morning, 2 µL of blood was obtained from the tails following a lancet prick and analyzed using a Metene TD-4116 glucose monitoring system. For glucose tolerance testing, fasted mice were administered a volume of 7.5 x body weight (in kg) of a 25% glucose solution in water (w/v) via intraperitoneal injection. Tail blood (2 μL) was then collected at 15, 30, 60 and 120 minutes after the glucose injection and blood glucose levels were determined. Glucose concentrations were then plotted, and the area under the curve (AUC) for increases in the plasma glucose levels were calculated using GraphPad Prism 5.0.
Additional Analyses
Hemoglobin A1c (HbA1c) levels were determined from 5 µL of tail blood using an A1CNOW Self Check system monitor (PTS Diagnostics, Whitestown, IN). In some experiments, the inguinal fat pads were removed at sacrifice and weighed.
Statistical Analyses
Comparisons among treatment groups were conducted as one-way analyses of variance with Tukey’s post test or unpaired t-tests using GraphPad Prism 5.0. Differences are considered statistically significant when p < 0.05. Error bars in the Figures represent the mean ± SEM of the treatment groups calculated with GraphPad Prism 5.0.
Results
Opaganib Suppresses HFD-Induced Body Weight Gain by Male Mice
As shown in Figure 1, male mice given the control diet (CD) experienced a slight loss of body weight when the study was initiated but recovered to maintain essentially the starting body weight throughout the 8-week period. Treatment with 100 mg/kg opaganib did not affect body weights of the CD-fed mice. In contrast, vehicle-treated mice given a high-fat diet (HFD) progressively increased body weight, averaging a 41% gain by Week 8 (Figure 1). In contrast, opaganib-treated mice on the HFD increased body weight by only 11% by Week 8, with the difference becoming increasingly more statistically significant over time (p<0.001 at Day 54). Food consumption was measured twice weekly and normalized for the number of mice in each cage. As shown in Figure 2, mice treated with opaganib and fed the CD consumed 6% less than vehicle-treated controls (p<0.005) over the course of the experiment. Interestingly, vehicle-treated mice fed the HFD ate less food than vehicle-treated CD mice even though they had much greater increases in body weight. Over the course of the experiment, opaganib-treated mice ate 17% less HFD than the vehicle-treated controls (p<0.0001).
 |
Figure 1 Effect of opaganib-treatment on body weight gain. Left Panel: Male C57BL/6J mice were given a CD and treated with either Vehicle (●, n = 3) or 100 mg/kg Opaganib (▼, n = 3) once daily, 5 days/week. Right Panel: Mice were given a HFD and treated with either Vehicle (●, n = 9) or 100 mg/kg Opaganib (■, n = 9) once daily, 5 days/week. In each case, mice were weighed on the indicated days and the mean ± SEM values are shown. For mice on the HFD, the statistical significance of differences reached *p < 0.05 at Day 29, **p <0.01 at Day 43 and *** p <0.001 at Day 54. |
 |
Figure 2 Effect of opaganib on food consumption. Food consumption for animal described in Figure 1 was calculated twice weekly and normalized for the number of mice per cage for mice given either CD (Left Panel) or HFD (Right Panel) and treated with either Vehicle (▲, ●) or 100 mg/kg Opaganib (▼, ■) once daily, 5 days/week (n = 3 for CD groups and n = 9 for HFD groups). The mean values for food consumption per mouse are shown. |
Opaganib Suppresses HFD-Induced Loss of Glucose Tolerance in Male Mice
Glucose tolerance tests were performed to assess the effects of HFD and opaganib on glucose metabolism. Male mice were fed either HFD or CD and treated with either vehicle or 100 mg/kg opaganib daily 5 days/week for 8 weeks. At that time, mice were fasted overnight and blood samples we obtained by tail prick with a lancet and analyzed using a glucose monitor. As shown in Figure 3, the average fasting blood glucose levels of HFD-fed mice were slightly lower than fasting glucose levels in CD mice (135 and 178 mg/dL, respectively). Fasting blood glucose levels in CD-fed mice and HFD-fed mice treated with opaganib were 23% and 20% lower than vehicle-treated mice on the same diet. HFD-Vehicle mice had substantially poorer glucose tolerance than did HFD-Opaganib mice, with AUCs of 27,387 and 17,339 mg*min/dL, respectively (37% decrease with opaganib, p < 0.001). Blood glucose AUCs of CD-fed mice given opaganib were slightly lower than CD-Vehicle mice, suggesting that opaganib increases glucose clearance even in the absence of the HFD-challenge. Overall, HFD-feeding resulted in impairment of glucose tolerance within 8 weeks, and opaganib-treatment reduced the fasting blood glucose levels and substantially improved glucose tolerance.
 |
Figure 3 Effect of opaganib on HFD-induced glucose intolerance. Left Panel: Male C57BL/6J mice were given a CD and treated with either Vehicle (▲, n = 3) or 100 mg/kg Opaganib (▼, n = 3) or a HFD and treated with either Vehicle (●, n = 8) or 100 mg/kg Opaganib (■, n = 9) once daily, 5 days/week. Blood glucose levels were measured and values indicate the mean ± SEM at the indicated time of sampling. HFD-Opaganib was significantly reduced (p < 0.05 for time = 15 min and p < 0.001 for all other time points) compared with HFD-Vehicle. Right Panel: Mean ± SEM values for the blood glucose concentration AUCs are shown. ### p < 0.001 vs CD-Vehicle and *** p <0.001 vs HFD-Vehicle. |
Opaganib Restores Glucose Tolerance to HFD-Fed Male Mice
To assess the ability of opaganib to improve glucose tolerance in mice already obese from HFD feeding, subsets of mice were crossed over to the opposite treatment after 8 weeks on HFD. As shown in Figure 4, male mice that were obese from 8 weeks of HFD-Vehicle further increased body weight by 20.4% when maintained on HFD and given Vehicle for an additional 8 weeks. Cross-over to Opaganib-treatment reduced this weight gain to 11.1%. Conversely, non-obese HFD-Opaganib mice gained 22.1% body weight when opaganib treatment was removed, while HFD-Opaganib mice that continued to receive opaganib demonstrated only 8.1% increases in body weight (P < 0.001 on Day 36 after crossover and beyond). Thus, opaganib treatment suppressed HFD-induced body weight gain through the entire 16-week period, resulting in average body weights of 41.5 and 29.5 g for HFD-Vehicle and HFD-Opaganib mice.
 |
Figure 4 Effect of opaganib on body weight of HFD-induced obese mice. HFD-Vehicle and HFD-Opaganib mice were randomized to subgroups given HFD and either the original or the opposite treatment from Week 8 to 16. Left Panel: Body weights (mean ± SEM) of HFD-Vehicle → HFD-Vehicle (n = 3) and HFD-Vehicle → HFD-Opaganib (n = 5) are shown. Right Panel: Body weights of HFD-Opaganib → HFD-Vehicle (n = 5) and HFD-Opaganib → HFD-Opaganib (n=4) are shown. *** p < 0.001 vs HFD-Opaganib → HFD-Vehicle on the same day. |
Glucose tolerance tests were performed at Week 12 and Week 16, ie at 4 weeks and 8 weeks after crossover to the opposite treatment. As shown in Figure 5, the HFD-Vehicle → HFD-Vehicle group had very similar glucose kinetics and AUCs at Week 12 as HFD-Vehicle mice at Week 8. However, the glucose exposure substantially increased at the Week 16 time point indicating further loss of glucose control as the mice continued on the HFD. Similarly, the HFD-Opaganib → HFD-Opaganib mice had markedly better glucose tolerance and AUCs than the HFD-Vehicle mice at both 12 and 16 weeks (41% decreases at both time points). Importantly, mice that received HFD-Vehicle for 8 weeks and then crossed over to HFD-Opaganib had much better glucose kinetics and AUCs (47% and 33% decreases at 12 and 16 weeks, respectively) than mice that continued receiving HFD-Vehicle after the crossover point. This indicates that opaganib improves glucose clearance even in obese mice that had previously demonstrated impaired glucose tolerance. This models the human clinical situation in which an obese patient would be treated with opaganib with the goal of improving their glucose tolerance even if their poor diets are maintained. Interestingly, mice in the HFD-Opaganib → HFD-Vehicle treatment group maintained significantly improved glucose tolerance compared with HFD-Vehicle → HFD-Vehicle mice for at least 8 weeks after removal of the opaganib treatment suggesting that opaganib provides a sustained improvement in glucose tolerance even after removal of the drug.
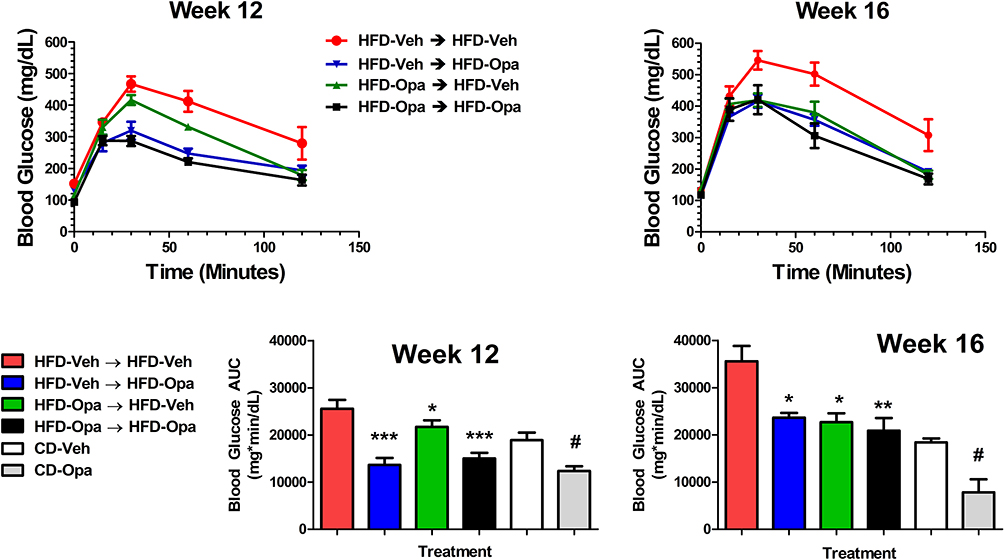 |
Figure 5 Effect of opaganib on HFD-induced glucose intolerance. Top Panels: Glucose tolerance curves at 12 and 16 weeks for HFD-Vehicle → HFD-Vehicle (●, (n=3) and HFD-Vehicle → HFD-Opaganib (▼, n = 5), HFD-Opaganib → HFD-Vehicle (▲, n = 5) and HFD-Opaganib → HFD-Opaganib (■, n = 3) are shown. Bottom Panels: Values for the blood glucose concentration AUCs at 12 and 16 weeks are shown. Mean ± SEM values are shown. *p < 0.05, **p < 0.01 and ***p < 0.001 vs HFD-Vehicle → HFD-Vehicle and # p<0.05 vs CD-Vehicle. |
Opaganib Improves Long-Term Glucose Control and Reduces Fat Deposition in HFD-Fed Male Mice
Hemoglobin A1c (HbA1c) levels were measured at 16 weeks to assess the effects of HFD and opaganib on long-term glucose control. As shown in Figure 6, HbA1c levels in mice fed CD were all below the lower limit of detection (4%); whereas HbA1c in HFD-Vehicle animals were slightly, but significantly elevated (p<0.01). The modest increase in HbA1c is consistent with the lack of increases in fasting blood glucose levels in HFD-Vehicle mice (133 mg/dL at 16 weeks) and indicates that this HFD-induced obesity model does not fully represent the clinical manifestations of human diabetes. Nonetheless, HFD-fed mice treated with opaganib had slightly reduced (p = 0.17) levels of HbA1c consistent with the lower fasting blood glucose concentrations (118 mg/dL at 16 weeks).
 |
Figure 6 Effect of opaganib on HFD-induced elevation of HbA1c. Mice were given either CD (n = 3) or HFD and treated with Vehicle (n = 3) or 100 mg/kg Opaganib (n = 4) once daily, 5 days/week for 16 weeks. Blood obtained by tail prick was analyzed for HbA1c concentrations. Mean ± SEM values are shown. **p <0.01 vs CD-Vehicle mice. |
At 8 or 16 weeks, mice were euthanized and inguinal fat pads and livers were collected. As shown in Figure 7, the fat pads of HFD-Vehicle mice at both Week 8 and Week 16 were heavier than those harvested from CD-fed mice at Week 16. Treatment of CD-fed mice with opaganib did not affect fat pad weight at Week 16. In contrast, treatment of the HFD-fed mice with opaganib significantly reduced inguinal fat pad weight at Week 8 (p < 0.01). For mice sacrificed at Week 16, the HFD-Vehicle → HFD-Vehicle group had much larger fat pads than did HFD-Opaganib → HFD-Opaganib mice (p < 0.001) consistent with the overall lower body weights of the latter group. Importantly, crossover to HFD-Opaganib from HFD-Vehicle at Week 8 substantially reduced fat pad weight at Week 16, consistent with the improvement in glucose tolerance when these HFD-obese mice were treated with opaganib. Interestingly, HFD-fed mice that were initially treated with opaganib for 8 weeks and then with vehicle for an additional 8 weeks gained only small fat pad weight compared to mice that remained on opaganib treatment. This is consistent with the persistence of improved glucose control after opaganib is removed from HFD-fed mice (Figure 5). At 16 weeks, liver weights were not different between the HFD-Vehicle and HFD-Opaganib groups (1.33 ± 0.6 and 1.2 ± 0.1 g, respectively).
 |
Figure 7 Effect of opaganib on fat deposition. Left Panel: Inguinal fat pad weights at 8 weeks for HFD-Vehicle (black bar, n = 6) and HFD-Opaganib (blue bar, n = 5). Mean ± SEM values are shown. **p <0.01 compared with the HFD-Vehicle group. Right Panel: Inguinal fat pad weights at 16 weeks for HFD-Vehicle → HFD-Vehicle (red bar, n=8) and HFD-Vehicle → HFD-Opaganib (blue bar, n = 10), HFD-Opaganib → HFD-Vehicle (green bar, n=5) and HFD-Opaganib → HFD-Opaganib (black bar, n = 4) are shown. Data for mice maintained on CD and treated with Vehicle (white bar, n = 3) or Opaganib (grey bar, n = 3) are also shown. Mean ± SEM values are shown. **p <0.01 or *** p<0.001 compared with the HFD-Vehicle → HFD-Vehicle group. |
Opaganib Also Suppresses HFD-Induced Body Weight Gain and Loss of Glucose Tolerance in Female Mice
Because sex differences can occur in experimental models, we conducted similar HFD-induced obesity experiments using age-matched female C57BL/6J mice. As with male mice, a subgroup of HFD-Vehicle fed female mice was crossed over to HFD-Opaganib after 8 weeks of treatment. As expected, the starting body weights for female mice were substantially lower than those of male mice (19.0 and 25.3 g, respectively). At 8 and 16 weeks, body weights of female mice on CD increased by 9.3% and 14.9% respectively, whereas, body weights of mice on HFD increased by 29.0% and 78.9% (Figure 8). Opaganib-treatment reduced the gains in body weight at 8 and 16 weeks to 3.9% and 12.4% for mice on CD (p < 0.001 compared to Vehicle), and 13.4% and 23.3% for mice on HFD (p < 0.001 compared to Vehicle). As with male mice, the females ate significantly less HFD (2.2 g/mouse/day) than CD (3.0 g/mouse/day) (p < 0.0001), and opaganib further reduced HFD consumption (p = 0.0133). Thus, opaganib treatment results in prolonged suppression of female mouse weight gain, very similar to results with male mice.
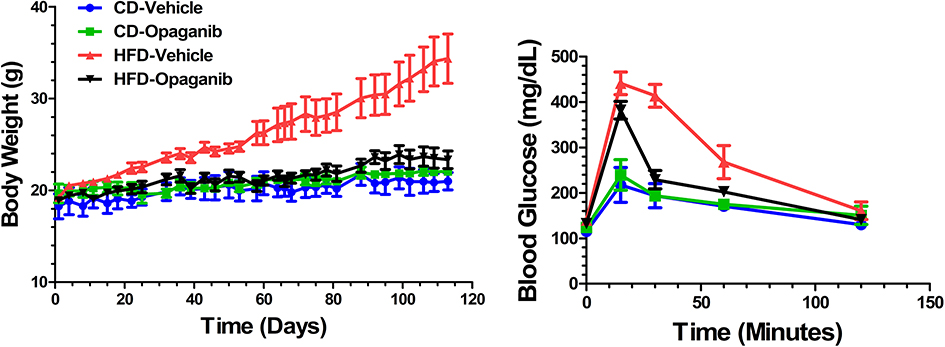 |
Figure 8 Effect of opaganib-treatment on female mouse body weight gain and glucose tolerance. Left Panel: Female C57BL/6J mice were given CD and treated with either Vehicle (●, n = 3) or 100 mg/kg Opaganib (■, n = 3) or given HFD and treated with Vehicle (▲, n = 23) or opaganib (▼, n = 6) once daily, 5 days/week. Mice were weighed on the indicated days and the mean ± SEM values are shown. Right Panel: Glucose tolerance curves at 4 weeks are shown. Numbers of mice per group are the same for all groups except HFR-Vehicle were n = 6 for this assay. |
Glucose tolerance was substantially impaired in the female mice as early as 4 weeks of HFD (Figure 8). Interestingly, the female mice on CD cleared the bolus of glucose much faster than did male mice on CD (Figure 3) resulting in greater fold-increases in blood glucose AUCs for HFD-fed mice compared with those on CD. Nonetheless, as with male mice, opaganib-treatment substantially reduced the blood glucose AUCs in the HFD-fed female mice over the course of 16 weeks (Table 1). Additionally, opaganib treatment of obese female mice started after 8 weeks of HFD substantially reduced the blood glucose AUCs after 8 weeks on drug. Therefore, as with male mice, the glucose tolerance of obese female mice can be markedly improved by treatment with opaganib.
 |
Table 1 Effects of Opaganib on Blood Glucose AUCs in Female Mice. Female C57BL/6J Mice Were Given a CD (n = 3/Group) or HFD (n = 6/Group) and Treated with Either Vehicle or 100 mg/kg Opaganib Once Daily, 5 days/Week. A Subgroup of HFD-Vehicle Mice Was Switched to Opaganib Treatment After 8 weeks (HFD-Opaganib). Glucose Tolerance Tests Were Administered After 4, 8, 12 and 16 weeks of Treatment. Values Indicated the Mean ± SEM AUCs (Mg*min/dL) |
Opaganib Can Be Combined with Semaglutide to Induce Weight Loss and Improve Glucose Tolerance in Obese Mice
Obese male mice (16 or 18 weeks of HFD) were randomized into groups treated with Vehicle, opaganib alone, semaglutide alone or opaganib + semaglutide 5 days/week and body weights were monitored. As shown in Figure 9A, HFD-fed mice treated with Vehicle continued to increase body weight (4.4% increase from Day 1 to Day 23); whereas mice treated with either opaganib or semaglutide lost body weight with changes of −11.7% and −15.8% relative to Day 1, respectively (p < 0.001 for each treatment). Mice that received a combination of opaganib plus semaglutide had no apparent adverse effects and lost slightly more weight (−18.7%) than either opaganib alone or semaglutide alone. Interestingly, when treatment was paused each weekend, mice receiving semaglutide alone consistently increased body weight when measured on Monday (Figure 9A and B). In contrast, mice treated with opaganib or opaganib plus semaglutide did not demonstrate this body weight rebound during the “drug holiday” period. On Day 23, mice treated with semaglutide were randomized into groups for further treatment with either Vehicle or opaganib for an additional 2 weeks. As shown in Figure 9B, mice previously treated with semaglutide rapidly gained body weight when treated with Vehicle; whereas, mice treated with opaganib maintained the weight reductions achieved by semaglutide treatment (p < 0.01 compared with Vehicle group). As shown in Figure 9C and D, glucose tolerance was substantially improved as early as 2 weeks of treatment with opaganib, semaglutide or the combination (p < 0.001 for all treatment groups compared to Vehicle). Therefore, opaganib and semaglutide are both effective in promoting body weight loss in this model, and concurrent or sequential combination of the two drugs may provide increased therapeutic responses.
 |
Figure 9 Effects of opaganib and semaglutide on body weight and glucose tolerance in obese mice. (A) Male C57BL/6J mice were given HFD for 18 weeks and the treated with either Vehicle (●, n = 8), opaganib (■, n = 6), semaglutide (▲, n = 6) or opaganib plus semaglutide (♦, n = 7). Mice were weighed on the indicated days and the mean ± SEM values are shown. (B) Semaglutide-treated mice were randomized on Day 23 (Arrow) to Vehicle (●) or opaganib (■) and weights were measured until Day 27. (C) Glucose tolerance curves at 2 weeks of treatment are shown. Mean ± SEM values are shown. (D) Values for the blood glucose concentration AUCs at 2 weeks are shown. ***p < 0.001 vs Vehicle. |
Discussion
Although a number of studies have examined the roles of sphingolipids in obesity and related diseases, the accumulated information does not provide clarity on the expected effects of pharmacological manipulation of sphingolipid signaling. It is particularly unknown how a drug that inhibits multiple enzymes in the sphingolipid metabolism pathway will affect the development and progression of obesity and related pathologies. To our knowledge, opaganib is the only compound described in the patent or journal literature that inhibits SphK2, DES1 and GCS. Therefore, studies utilizing other inhibitors or genetic knockouts do not predict biological responses to opaganib because they do not replicate the multitargeting of opaganib. Furthermore, many proteins have non-enzymatic activities that are lost by genetic knockout but not by pharmacologic inhibition. For example, SphK2 contains a BH3 domain which regulates cell apoptosis independent of the synthesis of S1P.27 Problematically, literature reports of the roles of SphK2, DES1 and GCS in the pathologies of obesity and T2D are inconsistent.
Regarding SphK2, several studies suggest that its inhibition would be beneficial for patients with obesity/T2D; whereas others indicate that inhibition of SphK2 would be deleterious for these patients. For example, several groups have shown lower weight gain and reduced glucose intolerance in SphK2 knockout mice fed a HFD compared with normal mice.28–31 Additionally, Shi et al showed that the purported SphK2 inhibitor K145 reduces hyperglycemia and markers of non-alcoholic fatty liver disease in ob/ob mice.32 Contrarily, Lee et al showed that genetic overexpression of SphK2 in mice fed a HFD decreases glucose intolerance and insulin resistance compared with normal mice.33 Also, Yuan et al showed that siRNA against SphK2 or opaganib increases gluconeogenesis by hepatocytes and prevents the ability of insulin to suppress glucose production.34 Further, Aji et al showed that siRNA against SphK2 or treatment with opaganib suppresses insulin receptor endocytosis and recycling, and insulin-stimulated AKT phosphorylation in hepatocytes.6 Finally, Aji et al showed that liver-specific knockout of SphK2 promotes insulin resistance and glucose intolerance.8
Similar inconsistencies occur in data on the role of DES1 in obesity and T2D. For example, Hu et al demonstrated that knockdown of DES1 protects against palmitate-induced insulin resistance.35 Additionally, Chaurasia et al demonstrated that knockout of DES1 improves hepatic steatosis and insulin resistance in mice caused by leptin deficiency or HFD.36 Finally, Veeriah et al demonstrated that the putative DES1 inhibitor N-trans-caffeoyltyramine decreases weight gain and hepatic steatosis in HFD-fed mice.37 In opposition to these studies, Zarini et al demonstrated that serum levels of dihydroceramides are higher in patients with T2D than controls, and that treatment of myotubes in vitro with dihydroceramides decreases insulin sensitivity.38 Similarly, Denimal et al demonstrated that plasma levels of dihydroceramides are higher in patients with T2D than controls, and that treatment of T2D patients with the GLP-1 receptor agonist liraglutide reduces plasma dihydroceramide levels and decreases liver fat content.39 Also, Barbaroja et al demonstrated the DES1 is suppressed in diabetic patients, and this impairs adipocyte differentiation.40 Finally, Rustamov et al demonstrated that the putative DES1 inhibitor GT-11 reduces glucose uptake by myotubes.41
Similar uncertainty exists for the role of GCS in obesity/T2D. For example, Bijl et al demonstrated that the putative GCS inhibitor AMP-DNM restores insulin signaling in the liver and corrects blood glucose values in ob/ob mice.42 Also, Van Eijk et al demonstrated that the putative GCS inhibitor AMP-DNM restores insulin signaling in adipocytes isolated from leptin-deficient obese mice.43 Furthermore, Zhao et al demonstrated that the putative GCS inhibitor MZ-21 improves glucose homeostasis and reduces hepatic steatosis in ob/ob mice.44 Additionally, Yew et al demonstrated that the putative GCS inhibitor Genz-112638 increases glucose tolerance and decreases HbA1c in HFD-fed mice,45 and Richards et al demonstrated that the putative GCS inhibitor EXEL-0346 increases glucose tolerance in HFD-fed mice.46 Lastly, Jang et al demonstrated that the putative GCS inhibitor PDMP reduces adipocyte formation in HFD-fed mice.47 On the other hand, several studies have demonstrated that administration of glucosylceramide to mice, rats or humans improves glucose tolerance and/or decreases liver fat.48–52
Overall, the contradictory results discussed above for each of the target enzymes for opaganib make it impossible to predict the therapeutic effects of this drug in the development and progression of obesity and T2D. Many of these studies used models where a single target enzyme was ablated by gene knockout or siRNA, which does not accurately reflect the multitargeted and kinetics of enzyme inhibition by a pharmaceutical drug. Therefore, it was necessary to conduct in vivo experiments to assess the effects of opaganib in an established model of HFD-induced obesity. We elected to use the widely-studied model of HFD-induced obesity and glucose intolerance using both male and female C57BL/6 mice. Consistent with reports in the literature, our data demonstrate that HFD-feeding substantially increases mouse body and inguinal fat pad weights and impairs glucose tolerance revealed in the standard bolus glucose challenge. The HFD-fed mice also experienced modest increases in fasting blood glucose and HbA1c levels; however, these parameters were less altered than in clinical T2D. This likely reflects the relatively short duration for obesity in the experimental mice compared with human patients. Nonetheless, mice demonstrated significantly impaired glucose control within 4 weeks of HFD feeding and progressive increases in inguinal fat pad weights over the course of 16 weeks.
Although Nagahashi et al reported that genetic ablation of SphK2 from mice results in elevated plasma triglycerides and fatty liver under HFD conditions,53 liver weights were not increased by opaganib treatment of mice on the HFD. Additionally, we have previously demonstrated that opaganib protects liver function in models of hepatic ischemia-reperfusion injury with no evidence for increase hepatic lipid deposition in mice or rats.54 Additionally, GLP-toxicology studies to support the IND application for opaganib included 28-day and 13-week studies with high-dose opaganib given to rats (up to 250 mg/kg BID) and dogs (up to 200 mg/kg BID) did not demonstrate any hepatic liability. Therefore, pharmacologic inhibition of SphK2 by opaganib does not produce risk for development of fatty liver.
Based on the broad activity of opaganib in models of cancer and inflammation, we treated mice with 100 mg of opaganib once daily, 5 days per week during the period of HFD feeding. Allometric scaling to humans,55 provides a human equivalent dose of 500 mg per day, which is well within the clinical safety profile of opaganib in patients with cancer or Covid-19.16–19 Opaganib treatment suppressed HFD-induced body weight gain and normalized glucose tolerance throughout the 16-week experimental period. It is being increasingly recognized that sex differences in the pathologies and drug responses of experimental models can occur, including sexual dimorphism in brain metabolism in response to HFD.56,57 Therefore, we conducted experiments with both male and female mice in the HFD model. Opaganib provided highly significant therapeutic benefit to both male and female mice in this model, indicating that it may be clinically effective in patients of either sex. In a further variation of the model, we induced obesity by HFD feeding for 8–18 weeks and then initiated treatment with opaganib. Opaganib normalized glucose tolerance as soon as 4 weeks in these obese mice and substantially decreased fat deposition in the inguinal fat pads when mice were sacrificed after 8 weeks of opaganib treatment even though they remained on HFD. Therefore, opaganib is likely to be beneficial when used in either a prevention or treatment scenario. It is also interesting to note that glucose tolerance and fat deposition remained improved for at least 8 weeks even when opaganib treatment was discontinued and the mice remained on HFD. Further improvement in glucose tolerance and weight management might be observed if the obese mice transition to a normal-fat diet at the time of opaganib treatment. Finally, administration of opaganib and/or semaglutide to obese mice were compared. Opaganib and semaglutide alone each caused essentially equivalent losses of body weight and improved glucose tolerance in as little as 2 weeks. It is well known that patients on semaglutide (Ozempic, Rybelsus or Wegovy) experience weight rebounds when treatment is discontinued. This rebound was observed in obese mice treated with semaglutide, but not with the opaganib-treated mice, when drug was withheld over the weekend or permanently withdrawn. Mice that received combined treatment with opaganib plus semaglutide had the largest decreases in body weight which did not rebound during the drug-free periods, and opaganib treatment started when semaglutide therapy was discontinued allowed the mice to maintain body weight losses. Overall, opaganib markedly suppresses weight gain and improves glucose tolerance in the HFD-induced obesity / T2D model, suggesting that it may effectively improve clinical pathologies associated with obesity and diabetes.
Several potential mechanisms for the roles of sphingolipids in the development of obesity and glucose intolerance are discussed above. As a unique multitargeted drug, opaganib has potential to act through multiple mechanisms in controlling these pathologies. For example, the data herein demonstrate that opaganib modestly reduces food intake by mice, although this is not sufficient to account for the suppression of weight gain (73% decrease in weight gain compared with 17% decrease in food intake). Suppression of appetite through direct neural effects is a major mechanism of action for GLP-1-targeted weight-loss drugs (reviewed in58). Although there is very little information specifically relating to sphingolipid roles in GLP-1 signaling, it is known that sphingolipids affect brain insulin resistance and neurological diseases (reviewed in59). Additionally, leptin resistance and signaling are regulated by several pathways influenced by sphingolipid metabolism,60,61 including pAKT and pSTAT3 which are attenuated in opaganib-treated cells.4 Therefore, opaganib may affect satiety through neurologic mechanisms, possibly associated with GLP-1 and/or leptin signaling.
Obesity resulting from HFD is associated with increased mitochondrial fragmentation in the brain and adipose tissue potentially resulting from elevation of ceramide levels.62,63 Jayashankar et al demonstrated that a “drug-like sphingolipid” SH-BC-893 normalized mitochondrial morphology and function in brain and white adipose tissue in HFD-fed mice, emphasizing the importance of mitochondrial integrity in attenuating obesity and glucose metabolism.64 We have previously demonstrated that opaganib protects against mitochondrial dysfunction from inflammation in the liver.54,65 Additionally, it is well established that sphingolipids modulate mitochondrial respiration and energy dynamics (reviewed in2,66,67). It will be interesting in future experiments to assess mitochondrial structure and function in key tissues affected by HFD-induced obesity, including the hypothalamus, adipose and liver.
Overall, the present data provide the first demonstration that the unique sphingolipid-targeted drug opaganib suppresses and reverses HFD-induced obesity and glucose intolerance in mice. Additional work in complementary models of obesity, fatty liver disease and diabetes will be useful to confirm and expand the breadth of efficacy for opaganib against these pathologies. In particular, obesity/T2D models that result in sustained blood glucose elevation, assessed as elevated HbA1c, will be more reflective of human clinical disease. Finally, it will be of interest to assess the efficacy of opaganib with additional approved weight-loss drugs to predict the optimal combination for clinical testing.
Conclusions
Because of the chronic course of obesity and T2D, a useful drug must not only be effective, but also safe for prolonged administration to patients with these diseases. The clinical safety profile of opaganib given twice-daily to cancer patients for >24 months demonstrates the safety of extended continuous opaganib dosing regimens. Importantly, opaganib has an excellent safety profile and preliminary evidence of efficacy in patients with compromised organ function. For example, a Phase 2/3 multinational randomized, placebo-controlled study demonstrated the safety of opaganib in patients hospitalized with severe Covid-19, and a clinical benefit to patients requiring oxygen supplementation of 60% or less (62% reduction in rate of ventilation and death).20 To date, more than 470 people have been treated with opaganib in oncology and Covid-19 clinical trials. We also note that opaganib is very “patient friendly” in that it is easily administered as oral gelatin capsules rather than as an injection. The current data suggest that opaganib can be combined with semaglutide, and perhaps other GLP-1 drugs, to further increase weight loss and prevent weight rebound during periods of withdrawal of the GLP-1 agent for reasons such as intolerable side effects or prohibitive cost. Overall, opaganib has promise as a single-agent and in combination with other weight-control drugs to provide benefit to patients with obesity or obesity-related diseases.
Abbreviations
CD, control diet; DES1, dihydroceramide desaturase 1; GCS, glucosylceramide synthase; HbA1c, hemoglobin A1c; HFD, high-fat diet; SphK, sphingosine kinase; S1P, sphingosine 1-phosphate; T2D, type 2 diabetes.
Ethical Statements
The animal study protocols were approved by the Institutional Animal Care and Use Committee (IACUC) of the Penn State College of Medicine (Protocol number: PROTO202402718) in compliance with US Government Principles for the Utilization and Care of Vertebrate Animals Used in Testing, Research and Training, which complies with the United States Department of Agriculture Animal Welfare Act guidelines.
Author Contributions
All authors made a significant contribution to the work reported, whether that is in the conception, study design, execution, acquisition of data, analysis and interpretation, or in all these areas; took part in drafting, revising or critically reviewing the article; gave final approval of the version to be published; have agreed on the journal to which the article has been submitted; and agree to be accountable for all aspects of the work.
Funding
Funding for these studies was provided by the Commonwealth of Pennsylvania Department of Health (PADoH). The funder (PADoH) had no role in the collection, analyses, or interpretation of the data, in the writing of the manuscript, or in the decision to publish the results.
Disclosure
Lynn W. Maines, Staci N. Keller, Ryan A. Smith and Charles D. Smith are employees and own stock in Apogee Biotechnology Corporation. Apogee Biotechnology Corporation owns patent rights to opaganib, and the value of these rights may be affected by the research reported in the enclosed paper. The authors declare no other commercial or financial relationships that could be construed as a potential conflict of interest for this work.
References
1. Kajita K, Ishii I, Mori I, Asano M, Fuwa M, Morita H. Sphingosine 1-phosphate regulates obesity and glucose homeostasis. Int J mol Sci. 2024;25(2). doi:10.3390/ijms25020932
2. Duan M, Gao P, Chen SX, Novak P, Yin K, Zhu X. Sphingosine-1-phosphate in mitochondrial function and metabolic diseases. Obes Rev. 2022;23(6):e13426. doi:10.1111/obr.13426
3. Guitton J, Bandet CL, Mariko ML, et al. Sphingosine-1-phosphate metabolism in the regulation of obesity/type 2 diabetes. Cells. 2020;9(7):1682. doi:10.3390/cells9071682
4. Lewis CS, Voelkel-Johnson C, Smith CD. Targeting sphingosine kinases for the treatment of cancer. Adv Cancer Res. 2018;140:295–325. doi:10.1016/bs.acr.2018.04.015
5. Li J, Huang Y, Zhang Y, et al. S1P/S1PR signaling pathway advancements in autoimmune diseases. Biomol Biomed. 2023;23(6):922–935. doi:10.17305/bb.2023.9082
6. Aji G, Jiang S, Obulkasim H, Lu Z, Wang W, Xia P. Sphingosine kinase 2 regulates insulin receptor trafficking in hepatocytes. Exp Biol Med. 2023;248(1):44–51. doi:10.1177/15353702221131886
7. Qi Y, Wang W, Song Z, Aji G, Liu XT, Xia P. Role of sphingosine kinase in type 2 diabetes mellitus. Front Endocrinol. 2020;11:627076. doi:10.3389/fendo.2020.627076
8. Aji G, Huang Y, Ng ML, et al. Regulation of hepatic insulin signaling and glucose homeostasis by sphingosine kinase 2. Proc Natl Acad Sci U S A. 2020;117(39):24434–24442. doi:10.1073/pnas.2007856117
9. Ng ML, Wadham C, Sukocheva OA. The role of sphingolipid signalling in diabetes‑associated pathologies (Review). Int J Mol Med. 2017;39(2):243–252. doi:10.3892/ijmm.2017.2855
10. French KJ, Zhuang Y, Maines LW, et al. Pharmacology and antitumor activity of ABC294640, a selective inhibitor of sphingosine kinase-2. J Pharmacol Exp Ther. 2010;333(1):129–139. doi:10.1124/jpet.109.163444
11. Gao P, Peterson YK, Smith RA, Smith CD. Characterization of isoenzyme-selective inhibitors of human sphingosine kinases. PLoS One. 2012;7(9):e44543. doi:10.1371/journal.pone.0044543
12. Beljanski V, Knaak C, Smith CD. A novel sphingosine kinase inhibitor induces autophagy in tumor cells. J Pharmacol Exp Ther. 2010;333(2):454–464. doi:10.1124/jpet.109.163337
13. Antoon JW, White MD, Slaughter EM, et al. Targeting NFkB mediated breast cancer chemoresistance through selective inhibition of sphingosine kinase-2. Cancer Biol Ther. 2011;11(7):678–689. doi:10.4161/cbt.11.7.14903
14. Schrecengost RS, Keller SN, Schiewer MJ, Knudsen KE, Smith CD. Downregulation of critical oncogenes by the selective SK2 inhibitor ABC294640 hinders prostate cancer progression. mol Cancer Res. 2015;13(12):1591–1601. doi:10.1158/1541-7786.MCR-14-0626
15. Venant H, Rahmaniyan M, Jones EE, et al. The sphingosine kinase 2 inhibitor ABC294640 reduces the growth of prostate cancer cells and results in accumulation of dihydroceramides in vitro and in vivo. mol Cancer Ther. 2015;14(12):2744–2752. doi:10.1158/1535-7163.MCT-15-0279
16. Britten CD, Garrett-Mayer E, Chin SH, et al. A phase I study of ABC294640, a first-in-class sphingosine kinase-2 inhibitor, in patients with advanced solid tumors. Clin Cancer Res. 2017;23(16):4642–4650. doi:10.1158/1078-0432.CCR-16-2363
17. Kang Y, Sundaramoorthy P, Gasparetto C, et al. Phase I study of opaganib, an oral sphingosine kinase 2-specific inhibitor, in relapsed and/or refractory multiple myeloma. Ann Hematol. 2023;102(2):369–383. doi:10.1007/s00277-022-05056-7
18. Smith CD, Maines LW, Keller SN, et al. Recent progress in the development of opaganib for the treatment of covid-19. Drug Des Devel Ther. 2022;16:2199–2211. doi:10.2147/DDDT.S367612
19. Winthrop KL, Skolnick AW, Rafiq AM, et al. Opaganib in coronavirus disease 2019 pneumonia: results of a randomized, placebo-controlled phase 2a trial. Open Forum Infect Dis. 2022;9(7):ofac232. doi:10.1093/ofid/ofac232
20. Neuenschwander FC, Barnett-Griness O, Piconi S, et al. Effect of opaganib on supplemental oxygen and mortality in patients with severe SARS-CoV-2 based upon FIO(2) requirements. Microorganisms. 2024;12(9):1767. doi:10.3390/microorganisms12091767
21. Ebenezer DL, Berdyshev EV, Bronova IA, et al. Pseudomonas aeruginosa stimulates nuclear sphingosine-1-phosphate generation and epigenetic regulation of lung inflammatory injury. Thorax. 2019;74(6):579–591. doi:10.1136/thoraxjnl-2018-212378
22. Snider AJ, Ruiz P, Obeid LM, Oates JC. Inhibition of sphingosine kinase-2 in a murine model of lupus nephritis. PLoS One. 2013;8(1):e53521. doi:10.1371/journal.pone.0053521
23. Shin SH, Cho KA, Hahn S, et al. Inhibiting sphingosine kinase 2 derived-sphingosine-1-phosphate ameliorates psoriasis-like skin disease via blocking Th17 differentiation of naive CD4 T lymphocytes in mice. Acta Derm Venereol. 2019;99(6):594–601. doi:10.2340/00015555-3160
24. Zhu X, Shi D, Cao K, et al. Sphingosine kinase 2 cooperating with Fyn promotes kidney fibroblast activation and fibrosis via STAT3 and AKT. Biochim Biophys Acta Mol Basis Dis. 2018;1864(11):3824–3836. doi:10.1016/j.bbadis.2018.09.007
25. Maines LW, Keller SN, Smith RA, Green CL, Smith CD. The sphingolipid-modulating drug opaganib protects against radiation-induced lung inflammation and fibrosis: potential uses as a medical countermeasure and in cancer radiotherapy. Int J mol Sci. 2024;25(4):2322. doi:10.3390/ijms25042322
26. Maines LW, Schrecengost RS, Zhuang Y, et al. Opaganib protects against radiation toxicity: implications for homeland security and antitumor radiotherapy. Int J mol Sci. 2022;23(21). doi:10.3390/ijms232113191
27. Liu H, Toman RE, Goparaju SK, et al. Sphingosine kinase type 2 is a putative BH3-only protein that induces apoptosis. J Biol Chem. 2003;278(41):40330–40336. doi:10.1074/jbc.M304455200
28. Green CD, Brown RDR, Uranbileg B, et al. Sphingosine kinase 2 and p62 regulation are determinants of sexual dimorphism in hepatocellular carcinoma. mol Metab. 2024;86:101971. doi:10.1016/j.molmet.2024.101971
29. Ravichandran S, Finlin BS, Kern PA, Ozcan S. Sphk2(-/-) mice are protected from obesity and insulin resistance. Biochim Biophys Acta Mol Basis Dis. 2019;1865(3):570–576. doi:10.1016/j.bbadis.2018.12.012
30. Song Z, Wang W, Li N, et al. Sphingosine kinase 2 promotes lipotoxicity in pancreatic beta-cells and the progression of diabetes. FASEB J. 2019;33(3):3636–3646. doi:10.1096/fj.201801496R
31. Zhao J, Lee MJ. Sphingosine kinase 2 knockout mice resist HFD-induced obesity through increasing energy expenditure. Int J Endocrinol Metab. 2023;21(3):e136539. doi:10.5812/ijem-136539
32. Shi Y, Wei Q, Liu Y, Yuan J. The alleviating effect of sphingosine kinases 2 inhibitor K145 on nonalcoholic fatty liver. Biochem Biophys Res Commun. 2021;580:1–6. doi:10.1016/j.bbrc.2021.09.060
33. Lee SY, Hong IK, Kim BR, et al. Activation of sphingosine kinase 2 by endoplasmic reticulum stress ameliorates hepatic steatosis and insulin resistance in mice. Hepatology. 2015;62(1):135–146. doi:10.1002/hep.27804
34. Yuan J, Qiao J, Mu B, et al. Inhibition of SphK2 stimulated hepatic gluconeogenesis associated with dephosphorylation and deacetylation of STAT3. Arch Med Res. 2018;49(5):335–341. doi:10.1016/j.arcmed.2018.11.001
35. Hu W, Ross J, Geng T, Brice SE, Cowart LA. Differential regulation of dihydroceramide desaturase by palmitate versus monounsaturated fatty acids: implications for insulin resistance. J Biol Chem. 2011;286(19):16596–16605. doi:10.1074/jbc.M110.186916
36. Chaurasia B, Tippetts TS, Mayoral Monibas R, et al. Targeting a ceramide double bond improves insulin resistance and hepatic steatosis. Science. 2019;365(6451):386–392. doi:10.1126/science.aav3722
37. Veeriah V, Lee SH, Levine F. Long-term oral administration of an HNF4alpha agonist prevents weight gain and hepatic steatosis by promoting increased mitochondrial mass and function. Cell Death Dis. 2022;13(1):89. doi:10.1038/s41419-022-04521-5
38. Zarini S, Brozinick JT, Zemski Berry KA, et al. Serum dihydroceramides correlate with insulin sensitivity in humans and decrease insulin sensitivity in vitro. J Lipid Res. 2022;63(10):100270. doi:10.1016/j.jlr.2022.100270
39. Denimal D, Bergas V, Pais-de-Barros JP, et al. Liraglutide reduces plasma dihydroceramide levels in patients with type 2 diabetes. Cardiovasc Diabetol. 2023;22(1):104. doi:10.1186/s12933-023-01845-0
40. Barbarroja N, Rodriguez-Cuenca S, Nygren H, et al. Increased dihydroceramide/ceramide ratio mediated by defective expression of degs1 impairs adipocyte differentiation and function. Diabetes. 2015;64(4):1180–1192. doi:10.2337/db14-0359
41. Rustamov J, Roh YS, Hong JT, Yoo HS. GT-11 impairs insulin signaling through modulation of sphingolipid metabolism in C2C12 myotubes. Life Sci. 2024;342:122534. doi:10.1016/j.lfs.2024.122534
42. Bijl N, Sokolovic M, Vrins C, et al. Modulation of glycosphingolipid metabolism significantly improves hepatic insulin sensitivity and reverses hepatic steatosis in mice. Hepatology. 2009;50(5):1431–1441. doi:10.1002/hep.23175
43. van Eijk M, Aten J, Bijl N, et al. Reducing glycosphingolipid content in adipose tissue of obese mice restores insulin sensitivity, adipogenesis and reduces inflammation. PLoS One. 2009;4(3):e4723. doi:10.1371/journal.pone.0004723
44. Zhao H, Przybylska M, Wu IH, et al. Inhibiting glycosphingolipid synthesis ameliorates hepatic steatosis in obese mice. Hepatology. 2009;50(1):85–93. doi:10.1002/hep.22970
45. Yew NS, Zhao H, Hong EG, et al. Increased hepatic insulin action in diet-induced obese mice following inhibition of glucosylceramide synthase. PLoS One. 2010;5(6):e11239. doi:10.1371/journal.pone.0011239
46. Richards S, Larson CJ, Koltun ES, et al. Discovery and characterization of an inhibitor of glucosylceramide synthase. J Med Chem. 2012;55(9):4322–4335. doi:10.1021/jm300122u
47. Jang HJ, Lim S, Kim JM, et al. Glucosylceramide synthase regulates adipo-osteogenic differentiation through synergistic activation of PPARgamma with GlcCer. FASEB J. 2020;34(1):1270–1287. doi:10.1096/fj.201901437R
48. Adar T, Mizrahi M, Lichtenstein Y, et al. Increased hepatic Akt phosphorylation alleviated glucose intolerance and improved liver function in leptin-deficient mice. Clin Exp Hepatol. 2023;9(2):164–171. doi:10.5114/ceh.2023.127849
49. Lalazar G, Zigmond E, Weksler-Zangen S, et al. Oral administration of beta-glucosylceramide for the treatment of insulin resistance and nonalcoholic steatohepatitis: results of a double-blind, placebo-controlled trial. J Med Food. 2017;20(5):458–464. doi:10.1089/jmf.2016.3753
50. Margalit M, Shalev Z, Pappo O, et al. Glucocerebroside ameliorates the metabolic syndrome in OB/OB mice. J Pharmacol Exp Ther. 2006;319(1):105–110. doi:10.1124/jpet.106.104950
51. Zigmond E, Tayer-Shifman O, Lalazar G, et al. beta-glycosphingolipids ameliorated non-alcoholic steatohepatitis in the Psammomys obesus model. J Inflamm Res. 2014;7:151–158. doi:10.2147/JIR.S50508
52. Zigmond E, Zangen SW, Pappo O, et al. Beta-glycosphingolipids improve glucose intolerance and hepatic steatosis of the Cohen diabetic rat. Am J Physiol Endocrinol Metab. 2009;296(1):E72–8. doi:10.1152/ajpendo.90634.2008
53. Nagahashi M, Takabe K, Liu R, et al. Conjugated bile acid-activated S1P receptor 2 is a key regulator of sphingosine kinase 2 and hepatic gene expression. Hepatology. 2015;61(4):1216–1226. doi:10.1002/hep.27592
54. Shi Y, Rehman H, Ramshesh VK, et al. Sphingosine kinase-2 inhibition improves mitochondrial function and survival after hepatic ischemia-reperfusion. J Hepatol. 2012;56(1):137–145. doi:10.1016/j.jhep.2011.05.025
55. Nair AB, Jacob S. A simple practice guide for dose conversion between animals and human. J Basic Clin Pharm. 2016;7(2):27–31. doi:10.4103/0976-0105.177703
56. Morselli E, Criollo A, Rodriguez-Navas C, Clegg DJ. Chronic high fat diet consumption impairs metabolic health of male mice. Inflamm Cell Signal. 2014;1(6):e561. doi:10.14800/ics.561
57. Morselli E, Fuente-Martin E, Finan B, et al. Hypothalamic PGC-1alpha protects against high-fat diet exposure by regulating ERalpha. Cell Rep. 2014;9(2):633–645. doi:10.1016/j.celrep.2014.09.025
58. Astrup A. Reflections on the discovery GLP-1 as a satiety hormone: implications for obesity therapy and future directions. Eur J Clin Nutr. 2024;78(7):551–556. doi:10.1038/s41430-024-01460-6
59. Mei M, Liu M, Mei Y, Zhao J, Li Y. Sphingolipid metabolism in brain insulin resistance and neurological diseases. Front Endocrinol. 2023;14:1243132. doi:10.3389/fendo.2023.1243132
60. Casado ME, Collado-Perez R, Frago LM, Barrios V. Recent advances in the knowledge of the mechanisms of leptin physiology and actions in neurological and metabolic pathologies. Int J mol Sci. 2023;24(2):1422. doi:10.3390/ijms24021422
61. Engin A. The mechanism of leptin resistance in obesity and therapeutic perspective. Adv Exp Med Biol. 2024;1460:463–487. doi:10.1007/978-3-031-63657-8_16
62. Chavez JA, Summers SA. A ceramide-centric view of insulin resistance. Cell Metab. 2012;15(5):585–594. doi:10.1016/j.cmet.2012.04.002
63. Hammerschmidt P, Ostkotte D, Nolte H, et al. CerS6-derived sphingolipids interact with mff and promote mitochondrial fragmentation in obesity. Cell. 2019;177(6):1536–1552e23. doi:10.1016/j.cell.2019.05.008
64. Jayashankar V, Selwan E, Hancock SE, et al. Drug-like sphingolipid SH-BC-893 opposes ceramide-induced mitochondrial fission and corrects diet-induced obesity. EMBO Mol Med. 2021;13(8):e13086. doi:10.15252/emmm.202013086
65. Liu Q, Rehman H, Shi Y, et al. Inhibition of sphingosine kinase-2 suppresses inflammation and attenuates graft injury after liver transplantation in rats. PLoS One. 2012;7(7):e41834. doi:10.1371/journal.pone.0041834
66. Roszczyc-Owsiejczuk K, Zabielski P. Sphingolipids as a culprit of mitochondrial dysfunction in insulin resistance and type 2 diabetes. Front Endocrinol. 2021;12:635175. doi:10.3389/fendo.2021.635175
67. Schomel N, Geisslinger G, Wegner MS. Influence of glycosphingolipids on cancer cell energy metabolism. Prog Lipid Res. 2020;79:101050. doi:10.1016/j.plipres.2020.101050
 © 2025 The Author(s). This work is published and licensed by Dove Medical Press Limited. The
full terms of this license are available at https://www.dovepress.com/terms
and incorporate the Creative Commons Attribution
- Non Commercial (unported, 4.0) License.
By accessing the work you hereby accept the Terms. Non-commercial uses of the work are permitted
without any further permission from Dove Medical Press Limited, provided the work is properly
attributed. For permission for commercial use of this work, please see paragraphs 4.2 and 5 of our Terms.
© 2025 The Author(s). This work is published and licensed by Dove Medical Press Limited. The
full terms of this license are available at https://www.dovepress.com/terms
and incorporate the Creative Commons Attribution
- Non Commercial (unported, 4.0) License.
By accessing the work you hereby accept the Terms. Non-commercial uses of the work are permitted
without any further permission from Dove Medical Press Limited, provided the work is properly
attributed. For permission for commercial use of this work, please see paragraphs 4.2 and 5 of our Terms.