Back to Journals » Nature and Science of Sleep » Volume 14
Obstructive Sleep Apnoea Syndrome Screening Through Wrist-Worn Smartbands: A Machine-Learning Approach
Authors Benedetti D ![]() , Olcese U, Bruno S
, Olcese U, Bruno S ![]() , Barsotti M, Maestri Tassoni M, Bonanni E, Siciliano G, Faraguna U
, Barsotti M, Maestri Tassoni M, Bonanni E, Siciliano G, Faraguna U ![]()
Received 6 December 2021
Accepted for publication 27 February 2022
Published 18 May 2022 Volume 2022:14 Pages 941—956
DOI https://doi.org/10.2147/NSS.S352335
Checked for plagiarism Yes
Review by Single anonymous peer review
Peer reviewer comments 2
Editor who approved publication: Prof. Dr. Ahmed BaHammam
Davide Benedetti,1 Umberto Olcese,2 Simone Bruno,1 Marta Barsotti,3 Michelangelo Maestri Tassoni,3,4 Enrica Bonanni,3,4 Gabriele Siciliano,3,4 Ugo Faraguna1,5
1Department of Translational Research and of New Surgical and Medical Technologies, University of Pisa, Pisa, Italy; 2Cognitive and Systems Neuroscience Group, Swammerdam Institute for Life Sciences, University of Amsterdam, Amsterdam, the Netherlands; 3Neurological Clinics, University Hospital of Pisa, Pisa, Italy; 4Department of Clinical and Experimental Medicine, University of Pisa, Pisa, Italy; 5Department of Developmental Neuroscience, IRCCS Fondazione Stella Maris, Pisa, Italy
Correspondence: Ugo Faraguna, Department of Translational Research and of New Surgical and Medical Technologies, University of Pisa, Via San Zeno, 31, Pisa, 56123, Italy, Tel +39 050 2213470, Email [email protected]
Purpose: A large portion of the adult population is thought to suffer from obstructive sleep apnoea syndrome (OSAS), a sleep-related breathing disorder associated with increased morbidity and mortality. International guidelines include the polysomnography and the cardiorespiratory monitoring (CRM) as diagnostic tools for OSAS, but they are unfit for a large-scale screening, given their invasiveness, high cost and lengthy process of scoring. Current screening methods are based on self-reported questionnaires that suffer from lack of objectivity. On the contrary, commercial smartbands are wearable devices capable of collecting accelerometric and photoplethysmographic data in a user-friendly and objective way. We questioned whether machine-learning (ML) classifiers trained on data collected through these wearable devices would help predict OSAS severity.
Patients and Methods: Each of the patients (n = 78, mean age ± SD: 57.2 ± 12.9 years; 30 females) underwent CRM and concurrently wore a commercial wrist smartband. CRM’s traces were scored, and OSAS severity was reported as apnoea hypopnoea index (AHI). We trained three pairs of classifiers to make the following prediction: AHI < 5 vs AHI ≥ 5, AHI < 15 vs AHI ≥ 15, and AHI < 30 vs AHI ≥ 30.
Results: According to the Matthews correlation coefficient (MCC), the proposed algorithms reached an overall good correlation with the ground truth (CRM) for AHI < 5 vs AHI ≥ 5 (MCC: 0.4) and AHI < 30 vs AHI ≥ 30 (MCC: 0.3) classifications. AHI < 5 vs AHI ≥ 5 and AHI < 30 vs AHI ≥ 30 classifiers’ sensitivity, specificity, positive predictive values (PPV), negative predictive values (NPV) and diagnostic odds ratio (DOR) are comparable with the STOP-Bang questionnaire, an established OSAS screening tool.
Conclusion: Machine learning algorithms showed an overall good performance. Unlike questionnaires, these are based on objectively collected data. Furthermore, these commercial devices are widely distributed in the general population. The aforementioned advantages of machine-learning algorithms applied to smartbands’ data over questionnaires lead to the conclusion that they could serve a population-scale screening for OSAS.
Keywords: obstructive sleep apnoea syndrome, screening, wearable devices, wrist-worn smartbands, artificial intelligence
Introduction
Obstructive Sleep Apnoea Syndrome (OSAS) is characterized by frequent events of cessation of airflow during sleep, associated with sleep arousal, oxygen desaturation and the concurrent persistence of respiratory effort.1 This sleep-related breathing disorder is highly prevalent among adults,2,3 and it is associated with a higher mortality and morbidity as compared to the general population.4–6 OSAS can be assessed through Polysomnography (PSG), the reference standard technique, or through alternative diagnostic methods such as cardiorespiratory monitoring (CRM). The American Academy of Sleep Research (AASM) and the European Respiratory Society included both PSG and CRM in their clinical guidelines,7,8 but they are relatively invasive, expensive and time consuming in the process of sleep events scoring.9,10 Due to resource constraints, it is therefore unfeasible to resort to PSG or CRM for general population screening purposes. As several studies claim that OSAS goes largely undiagnosed, not being recognized in up to 90% of patients,11,12 it is imperative to investigate new convenient tools to screen the general population for OSAS. A possible way to reduce the invasiveness of the PSG and CRM might be single-lead electrocardiography (ECG). The application on the skin of just two electrodes allows to collect data over both the electrical activity of the heart and the status of the autonomic nervous system, known to be perturbed by the OSAS events.13,14 Recent studies achieved promising results using single-lead ECG signals to train deep neural networks: Feng et al15 reached a sensitivity of 86.1% relative to the gold standard, using an unsupervised learning approach for feature extraction; Yang et al16 reached a sensitivity of 87.1% with a deep learning algorithm capable of extracting from the single-lead ECG cardiopulmonary features. Other studies reached comparable results.17–20 Nevertheless, a single-lead ECG approach does not solve the problem of screening the general population for OSAS: the single-lead ECG test needs to be administered by a health-care provider after having grown a suspicion of OSAS, whereby these methods are promising alternatives to PSG and CRM but cannot be used to pursue a large-scale screening in an unaware population.
A machine-learning (ML) approach allows to collect a relatively small number of features and feed them into an algorithm capable of making predictions. So far, researchers have mainly focused on training ML algorithms on questionnaires or data collected through various medical devices. Mencar et al trained a series of ML-algorithms on anthropometric and clinical data collected via questionnaires. The best algorithm of this study reached a poor accuracy (44.7%), making the authors conclude that ML-algorithms cannot be used for automated diagnosis of OSAS, even if they might find an application in estimating the probability of OSAS and may be useful for prioritizing the access to PSG and CRM resources. Uston et al21 trained SLIM (Supersparse Linear Integer Model) on questionnaire’s data based on the medical history of the patient. Although SLIM is considerably easy-to-use, it reached a sensitivity of 64.2%, too low for a first-level test that aims at screening the general population. Beyond the ML approach, self-reported questionnaires have been investigated for making prediction and grading OSAS;: the Epworth Sleepiness Scale, the Berlin questionnaire, the STOP questionnaire, and the STOP-Bang questionnaire are among the most studied in literature,22,23 and the last considered as the one with the highest methodological validity and accuracy. Questionnaires are reliable, but they suffer from a response rate (range 82–91%) that is insufficient for OSAS screening.22 The low response rate might be explained by their high complexity, and relatively long time taken for filling them in. Furthermore, questionnaires’ result is thought to be dependent upon the relative willingness of the patient to complete them, willingness generally higher in the sleep-clinic population compared to the general one.22 This makes questionnaires draw on subjective data that might bias the result of the test.
Medical-grade wearable devices have been the object of recent experimental interest, and various studies addressed the applicability of algorithms trained on data collected through these devices for OSAS screening and detection. Wearables are equipped with different sensors, such as accelerometers and photoplethysmography, that allow gathering physiological data such as the tri-axial movement of the wrist and cardiorespiratory related parameters, respectively.24 Among the investigated wearables, there is reflective photoplethysmography,25 which data was used to train ML-algorithm that reached a correlation of 61% to the PSG reference. Deep learning model based on tracheal-placed accelerometers26 reached a better sensitivity, specificity, and accuracy of 81%, 87%, and 84%, respectively. Similar approaches used both photoplethysmographic sensors placed on the nasal septum27 or electrocardiogram wearable belts.28 Despite this promising outcome, this approach remains prototypal, relatively invasive, and not particularly suitable for large population screenings.
An alternative approach to medical-grade devices could instead take advantage of the widespread distribution of biometric sensors in the consumer market. More specifically, consumer wrist-worn smartbands are considered affordable and minimally invasive, capable of continuously collecting physiological data, such as heart rate (HR) and sleep parameters.29 Fitbit Inc. devices, such as Fitbit ChargeHRTM, Fitbit Charge 2TM and Fitbit AltaHRTM, are amid the most studied commercial smartbands.30 Their accelerometric and HR measures have been validated in literature both during sleep and wakefulness, showing higher sensor accuracy during sleep.30–36 Their unobtrusiveness, their easy accessibility and reliability makes these devices compatible with a population-based screening test.
In this study, we evaluated the performance of supervised ML-algorithms trained on smartbands’ data to predict and grading OSAS. Three different pairs of algorithms were trained to classify patients according to three different cut-offs: AHI <5 vs AHI >5, AHI <15 vs AHI ≥15 and AHI <30 vs AHI ≥30. We then compared their performance to the pooled performance reported by Nagappa et al37 in their systematic review. We then questioned whether a multistep classification would achieve a better performance. We modified the training dataset for the AHI <15 vs AHI ≥15 and AHI <30 vs AHI ≥30 classifications as follows: we excluded healthy patients (AHI <5) by both datasets, while we dropped those having the AHI <15 from the AHI <30 vs AHI ≥30 training datasets.
Methods
Cohort Selection and Cardiorespiratory Monitoring
Volunteers were recruited among patients of the Sleep Centre of Santa Chiara Hospital in Pisa, Italy. Each volunteer was equipped with one of the CRM devices available at the Sleep Centre: Nox T3, Nox Medical; Somté, Compumedics; Embletta MPR, Natus Medical; Sleep and go, Sibelmed; Sleepdoc porti 8, Dr. Fenyves und Gut Deutschland GmbH. Each device collected the following physiological parameters: nasal airflow, chest and abdominal muscle’s activity, pulse, oxygen saturation and snoring. A trained professional scored the CRM’s recordings according to the AASM’s 2012 guidelines. The AHI was used to estimate the severity of the disease.38 Table 1 shows sample size, gender distribution, mean age and mean Body Mass Index (BMI) of the sample, stratified by OSAS severity class. Patients’ comorbidities for each AHI severity group (healthy, mild, moderate and severe) are depicted in Supplementary Table 1.
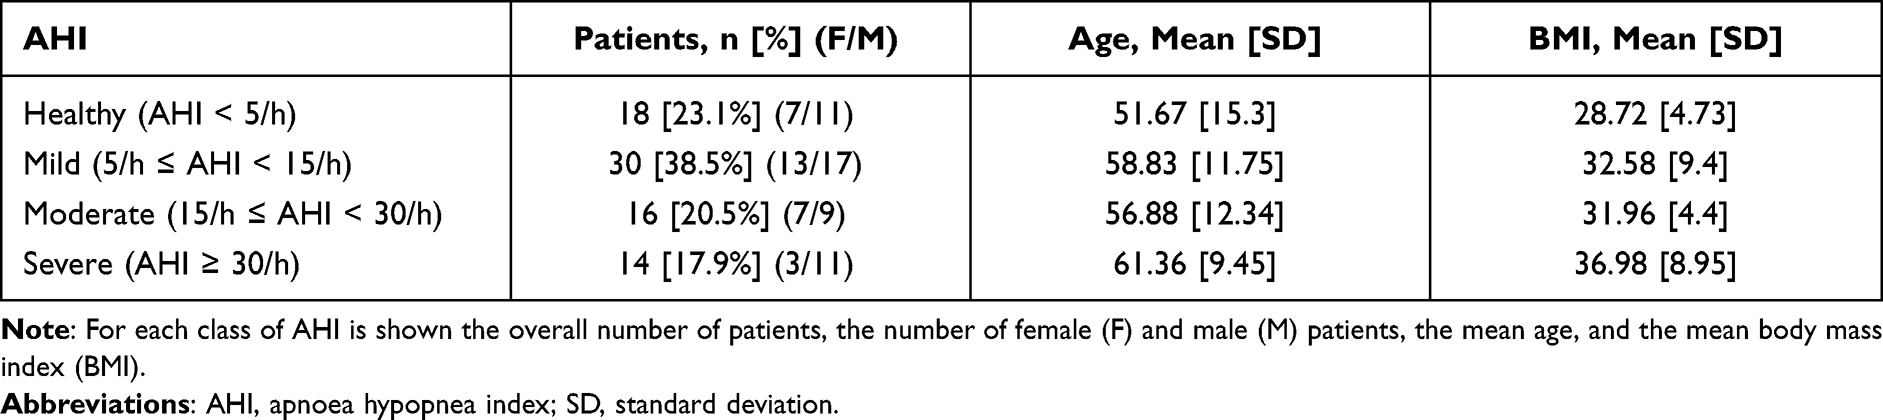 |
Table 1 Description of the Training Dataset |
This study was approved by the Pisa University Hospital Bioethical Committee (CEAVNO protocol No: 42714). Participants provided written informed consent to take part in the study. The current study complies with the Declaration of Helsinki.
Fitbit Data
In this study, we used two different models of Fitbit Inc.’s smartbands: Fitbit Charge4TM and Fitbit AltaHRTM, both equipped with a triaxial accelerometer sensor (micro-electro-mechanical systems [MEMS] 3-axis accelerometer) and a photoplethysmographic sensor (PurePulse® light-emitting diode). Accelerometric measures were processed by a Fitbit Inc. proprietary algorithm to compute both energy expenditure and steps, while the photoplethysmographic measures, shaped as a pulsatile waveform,24 were used to calculate HR by the aforementioned proprietary algorithm. Data were downloaded from the Application Programming Interface (API) provided by Fitbit through a third-party platform (www.sleepacta.com). Energy expenditure data were stored at a frequency of one data point per minute, while the HR data were stored at a frequency of one data point per second during physical exercise, one data point each five seconds otherwise.31 The third-party platform returns a minute-by-minute wake-sleep staging and derives from this sleep staging a series of sleep parameters through DORMI, a proprietary deep-learning algorithm.39,40 Among these parameters, six of them were used to train the algorithm: sleep efficiency (SE), defined as the ratio of total sleep time (TST) to time in bed;41 TST itself; Sleep Fragmentation Index (SFI), defined as the total number of awakenings divided by the total sleep time;42 Wake After Sleep Onset (WASO), defined as the period of wakefulness that occurs after a defined sleep onset;43 number of awakenings (Naw) after sleep onset and the mean length of awakenings after sleep onset (mLaw). Figure 1 shows one representative patients smartbands’ data for each disease’s severity class according to the AHI estimated by CRM.
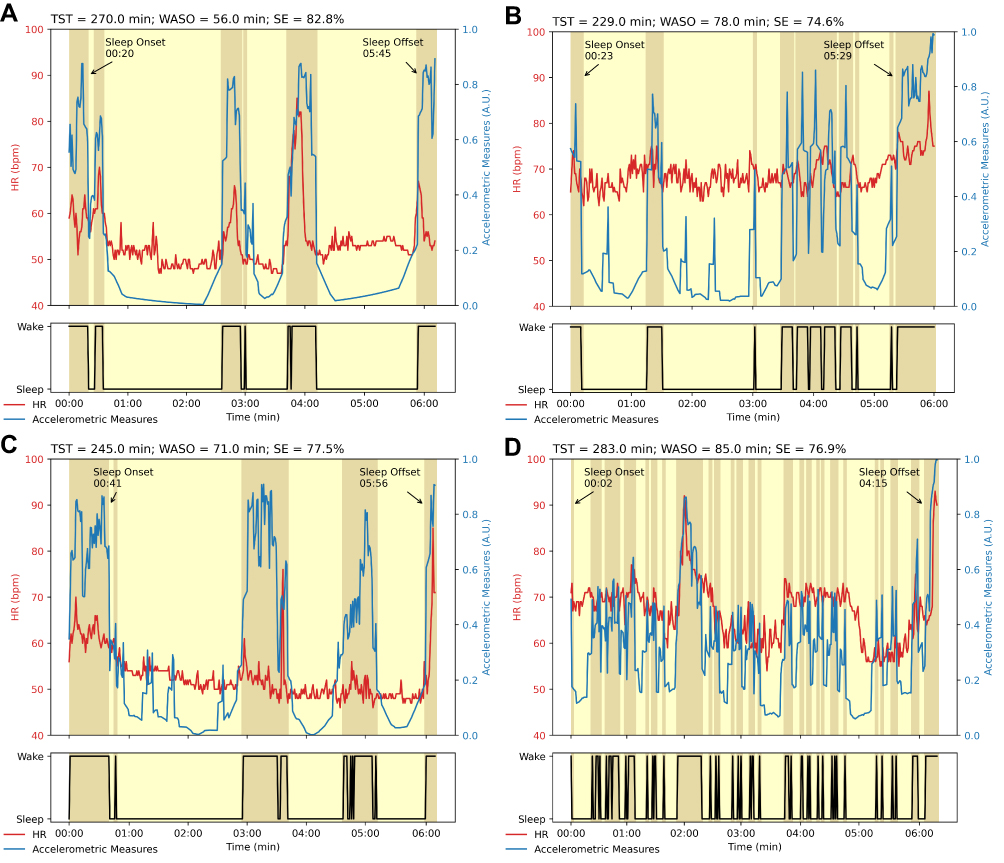 |
Figure 1 Minute-by-minute smartbands measures for each AHI’s severity class. Accelerometric, heart rate (HR) measures and sleep-wake classification according to the DORMI algorithm for (A) Healthy participant (AHI = 0.0/h), (B) Mild (AHI = 12.1/h), (C) Moderate (AHI = 16.8/h), and (D) Severe (AHI = 60.1/h) representative OSAS patients. |
Machine-Learning Algorithms
ML algorithms were provided by scikit-learn, a Python-based library.44 Three different pairs of algorithms were used, and in each pair the algorithms were placed in series to classify OSAS severity. The first algorithm of the pair was trained on the dataset composed of data collected through wrist-worn smartbands, while the second one was trained on the same dataset of the former one, but the output of the classification reached by the first algorithm of the pair was fed as additional descriptor. To reach the best performance by each pair of classifiers, we adjusted the parameters through a trial-and-error approach to improve the outcome results.
The first pair of algorithms returned an AHI <5 vs AHI >5 classification. The first algorithm consisted of a multi-layer perceptron (MLP) classifier, initialized as follows: number of layers, 2; number of neurons in the first layer, 200; number of neurons in the second layer, 100; activation function, Rectified Linear Unit (ReLU); L2 regularization term, 0.01; all other parameters were kept as scikit-learn defaults. The second algorithm was a MLP classifier, initialized as follows: number of layers,2; number of neurons in the first layer, 200; number of neurons in the second layer 100; activation function, Logistic; L2 regularization term, 0.01; all other parameters were kept as scikit-learn defaults.
The second pair of algorithms made AHI <15 vs AHI ≥15 classification. The first algorithm was a MLP classifier, initialized as follows: number of layers, 2; number of neurons in the first layer, 100; number of neurons in the second layer, 100; activation function, ReLU; L2 regularization term, 0.001; all other parameters were kept as scikit-learn defaults (https://scikit-learn.org/stable/modules/generated/sklearn.neural_network.MLPClassifier.html. Accessed May 6, 2022.). The second algorithm was a Random Forest classifier, initialized as follows: number of estimators, 2000; all other parameters were kept as scikit-learn defaults (https://scikit-learn.org/stable/modules/generated/sklearn.ensemble.RandomForestClassifier.html. Accessed May 6, 2022).
The third pair of algorithms made AHI <30 vs AHI ≥30 classification. The first algorithm was a Random Forest classifier, initialized as follows: number of estimators, 200; all other parameters were kept as scikit-learn defaults. The second algorithm was a Random Forest classifier, initialized as follows: number of estimators, 2000; all other parameters were kept as scikit-learn defaults.
Training and Cross-Validation
The descriptors used to train the algorithm were: Age, Gender, BMI, SE, TST, SFI, WASO, Naw, mLaw, the mean HR during sleep (mHRs) mean HR during sleep arousal (mHRw). The relative contribution of each descriptor to the outcome performance included in the final algorithm is depicted in the Supplementary Figure 1. AHI was correlated to each descriptor of the present dataset. We further compared the mean AHI between groups identified by Gender and Comorbidity status (Supplementary Table 2).
As for cross-validation, we adopted the Leave-One-Out (LOO) procedure: given a dataset of N instances, we left out just one instance as validation set, and for each round of LOO procedure, the algorithm was trained on N-1 instances. Since the AHI’s severity classes had not the same numerosity, to avoid misclassification due to dataset size imbalance, we applied the following procedure: for each round of LOO’s training, the algorithm was trained T times. Each time we randomly selected I instance among the N-1 that composed the training dataset of the LOO’s round. Therefore, the dataset was composed of an equal number of instances for each AHI’s severity class. The algorithm was set to have a “warm start” that is, the algorithm reused the solution of previous calls for initialization. The values of T and I were: 8 and 7 for Healthy vs OSAS-suffering classification, 6 and 6 for both AHI <15 vs AHI ≥15 and for AHI <30 vs AHI ≥30 classifications. We reduced the T and I for the last two trainings since we trained AHI <15 vs AHI ≥15 and AHI <30 vs AHI ≥30 on a dataset with AHI ≥5 only and AHI ≥15 only patients.
To verify that the data sample was large enough to support the training of the algorithms, we adopted the following procedure. Starting from 78 participants, we repeated the leave-one-out procedure on the AHI <5 vs AHI >5 pair of algorithms 30 times. We calculated the mean sensitivity of this procedure. We then randomly dropped from the original dataset 2 participants, and we retrained the AHI <5 vs AHI ≥5 pair of algorithms 30 times via cross-validation (LOO), each time eliminating 2 random participants. We finally calculated the mean sensitivity reached by the algorithms. That is, we questioned how the sensitivity was affected by training the algorithms on a reduced (76 participants) dataset. This overall procedure was repeated progressively dropping 5, 10, and then 20 participants from the original dataset. The results of the overall sample estimation procedure are summarized in Supplementary Figure 2. Given that the mean sensitivity is stable (ie, it shows a plateau) even when the number of participants in the training dataset is progressively reduced, we conclude that our sample is large enough.
Performance Metrics and Statistical Analysis
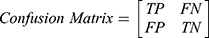
The algorithms’ predictions fall into one of the following categories: True Positives (TP), ie, actual positive (OSAS patients) correctly classified as positives; False Positives (FP), ie, actual negative (healthy) misclassified as positives; True Negatives (TN), ie, actual negative (healthy) correctly classified as negatives; False Negatives (FN), ie, actual positive (OSAS patients) misclassified as negatives. The afore-mentioned categories were used to calculate the following performance parameters:


We calculated the Matthews Correlation Coefficient because it was found to be more informative than Accuracy and F1-score. MCC ranges from −1 (perfect misclassification) to 1 (perfect classification).45 Confusion matrices were produced through scikit-learn44 library, while all the other parameters were calculated through a custom script based on NumPy library.48
To evaluate the relative importance of each descriptor for the algorithms presented here, we adopted the permutation feature importance technique issued by the Python-based scikit-learn library.42 This technique allows to calculate a model score, which indicates how much a model resorts to a single feature of the dataset to generate its output. The model score was calculated here randomly shuffling a single feature for 10 times.
Results
Table 2 shows algorithms’ performance of predicting the AHI severity class in AHI <5 vs AHI ≥5, AHI <15 vs AHI ≥15 and AHI <30 vs AHI ≥30 cohorts, along with the pooled predictive parameters of the STOP-Bang questionnaire on the sleep clinic population, according to Nagappa et al.37
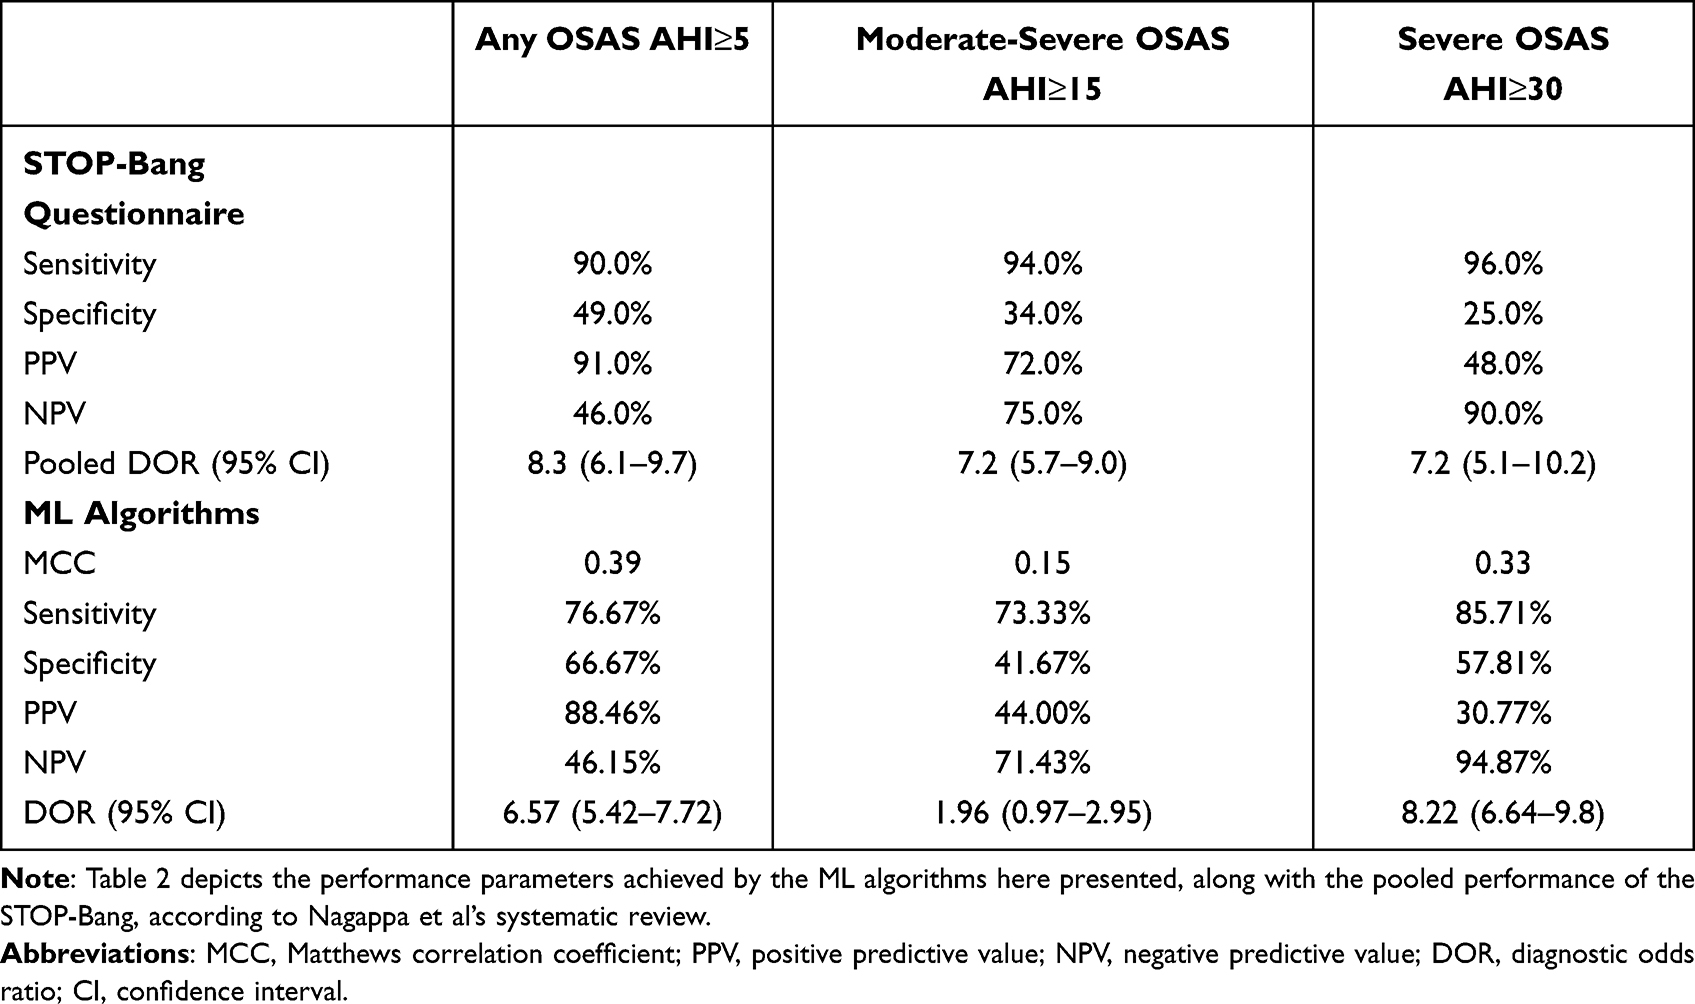 |
Table 2 Comparison of ML Algorithms’ and STOP-Bang Questionnaire’s Performance Parameters |
To visually assess the classification performance, Figure 2 shows two confusion matrices for each OSAS severity prediction.
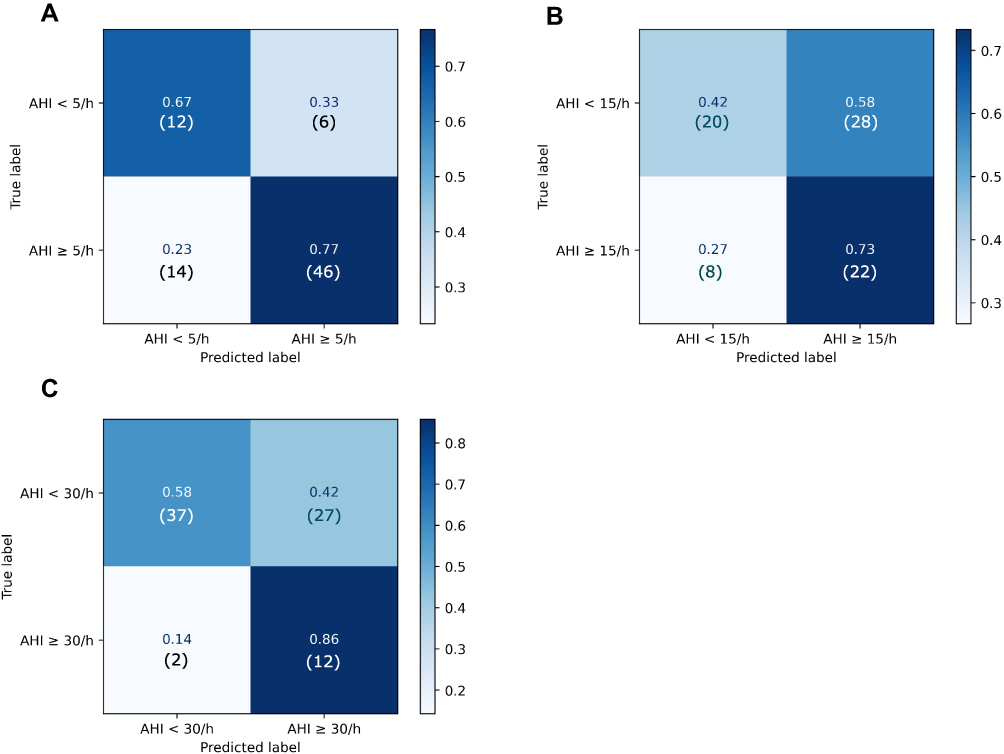 |
Figure 2 Confusion matrices for each AHI <5 vs AHI ≥5, AHI <15 vs AHI ≥15 and AHI <30 vs AHI ≥30 cohort. Figure 2 shows confusion matrices normalized to the ground truth for each AHI <5 vs AHI ≥5 (A), AHI <15 vs AHI ≥15 (B) and AHI <30 vs AHI ≥30 (C) classification. The number of predictions falling in each category is shown in brackets. |
According to the MCC, the algorithms here presented reached an overall good correlation with the severity class estimated by the CRM for AHI <5 vs AHI >5 prediction (MCC: 0.4) and AHI <30 vs AHI ≥30 prediction (MCC: 0.3), while poor results were reached in AHI <15 vs AHI ≥15 classification (MCC: 0.2). The sensitivity (AHI<5 vs AHI ≥5: 76.7%; AHI <15 vs AHI ≥15: 73.3%; AHI <30 vs AHI ≥30: 85.7%) was lower than the sensitivity of the STOP-Bang questionnaire (AHI <5 vs AHI ≥5: 90.0%; AHI <15 vs AHI ≥15: 94.0%; AHI <30 vs AHI ≥30: 96.0%), while the specificity (AHI <5 vs AHI ≥5: 66.7%; AHI <15 vs AHI ≥15: 41.7%; AHI <30 vs AHI ≥30: 57.8%) always outperformed the specificity of STOP-Bang questionnaire (AHI <5 vs AHI ≥5: 49.0%; AHI <15 vs AHI ≥15: 34.0%; AHI <30 vs AHI ≥30: 25.0%). PPV of AHI <5 vs AHI ≥5 (PPV: 88.5%) and AHI <30 vs AHI ≥30 (PPV: 30.8%) classifiers are in line with the pooled PPV presented by Nagappa et al (AHI <5 vs AHI ≥5: 91.0%; AHI <30 vs AHI ≥30: 48.0%), while the AHI <15 vs AHI ≥15 classifier performs worse in predicting positive patients (PPV: 44.0%), as compared to STOP-Bang questionnaire (PPV: 72.0%). NPV of classifiers here presented (AHI <5 vs AHI ≥5: 46.2%; AHI <15 vs AHI ≥15: 71.4%; AHI <30 vs AHI ≥30: 94.9%) matched the STOP-Bang pooled NPVs (AHI <5 vs AHI ≥5: 46.0%; AHI <15 vs AHI ≥15: 75.0%; AHI <30 vs AHI ≥30: 90.0%). For both AHI <5 vs AHI ≥5 and AHI <30 vs AHI ≥30 predictions, the DOR of ML-algorithms and the STOP-Bang were similar, and their confidence interval (CI) overlapped the corresponding STOP-Bang’s CI. DOR for AHI <15 vs AHI ≥15 prediction (DOR: 2.0; CI: 1.0–2.0) was lower than the corresponding STOP-Bang’s pooled DOR (DOR: 7.2; CI: 5.7–9.0).
Figure 3 shows the misclassified and correctly classified patients for each AHI <5 vs AHI ≥5, AHI <15 vs AHI ≥15 and AHI <30 vs AHI ≥30 cohorts, along with the distance between the cut-off of OSAS severity estimated by the CRM ground-truth.
 |
Figure 3 Correctly classified and misclassified patients for each AHI <5 vs AHI ≥5, AHI <15 vs AHI ≥15 and AHI <30 vs AHI ≥30 cohort. Figure 3 shows those patients that were correctly classified (Orange) and misclassified (blue) in each AHI <5 vs AHI ≥5 (A), AHI <15 vs AHI ≥15 (B) and AHI <30 vs AHI ≥30 (C) classification. Vertical dashed lines represent the error gravity of the classifier, ie, the distance between the cut-off (dark-blue horizontal line) and the AHI estimated by the CRM ground (y axis). |
OSAS Patient Classification
Healthy participants were not excluded neither from the AHI <15 vs AHI ≥15 nor from AHI <30 vs AHI ≥30 classifications so far presented. To assess the algorithm’s ability to diagnose the severity of OSAS in patients only (ie, after excluding healthy subjects), we re-trained the AHI <15 vs AHI ≥15 algorithm only on those patients having AHI ≥5 (Mild vs Moderate-Severe classification), while the dataset used for training the AHI <30 vs AHI ≥30 algorithm comprised only those patients having AHI ≥15 (Moderate vs Severe classification). Performance parameters and confusion matrices are shown in Table 3 and Figure 4, respectively.
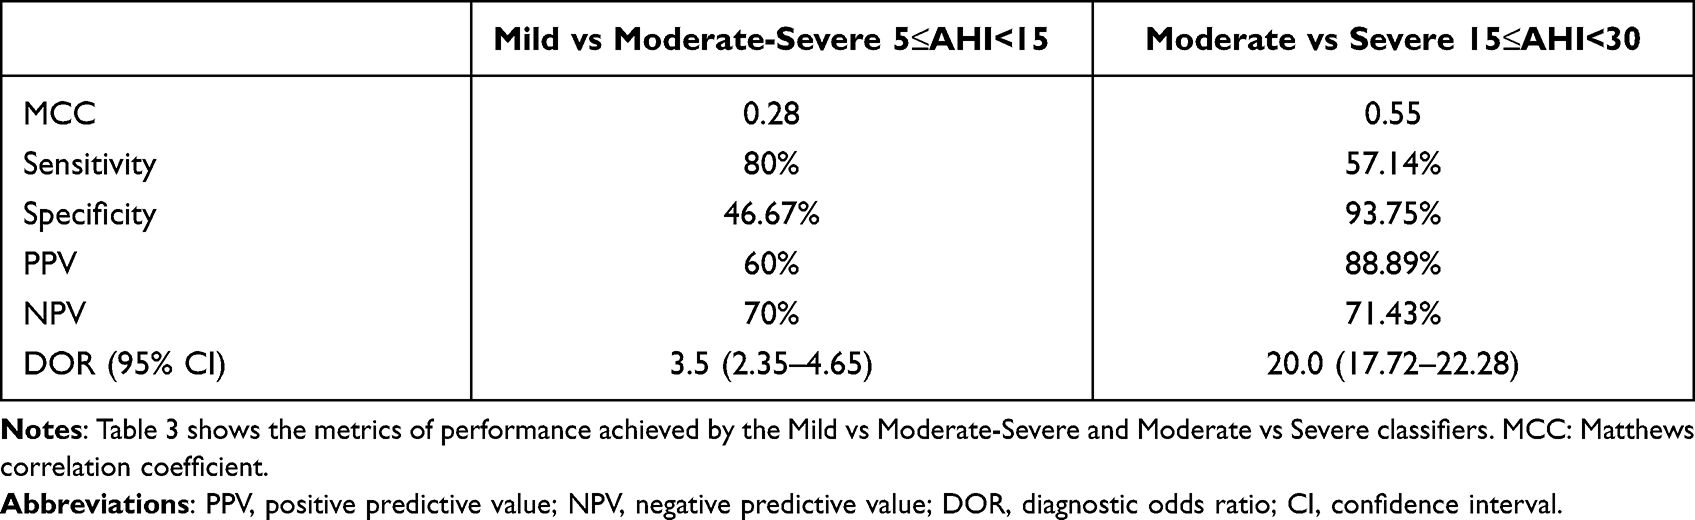 |
Table 3 Mild vs Moderate-Severe and Moderate vs Severe Classification |
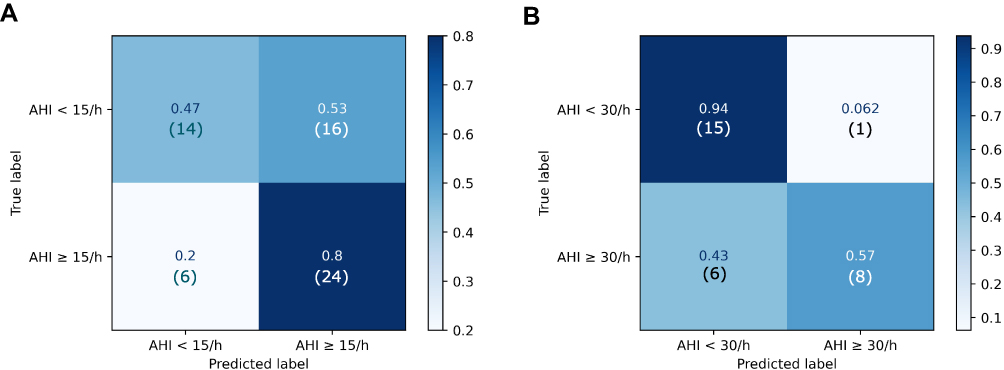 |
Figure 4 Confusion matrices for Mild vs Moderate-Severe and Moderate vs Severe classifiers. Figure 4 shows confusion matrices normalized to the ground truth for Mild vs Moderate-Severe, ie, AHI <15 vs AHI ≥15 (A) and Moderate vs Severe, ie, AHI <30 vs AHI ≥30 (B) classifications. The number of predictions falling in each category is shown in brackets. |
Both the Mild vs Moderate-Severe (MCC: 0.3) and the Moderate vs Severe (MCC: 0.6) classification reached a good concordance with the CRM’s severity class. Mild vs Moderate-Severe classification reached a high sensitivity score (Sensitivity: 80%) but a poor specificity (Specificity: 46.7%). On the contrary, Moderate vs Severe classification showed a high specificity (Specificity: 93.8%) but a poor sensitivity (Sensitivity: 57.1%). PPV was higher in the Moderate vs Severe classification (PPV: 88.9%) than in the Mild vs Moderate-Severe classification (PPV: 60%), while the NPVs of these ML algorithms were similar (Mild vs Moderate-Severe: 70.0%; Moderate vs Severe classification: 71.4%). DOR was notably high in Moderate vs Severe classification (DOR: 20.0; CI: 17.7–22.3), while it was lower in Mild vs Moderate-Severe classification (DOR: 3.5; CI: 2.4–4.7).
Figure 5 shows the misclassified patients by AHI <15 vs AHI ≥15 and AHI <30 vs AHI ≥30 predictions. For each patient, its AHI and AHI severity class estimated by CRM is reported along with the predicted class by ML algorithms.
 |
Figure 5 Correctly classified and misclassified patients for Mild vs Moderate-Severe and Moderate vs Severe classifiers. Figure 5 shows those patients that were correctly classified (Orange) misclassified (blue) in each Mild vs Moderate-Severe (A), Moderate vs Severe (B) classification. Vertical dashed lines represent the degree of error of the classifier, ie, the distance between the cut-off (dark-blue horizontal line) and the AHI estimated by the CRM ground (y axis). |
Introspection Analysis: Feature Importance
Figure 6 depicts the results of the feature importance analysis for each of the algorithms here presented.
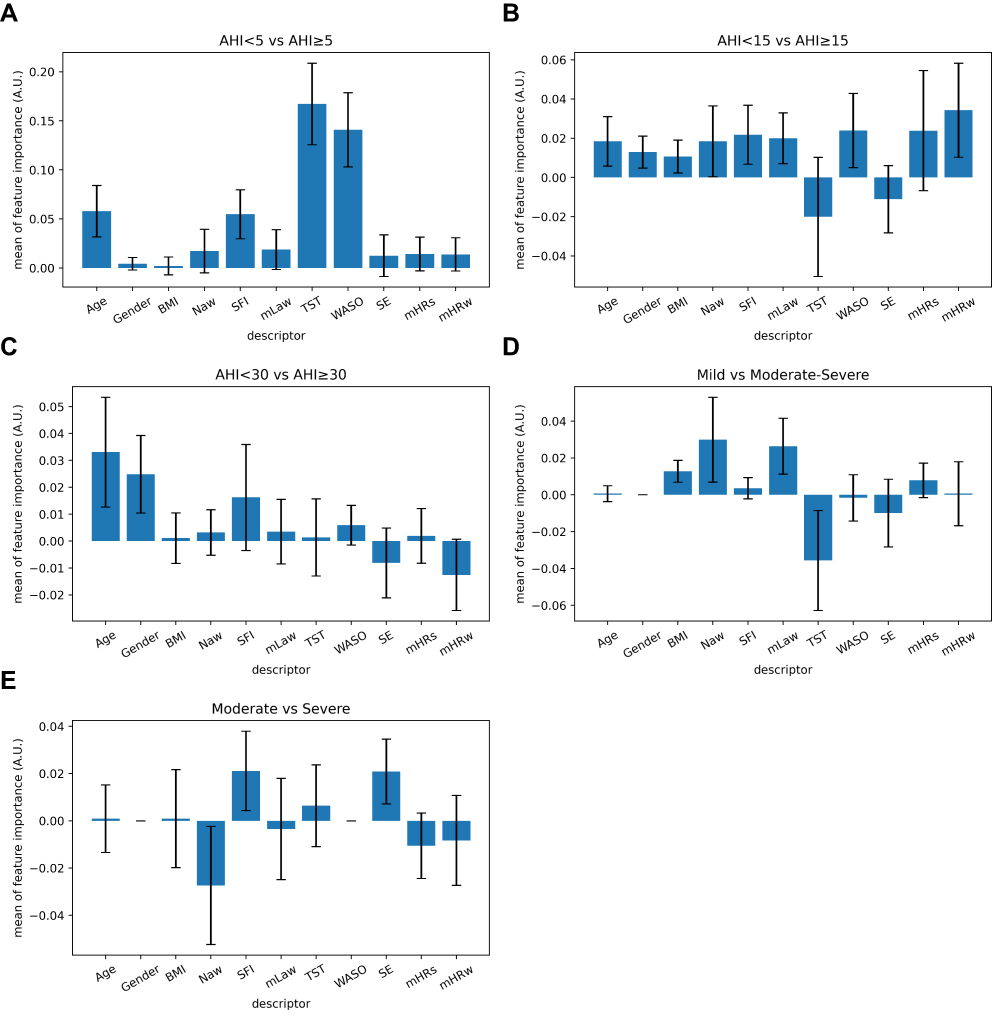 |
Figure 6 Mean feature importance for each classifier. Figure 6 shows the mean feature importance of each descriptor fed in the algorithms of the following classifiers: AHI <5 vs AHI ≥5 (A), AHI <15 vs AHI ≥15 (B), AHI <30 vs AHI ≥30 (C), Mild vs Moderate-Severe (D) and Moderate vs Severe (E) classifications. The feature importance is a metric for introspecting a machine-learning model. This technique weights how much a descriptor contributes to the classifier. |
The AHI <5 vs AHI ≥5 algorithm relies significantly on TST (0.167 ± 0.041), WASO (0.141 ± 0.038), Age (0.058 ± 0.026), and SFI (0.054 ± 0.024). Gender (0.004 ± 0.006), BMI (0.002 ± 0.009), Naw (0.017 ± 0.022), mLaw (0.0189 ± 0.020), SE (0.013 ± 0.021), mHRs (0.014 ± 0.017) and mHRw (0.014 ± 0.017) contribute less to the model.
The AHI <15 vs AHI ≥15 algorithm’s features contribute homogeneously to the model, as suggested by the following model scores: Age (0.018 ± 0.013); Gender (0.013 ± 0.008); BMI (0.010 ± 0.008); Naw (0.018 ± 0.018); SFI (0.021 ± 0.015); mLaw (0.020 ± 0.013); WASO (0.024 ± 0.019); mHRs (0.024 ± 0.031); mHRw (0.034 ± 0.023). On the other hand, TST (−0.020 ± 0.030) and SE (−0.011 ± 0.017) show a weaker effect.
The AHI <30 vs AHI ≥30 algorithm’s main features are represented by Age (0.033 ± 0.020), Gender (0.025 ± 0.014) and SFI (0.016 ± 0.019). BMI (0.001 ± 0.001), Naw (0.003 ± 0.009), mLaw (0.003 ± 0.011), TST (0.001 ± 0.014), WASO (0.006 ± 0.007), mHRs (0.002 ± 0.010), SE (−0.008 ± 0.013) and mHRw (−0.012 ± 0.013) do not significantly contribute to the performance of this algorithm.
The Mild vs Moderate-Severe algorithm was found to mainly rely on the following descriptors: BMI (0.013 ± 0.006); Naw (0.029 ± 0.023) and mLaw (0.026 ± 0.015). Low or none contribution was given by Age (0.001 ± 0.004), Gender (0 ± 0), SFI (0.001 ± 0.006), mHRs (0.008 ± 0.009) and mHRw (0.001 ± 0.017). TST (−0.036 ± 0.027), WASO (−0.002 ± 0.013) and SE (−0.009 ± 0.019) did not show model scores.
The Moderate vs Severe classifier is mainly based on SFI (0.021 ± 0.019) and SE (0.021 ± 0.014). Little contribution was provided by the following descriptors: Age (0.001 ± 0.014); Gender (0 ± 0); BMI (0.001 ± 0.021); mLaw (−0.003 ± 0.021); TST (0.006 ± 0.018); WASO (0 ± 0); SE (0.021 ± 0.014); Naw (−0.027 ± 0.025); mHRs (−0.011 ± 0.013); mHRw (−0.008 ± 0.019).
Discussion
In this study, we assessed the performance of three different machine learning (ML) algorithms trained on accelerometric and photoplethysmographic data collected through wrist-worn Fitbit Inc.’s smartbands. The algorithms were independently trained on two independent data cohorts. For the first data cohort, the dataset collected was subdivided according to the following AHI cut-offs: AHI <5/AHI ≥5, AHI <15/AHI ≥15 and AHI <30/AHI ≥30. Each AHI <5, AHI <15 and AHI <30 class comprised all the patients having the AHI estimated by CRM, respectively, below 5/h, 15/h, and 30/h. For the second data cohort, we excluded from the AHI <15 class the patients having AHI <5/h, while those patients having AHI <15/h were excluded from the AHI <30 class. We chose this dual approach for several reasons: the first data cohort served the purpose of comparing the outcome of the classifier with the STOP-Bang Questionnaire’s pooled performance, according to the metrics reported by Nagappa et al’s systematic review. DOR is a useful tool for comparing the performance of different diagnostic tests evaluated in different studies.47 For AHI <5 vs AHI ≥5 and AHI <30 vs AHI ≥30 classification, the DOR reached by our ML approach is comparable to the pooled DOR reached by the STOP-Bang questionnaire (Table 2). Conversely, the DOR of the AHI <15 vs AHI ≥15 classifier is lower than the pooled DOR for the STOP-Bang. Even if useful for comparing diagnostic tests, DOR only is not sufficient to decide whether to include a new diagnostic tool in the clinical practice.47 For this purpose, PPV and NPV are more reliable parameters. For each classifier, PPV and NPV of ML algorithms are comparable to the pooled performance parameters of the STOP-Bang Questionnaire, suggesting that ML algorithms based on data collected through smartband data could serve as a viable strategy to screen OSAS in the general population.
The second data cohort, in which AHI <15 vs AHI ≥15 and AHI <30 vs AHI ≥30 classifiers were trained on modified datasets, was not intended to be applied for comparison between screening tools, but to combine the ML algorithms in a multistep process that aims at estimating OSAS severity. Once classified as at risk of OSAS through the AHI <5 vs AHI ≥5 classifier, the patient’s measures could be fed into AHI <15 vs AHI ≥15 and AHI <30 vs AHI ≥30 classifiers to assess the severity of the disease. This double step approach has a practical application: according to both the AASM’s clinical practice guidelines7 and the algorithm for diagnosis of OSAS proposed by the European Respiratory Society (ERS) task force,49 PSG and CRM are tests to be undergone only after a clinical evaluation of the patient. In particular, the AASM’s diagnostic algorithm begins upon “clinical suspicion based on a comprehensive sleep evaluation” and the collection of the information necessary to establish a differential diagnosis, and to administer the most adequate clinical diagnostic tests. AASM does not propose a standard procedure to make this clinical evaluation, such as a standardized administration of pre-tests that return a clinical probability of OSAS. Given the widespread distribution of wearable devices,29 an algorithm can be a feasible standard procedure to screen the general population for OSAS.
The performance achieved by the AHI <5 vs AHI ≥5 algorithm is comparable to the one of other studies in which ML-algorithms were trained on data derived from wearable devices. In Table 4 is compared the performance of our algorithm that makes the AHI <5 vs AHI ≥5 classification to performance’s metrics of other studies.
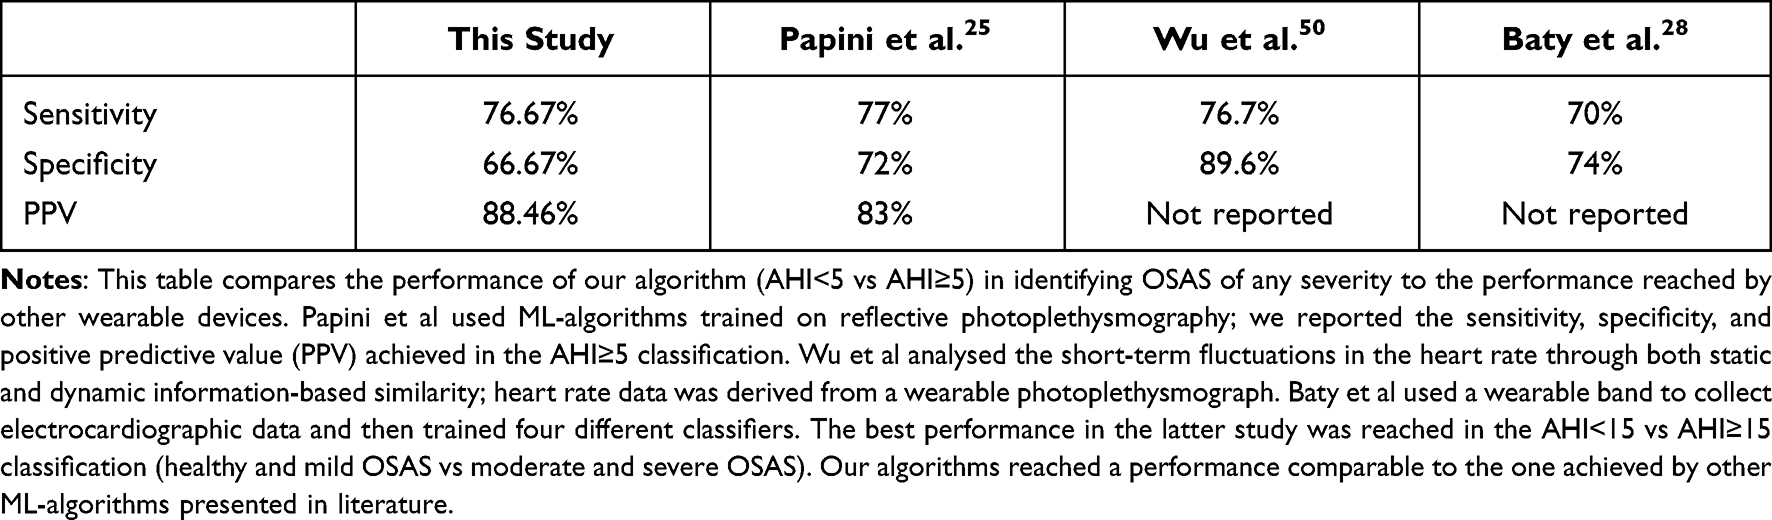 |
Table 4 Comparison of the AHI <5 vs AHI >5 Algorithm to Other ML-Algorithms Based on Wearable Devices |
The sensitivity of the algorithms presented in these studies averages off at 77%. This might suggest that the intrinsic instability of the wearable sensor placed around the wrist25,50 or the thorax, as in Baty et al28 may account for the lower performance compared to non-wearable devices (as later discussed in Limitations).
ML-algorithms based on physiological data could have several advantages over the commonly used self-reported questionnaires: monitoring through smartbands would avoid the subjectivity of self-reported symptoms. Since they do not require the wearer to play an active part in the diagnostic process, they could be affected less by the OSAS-suspected willingness to fill in a questionnaire. Furthermore, their minimal invasiveness could increase patients’ compliance. To support the latter point, wrist-worn smartbands have been tested and validated in different clinical and home-monitoring settings and have been always found as well-tolerated tools.51–53 Another advantage of commercial smartbands over self-reported questionnaires is the long-term data storage and their suitability to retrospective studies. Users’ data collected through Fitbit Inc.’s and similar devices can be indefinitely stored within the manufacturer’s server, and thereby retrieved through the API provided by the company. Since OSAS is often unrecognized, the opportunity to retroactively screen wearables’ users through previously collected smartbands’ measures is a promising way for identifying potential OSAS patients unaware of their condition. The cohort of people that can take advantage of this retroactive approach is higher than 31 million people, the number of active users of Fitbit Inc.’s devices in 202054. This number will probably raise in the next years, according to perspective studies on the wearable devices’ share in forthcoming years.55
Limitations
A limitation of this study consists of the misclassification of several patients by the ML algorithms. Even if both overestimation and underestimation of patients’ severity could occur, underestimation is the most critical one since it can prevent a patient from undergoing additional investigations. This point is crucial for the AHI <5 vs AHI >5 algorithm, the first step in the evaluation of OSAS risk. To investigate the possible causes of misclassification, we inspected the AHI of patients whose disease severity was underestimated by the AHI <5 vs AHI ≥5 algorithm (Table 5).
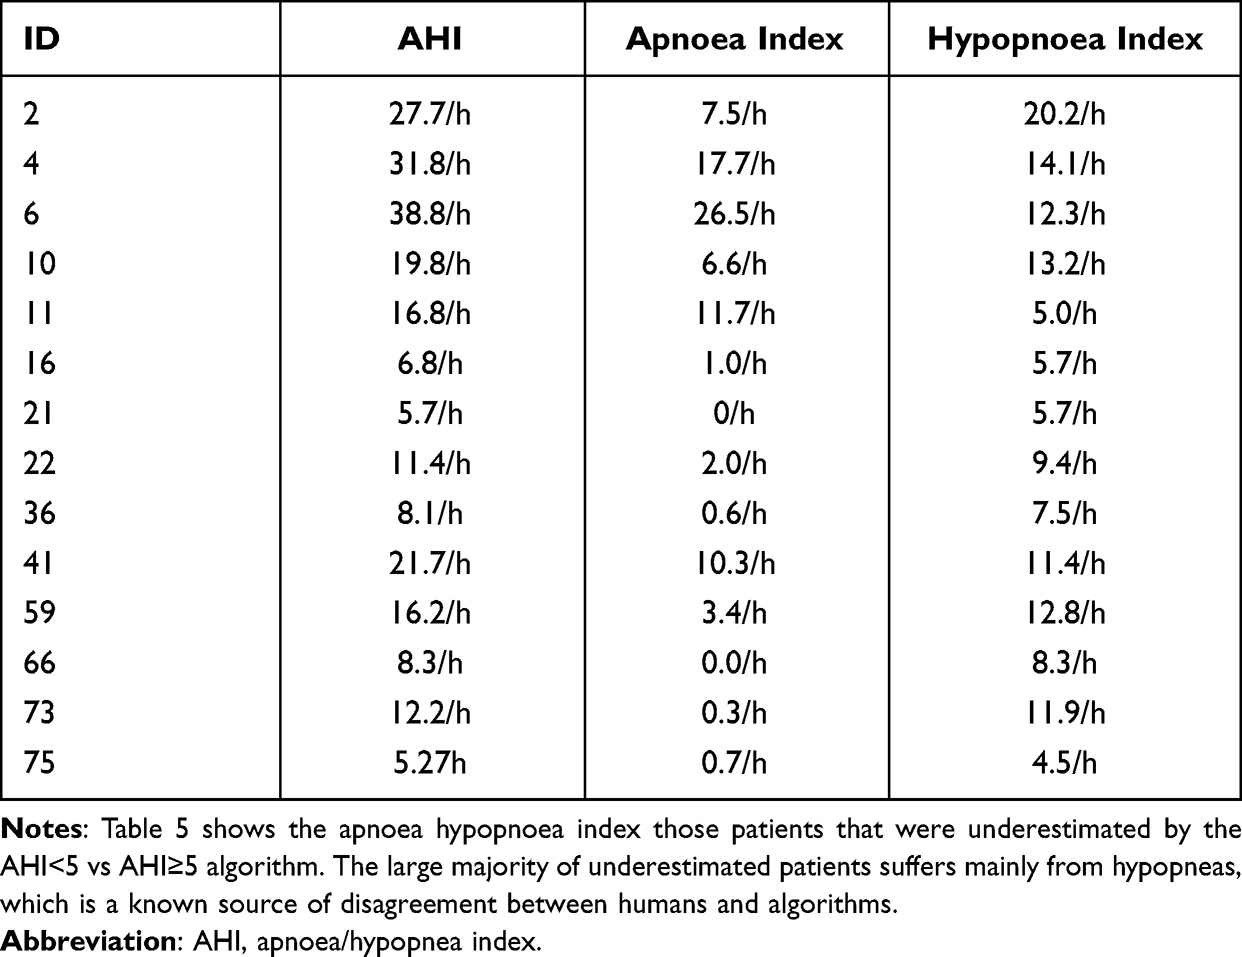 |
Table 5 Apnoea Hypopnoea Index for Underestimated Patients by the AHI <5 vs AHI ≥5 Algorithm |
The vast majority of AHI underestimations presented mainly hypopnea events (11 participants out of 14), which are a known source of higher disagreement between human and automatic scorers.25,56,57
Another possible limitation of the study is represented by the worse performance attained by our algorithms compared to other non-wearable medical devices. Tang and Liu58 proposed a new index, derived from a temporal dependency analysis method, achieving a sensitivity of 92.5% of OSAS screening. Gupta et al18 achieved an accuracy of 94.97%, a sensitivity of 94.58% and a specificity of 94.95% training their OSACN-Net model on single-lead ECG data. These studies outperformed our algorithms. Nevertheless, our performance is in line with that reached by other wearable devices, as discussed. The possible explanation to this gap in performance might be found in the different kind of information conveyed by wrist-worn smartbands. The information collected through electrocardiography allows the deep neural network to extract features that are informative over the state of the autonomic nervous system, which is known to be affected by the OSAS events.59 The nature of the wearable data is intrinsically simpler and comes with a lower amount of information: wrist-worn smartbands collect heart rate with a one-minute sampling frequency, and accelerometric data of the wrist with a one-minute sampling frequency. We exclude that the deterioration of performance is caused by an imbalance of AHI classes (healthy, mild OSAS, moderate OSAS and severe OSAS) insofar as in each leave-one-out split we adopted a procedure (as already discussed in the methods section) that aimed at avoiding any imbalance in the dataset fed into the algorithms.
In the clinical setting, actigraphic data (if available) could be retrospectively used in patients with a clinical suspicion of OSAS without performing any further examination. Moreover, a combined use of both self-reported questionnaire and physiological data could be implemented, further improving diagnostic value.
Even if trained on Fitbit Charge4TM and Fitbit AltaHRTM, our algorithms can be applied to other devices, given that the sensors of Fitbit Inc. are not device-specific but are shared by different smartbands.33 Unfortunately, the recruited patients were only Caucasian: it is not possible to predict the performance of these classifiers on other human populations of skin tone, known to affect the quality of photoplethysmographic measures.60
Future developments in the proposed screening algorithms will likely incorporate descriptors such as oxygen saturation and blood pressure, when the relative data collected by novel consumer sensors will become available.61
Conclusions
In this study, we trained a multistep machine learning algorithm to classify the severity of OSAS using cardiorespiratory monitoring as ground truth reference. The classifiers were trained on data collected through wrist-worn smartbands. The sensitivity and specificity achieved by our AHI <5 vs AHI >5 algorithm are in line with the ones of other algorithms trained on data derived by wearable devices. The results indicate that these devices could be a promising source of physiological data to train algorithms based on artificial intelligence architectures. These algorithms capable of identifying OSAS patients among apparently healthy individuals and of evaluating the severity of the disease in OSAS patients, might be useful to make a large-scale population screening for OSAS. The low invasiveness, and convenience of these commercially available devices, along with their comparable performance to commonly used subjective self-reported questionnaires make smartbands suitable for screening in the general population for OSAS.
Abbreviations
AASM, American Academy of Sleep Medicine; AHI, Apnoea Hypopnoea Index; API, Application Programming Interface; CRM, Cardiorespiratory Monitoring; ERS, European Respiratory Society; FN, False Negative; FP, False Positive; HR, Heart Rate; LOO, Leave-One-Out; MCC, Matthews correlation coefficient; mHRs, mean HR during sleep; mHRw, mean HR during sleep arousal; ML, Machine Learning; mLaw, mean length of awakenings after sleep onset; MLP, multi-layer perceptron; Naw, number of awakenings; OSAS, Obstructive Sleep Apnoea Syndrome; PSG, Polysomnography; ReLU, Rectified Linear Unit; SE, Sleep Efficiency; SFI, Sleep Fragmentation Index; SLIM, Supersparse Linear Integer Model; TN, True Negative; TP, True Positive; TST, Total Sleep Time; WASO, Wake After Sleep Onset.
Funding
UF was funded by Arpa Foundation (https://fondazionearpa.it/) and by Grant RC 1.21 Italian Ministry of Health.
Disclosure
UF and UO are co-founders of sleepActa S.r.l, a spin-off company of the University of Pisa operating in the field of sleep medicine. All other authors declare no competing interests.
References
1. Roux F, D’Ambrosio C, Mohsenin V. Sleep-related breathing disorders and cardiovascular disease. Am J Med. 2000;108(5):396–402. doi:10.1016/S0002-9343(00)00302-8
2. Punjabi NM. The epidemiology of adult obstructive sleep apnea. Proc Am Thorac Soc. 2008;5(2):136–143. doi:10.1513/pats.200709-155MG
3. Franklin KA, Lindberg E. Obstructive sleep apnea is a common disorder in the population - a review on the epidemiology of sleep apnea. J Thorac Dis. 2015;7(8):1311–1322. doi:10.3978/j.issn.2072-1439.2015.06.11
4. Dodds S, Williams LJ, Roguski A, et al. Mortality and morbidity in obstructive sleep apnoea-hypopnoea syndrome: results from a 30-year prospective cohort study. ERJ Open Res. 2020;6(3):00057–2020. doi:10.1183/23120541.00057-2020
5. Parra O, Arboix A, Montserrat JM, Quinto L, Bechich S, Garcia-Eroles L. Sleep-related breathing disorders: impact on mortality of cerebrovascular disease. Eur Respir J. 2004;24(2):267–272. doi:10.1183/09031936.04.00061503
6. Vijayan VK. Morbidities associated with obstructive sleep apnea. Expert Rev Respir Med. 2012;6(5):557–566. doi:10.1586/ers.12.44
7. Kapur VK, Auckley DH, Chowdhuri S, et al. Clinical practice guideline for diagnostic testing for adult obstructive sleep apnea: an American Academy of Sleep Medicine Clinical Practice Guideline. J Clin Sleep Med. 2017;13(3):479–504. doi:10.5664/jcsm.6506
8. Corral-Penafiel J, Pepin JL, Barbe F. Ambulatory monitoring in the diagnosis and management of obstructive sleep apnoea syndrome. Eur Respir Rev. 2013;22(129):312–324. doi:10.1183/09059180.00004213
9. Elbaz M, Roue GM, Lofaso F, Quera Salva MA. Utility of actigraphy in the diagnosis of obstructive sleep apnea. Sleep. 2002;25(5):527–531.
10. Mencar C, Gallo C, Mantero M, et al. Application of machine learning to predict obstructive sleep apnea syndrome severity. Health Informatics J. 2020;26(1):298–317. doi:10.1177/1460458218824725
11. Singh M, Liao P, Kobah S, Wijeysundera DN, Shapiro C, Chung F. Proportion of surgical patients with undiagnosed obstructive sleep apnoea. Br J Anaesth. 2013;110(4):629–636. doi:10.1093/bja/aes465
12. Young T, Evans L, Finn L, Palta M. Estimation of the clinically diagnosed proportion of sleep apnea syndrome in middle-aged men and women. Sleep. 1997;20(9):705–706. doi:10.1093/sleep/20.9.705
13. Jo JA, Blasi A, Valladares E, Juarez R, Baydur A, Khoo MC. Determinants of heart rate variability in obstructive sleep apnea syndrome during wakefulness and sleep. Am J Physiol Heart Circ Physiol. 2005;288(3):H1103–1112. doi:10.1152/ajpheart.01065.2003
14. Guilleminault C, Poyares D, Rosa A, Huang YS. Heart rate variability, sympathetic and vagal balance and EEG arousals in upper airway resistance and mild obstructive sleep apnea syndromes. Sleep Med. 2005;6(5):451–457. doi:10.1016/j.sleep.2005.03.014
15. Feng K, Qin H, Wu S, Pan W, Liu G. A sleep apnea detection method based on unsupervised feature learning and single-lead electrocardiogram. IEEE Trans Instrum Meas. 2021;70:1–12. doi:10.1109/tim.2020.3020682
16. Yang Q, Zou L, Wei K, Liu G. Obstructive sleep apnea detection from single-lead electrocardiogram signals using one-dimensional squeeze-and-excitation residual group network. Comput Biol Med. 2021;140:105124. doi:10.1016/j.compbiomed.2021.105124
17. Shen Q, Qin H, Wei K, Liu G. Multiscale deep neural network for obstructive sleep apnea detection using RR interval from single-lead ECG signal. IEEE Trans Instrum Meas. 2021;70:1–13.
18. Gupta K, Bajaj V, Ansari IA. OSACN-Net: automated classification of sleep apnea using deep learning model and smoothed Gabor spectrograms of ECG signal. IEEE Trans Instrum Meas. 2021;71:1.
19. Liu HQ. A dual-model deep learning method for sleep apnea detection based on representation learning and temporal dependence. Neurocomputing. 2022;473:24–36. doi:10.1016/j.neucom.2021.12.001
20. Liu QY. Obstructive sleep apnea detection from single-lead electrocardiogram signals using one-dimensional squeeze-and-excitation residual group network. Comput Biol Med. 2022;140:105124.
21. Ustun B, Westover MB, Rudin C, Bianchi MT. Clinical prediction models for sleep apnea: the importance of medical history over symptoms. J Clin Sleep Med. 2016;12(2):161–168. doi:10.5664/jcsm.5476
22. Abrishami A, Khajehdehi A, Chung F. A systematic review of screening questionnaires for obstructive sleep apnea. Can J Anaesth. 2010;57(5):423–438. doi:10.1007/s12630-010-9280-x
23. Amra B, Rahmati B, Soltaninejad F, Feizi A. Screening questionnaires for obstructive sleep apnea: an updated systematic review. Oman Med J. 2018;33(3):184–192. doi:10.5001/omj.2018.36
24. Allen J. Photoplethysmography and its application in clinical physiological measurement. Physiol Meas. 2007;28(3):R1–39. doi:10.1088/0967-3334/28/3/R01
25. Papini GB, Fonseca P, van Gilst MM, Bergmans JWM, Vullings R, Overeem S. Wearable monitoring of sleep-disordered breathing: estimation of the apnea-hypopnea index using wrist-worn reflective photoplethysmography. Sci Rep. 2020;10(1):13512. doi:10.1038/s41598-020-69935-7
26. Hafezi M, Montazeri N, Saha S. Sleep apnea severity estimation from tracheal movements using a deep learning model. IEEE Access. 2020;8:22641–22649. doi:10.1109/ACCESS.2020.2969227
27. Manoni A, Loreti F, Radicioni V, et al. A new wearable system for home sleep apnea testing, screening, and classification. Sensors. 2020;20(24):7014. doi:10.3390/s20247014
28. Baty F, Boesch M, Widmer S, et al. Classification of sleep apnea severity by electrocardiogram monitoring using a novel wearable device. Sensors. 2020;20(1):286. doi:10.3390/s20010286
29. Henriksen A, Haugen Mikalsen M, Woldaregay AZ, et al. Using fitness trackers and smartwatches to measure physical activity in research: analysis of consumer wrist-worn wearables. J Med Internet Res. 2018;20(3):e110. doi:10.2196/jmir.9157
30. Fuller D, Colwell E, Low J, et al. Reliability and validity of commercially available wearable devices for measuring steps, energy expenditure, and heart rate: systematic review. JMIR Mhealth Uhealth. 2020;8(9):e18694. doi:10.2196/18694
31. Benedetti D, Olcese U, Frumento P, et al. Heart rate detection by Fitbit ChargeHR(): a validation study versus portable polysomnography. J Sleep Res. 2021;30(6):e13346. doi:10.1111/jsr.13346
32. Benedetto S, Caldato C, Bazzan E, Greenwood DC, Pensabene V, Actis P. Assessment of the Fitbit Charge 2 for monitoring heart rate. PLoS One. 2018;13(2):e0192691. doi:10.1371/journal.pone.0192691
33. Haghayegh S, Khoshnevis S, Smolensky MH, Diller KR. Accuracy of PurePulse photoplethysmography technology of Fitbit Charge 2 for assessment of heart rate during sleep. Chronobiol Int. 2019;36(7):927–933. doi:10.1080/07420528.2019.1596947
34. de Zambotti M, Baker FC, Willoughby AR, et al. Measures of sleep and cardiac functioning during sleep using a multi-sensory commercially-available wristband in adolescents. Physiol Behav. 2016;158:143–149. doi:10.1016/j.physbeh.2016.03.006
35. Nelson BW, Allen NB. Accuracy of consumer wearable heart rate measurement during an ecologically valid 24-hour period: intraindividual validation study. JMIR Mhealth Uhealth. 2019;7(3):e10828. doi:10.2196/10828
36. Tedesco S, Sica M, Ancillao A, Timmons S, Barton J, O’Flynn B. Validity evaluation of the fitbit charge2 and the Garmin vivosmart HR+ in free-living environments in an older adult cohort. JMIR Mhealth Uhealth. 2019;7(6):e13084. doi:10.2196/13084
37. Nagappa M, Liao P, Wong J, et al. Validation of the STOP-Bang Questionnaire as a screening tool for obstructive sleep apnea among different populations: a systematic review and meta-analysis. PLoS One. 2015;10(12):e0143697. doi:10.1371/journal.pone.0143697
38. Berry RB, Budhiraja R, Gottlieb DJ, et al. Rules for scoring respiratory events in sleep: update of the 2007 AASM manual for the scoring of sleep and associated events. deliberations of the sleep apnea definitions task force of the American Academy of Sleep Medicine. J Clin Sleep Med. 2012;8(5):597–619. doi:10.5664/jcsm.2172
39. Banfi T, Valigi N, Di Galante M, d’Ascanio P, Ciuti G, Faraguna U. Efficient embedded sleep wake classification for open-source actigraphy. Sci Rep. 2021;11(1):345. doi:10.1038/s41598-020-79294-y
40. Guarnieri B, Maestri M, Cucchiara F, et al. Multicenter study on sleep and circadian alterations as objective markers of mild cognitive impairment and Alzheimer’s disease reveals sex differences. J Alzheimers Dis. 2020;78(4):1707–1719. doi:10.3233/JAD-200632
41. Reed DL, Sacco WP. Measuring sleep efficiency: what should the denominator be? J Clin Sleep Med. 2016;12(2):263–266. doi:10.5664/jcsm.5498
42. Morrell MJ, Finn L, Kim H, Peppard PE, Badr MS, Young T. Sleep fragmentation, awake blood pressure, and sleep-disordered breathing in a population-based study. Am J Respir Crit Care Med. 2000;162(6):2091–2096. doi:10.1164/ajrccm.162.6.9904008
43. Shrivastava D, Jung S, Saadat M, Sirohi R, Crewson K. How to interpret the results of a sleep study. J Community Hosp Intern Med Perspect. 2014;4(5):24983. doi:10.3402/jchimp.v4.24983
44. Pedregosa FaV G, Gramfort A, Michel V, et al. Scikit-learn: machine learning in python. J Mach Learn Res. 2011;12:2825–2830.
45. Chicco D, Jurman G. The advantages of the Matthews correlation coefficient (MCC) over F1 score and accuracy in binary classification evaluation. BMC Genomics. 2020;21(1):6. doi:10.1186/s12864-019-6413-7
46. Parikh R, Mathai A, Parikh S, Chandra Sekhar G, Thomas R. Understanding and using sensitivity, specificity and predictive values. Indian J Ophthalmol. 2008;56(1):45–50. doi:10.4103/0301-4738.37595
47. Glas AS, Lijmer JG, Prins MH, Bonsel GJ, Bossuyt PM. The diagnostic odds ratio: a single indicator of test performance. J Clin Epidemiol. 2003;56(11):1129–1135. doi:10.1016/S0895-4356(03)00177-X
48. Harris CR, Millman KJ, van der Walt SJ, et al. Array programming with NumPy. Nature. 2020;585(7825):357–362. doi:10.1038/s41586-020-2649-2
49. Parati G, Lombardi C, Hedner J, et al. Recommendations for the management of patients with obstructive sleep apnoea and hypertension. Eur Respir J. 2013;41(3):523–538. doi:10.1183/09031936.00226711
50. Wu S, Chen M, Wei K, Liu G. Sleep apnea screening based on Photoplethysmography data from wearable bracelets using an information-based similarity approach. Comput Methods Programs Biomed. 2021;211:106442. doi:10.1016/j.cmpb.2021.106442
51. Yin TC, Huang CW, Tsai HL, et al. Smartband use during enhanced recovery after surgery facilitates inpatient recuperation following minimally invasive colorectal surgery. Front Surg. 2020;7:608950. doi:10.3389/fsurg.2020.608950
52. Dagan A, Mechanic OJ. Use of ultra-low cost fitness trackers as clinical monitors in low resource emergency departments. Clin Exp Emerg Med. 2020;7(3):144–149. doi:10.15441/ceem.19.081
53. Chung IY, Jung M, Lee SB, et al. An assessment of physical activity data collected via a smartphone app and a smart band in breast cancer survivors: observational study. J Med Internet Res. 2019;21(9):13463. doi:10.2196/13463
54. Laricchia F. Fitbit - statistics & facts. Statista. Available from: https://www.statista.com/topics/2595/fitbit/.
55. Laricchia F. Number of wearable device users in the United States from 2014 to 2022. Statista. Available from: https://www.statista.com/statistics/543070/number-of-wearable-users-in-the-us/.
56. Aurora RN, Swartz R, Punjabi NM. Misclassification of OSA severity with automated scoring of home sleep recordings. Chest. 2015;147(3):719–727. doi:10.1378/chest.14-0929
57. Punjabi NM, Shifa N, Dorffner G, Patil S, Pien G, Aurora RN. Computer-assisted automated scoring of polysomnograms using the somnolyzer system. Sleep. 2015;38(10):1555–1566. doi:10.5665/sleep.5046
58. Tang L, Liu G. The novel approach of temporal dependency complexity analysis of heart rate variability in obstructive sleep apnea. Comput Biol Med. 2021;135:104632. doi:10.1016/j.compbiomed.2021.104632
59. Lombardi C, Pengo MF, Parati G. Obstructive sleep apnea syndrome and autonomic dysfunction. Auton Neurosci. 2019;221:102563. doi:10.1016/j.autneu.2019.102563
60. Sjoding MW, Dickson RP, Iwashyna TJ, Gay SE, Valley TS. Racial bias in pulse oximetry measurement. N Engl J Med. 2020;383(25):2477–2478. doi:10.1056/NEJMc2029240
61. O’Mahony AM, Garvey JF, McNicholas WT. Technologic advances in the assessment and management of obstructive sleep apnoea beyond the apnoea-hypopnoea index: a narrative review. J Thorac Dis. 2020;12(9):5020–5038. doi:10.21037/jtd-sleep-2020-003
 © 2022 The Author(s). This work is published and licensed by Dove Medical Press Limited. The
full terms of this license are available at https://www.dovepress.com/terms
and incorporate the Creative Commons Attribution
- Non Commercial (unported, 3.0) License.
By accessing the work you hereby accept the Terms. Non-commercial uses of the work are permitted
without any further permission from Dove Medical Press Limited, provided the work is properly
attributed. For permission for commercial use of this work, please see paragraphs 4.2 and 5 of our Terms.
© 2022 The Author(s). This work is published and licensed by Dove Medical Press Limited. The
full terms of this license are available at https://www.dovepress.com/terms
and incorporate the Creative Commons Attribution
- Non Commercial (unported, 3.0) License.
By accessing the work you hereby accept the Terms. Non-commercial uses of the work are permitted
without any further permission from Dove Medical Press Limited, provided the work is properly
attributed. For permission for commercial use of this work, please see paragraphs 4.2 and 5 of our Terms.