Back to Journals » Clinical Epidemiology » Volume 11
Observational studies of treatment effectiveness: worthwhile or worthless?
Authors Sharma M ![]() , Nazareth I
, Nazareth I ![]() , Petersen I
, Petersen I ![]()
Received 29 June 2018
Accepted for publication 3 October 2018
Published 18 December 2018 Volume 2019:11 Pages 35—42
DOI https://doi.org/10.2147/CLEP.S178723
Checked for plagiarism Yes
Review by Single anonymous peer review
Peer reviewer comments 3
Editor who approved publication: Professor Vera Ehrenstein
Manuj Sharma,1 Irwin Nazareth,1 Irene Petersen1,2
1Department of Primary Care and Population Health, University College London, London, UK; 2Department of Clinical Epidemiology, Aarhus University, Aarhus, Denmark
Abstract: Observational studies which evaluate effectiveness are often viewed with skepticism owing to the fact that patients are not randomized to treatment, meaning that results are more prone to bias. Therefore, randomized controlled trials remain the gold standard for evaluating treatment effectiveness. However, it is not always possible to conduct randomized trials. This may be due to financial constraints, for example, in identifying funding for a randomized trial for medicines that have already gained market authorization. There can also be challenges with recruitment, for example, of people with rare conditions or in hard-to-reach population subgroups. This is why observational studies are still needed. In this manuscript, we discuss how researchers can mitigate the risk of bias in the most common type of observational study design for evaluation of treatment effectiveness, the cohort study. We outline some key issues that warrant careful consideration at the outset when the question is being developed and the cohort study is being designed. We focus our discussion on the importance of deciding when to start follow-up in a study, choosing a comparator, managing confounding and measuring outcomes. We also illustrate the application of these considerations in a more detailed case study based on an examination of comparative effectiveness of two antidiabetic treatments using data collected during routine clinical practice.
Keywords: epidemiology, therapeutics, diabetes mellitus, public health, effectiveness
Introduction
The randomized controlled trial (RCT) is considered the gold standard design for examining the effectiveness of a treatment.1 This is because randomization increases the likelihood that treatment allocation is undertaken independently of both known and unknown patient characteristics, although there remains a possibility of chance imbalances.2 This chance is inversely proportional to the sample size being studied.3 Such baseline imbalances associated with the outcome under study can confound the findings, leading to biased estimates of effectiveness.
Despite growing interest in the use of observational studies to evaluate effectiveness, their application remains contentious.4 This is because the absence of randomization means that treatment choice is usually influenced by the clinician’s perception of the effectiveness of the treatments being considered.5 Hence, baseline imbalances that can bias estimates of treatment effectiveness are almost always present. A comparison of outcomes across treated and untreated individuals in an observational study may lead one to erroneously conclude that treatment is not effective, when in fact the treatment may have been selectively given to those with the worst prognosis.5
Despite these challenges, observational studies of effectiveness do offer opportunities to examine questions that may not be possible using RCTs.6 First, they can be used to examine the effectiveness of medication that has already been granted marketing authorization and for which funding for further trials may be limited. Second, they can allow the examination of effectiveness for rare treatment indications. Third, a large observational study can be more representative of a clinical population and less prone to selection bias than a trial. Thus, it can allow investigation of the external validity of trial results in more diverse populations, such as ethnic minority groups and elderly patients, who are often underrepresented in conventional trials.7
In this paper, we focus on use of cohort studies to evaluate effectiveness, where individuals are followed up from exposure to a treatment for the development of an outcome of interest. In particular, we will outline important considerations in cohort study design that can help to mitigate the risk of bias and conversely help to identify research questions of clinical effectiveness that are more suited to investigation using such a design. We then illustrate the application of these considerations in depth with reference to a case study based on our own completed work, which examined the comparative effectiveness of two antidiabetic treatments. Alternative study designs, such as self-controlled case series and case–control studies,8,9 are well described in the literature8,9 and will not be covered in this article.
Important considerations in the design of cohort studies to evaluate treatment effectiveness
In this section, we discuss four important aspects to consider when designing cohort studies to evaluate treatment effectiveness: when to start follow-up, choosing comparators, identification and measurement of confounding, and ascertainment of the outcome.
Start of follow-up
In cohort studies, individuals are ideally followed up from when they are first initiated on a treatment (new-user design).7 However, this is not always possible, and some studies include individuals who have already been receiving the treatment before the start of follow-up (prevalent user design). There are advantages and disadvantages to both approaches. In the new-user design, by excluding the prevalent users (left truncation) a “prevalent user” bias is eliminated which can be linked to the fact that they have already “survived” a prior period of treatment use without any negative consequences. New-user design allows for the adjustment of confounders at baseline, when the decision was made to initiate treatment, thus helping to eliminate bias.7,10 These biases are most relevant when the risk of an outcome of interest is known to be highest in the early stages of treatment. An example of prevalent user bias was seen in studies which demonstrated that hormone replacement therapy (HRT) prevented coronary heart disease, whereas subsequent trials found HRT to be harmful.11 The observational studies included prevalent users who were taking HRT before study follow-up and had already survived a period of use without any harm. They had a lower likelihood of cardiovascular outcomes at initiation of study follow-up, which led to the bias seen in the risk estimates that suggested a protective effect of HRT.12
Restricting inclusion to “new users” only does have limitations. It reduces the sample size of cohort studies and may limit long-term follow-up (right truncation).11 Provided the risk of biases and potential directionality are carefully considered, the evaluation of prevalent users can still be useful.13 For example, even though estimates for cardiovascular outcomes were biased in the HRT observational study, effectiveness estimates produced for other outcomes where risks were cumulative over time, such as colon and breast cancer, were unbiased and similar to the trials.13 In practice, it can sometimes be helpful to split the cohort into “new users” and “prevalent users” and analyze treatment effectiveness separately in each group, so that the limitations of left and right truncation can be acknowledged (Table 1).13
 | Table 1 Important considerations in the design of cohort studies to evaluate treatment effectiveness and how to mitigate the risk of bias |
Choice of comparators
Although it is common practice in RCTs, estimating the effectiveness of treatments by comparing treated and untreated individuals in a cohort study can lead to bias as treatment may be indicated only for those with a specific prognosis. The results may suggest that treatment is ineffective if an untreated group has a better prognosis or, conversely, may exaggerate effectiveness if the untreated group has a worse prognosis. This type of bias, which often occurs in observational studies, is known as channeling bias or confounding by indication, and arises when the indication for choosing a particular treatment also affects the outcome.5 Treated and untreated groups commonly differ in terms of disease severity, which can be difficult to measure in a cohort study.5 For example, using a cohort study design, Freemantle et al investigated the effectiveness of using spironolactone in reducing mortality in patients with severe heart failure treated in clinical practice.5 In contrast to the randomized aldactone evaluation study (RALES) clinical trial, which found that spironolactone reduced mortality,14 their observational study found a lower mortality in the untreated group than in those treated with spironolactone.5 These contrasting results were explained by the difference in disease severity across the two groups, as spironolactone was primarily prescribed to those with more severe heart failure and the worst prognosis.5
While it may often be difficult to estimate the effect of treatment against no treatment based on data from clinical practice owing to channeling bias, Smeeth et al successfully replicated the findings from large trials in their cohort study. They showed that statin use was effective in reducing vascular outcomes compared to non-use.15 In this instance, they were able to match statin users to non-users with similar disease severity and hence mitigate the risk of bias.
Another approach in cohort study design that can often help to yield more accurate estimates involves the inclusion of an active comparator group, if the clinical question allows. For example, consider a cohort study comparing two alternative first-line antihypertensive agents, the angiotensin-converting enzyme inhibitors ramipril and perindopril, for reducing blood pressure. The choice of either ramipril or perindopril is unlikely to be driven by many prognostic factors other than prescriber preferences or local formulary policy, and hence patients are likely to have similar disease severity at baseline.16 However, such a study is limited to providing estimates of the relative effectiveness of the two treatments only, and not of the effectiveness of treatment compared to no treatment.
Identification and measurement of confounding
In clinical practice, scenarios where there is complete baseline balance in disease severity are rare, and the design and analysis of most observational studies of effectiveness will need to actively remove sources of potential confounding bias.17 This involves the identification of all factors that cause the outcome and are associated with treatment choice, but are not on the treatment–outcome pathway. This can be achieved with visual maps called direct acyclic graphs.18,19 Once confounders have been identified, several analytical approaches can be applied to remove the influence of confounders on effect estimates, such as propensity-score based methods and standard multivariable regression methods.17,20 Patorno et al used propensity score matching in a large cohort study examining the antidiabetic agent canaglifozin. They demonstrated that canaglifozin effectively reduced admission to hospital due to heart failure compared to several other antidiabetics, with estimates consistent with previously completed clinical trials.21 Propensity score matching facilitated the removal of baseline imbalances in disease severity across treatment groups, which allowed reliable estimates to be obtained. The removal of baseline imbalance was not possible in the study by Freemantle et al, however, as imbalances in disease severity could not all be captured through simple matching.5 Although the analytical approach is important, evaluation of the completeness and validity of the recording of the confounding variables and risk of unmeasured confounding is equally crucial.17,22 If the source of data does not include information on confounding variables, as in the study by Freemantle et al,5 it creates a problem of unmeasured confounding and will bias analyses.17 Methodological approaches involving the use of proxy variables for confounders and sensitivity analysis can be considered to explore the impact of unmeasured confounding on the analysis.23 However, despite these approaches, the limitations of such a study must be reconsidered, especially if unmeasured confounding is suspected to be highly influential.
Outcome ascertainment
In any cohort study comparing the effectiveness of different treatments, all groups at baseline must have an equal chance of recording the outcome being investigated. A thorough consideration of whether individuals receiving one treatment may have longer follow-up, or are more likely to be screened for an event, to be intensively managed or to have better data recorded, must be made at the outset.7 For example, individuals prescribed the anticoagulant warfarin, which requires regular international normalized ratio blood testing, as opposed to direct oral anticoagulants, which do not, may have more frequent health care contacts and thus greater opportunity to report symptoms that lead to identification of an outcome being considered, eg, minor stroke. This could falsely lead to higher reporting and recording of an outcome in the warfarin group, resulting in estimates suggesting that warfarin is inferior in effectiveness when this is purely due to a reporting bias or an attrition bias (imbalance in the duration of follow-up).
Case study example
Overview
In this case study, we discuss how we applied the considerations detailed in the previous section to design a cohort study to compare the effectiveness of two antidiabetic treatments, sitagliptin vs sulfonylureas, as add-on to metformin for the treatment of type 2 diabetes mellitus. Both treatments are widely used add-on options for managing type 2 diabetes mellitus when metformin alone has proved inadequate. Guidelines from the UK National Institute of Health and Care Excellence, as well as other international guidelines, do not discriminate between these add-on treatments in terms of effectiveness.24 Our study investigated their glycemic effectiveness when used as part of routine clinical care in UK general practice.
We undertook this study in The Health Improvement Network Primary Care Database (version 15), which contains anonymized data from around 670 general practices across the UK. Scientific approval to undertake this study was obtained from the IQVIA World Publications Scientific Review Committee in August 2016 (reference number 16-072).25 This retrospective cohort study examined changes in HbA1c from baseline after 12 months of treatment between those prescribed sulfonylurea vs sitagliptin as add-on to metformin for type 2 diabetes mellitus. The driver behind this study was to investigate the external validity of several trials which had concluded that both treatments produced a similar glycemic reduction after initiation. Details of how we identified individuals with type 2 diabetes mellitus have been previously described in depth.26
The baseline characteristics of our cohort, and how this cohort study population differed from the corresponding trial populations, are shown in Table 2.
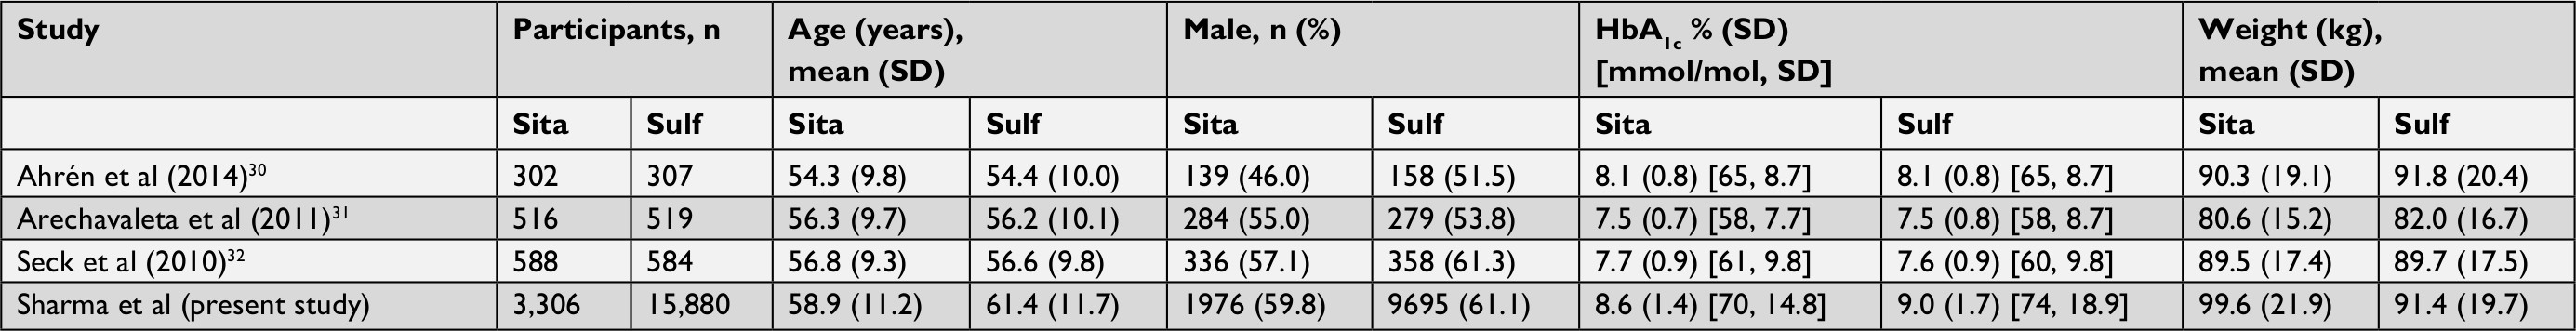 | Table 2 Comparison of baseline characteristics from three randomized controlled trials and the present case study Abbreviations: Sita, sitagliptin; Sulf, sulfonylureas. |
In summary, our cohort study population was older, had worse baseline HbA1c control and had higher weight than the populations in the completed trials.
After adjustment for baseline HbA1c, sex, age and other identified potential confounders in our analysis, we found that 12 months after treatment initiation the HbA1c level was on average 1 mmol/mol (mean difference 0.89 mmol/mol, 95% CI 0.33–1.45) higher for those prescribed sitagliptin compared to sulfonylureas (Table 3). Despite its statistical significance, a difference of up to 1.45 mmol/mol is not considered clinically significant, given than such a small quantitative difference in HbA1c would not impact on the short- or long-term prognosis of diabetes.24 In fact, clinically relevant differences in HbA1c are those that typically exceed 5.5 mmol/mol and ideally 10.9 mmol/mol in magnitude.27 Our cohort study estimate was found to compare favorably with that from the meta-analysis of completed RCT previously undertaken (Figure 1), which also highlighted no significant difference (weighted mean difference 0.54 mmol/mol, 95% CI –0.28 to 1.35).28
 | Table 3 Results from the case study: analysis of mean difference in HbA1c (mmol/mol) 12 months after initiation of sitagliptin vs sulfonylureas Notes: Data are shown as the mean difference (95% CI). aAdjusted for potential confounders including baseline HbA1c, baseline weight, age, year of cohort entry, face-to-face consultation frequency, year of entry, sex, Townsend deprivation score, smoking status, metformin dose, alcohol consumption, history of hypoglycemia, chronic kidney disease, neuropathy, heart failure, anemias, dementia, liver disease, arrhythmias, cancer, hypothyroidism, hyperthyroidism, pancreatitis, and having a prescription within 3 months of treatment initiation for antihypertensives, antiplatelets, anticoagulants, antiarrhythmics, diuretics, statins, other lipid-lowering drugs, antidepressants, antipsychotics, antiobesity drugs, oral or intravenous steroid medication, thyroxine, antithyroid drugs or anxiolytics. Individuals prescribed sulfonylureas are the reference population in all regression estimates. |
 | Figure 1 Forest plot comparing our case study (Sharma et al) with meta-analyses of previous RCT examining change in HbA1c (mmol/mol) between sitagliptin and sulfonylurea as add-on to metformin. Notes: Weights, where present, are from fixed-effects meta-analysis (Mantel–Haenszel method), although random-effects estimates (DerSimonian–Laird method) were identical. Source: Adapted from Sharma M, Beckley N, Nazareth I, Petersen I. Effectiveness of sitagliptin compared to sulfonylureas for type 2 diabetes mellitus inadequately controlled on metformin: a systematic review and meta-analysis. BMJ Open. 2017;7(10):e017260.28 Abbreviations: Dur, duration; Mean diff, mean difference; Sita, sitagliptin; Sulf, sulfonylureas; Tot, total participants; RCT, randomized controlled trial; Obs, observational study; NA, not applicable. |
Case study in context
We approached the study question having considered each of the design issues detailed in the earlier section (see section “Important considerations in the design of cohort studies to evaluate treatment effectiveness”). Our choice of a new-user design was taken to mitigate the risk of prevalent user bias that would arise by including individuals who had already been exposed to the treatment and hence experienced a glycemic benefit.10 This was achieved by following individuals from their first prescription of sitagliptin or sulfonylurea and ensuring that they had not been prescribed any antidiabetic agents other than metformin in the preceding 12 months.
We chose to use an active comparator in this study to mitigate the risk of channeling bias that might have arisen if we had compared the treatment group to a non-treated group, as there would have been a substantial difference in disease severity.5 Both sitagliptin and sulfonylurea are commonly used as add-on to metformin in the type 2 diabetes clinical pathway, which would help to balance disease severity at baseline. Nevertheless, there were differences at baseline between the groups in HbA1c and weight, which we believed would influence both treatment choice and outcome and hence could lead to confounding bias. We explored the recording and measurement of these confounders across treatment groups to ensure adequacy before controlling for them using a multivariable regression model.17 We undertook several sensitivity analyses exploring subgroups such as those who persisted with treatment for the study duration to ensure that the findings were robust. Finally, to eliminate the risk of recording bias, we analyzed both treatment arms to ensure that the frequency of HbA1c recording across both groups over time was similar.7
To investigate the robustness of our estimate, we compared our study to the existing literature and highlighted how the comparative effectiveness estimate of this cohort study compared favourably to a meta-analysis of completed RCTs.28 The absolute change in HbA1c observed with both treatments, however, was greater in our study than that observed in the trials. This may have been due to the fact that our baseline population had worse disease (worse glycemic control) at treatment initiation than those in the previously completed trials, and hence had differential scope for improvement.
Comparison to previously completed trials is a common approach used to demonstrate the validity of results in observational studies.3 As in our example, the studies by Smeeth et al and Patorno et al detailed earlier were able to compare their findings to estimates from previously completed trials for consistency.15,21 A comparison trial, however, is not always available, and therefore careful consideration of the issues outlined in this article can help to ensure a more robust approach to designing observational studies of effectiveness and mitigating the risk of bias. Equally, traditional challenges common to all observational study designs, such as handling missing data and the risk of exposure misclassification, remain when undertaking cohort studies and must also be carefully considered and managed.7,29
Conclusion
In this manuscript, we describe some key considerations for clinical researchers that can help to mitigate the risk of bias when designing cohort studies evaluating effectiveness. These considerations can also help researchers to identify clinical questions that are more suited to such a cohort study design. Their overall purpose is to ensure that the characteristics of groups across which the treatments are being compared are as similar as possible at baseline in terms of disease severity and, in addition, that the occurrence of the outcome of interest is reported equally in all groups. They must also be assessed in the context of traditional methodological challenges of observational studies, such as the possible existence of missing data and the risk of exposure misclassification. However, despite these obstacles, these considerations can help clinical researchers and epidemiologists to identify focused clinical questions where observational studies of effectiveness may be most worthwhile and, potentially, even advantageous.
Transparency declaration
I, Manuj Sharma, lead author, confirm that this manuscript is an honest, accurate and transparent account of the studies being reported; that no important aspects of the studies have been omitted; and that any discrepancies from this study as planned from our protocol have been explained.
Acknowledgment
This research was supported by a grant from Novo Nordisk A/S.
Author contributions
MS, IN and IP collectively planned the study. MS performed the analyses and wrote the manuscript. All authors contributed to data analysis, drafting and revising the article, gave final approval of the version to be published, and agree to be accountable for all aspects of the work.
Disclosure
All authors have completed the ICMJE uniform disclosure form at www.icmje.org/coi_disclosure.pdf. MS, IN and IP report grants from Novo Nordisk A/S during the conduct of the study. The views expressed are those of the authors and not necessarily those of Novo Nordisk A/S. The authors (MS, IN and IP) report no other conflicts of interest in this work.
References
Pearce W, Raman S, Turner A. Randomised trials in context: practical problems and social aspects of evidence-based medicine and policy. Trials. 2015;16:394. | ||
Greenland S, Mansournia MA. Limitations of individual causal models, causal graphs, and ignorability assumptions, as illustrated by random confounding and design unfaithfulness. Eur J Epidemiol. 2015;30(10):1101–1110. | ||
Hernán MA, Robins JM. Using big data to emulate a target trial when a randomized trial is not available. Am J Epidemiol. 2016;183(8):758–764. | ||
Pocock SJ, Elbourne DR. Randomized trials or observational tribulations? N Engl J Med. 2000;342(25):1907–1909. | ||
Freemantle N, Marston L, Walters K, et al. Making inferences on treatment effects from real world data: propensity scores, confounding by indication, and other perils for the unwary in observational research. BMJ. 2013;347:f6409. | ||
Black N. Why we need observational studies to evaluate the effectiveness of health care. BMJ. 1996;312(7040):1215–1218. | ||
Velentgas P, Dreyer N, Nourjah P, Smith SR, Torchia MM, eds. Developing a Protocol for Observational Comparative Effectiveness Research: A User’s Guide. AHRQ Publication No. 12(13)-EHC099. Rockville, MD: Agency for Healthcare Research and Quality; 2013. Available from: www.effectivehealthcare.ahrq.gov/Methods-OCER.cfm. Accessed July 6, 2018. | ||
Petersen I, Douglas I, Whitaker H. Self controlled case series methods: an alternative to standard epidemiological study designs. BMJ. 2016;354:i4515. | ||
Pearce N. Analysis of matched case-control studies. BMJ. 2016;352: i969. | ||
Hernán MA. Counterpoint: epidemiology to guide decision-making: moving away from practice-free research. Am J Epidemiol. 2015;182(10):834–839. | ||
Ray WA. Evaluating medication effects outside of clinical trials: new-user designs. Am J Epidemiol. 2003;158(9):915–920. | ||
Cauley JA, Seeley DG, Browner WS, et al. Estrogen replacement therapy and mortality among older women. The study of osteoporotic fractures. Arch Intern Med. 1997;157(19):2181–2187. | ||
Vandenbroucke J, Pearce N. Point: incident exposures, prevalent exposures, and causal inference: does limiting studies to persons who are followed from first exposure onward damage epidemiology? Am J Epidemiol. 2015;182(10):826–833. | ||
Pitt B, Zannad F, Remme WJ, et al. The effect of spironolactone on morbidity and mortality in patients with severe heart failure. N Engl J Med. 1999;341(10):709–717. | ||
Smeeth L, Douglas I, Hall AJ, Hubbard R, Evans S. Effect of statins on a wide range of health outcomes: a cohort study validated by comparison with randomized trials. Br J Clin Pharmacol. 2009;67(1):99–109. | ||
Furberg CD, Pitt B. Are all angiotensin-converting enzyme inhibitors interchangeable? J Am Coll Cardiol. 2001;37(5):1456–1460. | ||
Nørgaard M, Ehrenstein V, Vandenbroucke JP. Confounding in observational studies based on large health care databases: problems and potential solutions – a primer for the clinician. Clin Epidemiol. 2017;9:185–193. | ||
Vanderweele TJ, Hernán MA, Robins JM. Causal directed acyclic graphs and the direction of unmeasured confounding bias. Epidemiology. 2008;19(5):720–728. | ||
Greenland S, Pearl J, Robins JM. Causal diagrams for epidemiologic research. Epidemiology. 1999;10(1):37–48. | ||
Williamson E, Morley R, Lucas A, Carpenter J. Propensity scores: from naive enthusiasm to intuitive understanding. Stat Methods Med Res. 2012;21(3):273–293. | ||
Patorno E, Goldfine AB, Schneeweiss S, et al. Cardiovascular outcomes associated with canagliflozin versus other non-gliflozin antidiabetic drugs: population based cohort study. BMJ. 2018;360:k119. | ||
Shah BR, Laupacis A, Hux JE, Austin PC. Propensity score methods gave similar results to traditional regression modeling in observational studies: a systematic review. J Clin Epidemiol. 2005;58(6):550–559. | ||
Schneeweiss S. Sensitivity analysis and external adjustment for unmeasured confounders in epidemiologic database studies of therapeutics. Pharmacoepidemiol Drug Saf. 2006;15(5):291–303. | ||
National Institute for Health and Care Excellence. NICE NG28: type 2 diabetes in adults: management. Last updated May 2017. Available from: https://www.nice.org.uk/guidance/ng28/resources/type-2-diabetes-in-adults-management-1837338615493. Accessed July 19, 2018. | ||
Blak BT, Thompson M, Dattani H, Bourke A. Generalisability of The Health Improvement Network (THIN) database: demographics, chronic disease prevalence and mortality rates. Inform Prim Care. 2011;19(4):251–255. | ||
Sharma M, Petersen I, Nazareth I, Coton SJ. An algorithm for identification and classification of individuals with type 1 and type 2 diabetes mellitus in a large primary care database. Clin Epidemiol. 2016;8:373–380. | ||
Stratton IM, Adler AI, Neil HA, et al. Association of glycaemia with macrovascular and microvascular complications of type 2 diabetes (UKPDS 35): prospective observational study. BMJ. 2000;321(7258):405–412. | ||
Sharma M, Beckley N, Nazareth I, Petersen I. Effectiveness of sitagliptin compared to sulfonylureas for type 2 diabetes mellitus inadequately controlled on metformin: a systematic review and meta-analysis. BMJ Open. 2017;7(10):e017260. | ||
Pedersen AB, Mikkelsen EM, Cronin-Fenton D, et al. Missing data and multiple imputation in clinical epidemiological research. Clin Epidemiol. 2017;9:157–166. | ||
Ahrén B, Johnson SL, Stewart M, et al; HARMONY 3 Study Group. HARMONY 3: 104-week randomized, double-blind, placebo- and active-controlled trial assessing the efficacy and safety of albiglutide compared with placebo, sitagliptin, and glimepiride in patients with type 2 diabetes taking metformin. Diabetes Care. 2014;37(8):2141–2148. | ||
Arechavaleta R, Seck T, Chen Y, et al. Efficacy and safety of treatment with sitagliptin or glimepiride in patients with type 2 diabetes inadequately controlled on metformin monotherapy: a randomized, double-blind, non-inferiority trial. Diabetes Obes Metab. 2011;13(2):160–168. | ||
Seck T, Nauck M, Sheng D, et al; Sitagliptin Study 024 Group. Safety and efficacy of treatment with sitagliptin or glipizide in patients with type 2 diabetes inadequately controlled on metformin: a 2-year study. Int J Clin Pract. 2010;64(5):562–576. |
 © 2018 The Author(s). This work is published and licensed by Dove Medical Press Limited. The
full terms of this license are available at https://www.dovepress.com/terms
and incorporate the Creative Commons Attribution
- Non Commercial (unported, 3.0) License.
By accessing the work you hereby accept the Terms. Non-commercial uses of the work are permitted
without any further permission from Dove Medical Press Limited, provided the work is properly
attributed. For permission for commercial use of this work, please see paragraphs 4.2 and 5 of our Terms.
© 2018 The Author(s). This work is published and licensed by Dove Medical Press Limited. The
full terms of this license are available at https://www.dovepress.com/terms
and incorporate the Creative Commons Attribution
- Non Commercial (unported, 3.0) License.
By accessing the work you hereby accept the Terms. Non-commercial uses of the work are permitted
without any further permission from Dove Medical Press Limited, provided the work is properly
attributed. For permission for commercial use of this work, please see paragraphs 4.2 and 5 of our Terms.