Back to Journals » ClinicoEconomics and Outcomes Research » Volume 13
Obinutuzumab Plus Chemotherapy Compared with Rituximab Plus Chemotherapy in Previously Untreated Italian Patients with Advanced Follicular Lymphoma at Intermediate–High Risk: A Cost-Effectiveness Analysis
Authors Bellone M ![]() , Pradelli L
, Pradelli L ![]() , Molica S, De Francesco AE, Ghislieri D, Guardalben E, Caputo A
, Molica S, De Francesco AE, Ghislieri D, Guardalben E, Caputo A
Received 3 May 2021
Accepted for publication 3 July 2021
Published 22 July 2021 Volume 2021:13 Pages 661—671
DOI https://doi.org/10.2147/CEOR.S317885
Checked for plagiarism Yes
Review by Single anonymous peer review
Peer reviewer comments 2
Editor who approved publication: Professor Giorgio Colombo
Marco Bellone,1 Lorenzo Pradelli,1 Stefano Molica,2 Adele Emanuela De Francesco,3 Daniela Ghislieri,4 Emanuele Guardalben,5 Antonietta Caputo4
1Department of Health Economics and Outcome Research, AdRes Health Economics and Outcomes Research, Turin, Italy; 2Dipartimento Onco-ematologico, Azienda Ospedaliera Pugliese-Ciaccio, Catanzaro, Italy; 3Hospital Pharmacy, Mater Domini Azienda Ospedaliero Universitaria, Catanzaro, Italy; 4Market Access Department, Roche SpA, Monza, Italy; 5Medical Department, Roche SpA, Monza, Italy
Correspondence: Marco Bellone
AdRes Health Economics and Outcomes Research, 17 Via Vittorio Alfieri, Turin 10121, Italy
Tel +39 011 765-1239
Email [email protected]
Objective: To assess the cost-effectiveness of obinutuzumab (O-chemo) in comparison to rituximab (R-chemo) in patients with untreated advanced follicular lymphoma (FL) at intermediate or high risk from an Italian National Health Service (NHS) perspective.
Methods: A previously developed four-state Markov model was adapted to estimate lifetime clinical outcomes and costs of Italian patients with advanced FL and an FL international predictive index score ≥ 2 in treatment with O-chemo and R-chemo. Life expectancy was derived from the GALLIUM and PRIMA clinical trials. Progression-free survival (PFS), early progressive disease (PD), and treatment duration were extrapolated by fitting parametric distributions to empirical data in GALLIUM and late PD to data in PRIMA. Expected survival was weighed by published utilities. Costs updated to 2020 Euros and health gains occurring after the first year were discounted at an annual 3% rate. Probabilistic sensitivity analysis (PSA) was carried out.
Results: O-chemo was associated with an incremental survival increase (0.97 life-years [LYs]), even when weighted for quality (0.88 quality-adjusted LYs [QALYs]), and incremental costs (around € 15,000), driven by longer treatment during PFS state relative to R-chemo. The incremental cost-effectiveness ratio and incremental cost-utility ratio are both widely accepted by the Italian NHS (around € 15,500/LY and € 17,000/QALY gained, respectively). PSA simulations confirmed the robustness of results given sensible variations in assumptions.
Conclusion: O-chemo has superior clinical efficacy compared to rituximab, and should be considered a cost-effective option in first-line treatment of patients with advanced FL at intermediate or high risk in Italy. Incremental cost-effectiveness ratios are below the threshold considered affordable by developed countries.
Keywords: economic evaluation, oncology, FLIPI score, ICER, PFS, QALY
Introduction
Follicular lymphoma (FL) represents about 12%–19% of all non–Hodgkin lymphoma (NHL) and is the third-commonest subtype after diffuse large B–cell lymphoma and lymphocytic chronic leukemia.1–3
FL was estimated to affect 2.4 in 10,000 persons in the European Union in 2015, below the limit for orphan designation, fixed at five in 10,000 persons.4 In Italy, according to a 2015 AIRTUM report, FL incidence was 2.85 (95% CI 2.78–2.92) per 100,000 persons/year but this increased to 6.32 in people aged >65 years, with no differences between men (2.8) and women (2.9).5
There is consensus that World Health Organization (WHO) grade 1 and 2 FL is indolent disease often diagnosed in an asymptomatic phase.6,7 However, virtually all patients eventually progress to an active phase of disease requiring therapy.
Despite having a relatively favorable prognosis in a majority of cases, FL is associated with considerable clinical heterogeneity and molecular and morphological diversity. Correspondingly, older age and more advanced stage at the time of diagnosis are associated with increased mortality rates.8,9
Nowadays, the Follicular Lymphoma International Prognostic Index (FLIPI) represents the most important instrument to define prognosis for FL patients.7 The FLIPI identifies five adverse prognostic factors to stratify patients into three risk groups with different survival outcomes (FLIPI 0–1, low-risk; FLIPI 2, intermediate-risk; FLIPI 3–5, high-risk group).10 Subsequently the FLIPI 2 has been proposed to take into account different end points and the effect of new therapies.11
The need for systemic treatment is usually defined by using Groupe d’Etude des Lymphomes Folliculaires (GELF) criteria that consider the clinical course of the disease and patients’ conditions.6,7,12–15 Accordingly, therapeutic strategies for patients in early stages include radiotherapy, rituximab alone, or simple observation. For those patients diagnosed with active disease, a rituximab-based approach of chemoimmunotherapy followed by rituximab maintenance represents the gold standard of treatment.7 However, despite improvement in overall survival (OS) obtained with such an approach, FL remains an incurable disease.16
Obinutuzumab is a new recombinant monoclonal humanized and glycoengineered type II anti-CD20 antibody of the IgG1 isotype. It targets the CD20 transmembrane antigen on the surface of nonmalignant and malignant pre-B and mature B lymphocytes, but not on hematopoietic stem cells, pro–B cells, normal plasma cells, or other normal tissue. This drug induces direct cell death mediates antibody-dependent cellular cytotoxicity and antibody-dependent cellular phagocytosis (ADCP).17 Specific characteristics of this antibody are better antibody-dependent cellular phagocytosis, more efficient B-cell killing, and greater antitumor action.18,19
Obinutuzumab in combination with bendamustine, followed by obinutuzumab maintenance, has already been indicated for the treatment of patients with FL who do not respond or who progress during or up to 6 months after treatment with rituximab or a rituximab-containing regimen.
The GALLIUM study evaluated the use of obinutuzumab for patients with previously untreated advanced-stage FL. This phase III trial investigated safety and efficacy, stratifying patients according to their FLIPI risk group, of obinutuzumab used both in association with chemotherapy (O-chemo) during the induction phase and as a single agent in the maintenance phase compared to the standard combination treatment represented by chemotherapy plus rituximab (R-chemo) followed by rituximab maintenance.20 In general, progression-free survival (PFS) in the whole population was significantly longer in the obinutuzumab group than in the rituximab group. However, a subset analysis of patients stratified according to FLIPI risk revealed that intermediate- or high-risk patients benefited more from therapy with obinutuzumab. Based on these results, the Italian regulatory agency licensed obinutuzumab in untreated advanced FL patients at intermediate and high risk based on a FLIPI score ≥2.
Using data derived from the GALLIUM study, published literature, and regulatory disposition, we performed a cost-effectiveness and cost–utility analysis using a Markov model aiming to compare obinutuzumab and rituximab therapeutic schemes in the Italian National Health Service (NHS).
Methods
Model Description
This analysis compares costs and clinical outcomes of obinutuzumab relative to rituximab for the treatment of untreated advanced FL with high or intermediate FLIPI score (ie, ≥2), according to reimbursement restrictions. Both antibodies are associated with standard chemotherapy during the induction phase. Subsequently, patients achieving a clinical response (complete or partial) enter the maintenance phase with the same antibody in monotherapy. The cost-effectiveness analysis was carried out through a 1 month–cycle Markov model developed in Microsoft Excel. Four mutually exclusive health states were considered (Figure 1), in order to simulate the disease course:
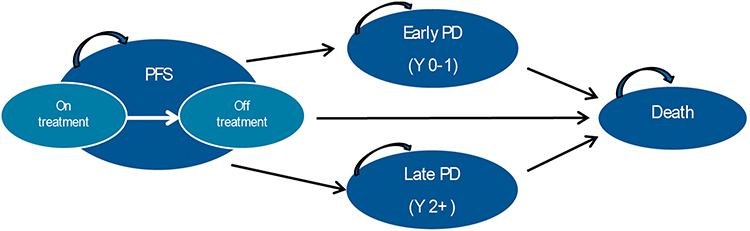 |
Figure 1 Model structure. Arrows indicate possible transitions through health states. “On treatment” and “Off treatment” are subcategories of health states included in PFS. Abbreviations: PFS, progression-free survival; PD, progressive disease; Y 0–1, within 2 years; Y 2+, beyond 2 years. |
(1) PFS: in order to better assess specific costs and quality of life, progressions occurring on treatment were analyzed separately from progressions observed off treatment;
(2) Early progressive disease (PD), ie, survival after early (within 2 years from therapy start) PD;
(3) Late PD, ie, survival after late (at least 2 years from therapy start) PD;
(4) death.
The hypothetical patient cohort entered a PFS health state and received induction treatment of approximately 6 months of O-chemo or R-chemo, followed by maintenance therapy once every 2 months with monoclonal antibodies alone for 2 years until disease progression or death. Patients progressing within the first 2 years of treatment moved to the early-PD health state, while patients who progressed in subsequent years moved into the late-PD health state. Since early progression is associated with worse prognosis and survival outcomes than late PD, as documented in the scientific literature, postprogression mortality was analyzed for patients who progressed before and after 2 years.21,22 This rationale allowed us to estimate different probabilities of death for the early- and late-progression patients. A lifetime horizon was used to record all consequences of therapeutic choices in patients with FL, as recommended by ISPOR guidelines for health-economic assessments.23
For each simulated cycle, treatment-specific costs and utilities were applied to the fraction of patients in each health state, in order to calculate expected OS, quality of life, and total costs. The incremental cost-efficacy ratio (ICER) and incremental cost-utility ratio were used to compare obinutuzumab versus rituximab.
A half-cycle correction was applied on the basis of the assumption that transitions between states occur on average in the middle of the cycle. In accordance with Italian guidelines on health-economic evaluation, costs and benefits accruing beyond the first year were discounted at 3% per year.24 Costs are given in Euros at 2020 values.
Population
Demographic characteristics and anthropometric measures of patients enrolled in the GALLIUM clinical trial were used as proxies for Italian patients with FL.20 Body-surface area (BSA) was estimated using the DuBois and DuBois formula (Supplementary material: Table S1).25
Clinical Inputs
The probability of being in one of the three health states (PFS, early PD, or late PD) was determined by PFS and postprogression-survival curves of the treatments under assessment. Progression rate in the R-chemo arm was extrapolated by fitting a parametric exponential function to the PFS Kaplan–Meier curve obtained from the GALLIUM trial. The clinical end-point cutoff date in the intermediate- to high-risk FLIPI≥2 subgroup for the current economic analysis was April 2018 (with a median follow-up of 4.75 years).26 The exponential function was chosen among those tested — Weibull, log-logistic, log-normal, generalized γ, Gompertz, and exponential — for its goodness of fit to the data, assessed by the Akaike information criterion, Bayesian information criterion, and visual inspection. The PFS rate of R-chemo was reduced through application of the HR observed in the GALLIUM study on high- or intermediate-risk patients (HR 0.65) to characterize the probability of remaining in the PFS health state of the O-chemo arm (Figure 2).26 Treatment effects on PFS were maintained for 9 years, based on the follow-up data of the cohort enrolled in the PRIMA clinical trial, the pivotal study of rituximab maintenance.27 Patients in PFS stayed on treatment as long as they received one of the therapies compared. The off-treatment period began at discontinuation for any reason, as established by the individual time to off-treatment curves observed in GALLIUM:20 the average time being 22.95 and 22.23 months for the O-chemo and R-chemo arms, respectively. The mortality rate during PFS was determined from the proportion of deaths recorded among PFS events, as observed in the pooled GALLIUM population (deaths prior to disease progression are usually due to adverse events or any other cause but progression). The choice of determining this ratio independently from the treatment arm was driven by the rarity of the event, and avoids any assumption around hypothetical mortality advantages independent of slower disease progression. If patients progressed within 2 years from the start of the model simulation, the transition was toward the early-PD health state (Y0–1), while the rest of the population, progressing later, was assigned to the late-PD health state (Y2+). Early PD and late PD are associated with specific mortality rates. Mortality for the early-PD health state was obtained from the patient pool of the GALLIUM clinical trial, and the same rate was attributed to patients of both treatments.26 Given the absence of late postprogression deaths in the GALLIUM study— at median follow up of 4.75 years, only the early events had been observed — the postprogression-mortality curve for patients with late progression was derived from the PRIMA study and applied equally to patients in the arms compared.26,27 OS was thus determined by the sum of the time spent in the PFS and PD health states (Figure 2).
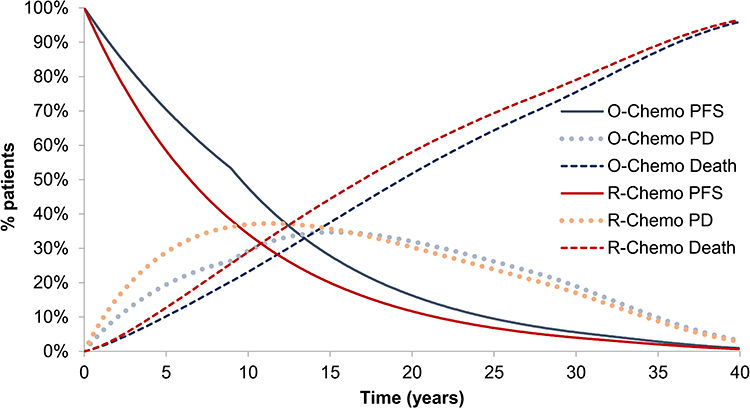 |
Figure 2 Estimated survival curves based on GALLIUM study: Markov trace and time in health state. Abbreviations: PFS, progression-free survival; PD, progressive desease; O-chemo, obinutuzumab and chemotherapy; R-chemo, rituximab and chemotherapy. |
Utility Values
Utility values for health states related to PFS and postprogression survival were obtained from the GALLIUM clinical trial, using the EQ-5D questionnaire, and by applying Italian population tariffs (Table 1).20,28 These estimates were applied to both treatments, as no statistically significant differences emerged in the arms being compared. Moreover, the utility values were age-adjusted according to those for the general Italian population, which were calculated from sex-specific regression equations.29,30
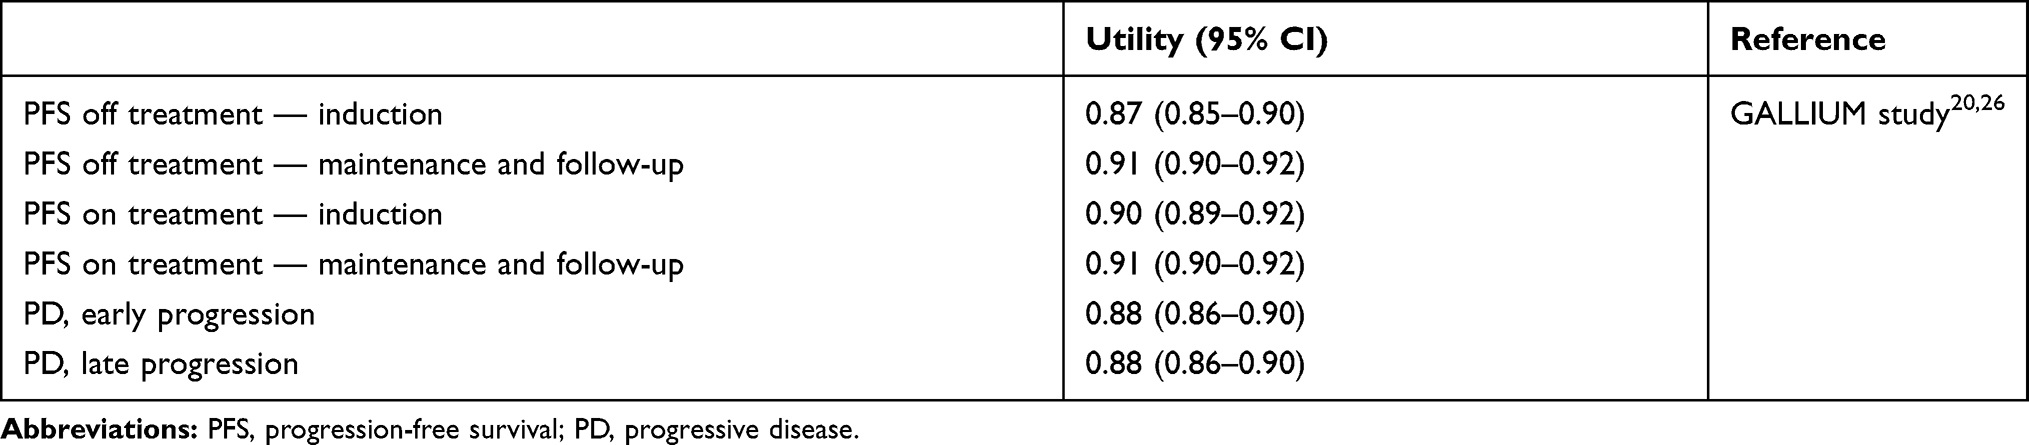 |
Table 1 Utility values |
Economic Inputs
According to the economic perspective applied in the analysis (NHS), only direct medical costs were considered: drugs, administration, monitoring, adverse-event management, and therapy following FL progression (Table 2). Drug costs were calculated as a product of unit cost and dose administered per cycle, considering a perfect vial-sharing policy. The dose consumed was determined on the basis of dosage indicated in the summary of product characteristics, applied to weight or BSA, where pertinent, and aligned with those recorded in the GALLIUM clinical trial.20 Specifically, obinutuzumab was administered during the induction phase at a dose of 1,000 mg in combination with chemotherapy: six 28-day cycles in combination with bendamustine or six 21-day cycles in combination with cyclophosphamide, doxorubicin, vincristine, and prednisone (CHOP), followed by two additional cycles of obinutuzumab alone or eight 21-day cycles in combination with cyclophosphamide, vincristine, and prednisone (CVP). Two more doses of obinutuzumab alone on days 8 and 15 completed cycle 1. Patients who achieved a complete or partial response to induction treatment continued to receive obinutuzumab 1,000 mg as single-agent maintenance therapy every 2 months for 2 years or until disease progression (whichever occurred first).17 The recommended dose of rituximab for induction treatment is 375 mg/m2 of BSA per cycle for infusion or 1,400 mg at a fixed dose per cycle for subcutaneous injection after a first dose for infusion for up to 8 cycles in combination with chemotherapy. Patients who responded to induction treatment receive the same doses once every 2 months (starting 2 months after the last dose of induction therapy) until disease progression or for a maximum of 2 years (12 infusions in total).31 Both therapeutic regimes are administered to patients by public and accredited hospitals. Drug-acquisition costs were based on tendering and negotiation processes at the regional health-service level, and prices achieved by a regional procurement agent were taken as a proxy of the national benchmark and thus used as unit costs of pharmaceuticals.32 Moreover, the mean cost per rituximab patient was calculated on the assumption that 86% of patients would receive intravenous rituximab (32% reference rituximab and 54% biosimilar) and 14% reference rituximab in subcutaneous formulations (assumption based on 5-year market forecast).33 The cost of chemotherapy to complete the induction regimen with obinutuzumab and rituximab (excluding bendamustine) are included in the comprehensive diagnosis-related group (DRG) 410 for day-hospital admission, but reduced by 90% (ie, €37.10).34,35 The discount on the DRG tariff was a measure to adapt the tariff to hospitalizations aimed at treating neoplasms with innovative and high-cost cancer drugs. The administration tariff includes ancillary therapies, potential laboratory and instrumental diagnostic tests, ie, computed tomography (CT) with contrast, oncological visits, and supervision by medical personnel during the infusion/injection phase.36 The monitoring of patients with FL includes a clinical examination, hematochemical exam (laboratory test), and CT during the follow-up phase. Italian Association of Medical Oncology guidelines on FL recommend one clinical examination and laboratory tests every 4 months for 5 years of follow-up and subsequently annually, and CTs in the first 2 years and subsequently each 12 months.7 Unit costs for visits and exams were equaled to their remuneration tariffs, and frequencies were as recommended in the guidelines.7,34 During the induction (0–6 months) and maintenance (6–30 months) phases, the cost of medical checkups (visits and examinations) was included in the DRG tariff for the administration. Patients progressing after first-line treatment with O-chemo and R-chemo undergo subsequent lines of therapy. Recent market research has been conducted to analyze therapeutic sequences upon first-line failure: 55% of patients received R-chemo (bendamustine, CHOP, CVP, or other chemotherapy), 30% idelalisib, and 5% a lenalidomide-based regimen.33 In the absence of specific information on the remaining 10%, it is plausible to assume that these patients received chemotherapy, radiotherapy, or autologous/allogeneic bone-marrow transplants, as already observed in the EORTC phase III study on the role of rituximab administered as induction and maintenance in patients with advanced FL.37 Costs for bone-marrow transplants, stereotactic radiotherapy, and chemotherapy were approximated based on the all-inclusive tariffs for inpatient and outpatient services.34 A radiotherapy cycle in patients with NHL performed with a linear accelerator can be fractionated in 5 days and continued for three cycles, as reported by a publication of the Italian Association of Cancer Patients, Relatives, and Friends (AIMAC).38 For chemotherapy, the number of cycles (six) and specific persistence (81%) refer to patients enrolled in the EORTC study.37 The cost of R-chemo for second-line therapy was calculated according to the summary of product characteristics, and assuming complete response of patients.31 For idelalisib, the monthly cost obtained from regional tendering prices was applied to the average treatment time of idelalisib in monotherapy, which was 8.1 months in a phase II study conducted on 125 patients with indolent NHL refractory to rituximab and an alkylating antineoplastic agent.32,39 The cost for a regimen with lenalidomide was calculated by applying the cost per cycle of therapy, always obtained from the regional tendering prices, to the number of cycles envisaged by the posology scheme and relative to patients with complete response.32,40
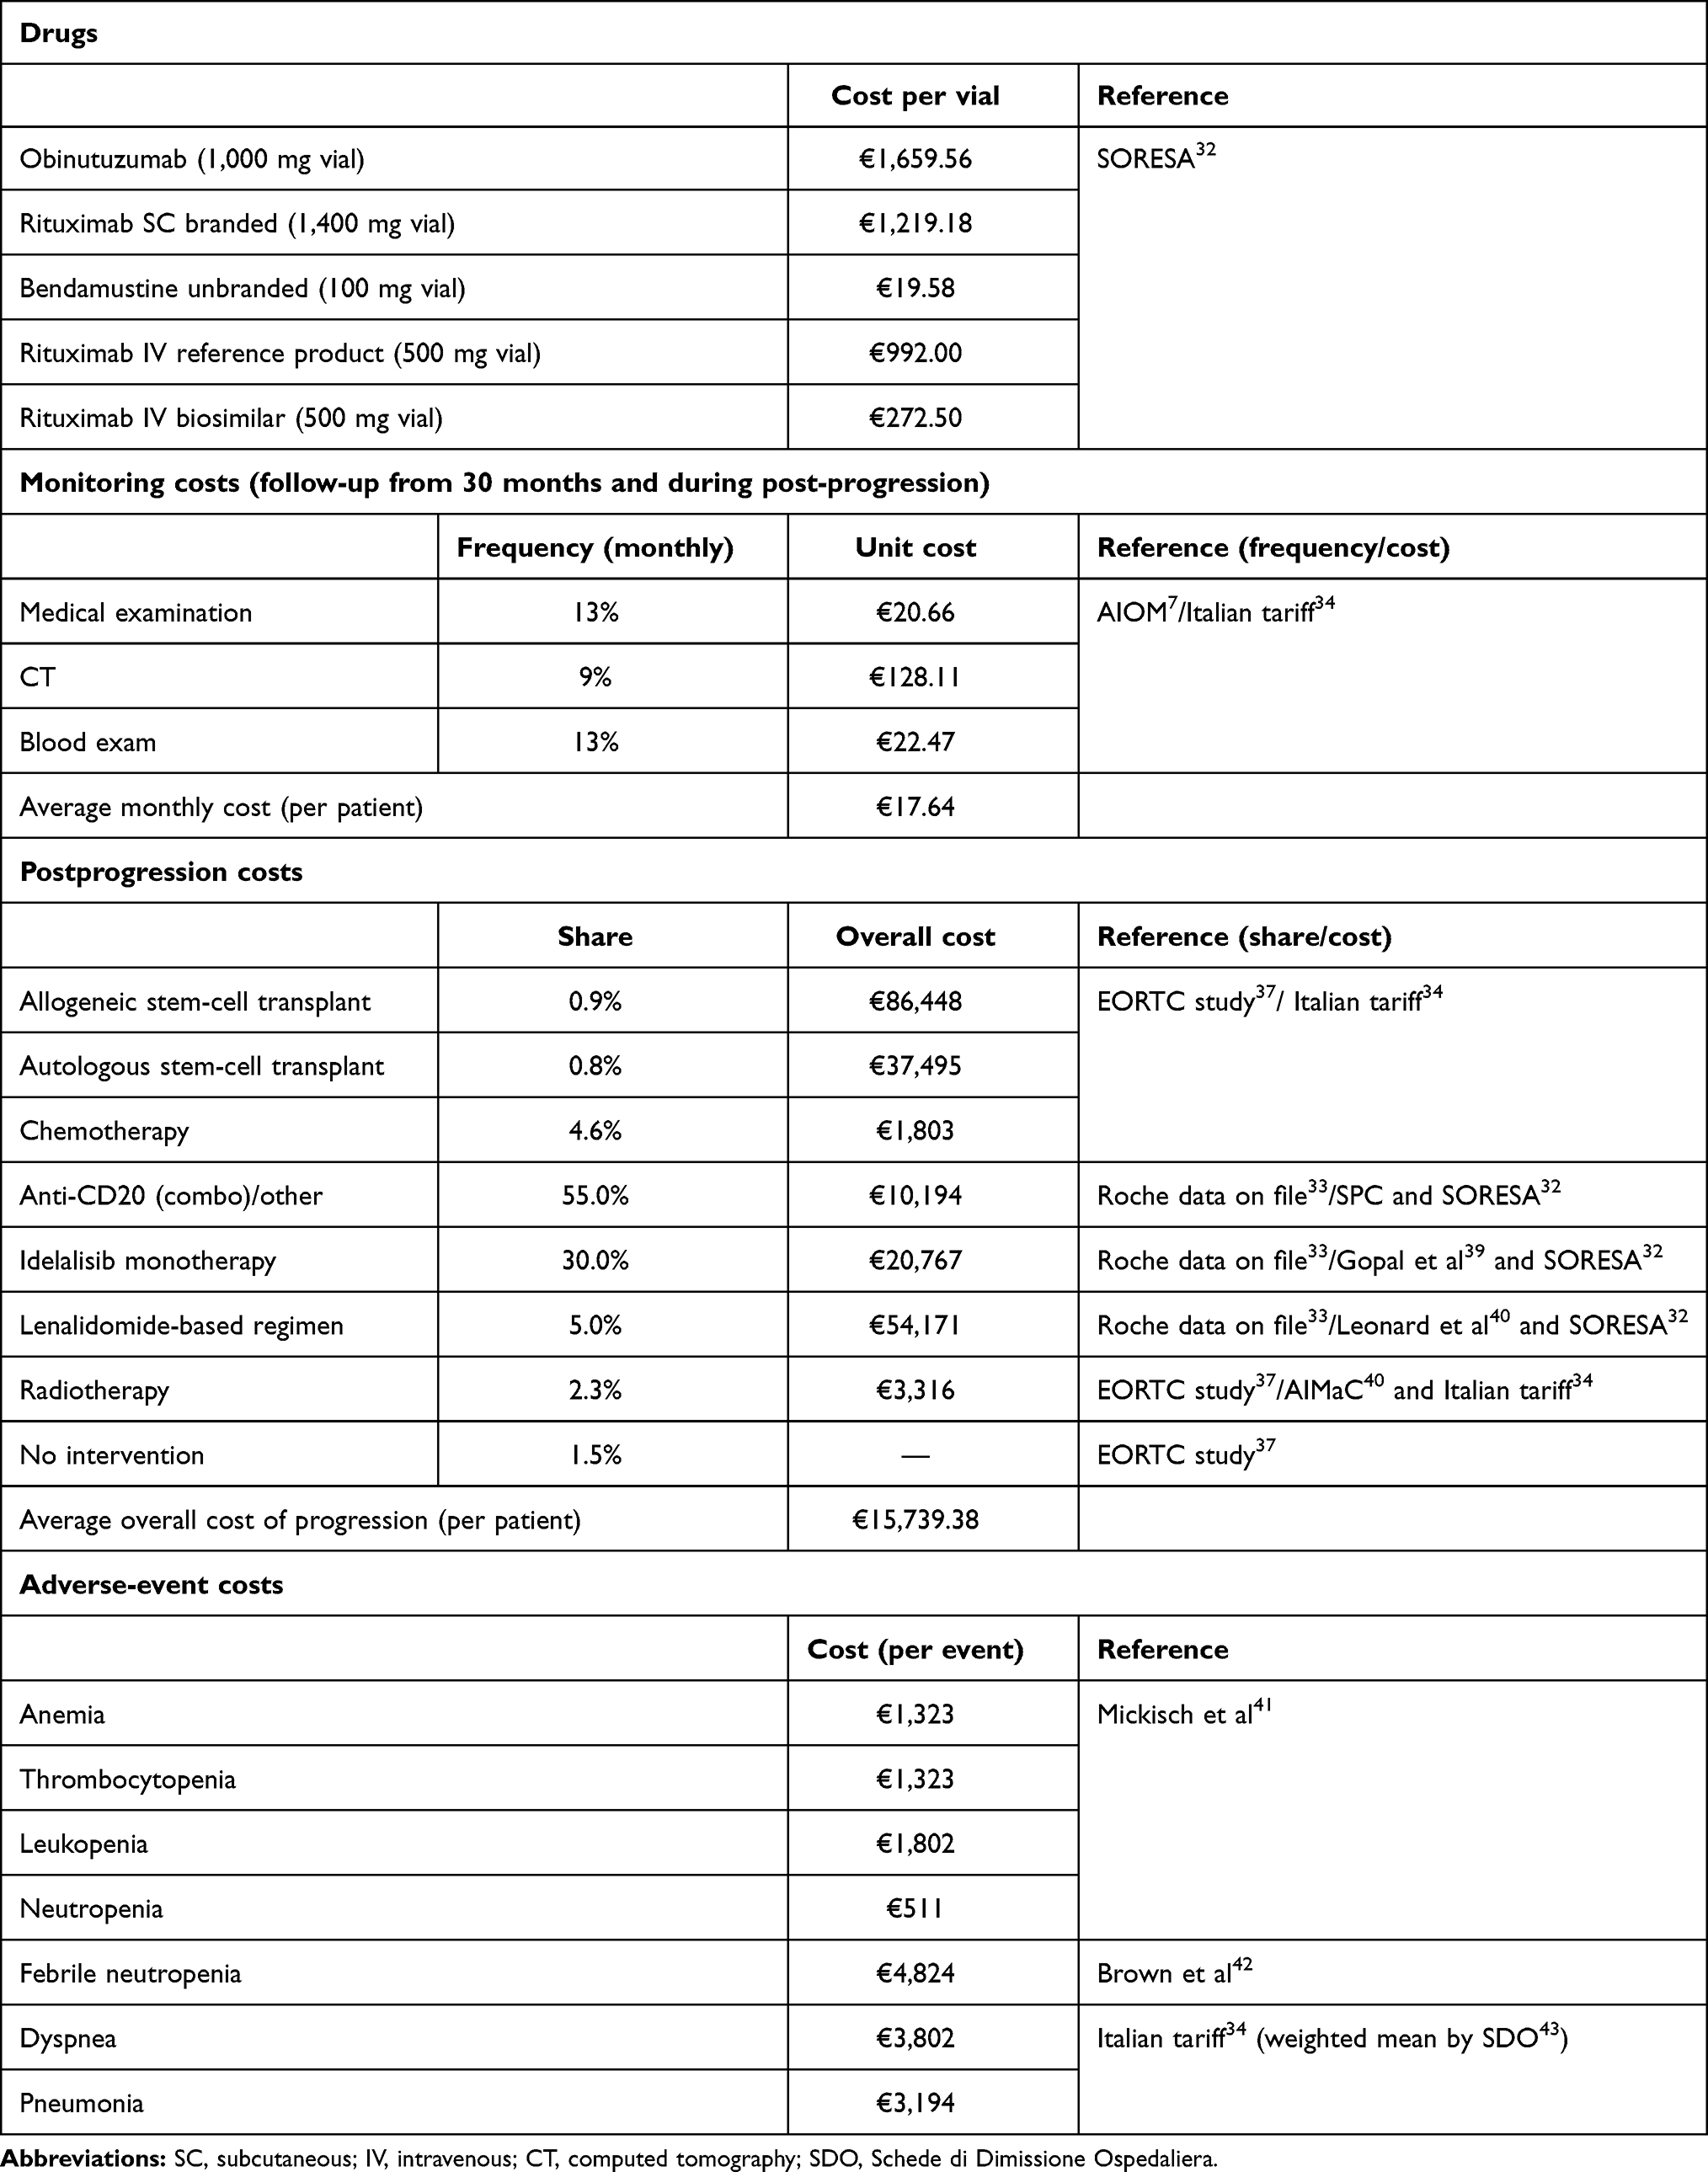 |
Table 2 Costs of drugs, monitoring, adverse-event management, and postprogression therapy |
The cost analysis also considered resources needed for the management of serious adverse events (all events of grade 3 and 4), ie, those that require at least one outpatient visit and/or hospital access. Serious adverse-event frequencies were obtained from the GALLIUM study, and included adverse reactions with an incidence >2% in any of the populations and arms of the trials considered (Supplementary material: Table S2).20 The observed frequency of each specific adverse event was divided by the period in which adverse events could occur. This rate was then multiplied by the average cost per event to derive a total monthly cost per patient. The cost per events was taken from the literature: for the cost of anemia, leukopenia, neutropenia, febrile neutropenia, and thrombocytopenia, the values estimated by Mickisch et al and Brown et al were applied.41,42 The cost of the management of dyspnea and pneumonia, on the other hand, was calculated by weighting the DRG tariffs with the frequencies obtained from the information flow of 2015 hospital-discharge forms, which collected information relating to all episodes of hospitalization provided in public and private hospitals in the country.34,43
Sensitivity Analysis
Uncertainties regarding input parameters and their effect on estimated results were evaluated through probabilistic sensitivity analysis (PSA) on 1,000 simulations. For each simulation cycle, the model simultaneously changed the parameters, sampling specific values within the respective confidence limits (more information in Supplementary material, Table S3). The PSA results are presented in the incremental cost-effectiveness plane and were used to estimate the cost-effectiveness acceptability curve. The incremental cost-effectiveness plane shows the dispersion of the 1,000 results of the iterations, expressed as the increment of benefit (quality-adjusted life-year [QALY]) and cost of O-chemo compared to R-chemo. The acceptability curve, based on the 1,000 iterations, indicates (percentage) the frequencies with which the ICER (the ratio between the incremental variation of the cost and the incremental variation of the benefit of O-chemo compared to R-chemo) was lower than a certain threshold value, ie, it provides the probability that for a given threshold value, O-chemo was more cost effective than R-chemo. The Italian cost-effectiveness threshold may be conventionally fixed at €60,000 per LY gained, which is the upper end of the range that can be considered to judge orphan medical products, such as obinutuzumab for FL.44
Results
Base Case
The model estimated that O-chemo for the treatment of patients with untreated and intermediate or high-risk FL is more effective than R-chemo in terms of overall and quality of life–adjusted survival (Table 3). In particular, expected OS with O-chemo was 14.31 years and 13.35 with R-chemo, determining 0.97 years’ mean survival benefit for patients treated with obinutuzumab. Furthermore, PFS with O-chemo was expected to be 8.98 years, with a relative increase of 1.62 years compared with R-chemo. Considering health-specific utility values, expected quality of life–adjusted survival with O-chemo exceeded model estimates for R-chemo by 1.45 and 0.88 QALYs for PFS and OS, respectively.
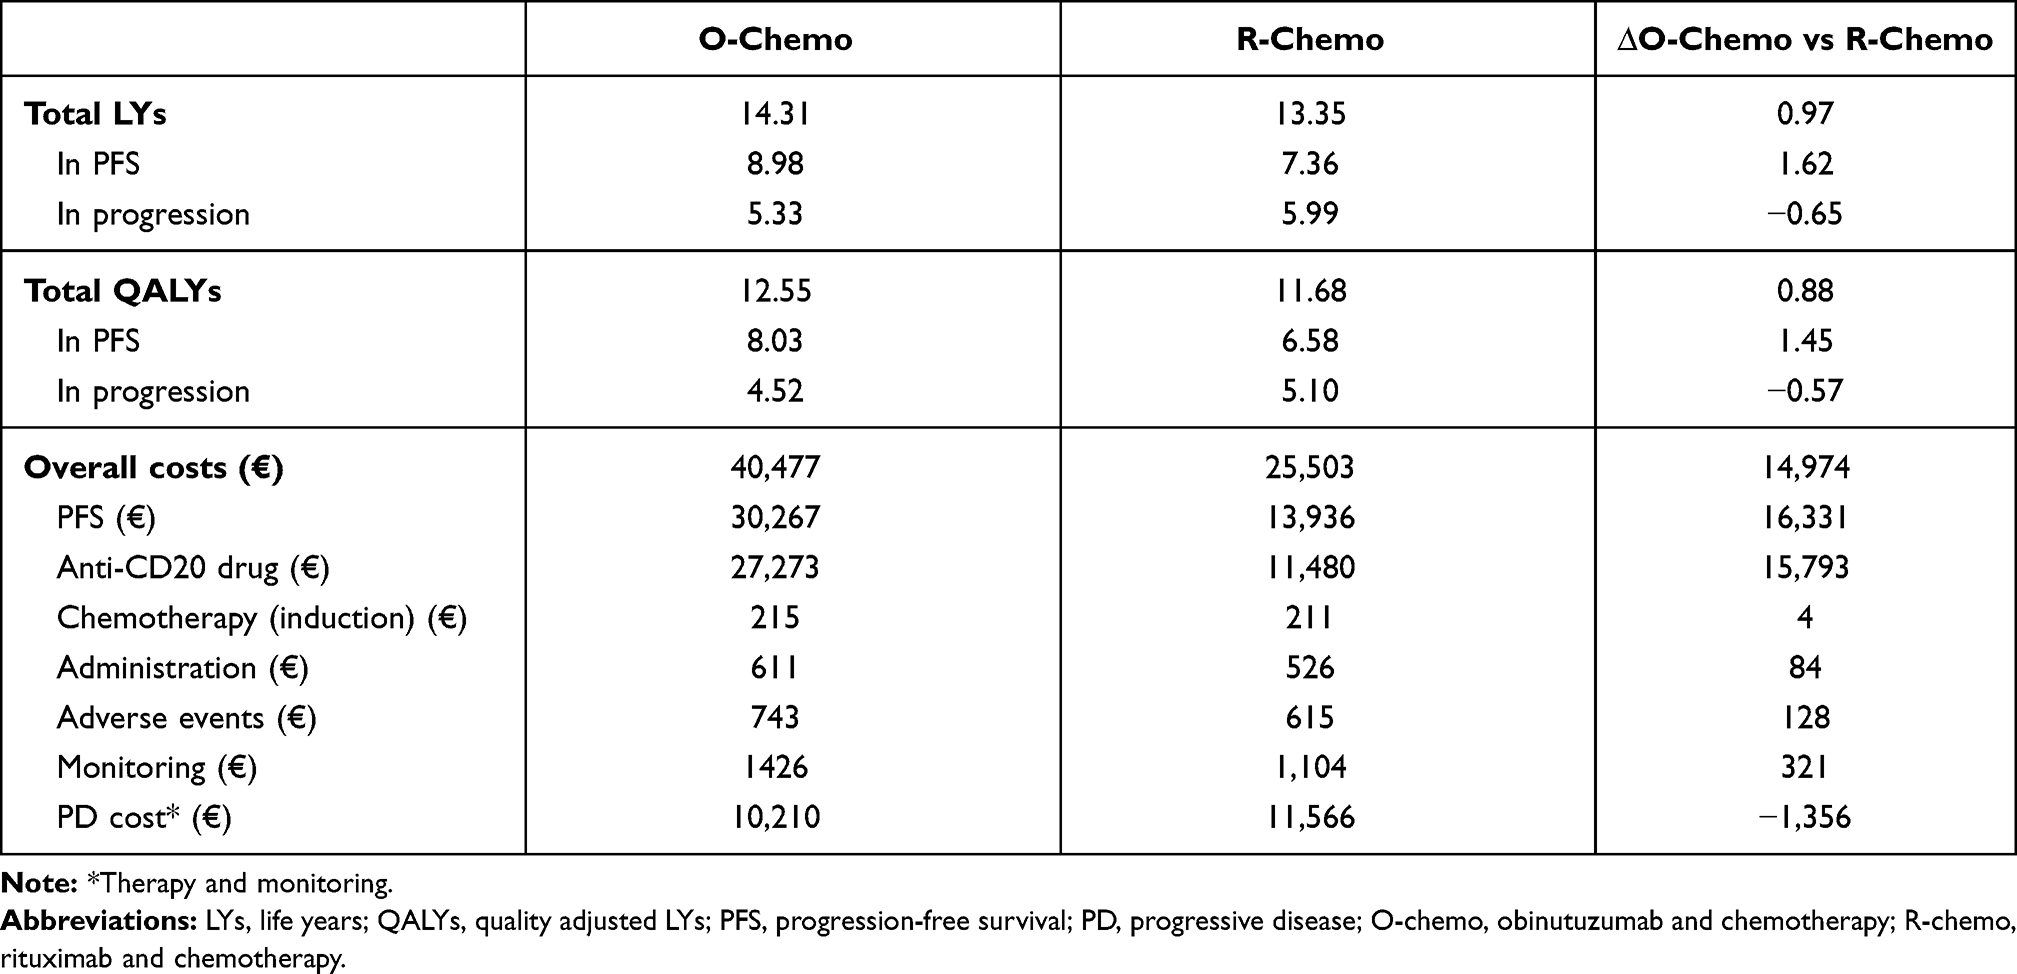 |
Table 3 Base-case LYs, QALYs, and costs |
Obinutuzumab was also associated with additional direct medical costs, estimated at €14,974 per patient (Table 3). The resulting ICER was €15,516 per LY gained and incremental cost-utility analysis considering accrued QALYs showed €17,057 per unit of benefit. These values are well below the usually considered the threshold of willingness to pay of industrialized countries, conventionally set around €60,000 (Table 4).44
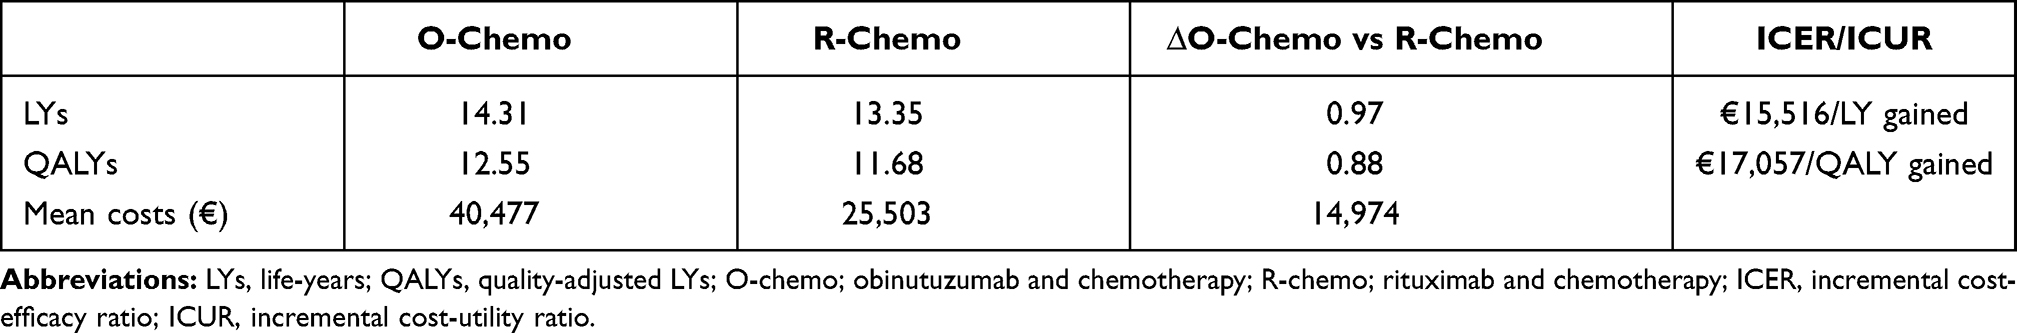 |
Table 4 ICER and ICUR |
Sensitivity Analysis
All 1,000 simulations lay in the first quadrant, which means that O-chemo was consistently rated more effective and more expensive than R-chemo (Figure 3). Furthermore, the results were not particularly sensitive to input-parameter uncertainty, since the cloud representing 1,000 simulated incremental ratios was dense and centered on the base case. The acceptability curve indicated that at a threshold of willingness to pay of €50,000/QALY, the probability that O-chemo was more cost-effective than R-chemo was 99% (Figure 4).
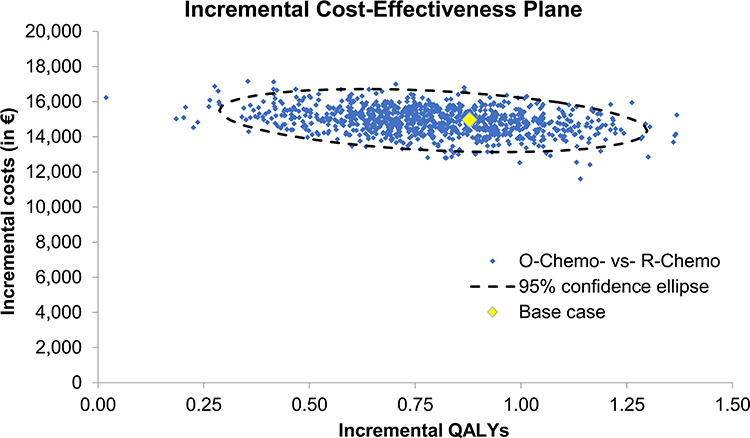 |
Figure 3 Cost-effectiveness plane. Abbreviations: O-chemo, obinutuzumab and chemotherapy; R-chemo, rituximab and chemotherapy. |
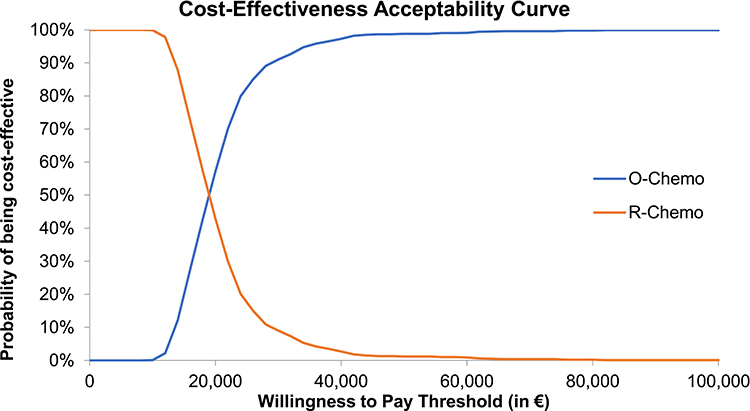 |
Figure 4 Probability of being the most cost-effective treatment. Abbreviations: O-chemo, obinutuzumab and chemotherapy; R-chemo, rituximab and chemotherapy. |
Discussion
The presented cost-effectiveness analysis on previously untreated, advanced, and FLIPI intermediate- or high-risk FL patients compares costs and clinical outcomes of obinutuzumab and rituximab administered in combination with chemotherapy in the induction phase and subsequently as monotherapy for maintenance.
Our analysis shows that O-chemo was more costly (€40,477 for obinutuzumab vs €25,503 for rituximab) but more effective, with expected OS prolongation of 0.97 years (14.31 LYs for obinutuzumab vs 13.35 for rituximab). This corresponds to a 0.88 QALY gain (12.55 QALYs for obinutuzumab vs 11.68 QALYs for rituximab). Estimated ICER was €15,516 per LY gained or €17,057 per QALY, which is acceptable based on the conventional €60,000/LY willingness-to-pay threshold.44 These findings are in agreement with analogous analyses conducted in other European countries. Vellopoulou et al reported that obinutuzumab added to various chemotherapy schemes was cost-effective compared to R-chemo in Greek patients.45 In this analysis, the expected survival gain was 0.84 years, or 0.78 QALYs, with ICERs equal to €38,399/LY and €41,284/QALY gained, below the willingness-to-pay threshold indicated by the authors. Differences in efficacy data and patient population (taken from all intention-to-treat patients of the ongoing GALLIUM trial) and underlying mortality could explain differences in benefit gains estimated in the two analyses. Hofmann et al observed that obinutuzumab used as first-line therapy for FL in Germany produced benefits that extend beyond clinical advantages, especially in the form of productivity gains in paid and unpaid activities.46 Moreover, higher treatment costs related to obinutuzumab were partly offset by lower average costs for further therapies.
However, some limitations and assumptions should be highlighted. A Markov model was chosen due to the necessity to combine PFS with postprogression survival to obtain an estimate of OS: OS in the GALLIUM study was with few events in either arm at the date of cutoff (April 2018).26 An area-under-curve model was not feasible, as extrapolation based on such immature data is not recommended. In particular, PFS (defined as the time to death or progression) was used to model transitions out of the PFS state (PFS to Death and PFS to PD). Postprogression survival was then used to model transitions to death once a patient has progressed (PD to death). In this case, OS was an output of the survival model rather than an input, as it is in an area-under-curve model.
Nevertheless, due to the extrapolation of survival curves from the GALLIUM trial, relevant uncertainty in the evidence base and estimated ICER might be recognized in the current economic appraisal.20,26 In particular, despite the large size of the GALLIUM trial, few survival events were observed. The parametric models chosen according to the relative fit to the observed data might not represent the natural course of disease beyond study follow-up, although external validity of the modeled curves was explored versus the survival observed in the PRIMA trial, though uncertainty was well evaluated in the PSA.
Conclusion
Obinutuzumab had superior clinical efficacy relative to rituximab, in terms of PFS (the primary end point of the GALLIUM study), and should be considered a cost-effective option in first-line treatment of patients with advanced FL at high or intermediate risk in Italy. The incremental cost-effectiveness ratios (ie, cost per LY or QALY) were below the threshold considered affordable by developed countries.
Funding
This study was supported by Roche SpA.
Disclosure
Dr Marco Bellone is an employee of AdRes, which has received project funding from Roche for the development of this research. Dr Marco Bellone reports grants from Roche during the study and grants from Roche, Sanofi, Janssen-Cilag Spa, Fresenius Kabi Deutschland, Novartis Farma, and Fresenius Kabi Italia outside the submitted work. Dr Lorenzo Pradelli is co-owner and an employee of AdRes, which has received project funding from Roche for the development of this research. Dr Lorenzo Pradelli report grants from Roche Spa during the study and grants from Janssen-Cilag, Sanofi, AstraZeneca, Biogen, and Medtronic outside the submitted work. Drs Stefano Molica and Adele Emanuela De Francesco are consultants for Roche. Drs Daniela Ghislieri, Emanuele Guardalben, and Antonietta Caputo are employees of Roche. The abstract of this paper was presented at the ISPOR Europe 2019 as a poster presentation, and can be viewed here: https://doi.org/10.1016/j.jval.2019.09.352
References
1. Al-Hamadani M, Habermann TM, Cerhan JR, Macon WR, Maurer MJ, Go RS. Non-Hodgkin lymphoma subtype distribution, geodemographic patterns, and survival in the US: a longitudinal analysis of the National Cancer Data Base from 1998 to 2011. Am J Hematol. 2015;90(9):790–795. doi:10.1002/ajh.24086
2. Smith A, Crouch S, Howell D, Burton C, Patmore R, Roman E. Impact of age and socioeconomic status on treatment and survival from aggressive lymphoma: a UK population-based study of diffuse large B-cell lymphoma. Cancer Epidemiol. 2015;39(6):1103–1112. doi:10.1016/j.canep.2015.08.015
3. Teras LR, DeSantis CE, Cerhan JR, Morton LM, Jemal A, Flowers CR. 2016 US lymphoid malignancy statistics by World Health Organization subtypes. CA Cancer J Clin. 2016;66(6):443–459. doi:10.3322/caac.21357
4. European Medicines Agency. European Medicines Agency: public Summary of Opinion on Orphan Designation: obinutuzumab for the treatment of follicular lymphoma 23 July 2015. Available from: https://www.ema.europa.eu/en/documents/orphan-designation/eu/3/15/1504-public-summary-opinion-orphan-designation-obinutuzumab-treatment-follicular-lymphoma_en.pdf.
5. Busco S, Buzzoni C; AIRTUM Working Group, et al. Italian cancer figures--Report 2015: the burden of rare cancers in Italy [published correction appears in Epidemiol Prev. 2016 Mar-Apr;40(2):83]. Epidemiol Prev. 2016;40(1 Suppl 2):1–120. doi:10.19191/EP16.1S2.P001.035.
6. Nastoupil L, Sinha R, Hirschey A, Flowers CR. Considerations in the initial management of follicular lymphoma. Community Oncol. 2012;9(11):S53–S60. doi:10.1016/j.cmonc.2012.09.015
7. AIOM. Linee guida linfomi [Lymphoma guidelines]. Edizione 2018. Available from: https://www.aiom.it/linee-guida-aiom-2018-linfomi/.
8. Salles GA. Clinical features, prognosis and treatment of follicular lymphoma. Hematology Am Soc Hematol Educ Program. 2007;216–225. doi:10.1182/asheducation-2007.1.216
9. Luminari S, Bellei M, Biasoli I, Federico M. Follicular lymphoma - treatment and prognostic factors. Rev Bras Hematol Hemoter. 2012;34(1):54–59. doi:10.5581/1516-8484.20120015
10. Solal-Céligny P, Roy P, Colombat P, et al. Follicular lymphoma international prognostic index. Blood. 2004;104(5):1258–1265. doi:10.1182/blood-2003-12-4434
11. Federico M, Bellei M, Marcheselli L, et al. Follicular lymphoma international prognostic index 2: a new prognostic index for follicular lymphoma developed by the international follicular lymphoma prognostic factor project. J Clin Oncol. 2009;27(27):4555–4562. doi:10.1200/JCO.2008.21.3991
12. Brice P, Bastion Y, Lepage E, et al. Comparison in low-tumor-burden follicular lymphomas between an initial no-treatment policy, prednimustine, or interferon alfa: a randomized study from the Groupe d’Etude des Lymphomes Folliculaires. Groupe d’Etude des Lymphomes de l’Adulte. J Clin Oncol. 1997;15(3):1110–1117. doi:10.1200/JCO.1997.15.3.1110
13. Papaioannou D, Rafia R, Rathbone J, Stevenson M, Buckley Woods H, Stevens J. Rituximab for the first-line treatment of stage III-IV follicular lymphoma (review of Technology Appraisal No. 110): a systematic review and economic evaluation. Health Technol Assess. 2012;16(37):1–iv. doi:10.3310/hta16370
14. National Comprehensive Cancer Network. NCCN Guidelines B-Cell Lymphoma. Available from: https://www.nccn.org/professionals/physician_gls/default.aspx.
15. Dreyling M, Ghielmini M, Rule S, et al. Newly diagnosed and relapsed follicular lymphoma: ESMO Clinical Practice Guidelines for diagnosis, treatment and follow-up. Ann Oncol. 2016;27(suppl 5):v83–v90. doi:10.1093/annonc/mdw400
16. Johnson PW, Rohatiner AZ, Whelan JS, et al. Patterns of survival in patients with recurrent follicular lymphoma: a 20-year study from a single center. J Clin Oncol. 1995;13(1):140–147. doi:10.1200/JCO.1995.13.1.140
17. European Medicines Agency. Gazyvaro® - Summary of product characteristics. Available from: https://www.ema.europa.eu/en/documents/product-information/gazyvaro-epar-product-information_en.pdf.
18. Mössner E, Brünker P, Moser S, et al. Increasing the efficacy of CD20 antibody therapy through the engineering of a new type II anti-CD20 antibody with enhanced direct and immune effector cell-mediated B-cell cytotoxicity. Blood. 2010;115(22):4393–4402. doi:10.1182/blood-2009-06-225979
19. Niederfellner G, Lammens A, Mundigl O, et al. Epitope characterization and crystal structure of GA101 provide insights into the molecular basis for type I/II distinction of CD20 antibodies. Blood. 2011;118(2):358–367. doi:10.1182/blood-2010-09-305847
20. Marcus R, Davies A, Ando K, et al. Obinutuzumab for the First-Line Treatment of Follicular Lymphoma. N Engl J Med. 2017;377(14):1331–1344. doi:10.1056/NEJMoa1614598
21. Casulo C, Byrtek M, Dawson KL, et al. Early relapse of follicular lymphoma after rituximab plus cyclophosphamide, doxorubicin, vincristine, and prednisone defines patients at high risk for death: an analysis from the national lymphocare. J Clin Oncol. 2015;33(23):2516–2522. doi:10.1200/JCO.2014.59.7534
22. Maurer MJ, Bachy E, Ghesquières H, et al. Early event status informs subsequent outcome in newly diagnosed follicular lymphoma. Am J Hematol. 2016;91(11):1096–1101. doi:10.1002/ajh.24492
23. Caro JJ, Briggs AH, Siebert U, Kuntz KM. ISPOR-SMDM modeling good research practices task force. modeling good research practices--overview: a report of the ISPOR-SMDM Modeling Good Research Practices Task Force--1. Value Health. 2012;15(6):796–803. doi:10.1016/j.jval.2012.06.012
24. Capri S, Ceci A, Terranova L, Merlo F, Mantovani L. Guidelines for Economic Evaluations in Italy: recommendations from the Italian Group of Pharmacoeconomic Studies. Drug Inf J. 2001;35(1):189–201. doi:10.1177/009286150103500122
25. Du Bois D, Du Bois EF. A formula to estimate the approximate surface area if height and weight be known. 1916. Nutrition. 1989;5(5):303–313.
26. Launonen A, Casulo C, Pott C, Rusconi C, Hernandez J, Davies A. Clinical outcomes of patients with intermediate‐to‐high‐risk follicular lymphoma (FL) in the Gallium phase III study. Hematol Oncol. 2019;37:386–387. doi:10.1002/hon.56_2631
27. Bachy E, Seymour JF, Feugier P, et al. Sustained progression-free survival benefit of rituximab maintenance in patients with follicular lymphoma: long-term results of the PRIMA study. J Clin Oncol. 2019;37(31):2815–2824. doi:10.1200/JCO.19.01073
28. Scalone L, Cortesi PA, Ciampichini R, et al. Italian population-based values of EQ-5D health states. Value Health. 2013;16(5):814–822. doi:10.1016/j.jval.2013.04.008
29. Ara R, Brazier JE. Populating an economic model with health state utility values: moving toward better practice. Value Health. 2010;13(5):509–518. doi:10.1111/j.1524-4733.2010.00700.x
30. Szende A, Janssen B, Cabases J, eds. Self-Reported Population Health: An International Perspective Based on EQ-5D. Dordrecht (NL): Springer; 2014. doi:10.1007/978-94-007-7596-1.
31. European Medicines Agency. Rituximab - Summary of product characteristics. Available from: https://www.ema.europa.eu/en/medicines/human/EPAR/mabthera.
32. SORESA. SORESA anagrafica beni (28-08-2020). Available from: www.soresa.it.
33. Roche Market Research. Data On-File.
34. Della Salute M. Remunerazione Prestazioni Di Assistenza Ospedaliera per Acuti, Assistenza Ospedaliera Di Riabilitazione e Di Lungodegenza Post Acuzie e Di Assistenza Specialistica Ambulatoriale. Decreto 10/2012 e pubblicato in GU Serie Generale n.23 del 28-1–2013.
35. Pradelli L, Bellone M. Market Access in Italy. In: Kockaya G, Wertheimer A, editors. Pharmaceutical Market Access in Deleveloped Markets. SEEd Medical Publishers Srl.
36. dei Ministri PD. La conferenza permanente per i rapporti tra lo Stato, le Regioni e le Provincie Autonome di Trento e Bolzano.
37. van Oers MH, Van Glabbeke M, Giurgea L, et al. Rituximab maintenance treatment of relapsed/resistant follicular non-Hodgkin’s lymphoma: long-term outcome of the EORTC 20981 phase III randomized intergroup study. J Clin Oncol. 2010;28(17):2853–2858. doi:10.1200/JCO.2009.26.5827
38. AIMAC. I Linfomi Non Hodgkin [Understanding Non-Hodgkin’s Lymphomas] (No. 18). La Collana del Girasole; 2015. Available from: https://www.aimac.it/libretti-tumore/linfomi-non-hodgkin.
39. Gopal AK, Kahl BS, de Vos S, et al. PI3Kδ inhibition by idelalisib in patients with relapsed indolent lymphoma. N Engl J Med. 2014;370(11):1008–1018. doi:10.1056/NEJMoa1314583
40. Leonard JP, Trneny M, Izutsu K, et al. AUGMENT: a Phase III study of lenalidomide plus rituximab versus placebo plus rituximab in relapsed or refractory indolent lymphoma. J Clin Oncol. 2019;37(14):1188–1199. doi:10.1200/JCO.19.00010
41. Mickisch G, Gore M, Escudier B, Procopio G, Walzer S, Nuijten M. Costs of managing adverse events in the treatment of first-line metastatic renal cell carcinoma: bevacizumab in combination with interferon-alpha2a compared with sunitinib. Br J Cancer. 2010;102(1):80–86. doi:10.1038/sj.bjc.6605417
42. Brown B, Diamantopoulos A, Bernier J, et al. An economic evaluation of cetuximab combined with radiotherapy for patients with locally advanced head and neck cancer in Belgium, France, Italy, Switzerland, and the United Kingdom. Value Health. 2008;11(5):791–799. doi:10.1111/j.1524-4733.2007.00302.x
43. Direzione generale della programmazione sanitaria - Ufficio 6. Ministero della Salute (2018). Rapporto annuale sull’attività di ricovero ospedaliero (SDO). Available from: https://www.salute.gov.it/portale/documentazione/p6_2_2_1.jsp?lingua=italiano&id=2898.
44. Messori A, Santarlasci B, Trippoli S, Vaiani M. Controvalore economico del farmaco e beneficio clinico: stato dell’arte della metodologia e applicazione di un algoritmo farmacoeconomico. [Clinical benefit and economic value: methodology and an economic application]. Pharmaco Econ. 2003;5:53–67.
45. Vellopoulou K, Tzanetakos C, Theodoropoulou T, Akratos A, Maniadakis N. Cost-effectiveness analysis of obinutuzumab for the treatment of patients with previously untreated advanced follicular lymphoma in Greece. Value in Health. 2018;21:S38.
46. Hofmann S, Himmler S, Ostwald D, Dünzinger U, Launonen A, Thuresson PO. The societal impact of obinutuzumab in the first-line treatment of patients with follicular lymphoma in Germany. J Comp Eff Res. 2020;9(14):1017–1026. doi:10.2217/cer-2020-0131
 © 2021 The Author(s). This work is published and licensed by Dove Medical Press Limited. The
full terms of this license are available at https://www.dovepress.com/terms
and incorporate the Creative Commons Attribution
- Non Commercial (unported, 3.0) License.
By accessing the work you hereby accept the Terms. Non-commercial uses of the work are permitted
without any further permission from Dove Medical Press Limited, provided the work is properly
attributed. For permission for commercial use of this work, please see paragraphs 4.2 and 5 of our Terms.
© 2021 The Author(s). This work is published and licensed by Dove Medical Press Limited. The
full terms of this license are available at https://www.dovepress.com/terms
and incorporate the Creative Commons Attribution
- Non Commercial (unported, 3.0) License.
By accessing the work you hereby accept the Terms. Non-commercial uses of the work are permitted
without any further permission from Dove Medical Press Limited, provided the work is properly
attributed. For permission for commercial use of this work, please see paragraphs 4.2 and 5 of our Terms.