")
Back to Journals » Diabetes, Metabolic Syndrome and Obesity » Volume 13
Obesity of G2e3 Knockout Mice Suggests That Obesity-Associated Variants Near Human G2E3 Decrease G2E3 Activity
Authors Powell DR , Doree DD, DaCosta CM, Platt KA, Hansen GM , van Sligtenhorst I , Ding ZM, Revelli JP, Brommage R
Received 23 April 2020
Accepted for publication 2 July 2020
Published 27 July 2020 Volume 2020:13 Pages 2641—2652
DOI https://doi.org/10.2147/DMSO.S259546
Checked for plagiarism Yes
Review by Single anonymous peer review
Peer reviewer comments 2
Editor who approved publication: Prof. Dr. Juei-Tang Cheng
David R Powell, Deon D Doree, Christopher M DaCosta, Kenneth A Platt, Gwenn M Hansen, Isaac van Sligtenhorst, Zhi-Ming Ding, Jean-Pierre Revelli, Robert Brommage
Lexicon Pharmaceuticals Inc, The Woodlands, TX, 77381, USA
Correspondence: David R Powell
Lexicon Pharmaceuticals Inc., 8800 Technology Forest Place, The Woodlands, TX 77381, USA
Tel +1 281 863 3060
Fax +1 281 863 8115
Email [email protected]
Purpose: In humans, single nucleotide polymorphisms (SNPs) near the adjacent protein kinase D1 (PRKD1) and G2/M-phase-specific E3 ubiquitin protein ligase (G2E3) genes on chromosome 14 are associated with obesity. To date, no published evidence links inactivation of either gene to changes in body fat. These two genes are also adjacent on mouse chromosome 12. Because obesity genes are highly conserved between humans and mice, we analyzed body fat in adult G2e3 and Prkd1 knockout (KO) mice to determine whether inactivating either gene leads to obesity in mice and, by inference, probably in humans.
Methods: The G2e3 and Prkd1 KO lines were generated by gene trapping and by homologous recombination methodologies, respectively. Body fat was measured by DEXA in adult mice fed chow from weaning and by QMR in a separate cohort of mice fed high-fat diet (HFD) from weaning. Glucose homeostasis was evaluated with oral glucose tolerance tests (OGTTs) performed on adult mice fed HFD from weaning.
Results: Body fat was increased in multiple cohorts of G2e3 KO mice relative to their wild-type (WT) littermates. When data from all G2e3 KO (n=32) and WT (n=31) mice were compared, KO mice showed increases of 11% in body weight (P< 0.01), 65% in body fat (P< 0.001), 48% in % body fat (P< 0.001), and an insignificant 3% decrease in lean body mass. G2e3 KO mice were also glucose intolerant during an OGTT (P< 0.05). In contrast, Prkd1 KO and WT mice had comparable body fat levels and glucose tolerance.
Conclusion: Significant obesity and glucose intolerance were observed in G2e3, but not Prkd1, KO mice. The conservation of obesity genes between mice and humans strongly suggests that the obesity-associated SNPs located near the human G2E3 and PRKD1 genes are linked to variants that decrease the amount of functional human G2E3.
Keywords: glucose tolerance, gene trap, homologous recombination, Prkd1, PRKD1, SNP
Introduction
The obesity pandemic is a major public health issue. The prevalence has increased steadily since 1980, and by 2015 107.7 million children and 603.7 million adults worldwide were obese.1,2 These obesity estimates were based on body-mass index (BMI) data, calculated as weight (kg)/height2 (meters), with obesity defined as BMI ≥ 30. In 2015, high BMI was linked globally to loss of 4 million lives and 120 million disability-adjusted life years.2,3 Clearly, there is a need to develop interventions that effectively lower the amount of body fat.
Human obesity, as represented by the surrogate measure BMI, has a genetic component, with genetic variants accounting for approximately 30% of BMI variability.4–6 The value in identifying genes responsible for this heritability is the potential to predict individual obesity risk and the potential to identify pathways and targets for obesity therapeutics. Recently, genome-wide association study (GWAS) data have identified >250 independent loci that contribute to BMI variance.6–11 Unfortunately, these GWAS loci do not easily pinpoint novel therapeutic targets because most reside in introns as clusters of noncoding variants that likely regulate expression, not function, of a causal protein encoded by a local or distant gene.10
In humans, single nucleotide polymorphisms identify an obesity locus near the adjacent protein kinase D1 (PRKD1) and G2/M-phase-specific E3 ubiquitin protein ligase (G2E3) genes that reside in a head-to-head orientation on chromosome 14.8,12–15 To date, no peer-reviewed evidence links inactivation of either gene to changes in body fat. These two genes are also adjacent in the same orientation on mouse chromosome 12. Because inactivating mutations in mouse genes often identify genes crucial to the regulation of human body fat stores,16 provide insight into the physiologic role of GWAS-associated human genes,17 and mimic human mutant genetic phenotypes,18 knockouts (KOs) of the mouse Prkd1 and G2e3 genes could provide insight into whether these genes help to regulate mammalian body fat stores. Unfortunately, past studies reported perinatal lethality for most Prkd1 KO mice19,20 and for all G2e3 KO mice.21
Mice with KOs of drug targets exhibit phenotypes that correlate well with the effects of those drugs in humans; this correlation between effects of genetic manipulation in mice and pharmacologic manipulation in humans provides further evidence of broad conservation of mammalian gene function.22,23 Because mouse global KO phenotypes model drug effects, Lexicon Pharmaceuticals Inc., pursued the high-throughput Genome5000TM program designed to KO and phenotype the druggable genome in a search for novel drug targets, an effort that spanned from 2000 to 2008.18,22–29 In addition to identifying drug targets, this campaign resulted, to date, in published mouse phenotypes mimicking 30 known and 29 subsequently identified human genetic diseases.18 Prkd1 KO mice were generated because PRKD1 is a classically druggable enzyme. G2e3 KO mice were generated because the Genome5000TM program surveyed a small number of non-classical enzymes such as G2E3 to achieve a pragmatic and broad coverage of the enzyme class. Although both KO lines exhibited reduced viability, sufficient KO mice of each line survived to adulthood to allow analysis of body composition. The data clearly demonstrate obesity in adult G2e3, but not Prkd1, KO mice.
Materials and Methods
Generation of KO Mice
The G2e3 and Prkd1 KO lines were generated at Lexicon Pharmaceuticals Inc. (The Woodlands, TX, USA) on a 129S5/SvEvBrd x C57BL/6-Tyrc-Brd hybrid background. The G2e3 KO line was generated by gene trapping as part of the Lexicon program to KO and phenotype mouse orthologs of nearly 5000 druggable human genes.22,26–29 Methods for gene trapping in embryonic stem (ES) cells, identifying trapped genes using OmniBank Sequence Tags (OSTs), characterizing retroviral gene trap vector insertion sites, and reverse-transcription polymerase chain reaction (RT-PCR) analysis of KO and WT transcripts are published.30,31 Briefly, a retroviral gene trap vector was used to produce OmniBank clone OST GST_3673_G2, which contains an insertion into the intron between the first and second exons of G2e3; this clone was then used to generate G2e3 KO mice (Figure 1).
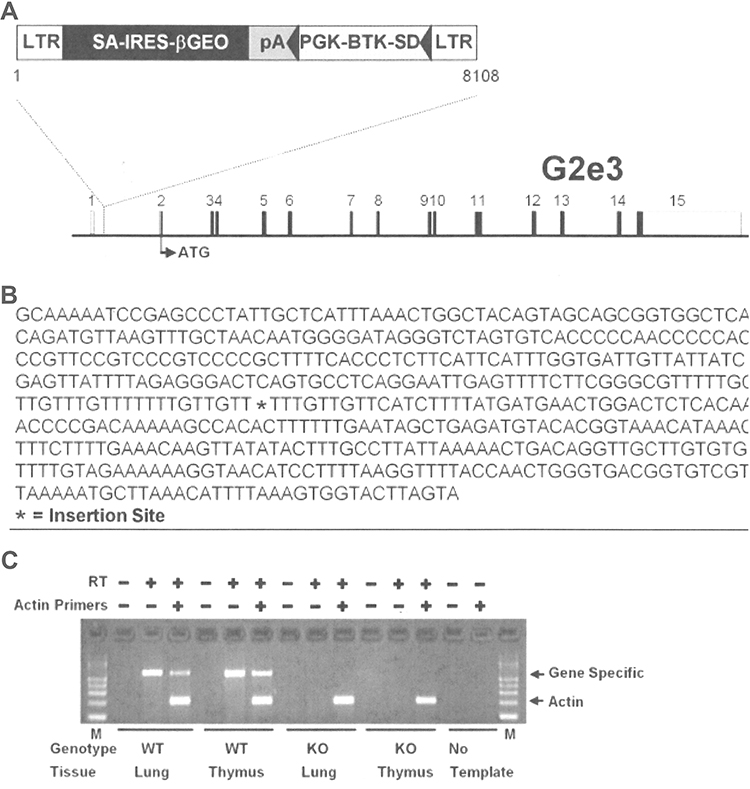 |
Figure 1 Disruption of the G2e3 gene. Notes: (A) G2e3-deficient mice were generated from OmniBank ES cell clone OST GST_3673_G2 which contains a gene trapping vector insertion in the first intron of G2e3 (accession NM_001015099.1). Numbered rectangles represent the 15 exons; open rectangles represent noncoding, and closed rectangles represent coding, exon sequence. (B) G2e3 intron 1 sequence surrounding the vector insertion site. (C) RT-PCR analysis of G2e3 transcript using primers complimentary to exons 1 and 2 of the G2e3 gene. Endogenous G2e3 transcript was detected in the lung and thymus of WT mice. No endogenous G2e3 transcript was detected in KO mouse tissues. RT-PCR analysis using primers (Actin) complimentary to the mouse beta-actin gene (accession number M12481) was performed in the same reaction as an internal amplification control. Abbreviations: LTR, long terminal repeat; SA, splice acceptor sequence; IRES, internal ribosomal entry site; βGEO, translational fusion of the beta-galactosidase gene and the neomycin phosphotransferase gene; pA, polyadenylation sequence; PGK, phosphoglycerate kinase-1 promoter; BTK-SD, Bruton tyrosine kinase splice donor sequence; RT-PCR, reverse transcription-polymerase chain reaction; WT, wild-type; KO, knockout; M, PCR product size markers. |
The Prkd1 KO line was generated by homologous recombination (Supplementary Figure 1A), using a conditional targeting vector derived with the lambda knockout shuttle (KOS) system.32 The Lambda KOS phage library, arrayed into 96 superpools, was screened by PCR using exon 7-specific primers Prkd1-5 (5ʹ-AAGCCGTGAATGAATGGAAGTTGC-3ʹ) and Prkd1-6 (5ʹ-TCTGAACAAACTAGGCTTAAGGAG-3ʹ). The PCR-positive phage superpools were plated and screened by filter hybridization using the 458 bp amplicon derived from primers Prkd1-5 and Prkd1-6 as a probe. Two pKOS genomic clones, pKOS-90 and pKOS-23 were isolated from the library screen and confirmed by sequence and restriction analysis. Gene-specific arms (5ʹ-GTCTCCATCTGAGTCATTTATCGGCCGTGAGAAGAGGTC-3ʹ) and (5ʹ-CAACCAAGCTCCTCATTCTGTAAGCTTTCCTACACAGTAC-3ʹ) were appended by PCR to a yeast selection cassette containing the URA3 marker. The yeast selection cassette and pKOS-90 were co-transformed into yeast, and clones that had undergone homologous recombination to replace a 2228 base pair (bp) region containing exons 6–8 with the yeast selection cassette were isolated. The Prkd1 targeting vector was completed when the yeast cassette was replaced with a Bgeo/Puro selection cassette (Bgeo is the β-galactosidase/neomycin phosphotransferase fusion gene providing neomycin resistance; Puro is the puromycin resistance gene puromycin N-acetyl-transferase). The Not I linearized targeting vector was electroporated into 129/SvEvBrd (Lex-2) ES cells. G418 (geneticin)-resistant ES cell clones were isolated, and correctly targeted clones were identified and confirmed by Southern analysis using a 381 bp 5ʹ external probe (19/20), generated by PCR using primers Prkd1-19 (5ʹ-TAATCTAGGTTCCTGCAGTTATGA-3ʹ) and Prkd1-20 (5ʹ-ATAATTTATGGTGCAGGATTAGAA-3ʹ), and a 413 bp 3ʹ internal probe (9/10), amplified by PCR using primers Prkd1-9 (5ʹ-TAATAAACATTCTTTTAGTAGGGA-3ʹ) and Prkd1-10 (5ʹ-TTCTCATTGATCTTGATGGCATTC-3ʹ). Southern analysis using probe 19/20 detected an 18.0 Kb wild-type (WT) band and 6.8 Kb mutant band in KpnI digested genomic DNA while probe 9/10 detected a 11.0 Kb WT band and 15.0 Kb mutant band in ScaI digested genomic DNA (Supplementary Figure 1B). One targeted ES cell clone, 1A3, was identified and microinjected into C57BL/6 (albino) blastocysts to generate chimeric animals which were bred to C57BL/6 (albino) females, resulting in F1 heterozygous (HET) offspring.
For both G2e3 and Prkd1 KO lines, F1 HET offspring of chimeric founder parents were intercrossed to produce F2 KO and WT mice which were then used in all phenotyping studies. Genotyping was performed on tail DNA as previously described.31 In all experiments, KO mice were compared directly with their WT littermates.
Mouse Care and Study
All studies were performed in strict accordance with the recommendations in the Guide for the Care and Use of Laboratory Animals of the National Institutes of Health. The protocols for all studies were approved by the Lexicon Institutional Animal Care and Use Committee (OLAW Assurance Number, A4152-01; AAALAC International Accreditation Number, 001025). General methods for mouse care have been previously described.31 Mice were housed in a temperature-controlled environment on a fixed 12-h light/12-h dark cycle, with free access to water and food. Mice were fed either a standard rodent chow containing 22% kcal from fat (9F 5020; Purina, St Louis, MO, USA) or high-fat diet (HFD) containing 45% kcal from fat (D12451; Research Diets, New Brunswick, NJ, USA).
High-Throughput Screen
As part of Lexicon’s Genome5000TM program to KO and phenotype the druggable mouse genome, adult WT and KO mice were evaluated by a comprehensive battery of phenotype screening exams as previously described.18,26,27 Included in this high-throughput screen (HTS) protocol were assays evaluating body composition, oral glucose tolerance, insulin levels, serum chemistries and systolic blood pressure (SBP).
Body Composition Determinations
As part of the HTS, body composition was analyzed on two independent mouse cohorts. A cohort of 14-week old mice, fed chow diet from weaning, was screened by dual-energy X-ray absorptiometry (DEXA) using a GE/Lunar Piximus scanner (GE Medical Systems, Madison, WI, USA) as described previously.28,33 For each KO line, mean KO % body fat/mean WT littermate % body fat was calculated for both male and female mice; these male and female values were then averaged and multiplied x100, yielding a normalized % body fat value. For most KO lines, 4 male KO, 2 male WT, 4 female KO and 2 female WT mice were analyzed.28 A second, independent cohort of 11-week old male mice fed HFD from weaning was screened by quantitative magnetic resonance (QMR) technology using a Bruker Minispec QMR Analyzer (ECHO Medical Systems, Houston, TX, USA) as described previously;34 all lines with between 3 and 8 KO mice and between 3 and 8 WT littermate controls were included in the analysis. The normalized % body fat for each line was calculated as described above for the chow-fed cohort. The G2e3 KO line was studied in greater detail to determine if the body fat phenotype observed during the HTS was reproducible in additional cohorts of male and female KO and WT littermate mice; these body composition measurements were made by QMR as described above. In addition to analyzing % body fat and normalized % body fat, other parameters evaluated for each KO line were body weight, normalized body weight, body fat, normalized body fat, lean body mass (LBM) and normalized LBM; all normalized data were calculated exactly as for normalized % body fat.
Oral Glucose Tolerance Tests
As part of the HTS, oral glucose tolerance tests (OGTTs) were performed on 14 week-old conscious, unanesthetized male mice fed HFD from weaning.27 After an 18 hr overnight fast, mice were bled by tail nick predose and then received 2 g/kg glucose by oral gavage. Whole-blood samples obtained by tail nick at 0 (predose), 30, 60 and 90 mins were directly assayed for glucose levels by ACCU-CHEK Aviva glucometer (Roche, Indianapolis, IN, USA). Two additional 65 μL serum aliquots obtained at 0 (predose) and 30 mins were used to measure insulin levels (Ultra Sensitive Rat Insulin ELISA Kit, Cat. 90,060; Crystal Chem, Downers Grove, IL, USA).
Serum Analysis
As part of the HTS, retro-orbital blood was obtained in the fed state from 15 week-old conscious, unanesthetized male and female mice fed chow diet from weaning. Serum was assayed for multiple analytes using a Cobas Integra 400 analyzer (Hoffman-La Roche Ltd., Basel, Switzerland) as described previously.27
Systolic Blood Pressure
Systolic blood pressure was measured on conscious 10–13 week-old male and female mice using a tail-cuff system (Visitech Systems, Apex, NC, USA). SBP was measured 10 times daily for 4 consecutive days, and the SBP value reported was the mean of the 40 SBP readings, as previously described.35
Statistics
Data are presented as mean ± standard deviation (SD). Unless stated otherwise, comparisons between groups were analyzed by unpaired Student’s t-test. Chi-Square testing determined whether Mendelian ratios deviated from expected values. All statistical tests were performed using PRISM 4.03 (GraphPad Software, Inc., La Jolla, CA, USA). Differences were considered statistically significant when P<0.05.
Results
Generation and Viability of KO Mice
G2e3 KO mice were generated using a gene trap strategy. The gene trap vector inserted in the first intron immediately upstream of the ATG-containing first coding exon (Figure 1A and B). This insertion resulted in complete absence of G2e3 transcript in KO tissues (Figure 1C). The G2e3 line of mice generated had an abnormal Mendelian distribution at weaning (189 WT, 396 HET, 147 KO mice; P<0.001), indicating reduced viability of G2e3 KO mice. Prkd1 KO mice were generated by homologous recombination (Supplementary Figure 1A), with Southern blot analysis confirming the deletion of coding exons 6–8 of the mouse Prkd1 gene (Supplementary Figure 1B). The Prkd1 line of mice had an even more abnormal Mendelian distribution at weaning (48 WT, 109 HET, 26 KO mice; P<0.001), indicating markedly reduced viability of Prkd1 KO mice. Despite these abnormal Mendelian distributions, surviving KO mice from each line appeared healthy.
Body Composition
A sufficient number of G2e3 and Prkd1 KO mice were available for HTS. This was achieved by aggressively breeding Prkd1 F1 HET mice to overcome the markedly reduced viability of Prkd1 KO mice that contributed to the low mean litter size of 7 pups. Analysis of HTS data on body composition measured by DEXA on 3651 KO lines fed chow diet from weaning showed that G2e3 KO mice, but not Prkd1 KO mice, had increased % body fat relative to WT littermates (Figure 2A). In this analysis, the % body fat of G2e3 KO mice measured in the top 1.5% of all KO lines tested. In addition, the analysis of HTS data on body composition measured by QMR on 2463 KO lines fed HFD from weaning also showed that G2e3 KO mice, but not Prkd1 KO mice, had increased % body fat relative to WT littermates (Figure 2B). In this analysis, the % body fat of G2e3 KO mice measured in the top 0.5% of all KO lines tested. The body composition data from the 3 HTS cohorts of male or female G2e3 mice, and 2 additional cohorts of male or female G2e3 mice fed chow diet from weaning, clearly show numerically increased body fat for the KO mice of each cohort (Supplementary Table 1). These data were then normalized such that the mean value for each parameter in individual cohorts of WT male or female mice was assigned a value of 100%; this allows pooling of data by minimizing between-cohort variability that results from differences in age, sex and dietary fat intake. When data pooled from all KO and all WT mice were compared, G2e3 KO mice showed significant increases of 11% in body weight, 65% in total body fat and 48% in % body fat, while LBM was not significantly different between G2e3 KO and WT mice (Table 1). Body fat and % body fat were also significantly increased in G2e3 KO mice relative to their WT littermates for each of the subcategories of chow-fed female, chow-fed male, and HFD-fed male mice (Table 1). In contrast, body composition data from the 3 HTS cohorts of male or female Prkd1 mice showed no numerical increase in body fat for the KO mice of any of these cohorts (Supplementary Table 2), and comparing normalized data pooled from all KO and all WT mice revealed that Prkd1 KO mice did not differ significantly from their WT littermates for either body weight, body fat, % body fat, or LBM (Table 2).
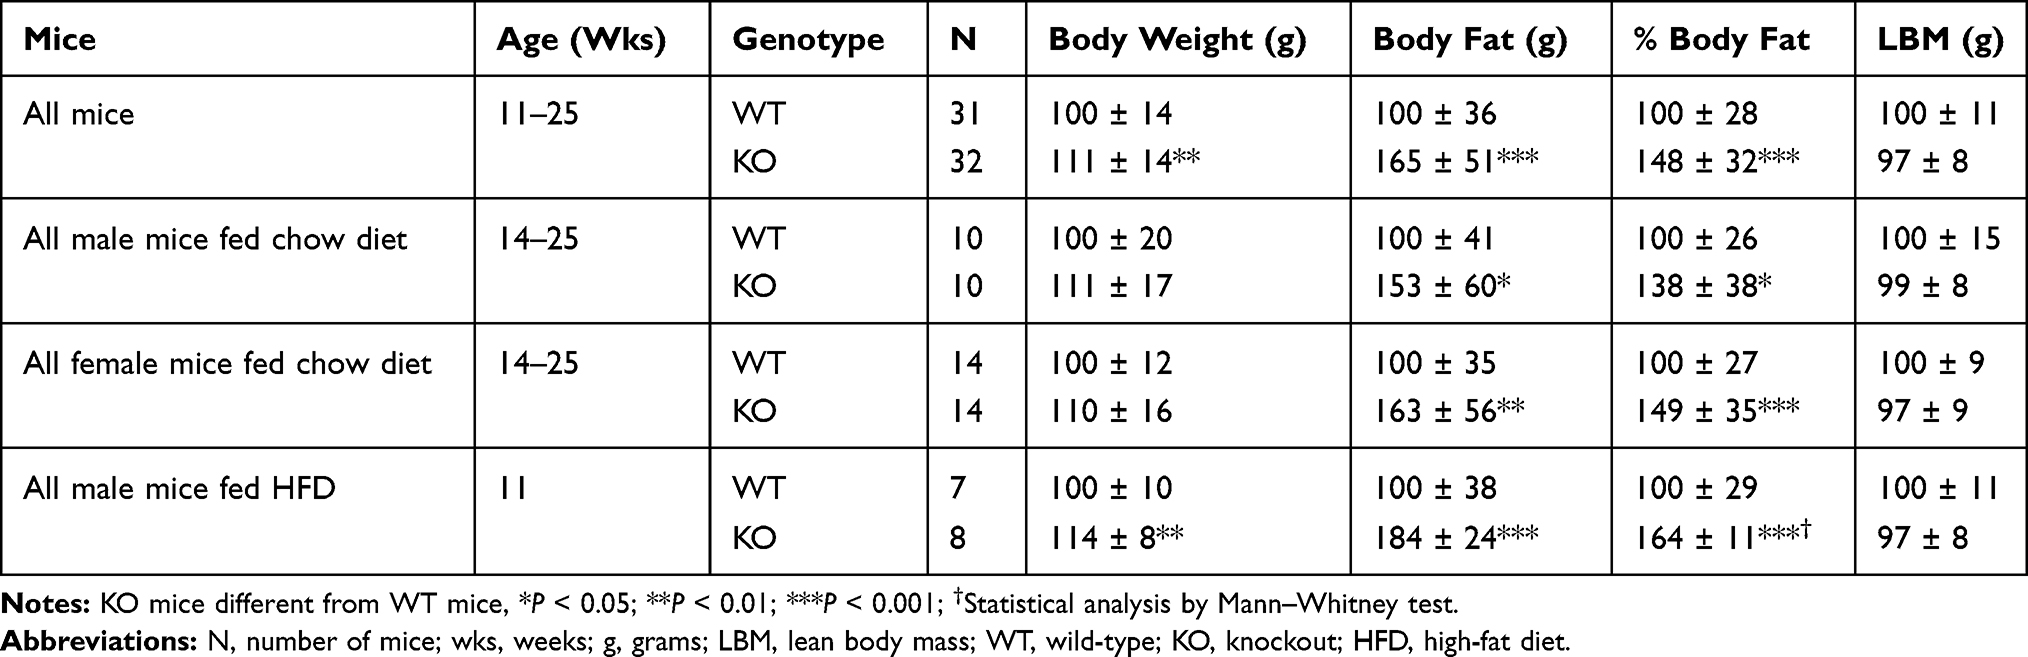 |
Table 1 Normalized Body Composition Data for G2e3 KO Mice |
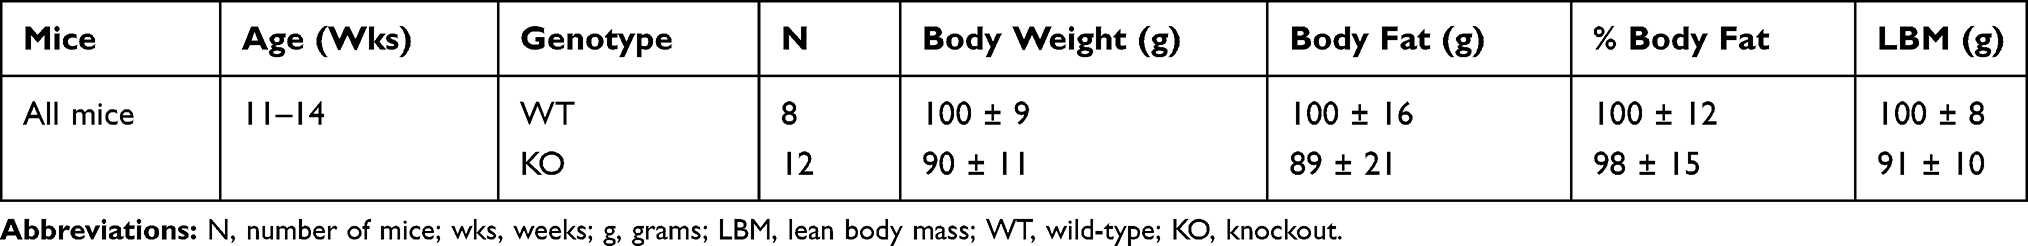 |
Table 2 Normalized Body Composition Data for Prkd1 KO Mice |
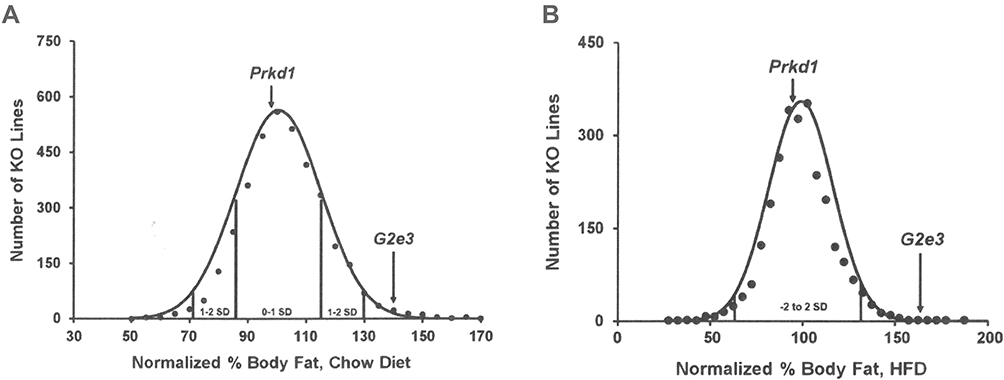 |
Figure 2 G2e3 KO mice, but not Prkd1 KO mice, are obese during high-throughput phenotypic screening. Notes: (A) Histogram of normalized % body fat for 3651 KO lines maintained on chow diet. Body composition analyses performed by DEXA on 14-week-old male mice fed chow diet from weaning were used to calculate normalized % body fat for each KO line, as described in Materials and Methods. Solid points indicate actual numbers of KO lines. Curved line shows the calculated curve; the range for 1 and 2 SD from the mean is indicated by lines located below the curve, and the mean values for the G2e3 and Prkd1 KO mouse lines are indicated by arrows shown above the curve. (B) Histogram of normalized % body fat for 2463 KO lines maintained on HFD. Body composition analyses performed by QMR on 11-week-old male mice fed 45% HFD from weaning were used to calculate normalized % body fat for each KO line, as described in Materials and Methods. Solid points indicate actual numbers of KO lines. Curved line shows the calculated curve; the range for 2 SD from the mean is indicated by lines located below the curve, and the values for the G2e3 and Prkd1 KO mouse lines are indicated by arrows shown above the curve. Abbreviations: DEXA, dual-energy X-ray absorptiometry; HFD, high-fat diet; KO, knockout; QMR, quantitative magnetic resonance; SD, standard deviation. |
Glucose Homeostasis and Serum Chemistries
Glucose homeostasis was evaluated in mice from each KO line. OGTTs, performed on 14 week-old male mice fed HFD from weaning, showed significantly impaired glucose tolerance in G2e3 KO mice relative to their WT littermates (Figure 3A) despite numerically greater insulin levels in the KO mice (Figure 3B); in contrast, glucose tolerance and insulin levels were comparable between Prkd1 KO and WT mice (Figure 3C and D). Also, as part of the HTS, blood chemistry levels were measured using serum from 15 week-old male and female mice fed chow diet from weaning. Levels for all analytes were comparable between WT and KO mice for the two KO lines except for serum glucose levels in G2e3 mice, which were significantly higher in KO mice relative to their WT littermates (Table 3).
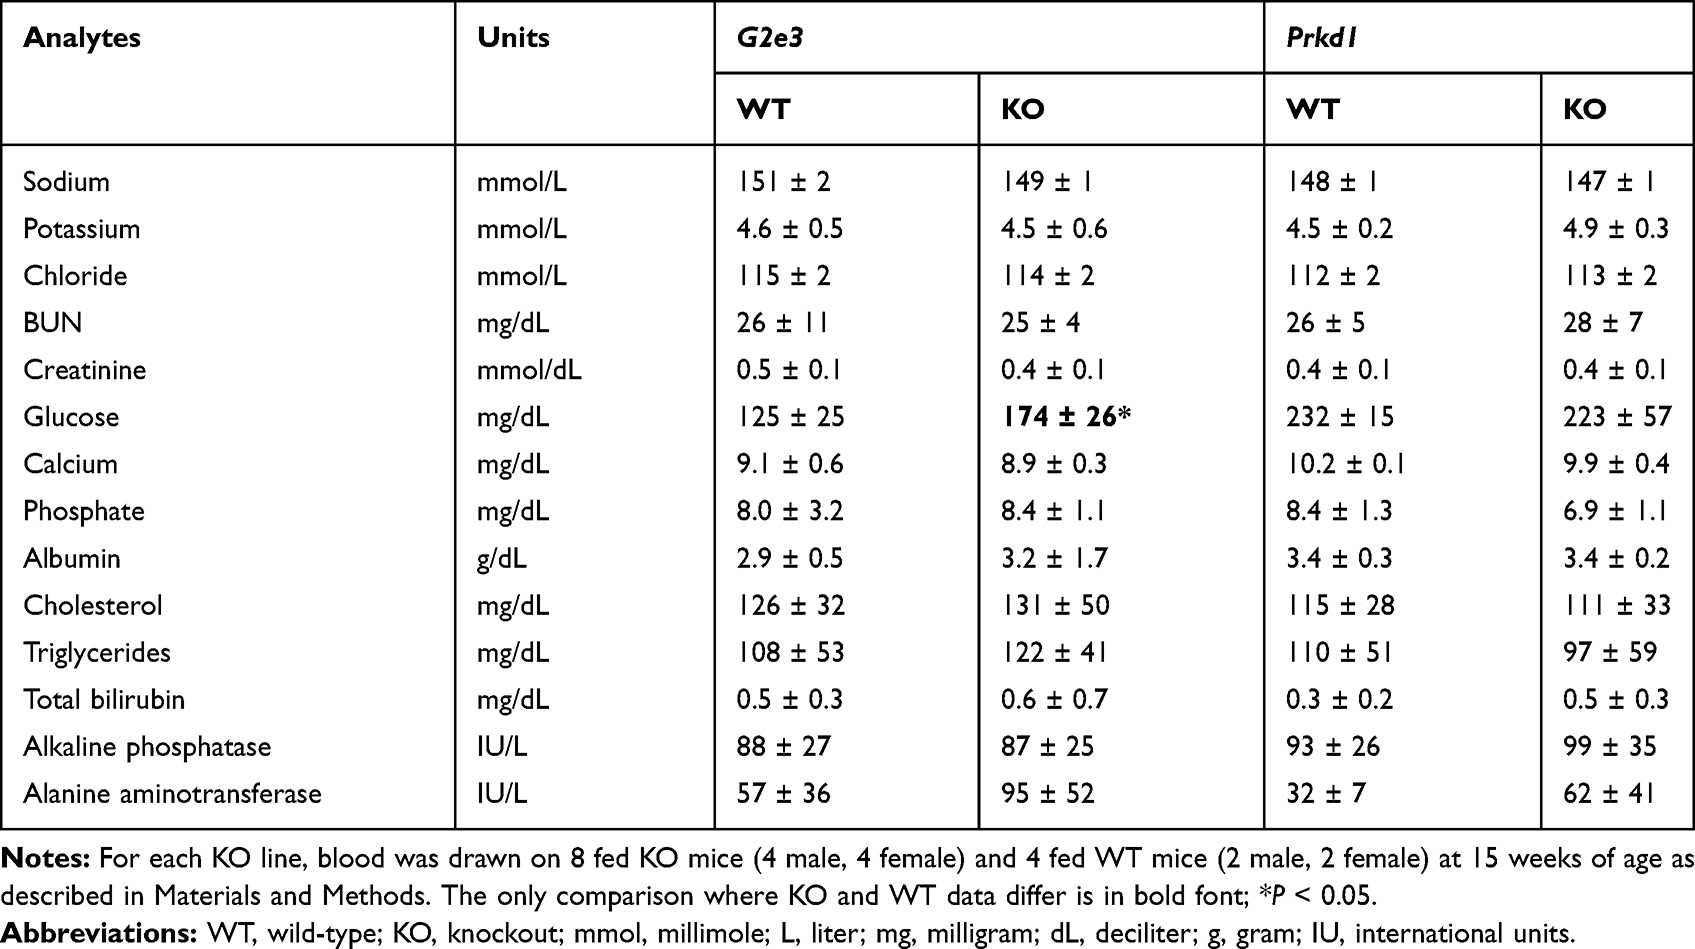 |
Table 3 Serum Chemistries from G2e3 and Prkd1 KO Mice |
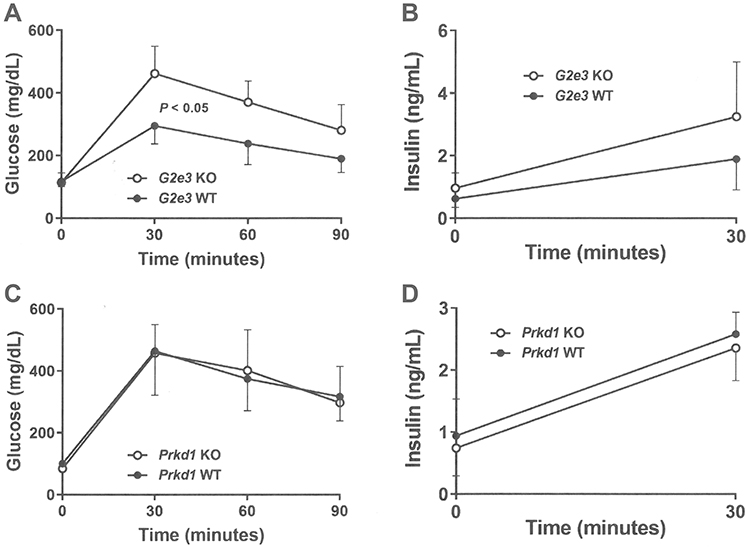 |
Figure 3 Impaired OGTT in G2e3, but not Prkd1, KO mice. Notes: (A) Glucose excursions, and (B) 0 min and 30 mins insulin levels, from OGTTs performed on HFD-fed male G2e3 KO mice (n=6) and their WT littermates (n=4) at 14 weeks of age. (C) Glucose excursions, and (D) 0 min and 30 mins insulin levels, from OGTTs performed on HFD-fed male Prkd1 KO mice (n=4) and their WT littermates (n=4) at 14 weeks of age. Glucose AUC for G2e3 KO mice different from WT littermates, P<0.05. Abbreviations: AUC, area under the curve; OGTT, oral glucose tolerance test; HFD, high-fat diet; KO, knockout; WT, wild-type. |
Systolic Blood Pressure
SBP measured in G2e3 and Prkd1 KO mice at 13 weeks of age was comparable to WT littermate values (Table 4). The obese phenotype of G2e3 KO mice prompted the study of SBP in an independent cohort of 10 to 12 week-old mice, which again revealed comparable SBP in G2e3 KO and WT littermate mice.
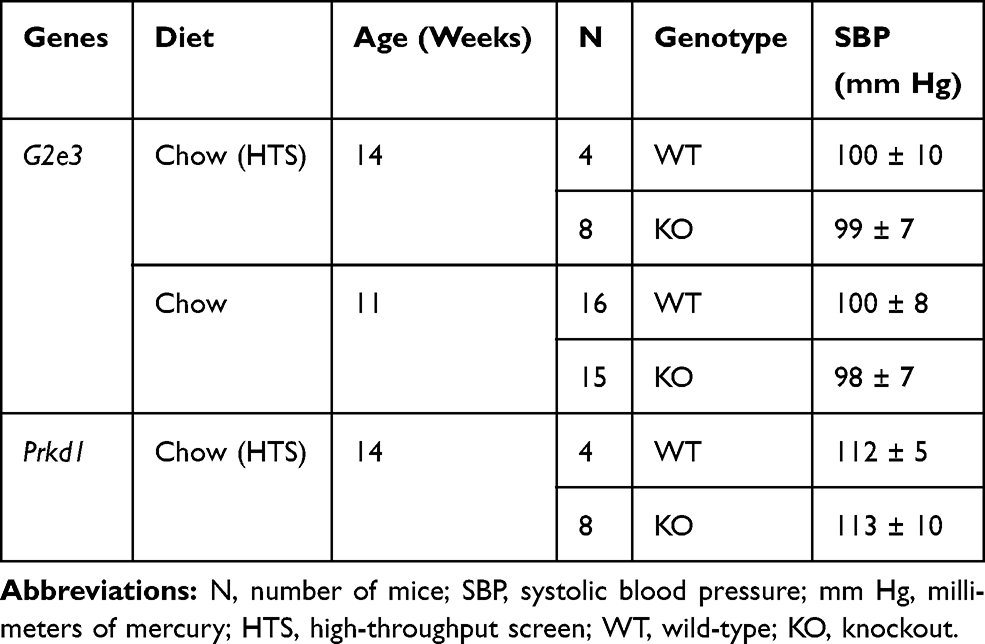 |
Table 4 Systolic Blood Pressure in G2e3 and Prkd1 KO Mice |
Discussion
G2e3 KO mice had markedly increased body fat in the HTS cohort of chow-fed mice, a finding that was duplicated in the independent HTS cohort of HFD-fed mice. A comparable increase of body fat in these HTS cohorts was also observed with KOs of Mc4r and Ksr2,28,34,36 genes that, when inactivated, are associated with human obesity;37,38 in fact, the obesity phenotype of Ksr2 KO mice was first observed in these HTS cohorts.28 Additional cohorts of chow-fed male and female G2e3 KO mice also had high body fat, providing additional support for the obesity phenotype identified in the HTS cohorts. Evidence of impaired glucose homeostasis was also observed in two independent cohorts of G2e3 KO mice, consistent with findings in obese mice and humans in general and in Mc4r and Ksr2 KO mice in particular.34,39 The reduced viability of G2e3 KO mice is certainly compatible with their obesity phenotype, as breeding of many other obese mouse KO lines including Ksr2,34 Adcy3,40 Bdnf,41 Ntrk2,42 and Sim143 produces fewer viable KO progeny than expected.
G2e3 is an E3 ubiquitin ligase that is expressed in many human and mouse tissues, including CNS.44,45 E3 ubiquitin ligase proteins are the substrate recognition component of the ubiquitin proteasome system (UPS), a highly ordered protein regulation system within cells that is critical for cellular protein homeostasis and function.46 To maintain normal cellular physiology and to respond to biological signals, cells must control the quality and the quantity of all proteins. The UPS controls protein fate using post-translational markers like ubiquitin (Ub) which triggers protein-centric cellular actions such as protein degradation, localization and signaling. These moieties are transferred to substrate proteins through the sequential action of a cascade of three enzymes, the Ub-activating enzymes (E1s), the Ub-conjugating enzymes (E2s), and the Ub ligases (E3s).47 The human proteome contains only a few E1 and E2 enzymes whereas there are over 600 E3 ligases. Because E3 ligases confer specificity to the action of the UPS, a diversity of these enzymes may be necessary to enable proteome-wide control.
G2E3 contains a homologous to E6-associated protein C-terminus (HECT) domain.21 The HECT class of E3 ligases catalyze protein ubiquitination in a two-step process, first accepting activated Ub from the E2 in a transthiolation reaction onto the HECT catalytic cysteine, and then transferring that Ub moiety to a lysine on the protein substrate. G2E3 is unusual in that it is the only HECT ligase that also contains Really Interesting New Gene (RING)-like domains.21,48 RING E3 ligases transfer Ub through a single-step mechanism that does not require conjugation of the Ub moiety to the E3 ligase as an intermediary step, therefore G2E3 may have dual functionality.21 Using an artificial system in vitro, Brooks et al21 showed that mutating the catalytic cysteine within the HECT domain was not sufficient to abrogate all G2E3 ubiquitylation activity, implying that the RING-like domains of G2E3 are competent for ubiquitylation. However, additional work is needed to better understand the biochemical activity of this unique HECT E3 ligase because cysteine-to-alanine mutations may disrupt protein folding or intra- or inter-molecular interactions, thus complicating interpretation of the functional effects of the mutation. Brooks et al21 also attempted to understand G2E3 biological function by generating G2e3 KO mice using a gene trap strategy and studying mice on a hybrid mouse background, an approach similar to ours. However, unlike the modestly reduced viability of our KO mice, their G2e3 KO mice did not survive past embryonic day 8.5. Their gene trap vector inserted between exons 13 and 14, resulting in a fusion protein consisting of an N-terminal G2E3 protein fragment, which lacked the full HECT domain, fused to a C-terminal β-galactosidase reporter gene under the control of the endogenous G2e3 promoter. This hybrid protein, which could potentially exhibit aberrant function because it contains a truncated G2E3 protein fragment containing the RING-like domains, was widely expressed throughout embryonic development based on demonstrated β-galactosidase activity; the authors argued that E3 activity of this fusion protein could not explain the embryonic lethal KO phenotype because HET mice were fully viable.21 Our gene trap strategy disrupted the G2e3 transcript upstream of the ATG translation initiation codon, precluding expression of any partial G2E3 protein with biological activity; indeed, RT-PCR demonstrated complete absence of G2e3 transcript in our KO model. Importantly, a third G2e3 KO line, developed using an independent strategy by the International Mouse Phenotyping Consortium, was recently reported on their website to generate G2e3 KO mice that are not only viable but are also obese (https://www.mousephenotype.org/data/genes/MGI:2444298). This confirmation of our G2e3 KO obesity phenotype suggests that the reported G2E3/β-galactosidase fusion protein is responsible for embryonic lethality in the published G2e3 KO mice.
PRKD1 is a serine/threonine kinase widely expressed in human and mouse tissues, including CNS and pancreatic β-cells.44,45,49 PRKD1 function has not been linked to obesity but has been linked to insulin secretion and β-cell survival.49 Although we observed markedly reduced viability in Prkd1 KO mice, aggressive breeding produced enough adult KO mice to allow HTS screening, which revealed comparable body fat and glucose tolerance in Prkd1 KO and WT littermates. This reduced viability was not as severe as that reported previously for two Prkd1 lines where loss of Prkd1 gene expression19 or PRKD1 catalytic function20 resulted in embryonic lethality with incomplete penetrance; the reason for this relative difference in survival is not clear.
The strongest evidence linking G2E3 to obesity comes from GWAS data. In humans, G2E3 extends from 5ʹ 30,559,123 to 3ʹ 30,620,064 bp on chromosome 14, adjacent to and in a head-to-head orientation with PRKD1 that extends from 5ʹ 29,927,847 to 3ʹ 29,576,479 bp (https://www.ncbi.nlm.nih.gov/gene/55632); these two genes are in a similar orientation on mouse chromosome 12 (https://www.ncbi.nlm.nih.gov/gene/217558). Within the 631 kilobase (kb) intergenic region on human chromosome 14, the single nucleotide polymorphism (SNP) rs11847697 located ~ 44 kb 5ʹ to G2E3 is associated with increased BMI,8 with a larger effect on BMI in adolescents and young adults compared with older adults,12 and with possible gene–gene interactions influencing BMI, particularly interactions with the FTO locus in adolescents.13,14 Another SNP linked to increased BMI in Pima Indians is located ~1.2 million bp (Mb) upstream of G2E3 and 3ʹ to PRKD1,15 while additional SNPs linked to type 2 diabetes in an extended Arab family are located within PRKD1, ~750 kb upstream of G2E3.50 The literature links all of these SNPs to PRKD1 without any data showing either that PRKD1 affects body weight or why it might.51 Our data suggest these SNPs are linked to G2E3. It is unclear whether any of these SNPs are causal obesity-associated variants or are merely linked to them. The location of these variants in intronic and intergenic regions suggests that they likely affect G2E3 expression through effects on transcription, splicing or mRNA stability.52 Although located up to 1.2 Mb away from G2E3, these obesity-associated variants could still exert long-range regulatory effects on the G2E3 gene and promoter due to the three-dimensional organization of chromatin, similar to the way that chromatin looping allows obesity-associated variants at the FTO locus to regulate IRX5 expression from a distance of 1.2 Mb.52–54
The conclusion that these SNPs are linked to G2E3 requires evidence for a tight correlation between mouse and human obesity genes. For the 16 known human monogenic obesity genes, 13 were first reported as monogenic obesity genes in mice: LEP,55,56 LEPR,55,57 MC4R,36,37 POMC,58,59 SH2B1,60,61 BDNF,41,62 NTRK2,42,63 KSR2,28,38 ADCY3,40,64 CPE,65,66 TUB,65,67 NCOA1,68,69 and MC3R.70–72 In addition, MRAP2 was simultaneously reported as an obesity gene in humans and mice,73 while SIM1 and PCSK1 were first reported as obesity genes in humans before convincing evidence was available in mice.43,74-79 Thus, for all 16 genes, there is strong evidence that inactivating mutations in the homologous mouse gene closely reproduce the human obesity phenotype. These data indicate a remarkable conservation among mammals of the genes that regulate body fat, suggesting that the protein product of novel genes regulating body fat in mice may well perform the same function in humans. Of course, these are monogenic obesity genes, where total or nearly total inactivation of a single gene results in obesity. Although it is possible that total loss of G2E3 activity also results in human obesity, the association of G2E3 with the nearby GWAS obesity locus on chromosome 14 is suggesting that one or more obesity-associated variants are modestly, rather than profoundly, decreasing G2E3 function. This is consistent with the observation that many human monogenic obesity genes, including LEPR, POMC, SH2B1, BNDF, ADCY3, TUB, NCOA1, and PCSK1, are located within 1.2Mb of documented GWAS obesity loci,8,80 suggesting that their modest inhibition by variants located in these chromosomal regions may contribute modestly to body fat accrual in affected individuals.
This study has several limitations. The absence of obesity in Prkd1 KO mice requires confirmation using an independent KO model to rule out a false-negative result. Our HTS did not provide data on food consumption or energy expenditure by G2e3 KO mice, because it is an agnostic screen for genes associated with obesity and not for the mechanism leading to the obesity phenotype, similar to GWAS; however, unlike GWAS, our HTS did identify a gene contributing to the obesity phenotype, a crucial achievement. Our study also does not provide insights into which G2e3 protein substrate is involved in generating the obesity phenotype, or the tissues involved. No G2e3 protein substrate is currently known and these substrates are often difficult to identify despite multiple screening techniques;81 perhaps screening of candidate proteins involved in obesity pathways, or in gene–gene interactions, can provide early insight.
Conclusion
Significant obesity and glucose intolerance were observed in G2e3, but not Prkd1, KO mice. The conservation of obesity genes between mice and humans strongly suggests that the obesity-associated SNPs located near the human G2E3 and PRKD1 genes are linked to variants that decrease the amount of functional G2E3.
Acknowledgments
The authors wish to thank Kristi Boehm, MS, ELS, for her help in editing and in preparing the figures.
Disclosure
All authors were employed by Lexicon Pharmaceuticals Inc., at the time these studies were performed and may own common stock or may have been granted stock options or other equity incentive awards. The authors report no other conflicts of interest in this work.
References
1. Roberto CA, Swinburn B, Hawkes C, et al. Patchy progress on obesity prevention: emerging examples, entrenched barriers, and new thinking. Lancet. 2015;385:2400–2409.
2. Afshin A, Forouzanfar MH, Reitsma MB, et al. Health effects of overweight and obesity in 195 countries over 25 years. N Engl J Med. 2017;377:13–27.
3. Bhupathiraju SN, Hu FB. Epidemiology of obesity and diabetes and their cardiovascular complications. Circ Res. 2016;118:1723–1735.
4. Allison DB, Kaprio J, Korkeila M, et al. The heritability of body mass index among an international sample of monozygotic twins reared apart. Int J Obes Relat Metab Disord. 1996;20:501–506.
5. Yang J, Bakshi A, Zhu Z, et al. Genetic variance estimation with imputed variants finds negligible missing heritability for human height and body mass index. Nat Genet. 2015;47:1114–1120.
6. Locke AE, Kahali B, Berndt SI, et al. Genetic studies of body mass index yield new insights for obesity biology. Nature. 2015;518:197–206.
7. Akiyama M, Okada Y, Kanai M, et al. Genome-wide association study identifies 112 new loci for body mass index in the Japanese population. Nat Genet. 2017;49:1458–1467.
8. Cheng M, Mei B, Zhou Q, et al. Computational analyses of obesity associated loci generated by genome-wide association studies. PLoS One. 2018;13:e0199987. doi:10.1371/journal.pone.0199987
9. Hoffmann TJ, Choquet H, Yin J, et al. A large multiethnic genome-wide association study of adult body mass index identifies novel loci. Genetics. 2018;210:499–515.
10. Turcot V, Lu Y, Highland HM, et al. Protein-altering variants associated with body mass index implicate pathways that control energy intake and expenditure in obesity. Nat Genet. 2018;50:26–41.
11. Yengo L, Sidorenko J, Kemper KE, et al. Meta-analysis of genome-wide association studies for height and body mass index in ∼700000 individuals of European ancestry. Hum Mol Genet. 2018;27(20):3641–3649.
12. Graff M, Ngwa JS, Workalemahu T, et al. Genome-wide analysis of BMI in adolescents and young adults reveals additional insight into the effects of genetic loci over the life course. Hum Mol Genet. 2013;22:3597–3607. doi:10.1093/hmg/ddt205
13. Wei WH, Hemani G, Haley CS. Detecting epistasis in human complex traits. Nat Rev Genet. 2014;15:722–733. doi:10.1038/nrg3747
14. Young KL, Graff M, North KE, et al. Influence of SNP*SNP interaction on BMI in European American adolescents: findings from the National Longitudinal Study of adolescent health. Pediatr Obes. 2016;11:95–101. doi:10.1111/ijpo.12026
15. Muller YL, Hanson RL, Piaggi P, et al. Assessing the role of 98 established loci for BMI in American Indians. Obesity. 2019;27:845–854. doi:10.1002/oby.22433
16. Nadeau JH, Auwerx J. The virtuous cycle of human genetics and mouse models in drug discovery. Nat Rev Drug Discov. 2019;18:255–272. doi:10.1038/s41573-018-0009-9
17. Kitsios GD, Tangri N, Castaldi PJ, et al. Laboratory mouse models for the human genome-wide associations. PLoS One. 2010;5(11):e13782. doi:10.1371/journal.pone.0013782
18. Brommage R, Powell DR, Vogel P. Predicting human disease mutations and identifying drug targets from mouse gene knockout phenotyping Campaigns. Dis Model Mech. 2019;12:dmm038224. doi:10.1242/dmm.038224
19. Fielitz J, Kim MS, Shelton JM, et al. Requirement of protein kinase D1 for pathological cardiac remodeling. Proc Natl Acad Sci U S A. 2008;105:3059–3063. doi:10.1073/pnas.0712265105
20. Matthews SA, Navarro MN, Sinclair LV, et al. Unique functions for protein kinase D1 and protein kinase D2 in mammalian cells. Biochem J. 2010;432:153–163. doi:10.1042/BJ20101188
21. Brooks WS, Helton ES, Banerjee S, et al. G2E3 is a dual function ubiquitin ligase required for early embryonic development. J Biol Chem. 2008;283:22304–22315. doi:10.1074/jbc.M803238200
22. Zambrowicz BP, Sands AT. Knockouts model the 100 best-selling drugs–will they model the next 100? Nat Rev Drug Discov. 2003;2:38–51.
23. Zambrowicz BP, Turner CA, Sands AT. Predicting drug efficacy: knockouts model pipeline drugs of the pharmaceutical industry. Curr Opin Pharmacol. 2003;33:563–570.
24. Zambrowicz BP, Friedrich GA, Buxton EC, et al. Disruption and sequence identification of 2000 genes in mouse embryonic stem cells. Nature. 1998;392:608–611.
25. Walke DW, Han C, Shaw J, et al. In vivo drug target discovery: identifying the best targets from the genome. Curr Opin Biotechnol. 2001;12:626–631.
26. Zambrowicz BP, Abuin A, Ramirez-Solis R, et al. Wnk1 kinase deficiency lowers blood pressure in mice: a gene-trap screen to identify potential targets for therapeutic intervention. Proc Natl Acad Sci U S A. 2003;100:14109–14114.
27. Beltrandelrio H, Kern F, Lanthorn T, et al. Saturation screening of the druggable mammalian genome. In: Carroll PM, Fitzgerald K, editors. Model Organisms in Drug Discovery. Chichester: Wiley & Sons; 2003:251–278.
28. Brommage R, Desai U, Revelli JP, et al. High-throughput screening of mouse knockout lines identifies true lean and obese phenotypes. Obesity. 2008;16:2362–2367.
29. Brommage R, Liu J, Hansen GM, et al. High-throughput screening of mouse gene knockouts identifies established and novel skeletal phenotypes. Bone Res. 2014;2:14034.
30. Donoviel DB, Freed DD, Vogel OH, et al. Proteinuria and perinatal lethality in mice lacking NEPH1, a novel protein with homology to NEPHRIN. Mol Cell Biol. 2001;21:4829–4836.
31. Powell DR, DaCosta CM, Gay J, et al. Improved glycemic control in mice lacking Sglt1 and Sglt2. Am J Physiol Endocrinol Metab. 2013;304:E117–E130.
32. Wattler S, Kelly M, Nehls M. Construction of gene targeting vectors from lambda KOS genomic libraries. Biotechniques. 1999;26:1150–1160.
33. Brommage R. Validation and calibration of DEXA body composition in mice. Am J Physiol Endocrinol Metab. 2003;285:E454–E459.
34. Revelli JP, Smith D, Allen J, et al. Profound obesity secondary to hyperphagia in mice lacking kinase suppressor of ras 2. Obesity. 2011;19:1010–1018.
35. Van Sligtenhorst I, Ding ZM, Shi ZZ, et al. Cardiomyopathy in alpha-kinase 3 (ALPK3)-deficient mice. Vet Pathol. 2012;49:131–141.
36. Huszar D, Lynch CA, Fairchild-Huntress V, et al. Disruption of the melanocortin-4 receptor results in obesity in mice. Cell. 1997;88:131–141.
37. Yeo GS, Farooqi IS, Aminian S, et al. A frameshift mutation in MC4R associated with dominantly inherited human obesity. Nat Genet. 1998;20:111–112.
38. Pearce LR, Atanassova N, Banton MC, et al. KSR2 mutations are associated with obesity, insulin resistance and impaired cellular fuel oxidation. Cell. 2013;155:765–777.
39. Sutton GM, Trevaskis JL, Hulver MW, et al. Diet-genotype interactions in the development of the obese, insulin-resistant phenotype of C57BL/6J mice lacking melanocortin-3 or −4 receptors. Endocrinology. 2006;147:2183–2196.
40. Wang Z, Li V, Chan GC, et al. Adult type 3 adenylyl cyclase-deficient mice are obese. PLoS One. 2009;4:e6979. doi:10.1371/journal.pone.0006979
41. Kernie SG, Liebl DJ, Parada LF. BDNF regulates eating behavior and locomotor activity in mice. EMBO J. 2000;19:1290–3000.
42. Xu B, Goulding EH, Zang K, et al. Brain-derived neurotrophic factor regulates energy balance downstream of melanocortin-4 receptor. Nat Neurosci. 2003;6:736–742.
43. Michaud JL, Boucher F, Melnyk A, et al. Sim1 haploinsufficiency causes hyperphagia, obesity and reduction of the paraventricular nucleus of the hypothalamus. Hum Mol Genet. 2001;10:1465–1473.
44. Fagerberg L, Hallström BM, Oksvold P, et al. Analysis of the human tissue-specific expression by genome-wide integration of transcriptomics and antibody-based proteomics. Mol Cell Proteomics. 2014;13:397–406. doi:10.1074/mcp.M113.035600
45. Yue F, Cheng Y, Breschi A, et al. A comparative encyclopedia of DNA elements in the mouse genome. Nature. 2014;515:355–364. doi:10.1038/nature13992
46. Komander D, Rape M. The ubiquitin code. Annu Rev Biochem. 2012;81:203–229. doi:10.1146/annurev-cellbio-100617-062802
47. Oh E, Akopian D, Rape M. Principles of ubiquitin-dependent signaling. Annu Rev Cell Dev Biol. 2018;34:137–162. doi:10.1146/annurev-cellbio-100617-062802
48. Weber J, Polo S, Maspero E, HECT E3 ligases: a tale with multiple facets. Front Physiol. 2019;10:370. doi:10.3389/fphys.2019.00370
49. Khan S, Ferdaoussi M, Bautista A, et al. A role for PKD1 in insulin secretion downstream of P2Y1 receptor activation in mouse and human islets. Physiol Rep. 2019;7:e14250. doi:10.14814/phy2.14250
50. Al Safar HS, Cordell HJ, Jafer O, et al. A genome-wide search for type 2 diabetes susceptibility genes in an extended Arab family. Ann Hum Genet. 2013;77:488–503. doi:10.1111/ahg.12036
51. Williams MJ, Almén MS, Fredriksson R, et al. What model organisms and interactomics can reveal about the genetics of human obesity. Cell Mol Life Sci. 2012;69:3819–3834. doi:10.1007/s00018-012-1022-5
52. Gallagher MD, Chen-Plotkin AS. The post-GWAS era: from association to function. Am J Hum Genet. 2018;102:717–730. doi:10.1016/j.ajhg.2018.04.002
53. Claussnitzer M, Dankel SN, Kim KH, et al. FTO obesity variant circuitry and adipocyte browning in humans. N Engl J Med. 2015;373:895–907. doi:10.1056/NEJMoa1502214
54. Cannon ME, Mohlke KL. Deciphering the emerging complexities of molecular mechanisms at GWAS loci. Am J Hum Genet. 2018;103:637–653. doi:10.1016/j.ajhg.2018.10.001
55. Coleman DL. Obese and diabetes: two mutant genes causing diabetes-obesity syndromes in mice. Diabetologia. 1978;14:141–148.
56. Montague CT, Farooqi IS, Whitehead JP, et al. Congenital leptin deficiency is associated with severe early-onset obesity in humans. Nature. 1997;387:903–908.
57. Clément K, Vaisse C, Lahlou N, et al. A mutation in the human leptin receptor gene causes obesity and pituitary dysfunction. Nature. 1998;392:398–401.
58. Yaswen L, Diehl N, Brennan MB, et al. Obesity in the mouse model of pro-opiomelanocortin deficiency responds to peripheral melanocortin. Nat Med. 1999;5:1066–1070.
59. Challis BG, Pritchard LE, Creemers JW, et al. A missense mutation disrupting a dibasic prohormone processing site in pro-opiomelanocortin (POMC) increases susceptibility to early-onset obesity through a novel molecular mechanism. Hum Mol Genet. 2002;11:1997–2004.
60. Duan C, Yang H, White MF, et al. Disruption of the SH2-B gene causes age-dependent insulin resistance and glucose intolerance. Mol Cell Biol. 2004;24:7435–7443.
61. Doche ME, Bochukova EG, Su HW, et al. Human SH2B1 mutations are associated with maladaptive behaviors and obesity. J Clin Invest. 2012;122:4732–4736. doi:10.1172/JCI62696
62. Gray J, Yeo GS, Cox JJ, et al. Hyperphagia, severe obesity, impaired cognitive function, and hyperactivity associated with functional loss of one copy of the brain-derived neurotrophic factor (BDNF) gene. Diabetes. 2006;55:3366–3671.
63. Yeo GS, Hung CC, Rochford J, et al. A de novo mutation affecting human TrkB associated with severe obesity and developmental delay. Nat Neurosci. 2004;7:1187–1189.
64. Grarup N, Moltke I, Andersen MK, et al. Variants in ADCY3 increase risk of obesity and type 2 diabetes. Nat Genet. 2018;50:172–174. doi:10.1038/s41588-017-0022-7
65. Coleman DL, Eicher EM. Fat (fat) and tubby (tub): two autosomal recessive mutations causing obesity syndromes in the mouse. J Hered. 1990;81:424–427.
66. Alsters SI, Goldstone AP, Buxton JL, et al. Truncating homozygous mutation of Carboxypeptidase E (CPE) in a morbidly obese female with type 2 diabetes mellitus, intellectual disability and hypogonadotrophic hypogonadism. PLoS One. 2015;10:e0131417. doi:10.1371/journal.pone.0131417
67. Borman AD, Pearce LR, Mackay DS, et al. A homozygous mutation in the TUB gene associated with retinal dystrophy and obesity. Hum Mutat. 2014;35:289–293. doi:10.1002/humu.22482
68. Picard F, Géhin M, Annicotte J, et al. SRC-1 and TIF2 control energy balance between white and brown adipose tissues. Cell. 2002;111:931–941.
69. Yang Y, van der Klaauw AA, Zhu L, et al. Steroid receptor coactivator-1 modulates the function of POMC neurons and energy homeostasis. Nat Commun. 2019;10:1718. doi:10.1038/s41467-019-08737-6
70. Butler AA, Kesterson RA, Khong K, et al. A unique metabolic syndrome causes obesity in the melanocortin-3 receptor-deficient mouse. Endocrinology. 2000;141:3518–3521.
71. Lee B, Koo J, Jun JY, et al. A mouse model for a partially inactive obesity-associated human MC3R variant. Nat Commun. 2016;7:10522. doi:10.1038/ncomms10522
72. Demidowich AP, Parikh VJ, Dedhia N, et al. Associations of the melanocortin 3 receptor C17A + G241A haplotype with body composition and inflammation in African-American adults. Ann Hum Genet. 2019. doi:10.1111/ahg.12315
73. Asai M, Ramachandrappa S, Joachim M, et al. Loss of function of the melanocortin 2 receptor accessory protein 2 is associated with mammalian obesity. Science. 2013;341:275–278. doi:10.1126/science.1233000
74. Holder JL
75. Zhu X, Zhou A, Dey A, et al. Disruption of PC1/3 expression in mice causes dwarfism and multiple neuroendocrine peptide processing defects. Proc Natl Acad Sci U S A. 2002;99:10293–10298.
76. Lloyd DJ, Bohan S, Gekakis N. Obesity, hyperphagia and increased metabolic efficiency in Pc1 mutant mice. Hum Mol Genet. 2006;15:1884–1893.
77. Stijnen P, Brouwers B, Dirkx E, et al. Endoplasmic reticulum-associated degradation of the mouse PC1/3-N222D hypomorph and human PCSK1 mutations contributes to obesity. Int J Obes. 2016;40:973–981. doi:10.1038/ijo.2016.3
78. Muhsin NIA, Bentley L, Bai Y, et al. A novel mutation in the mouse Pcsk1 gene showing obesity and diabetes. Mamm Genome. 2020;31:17–29. doi:10.1007/s00335-020-09826-4
79. Jackson RS, Creemers JW, Ohagi S, et al. Obesity and impaired prohormone processing associated with mutations in the human prohormone convertase 1 gene. Nat Genet. 1997;16:303–306.
80. Speakman JR, Loos RJF, O’Rahilly S, et al. GWAS for BMI: a treasure trove of fundamental insights into the genetic basis of obesity. Int J Obes. 2018;42:1524–1531. doi:10.1038/s41366-018-0147-5
81. Iconomou M, Saunders DN. Systematic approaches to identify E3 ligase substrates. Biochem J. 2016;15(473):4083–4101.
 © 2020 The Author(s). This work is published and licensed by Dove Medical Press Limited. The full terms of this license are available at https://www.dovepress.com/terms.php and incorporate the Creative Commons Attribution - Non Commercial (unported, v3.0) License.
By accessing the work you hereby accept the Terms. Non-commercial uses of the work are permitted without any further permission from Dove Medical Press Limited, provided the work is properly attributed. For permission for commercial use of this work, please see paragraphs 4.2 and 5 of our Terms.
© 2020 The Author(s). This work is published and licensed by Dove Medical Press Limited. The full terms of this license are available at https://www.dovepress.com/terms.php and incorporate the Creative Commons Attribution - Non Commercial (unported, v3.0) License.
By accessing the work you hereby accept the Terms. Non-commercial uses of the work are permitted without any further permission from Dove Medical Press Limited, provided the work is properly attributed. For permission for commercial use of this work, please see paragraphs 4.2 and 5 of our Terms.