")
Back to Archived Journals » International Journal of Wine Research » Volume 12
Nutrient Balance and Fertilizer Use Efficiency in Swedish Vineyards
Authors Mårtensson A
Received 3 April 2020
Accepted for publication 5 June 2020
Published 20 July 2020 Volume 2020:12 Pages 17—21
DOI https://doi.org/10.2147/IJWR.S256529
Checked for plagiarism Yes
Review by Single anonymous peer review
Peer reviewer comments 3
Editor who approved publication: Dr Roger Pinder
Anna Mårtensson
Department of Soil and Environment, Swedish University of Agricultural Sciences, Uppsala, Sweden
Correspondence: Anna Mårtensson
Department of Soil and Environment, Swedish University of Agricultural Sciences, Box 7014, SE 750 07, Uppsala, Sweden
Tel +46 18 67 12 22
Fax +46 18 67 27 95
Email [email protected]
Abstract: The number of vineyards in Sweden is increasing, but vineyards may have a negative environmental impact, resulting in further eutrophication of surface waters. In this study, the nutrient balance was calculated for four vineyards in southern Sweden. Comparisons of the results with nutrient deficits/surpluses under comparable land uses (arable, pasture) revealed only minor surpluses from the vineyards. Therefore, current fertilization strategies for Swedish vineyards do not appear to raise environmental concerns concerning eutrophication risk.
Keywords: cold climate wine, eutrophication
Introduction
The Swedish environmental protection agency predicts that the future climate in Sweden, like the global climate, will become warmer over the coming decades.1 A longer and warmer growing season would provide better conditions for wine cultivation in Sweden. The number of vineyards is already growing, with around 80 registered wineries, half of which can be considered permanently established, and it is likely that the area under vines in Sweden will increase in the coming decades. With a larger area used for cultivation, it is important to determine the environmental impact, in particular, nutrient leaching from Swedish viticulture. Nutrients leach naturally from the soil, and losses of nutrients from agricultural soils to the Baltic Sea have been identified as contributor to the high-level eutrophication in that enclosed waterbody.2 Wine cultivation under Swedish conditions may add to this burden, as no fertilizer recommendations are available yet for Swedish growers. Consequently, they are largely forced to extrapolate from their own experiences and/or use the information on vine fertilization taken from the international literature, which is often not fully applicable to Swedish conditions due to differences in climate and soil characteristics.
Given the risk of the increasing land area under wine cultivation in Sweden contributing further to eutrophication, the aim of this study was to assess the potential risk of nutrient losses from Swedish vineyards.
Materials and Methods
Four Swedish vineyards (Blaxta, Ekesåkra, Flintevång, Sandskogen) were randomly selected from the register of existing growers.3 Data on vine management, fertilization, harvest, etc., during the study year were obtained through personal interviews, together with information on current main production, grape varieties grown, and vineyard age. All four vineyards were located on light sandy soils, with pH ranging between 6.5 and 7.0 and clay content ranging between 4% and 8%. Using the data obtained, a nutrient balance was calculated for each vineyard, considering inputs of nutrients through all fertilizers applied, nitrogen deposition through precipitation, and nitrogen fixation from legumes and outputs of nutrients through biomass production. Information on fertilizers applied was obtained directly from the vineyard managers. Nitrogen (N) deposition through precipitation varies between regions in Sweden and was estimated for the study vineyards using the program VERA, which can produce scenarios for different cropping systems.4 Nitrogen fixation by legumes was also estimated using the program VERA. To determine nutrient outputs with harvested grapes and crop residues, ie, cuttings, randomly collected grapes and cuttings from one representative vineyard were analyzed for total N content after dry combustion on an auto-analyzer (LECO CNS 2000), and for total phosphorus (P) content and total potassium (K) content by inductively coupled plasma emission spectrometry (ICPES) (Perkin Elmer Optima 3000), after dissolution in concentrated HNO3.
Results
The four vineyards ranged in age from 5 to 10 years, and differed in their management, fertilization regime, and biomass yield (Table 1). In terms of estimated N inputs, taking into account all three sources, Sandskogen received the most N (32.6 kg ha−1 year−1) and Blaxta the least (4.7 kg ha−1 year−1, solely from deposition), while the other two vineyards were intermediate (22 and 25 kg ha−1 year−1) (Table 2).
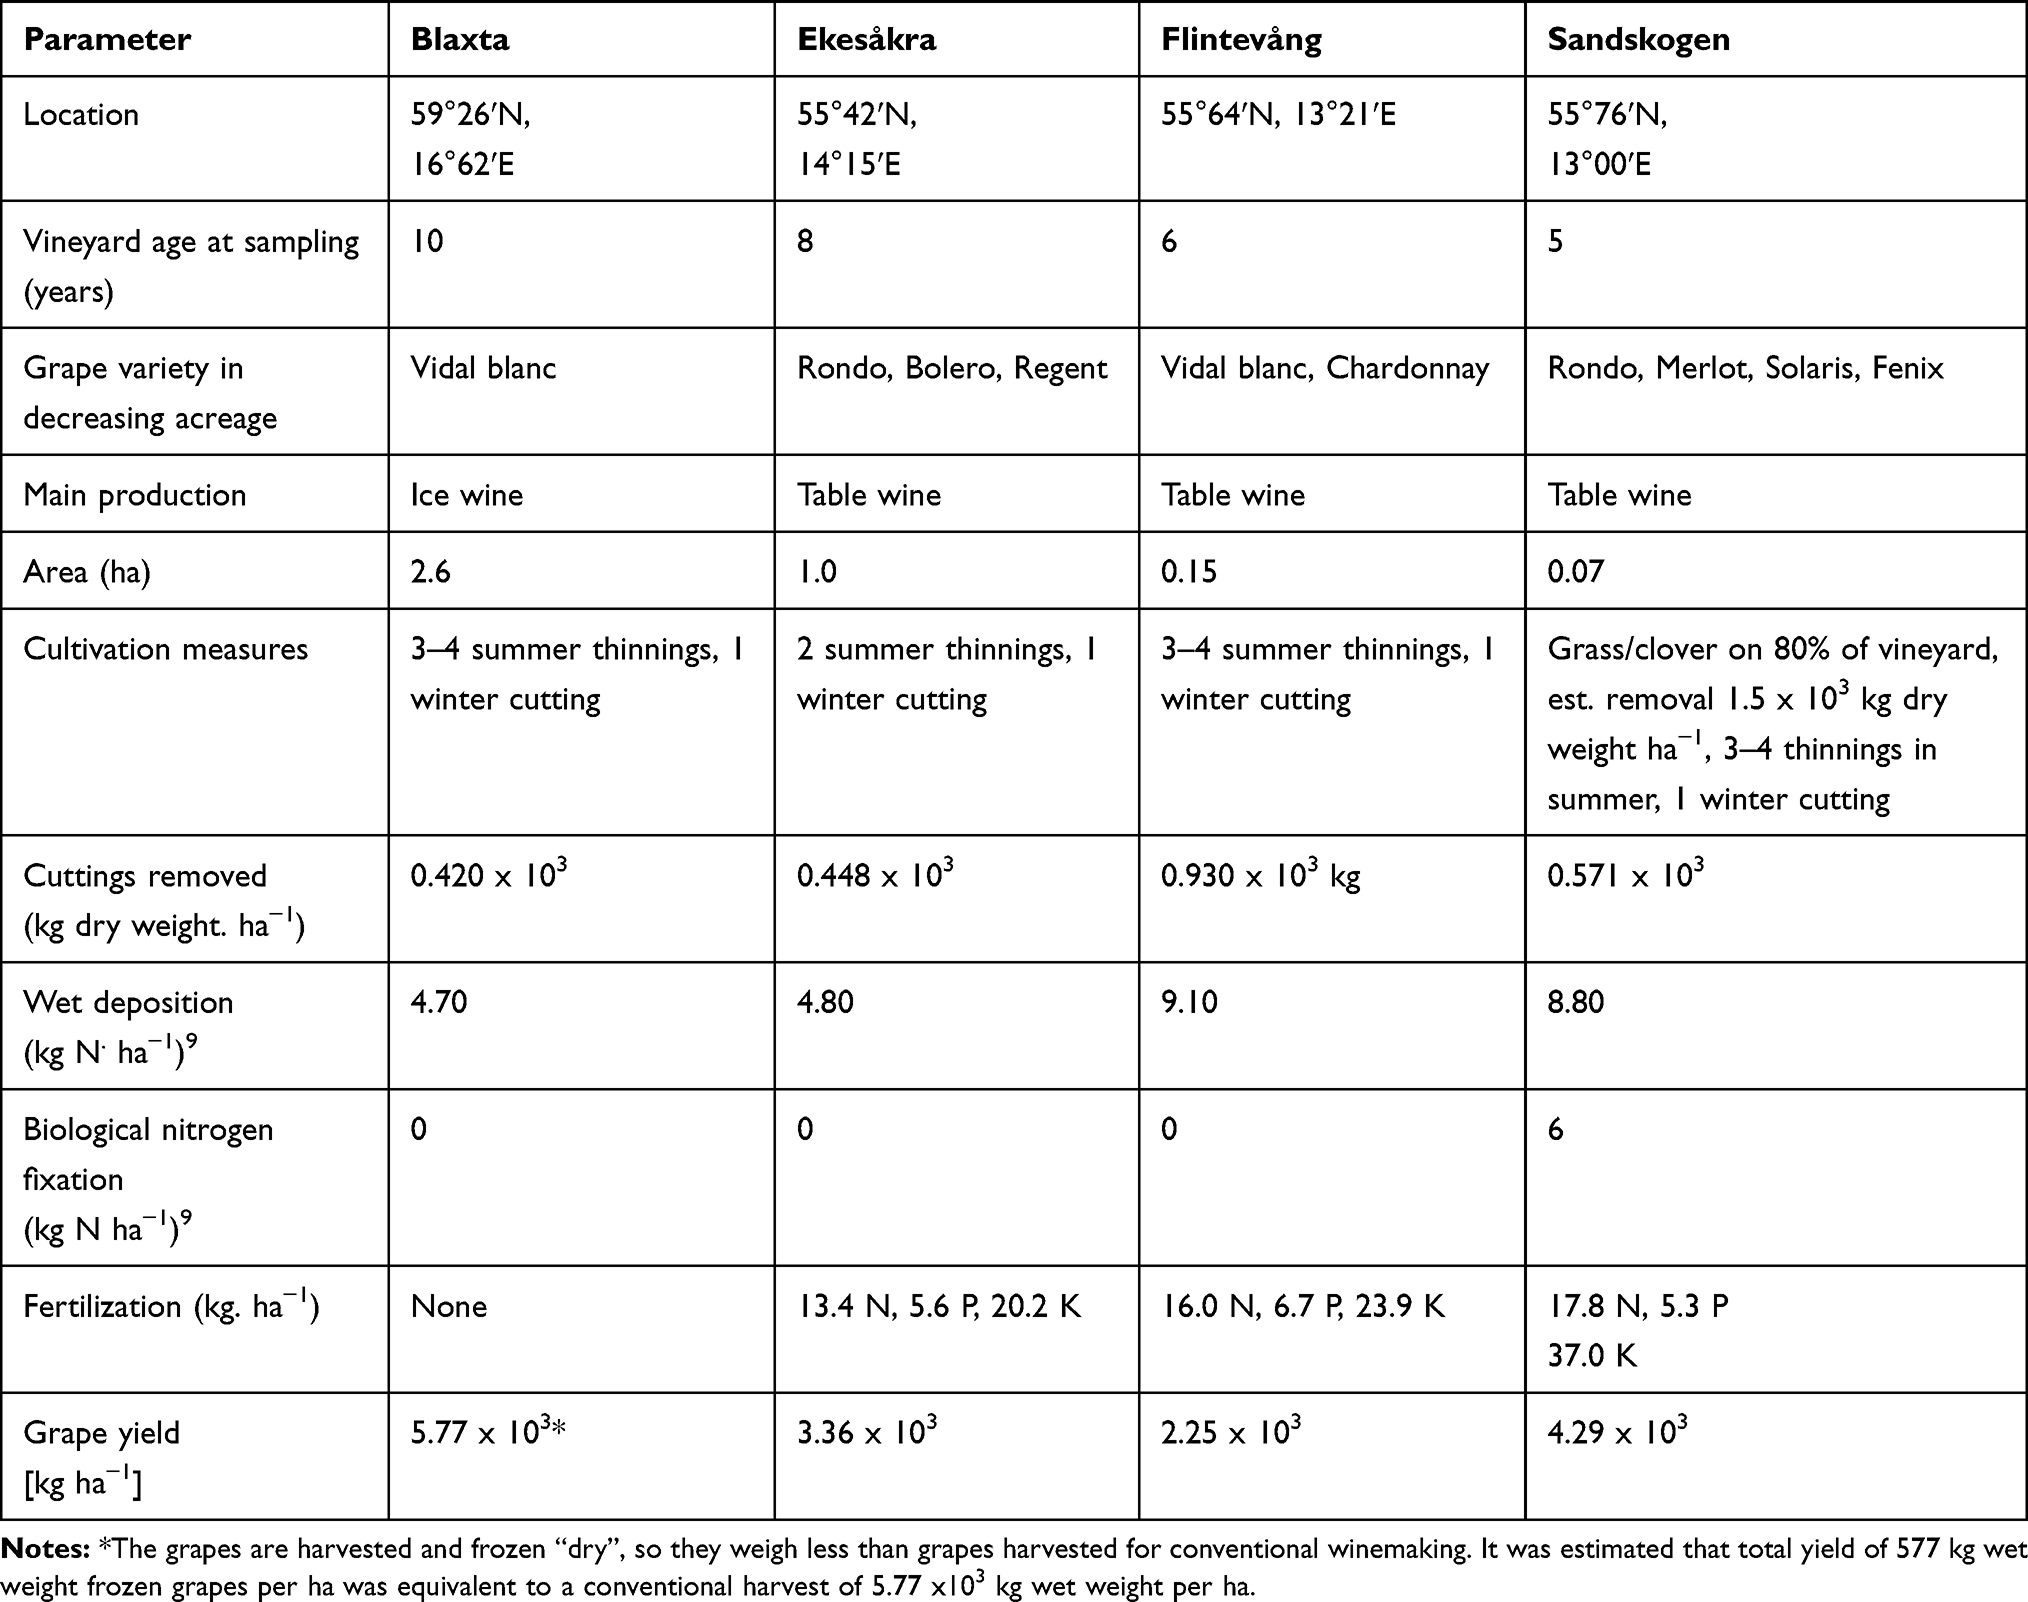 |
Table 1 Location, Age, Grape Varieties Grown, Cultivation and Fertilization Practices, and Biomass Yield on the Four Randomly Selected Swedish Vineyards (Blaxta, Ekesåkra, Flintevång, Sandskogen) Examined in This Study |
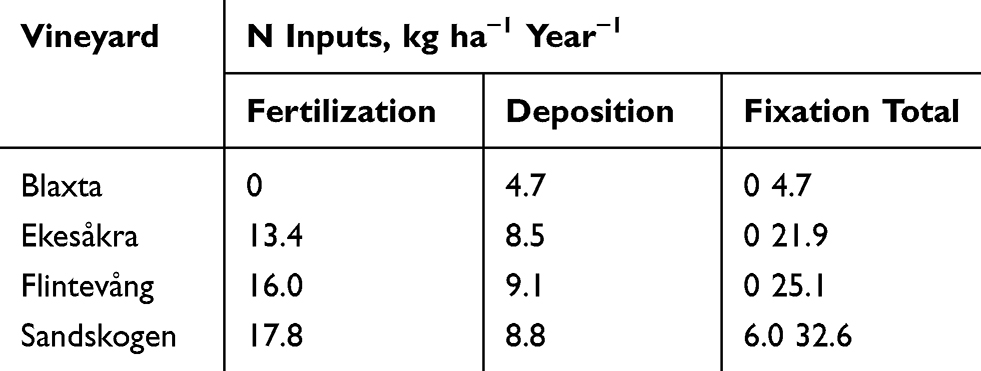 |
Table 2 Nitrogen Input Sources to the Four Swedish Vineyards Studied |
The analysis of plant fractions revealed that the N, P, and K content in grapes was 6.50, 1.40, and 12.0 mg kg−1 dry matter (DM), respectively, while that in cuttings was 45.4, 5.50, and 22.8 mg kg−1 DM, respectively. Biomass production (separated into grapes and cuttings) and overall plant nutrient inputs and output differed between the vineyards (Table 3). The highest combined biomass production (1516 kg DM ha−1 year−1) was obtained at Blaxta, which received the lowest N inputs. The lowest biomass production was observed at Flintevång (176 kg DM ha−1 year−1). Sandskogen, which received the largest amounts of N and also K, had the second-highest biomass production (1183 kg DM ha−1 year−1), while the level at Ekesåkra was 883 kg DM ha−1 year−1.
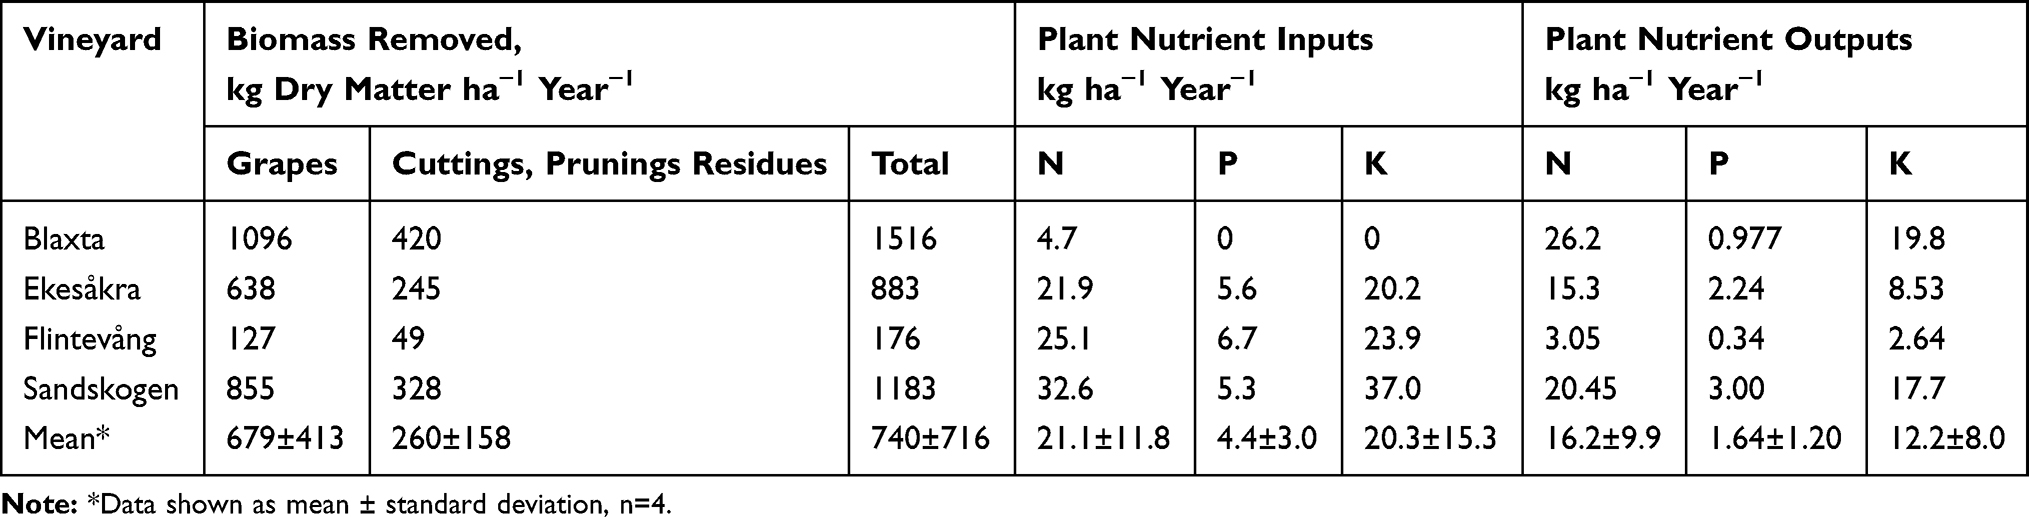 |
Table 3 Biomass Production and Plant Nutrient Inputs and Outputs for the Four Swedish Vineyards Studied |
As a result of these differences in inputs and outputs, the nutrient balance of the vineyards also differed (Table 4). All vineyards except Blaxta accumulated macronutrients (N, P, K) during the growing season. Flintevång had the highest excesses of all nutrients, with a surplus of 22 kg N, 6 kg P, and 21 kg K per hectare. In contrast, the Blaxta vineyard depleted the soil reserve of nutrients, with a nutrient deficit in all cases, and can be considered to have no negative impact in terms of eutrophication. Instead, grape production at Blaxta may suffer from K deficiency in future as the K available in soil, mainly locked up in K-containing clay minerals, will be depleted over time. Sandskogen vineyard had a similar excess of K (19.3 kg K ha−1) as estimated for Flintevång, but lower N and P surpluses (12.1 and 2.3 kg ha−1, respectively). Ekesåkra had surpluses of 6.6 kg N, 3.4 kg P, and 11.7 kg K ha−1 (Table 4). From the calculated mean values the vineyards receiving fertilizer had surpluses of N, P, and K, but with large variations between vineyards. However, the dataset was too small to allow conclusions concerning a possible negative correlation between inputs of nutrients and yields to be drawn.
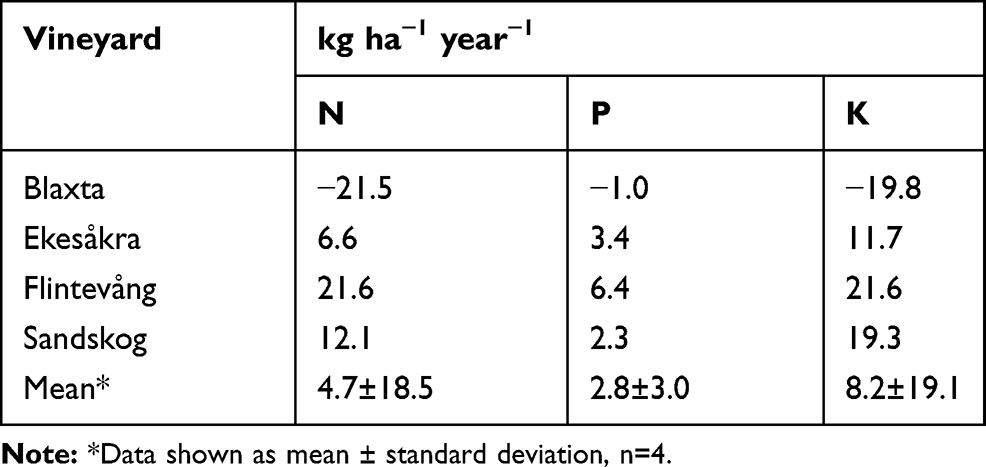 |
Table 4 Nutrient Balance for the Four Swedish Vineyards Studied |
Nutrient use efficiency on the four vineyards, calculated as percentage outputs minus inputs, is presented and compared with national values in Table 5. As can be seen from the table, nutrient use efficiency varied considerably between vineyards. The Blaxta vineyard had very high N use efficiency (560%) and Flintevång had a very low level (12%), while the other two vineyards had rates to the national average for N (~70%). Phosphorus use efficiency (not calculated for Blaxta) was again low for Flintevång (5%) and about half the national average (94%) at the other two vineyards. Potassium use efficiency was 11% at Flintevång and around 45% at the other two vineyards (no national figures available).
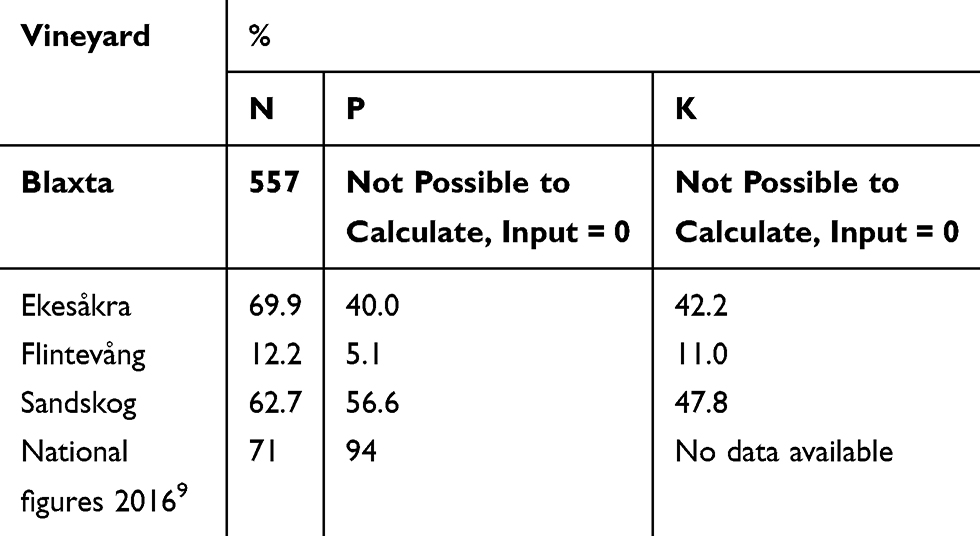 |
Table 5 Nutrient Use Efficiency [%] of the Four Swedish Vineyards Studied |
Discussion
Knowledge of wine growing in the Nordic conditions is currently limited, so the results presented in this study provide important new insights. For example, the presented analytical results on the nutrient contents of cultivated grapes and cuttings under Swedish conditions are novel information (Table 2). However, the nutrient levels in vine biomass fractions can be expected to vary considerably depending on the phenological stage and variety of grapes grown.5 Studies in Brazil by6 showed that the N content of leaves and branches dropped by 19% and 23%, respectively, from flowering to maturity, while the P content decreased by 74% in the leaves and 41% in the branches, and the K content declined by 21% and 56%, respectively. Another study analyzing the nutrient content of different plant parts of pinot noir grapes in Oregon, USA, found that the N content of stems, petioles, leaves, and grapes varied between 4 and 37 g per kg DM during the growing season, with higher values in the beginning of the season and then a decline.7 The P content was lower in that study, fluctuating between 0.5 and 4.5 g per kg DM during the season, but followed a similar pattern to N content, with higher values at the beginning of the season followed by a decline.7 The K content ranged between 5 and 27 g per kg DM, but that in leaves increased until harvest, and then fell sharply, while the K content in petioles, stems, and grapes declined throughout the growing season, although not as sharply as the N and P content.7 These studies demonstrate how difficult it can be to determine the nutrient content of different plant parts with accuracy.
A study in South Africa on Chenin blanc grapes estimated nutrient removal of 1.77 kg N, 0.37 kg P, and 0.88 kg K for a harvest of 1 x 10³ kg DM per ha.8 These values are of interest for comparison with the nutrient balances presented here for Swedish vineyards, where mean annual N, P, and K removal were 16, 1.6, and 12 kg ha, respectively (Table 3). However,8 studied a different grape variety and growing conditions in South Africa differs substantially from those in Sweden. It is likely that Swedish vines need more pruning and/or some more years of growth to achieve acceptable quality and quantity than those in warmer countries.
On average for the four vineyards, the nutrient balances showed a mean surplus of 5 kg N, 3 kg P, and 8 kg K ha−1 (Table 4). These figures can be compared with an N surplus of 22–35 kg ha−1 and a P deficit of 1–4 kg ha−1 reported for arable and pasture land in southern and central Sweden.9 Based on Table 4, little N is accumulating in the Swedish vineyards studied here, but P and K are accumulating to a greater extent. Further studies are needed on whether the excess nutrients added annually to vineyard soils are lost to the environment or translocated to perennial parts of the vine during the winter period.
Unlike nutrient balances for annual crops, one must take into account that the perennial parts of the vine can act as a sink for nutrients from season to season. Studies have also shown that a significant proportion of nutrient absorption by vines takes place after harvest.8,10–13 No such studies have yet been performed under Swedish conditions, but the period for post-harvest nutrient uptake in Sweden may be short due to rapidly decreasing temperature during the autumn.
As discussed, nutrient uptake by vines varies with time and plant development stage. In future studies in Sweden, vine plants should be dug up at different times during the growing season and the nutrient content of the different plant parts determined. This would provide a clearer picture of changes in nutrient content in different biomass fractions over time, how nutrients are translocated within the plant, and the absorption of new nutrients from the soil. One such study conducted over two growing periods in Oregon, USA, found that N uptake by the plant increased from bud break to a peak at veraison, and then fell.7 Nitrogen uptake by the foliage (canopy) exceeded the total uptake of the plant during the period from bud break to veraison, suggesting some redistribution of N from other plant parts.7 Other studies have also reported that most N uptake occurs between flowering and veraison.14,15
The maximum permissible acreage of vineyards in Sweden under European Union legislation is 100 ha. If the values obtained in this study are representative for all Swedish vineyards, their impact would be negligible in terms of nutrient loads on the national level even if all 100 ha were used for viticulture, compared with nutrient losses from the 2.8 million ha of arable and pasture land in the country. Using the values from the vineyard which accumulated most nutrients (Flintevång) and multiplying those by the maximum 100 ha, there would be a total nutrient build-up of 2.2 x 10³ kg N, 0.6 x 10³ kg P, and 2.2 x 10³ kg K annually. National sales of fertilizers to the Swedish agriculture and horticulture sector are currently approximately 2 x10⁸ kg N, 2 x 10⁷ kg P, and 2 x 10⁷ kg K per annum, corresponding to an annual input per hectare of 77 kg N, 6 kg P, and 12 kg K. From this, it is obvious that the contribution of Swedish vineyards to eutrophication is minor from a national perspective.9
Conclusion
Concerns about the potential negative environmental impact of Swedish vineyards, which prompted the present study, can be largely ignored. Cultivation measures performed at the four Swedish vineyards studied gave at most an annual surplus of 22 kg N, 6.4 kg P, and 21 kg K per ha. This surplus was lower than that on Swedish arable and pasture land for N, but higher for P and K. Thus the risk of losses of P and K cannot be excluded. However, the limited acreage of Swedish vineyards (max. 100 ha) means that the environmental impact of any P and K losses will be minor. There were large variations between the different vineyards studied, with, eg, Blaxta (no fertilizer used) showing an annual N deficit of 21 kg ha−1 and Flintevång an annual N surplus of the same magnitude. Further uncertainty was added to the nutrient balance calculations by the large variations in nutrient concentrations in different plant plants throughout the year. To get a more precise picture of nutrient cycling in Swedish vineyards, these factors should be examined in detail in future studies.
Disclosure
The author reports no conflicts of interest in this work.
References
1. Naturvårdsverket. FN:sklimatpanel 2007: Syntesrapport. Stockholm: Naturvårdsverket;2007. (report 5763) ISBN: 978-91-620-5763-3, ISSN: 0282-7298.
2. Antikainen R, Haapanen R, Lemola R, Nousiainen JI, Rekolainen S. Nitrogen and phosphorus flows in the Finnish agricultural and forest sectors, 1910–2000. Water Air Poll. 2008;194(1–4):163–177. doi:10.1007/s11270-008-9705-0
3. Svenska vinodlare. 2020. http://www.svenskavinodlare.se/vingardar. Available from: https://www.scb.se/contentassets/6707adf4535a475aa8d44526ec390ecd/mi1004_2016a01_sm_mi40sm1801.pdf.
4. Greppa Näringen. 2020. Available from: https://adm.greppa.nu/vera.html.
5. Christensen P. Nutrient level comparisons of leaf petioles and blades in 26 grape cultivars over three years (1979 through 1981). Am J Enol Viticulture. 1984;35:124–133.
6. da Silva MAG, Pavan AS, Muniz TA, Tonin TA, Pelizer TT. Nutrient availability in the soil and its absorption, transport, and redistribution in vines. Commun Soil Sci Plant Anal. 2008;39(9–10):1507–1516. doi:10.1080/00103620802006628
7. Schreiner RP, Scagel CF, Baham J. Nutrient uptake and distribution in a mature ‘Pinot noir” vineyard. Hortscience. 2006;41(2):336–345. doi:10.21273/HORTSCI.41.2.336
8. Conradie WJ. Nutrient consumption by Chenin blanc grown in sand culture and seasonal changes in the chemical composition of leaf blades and petioles. South Afr J Enol Viticulture. 1981a;2:15–18.
9. Sveriges Officiella Statistik Statistiska Meddelanden 2016. MI 40 SM 1801. 2016. Available from: https://www.scb.se/contentassets/6707adf4535a475aa8d44526ec390ecd/mi1004_2016a01_sm_mi40sm1801.pdf.
10. Conradie WJ. Seasonal uptake of nutrients by Chenin Blanc in sand culture. I. Nitrogen. South Afr J Enol Viticulture. 1980;1:59–65.
11. Conradie WJ. Seasonal uptake of nutrients by Chenin blanc in sand culture: II. Phosphorus, potassium, calcium and magnesium. South Afr J Enol Viticulture. 1981b;2:7–13.
12. Havlin JL, Hardy DH, Gehl RJ, Spayd SE. Survey of nutrient status in vitis vinifera grapes in North Carolina. Commun Soil Plant Anal. 2012;43(1–2):299–314. doi:10.1080/00103624.2011.638600
13. Pradubsuk S, Davenport JR. Seasonal uptake and partitioning of macronutrients in mature ‘Concord’ grape. J Am Soc Horticultural Sci. 2010;135(5):474–483. doi:10.21273/JASHS.135.5.474
14. Araujo FJ, Williams LE. Dry mater and nitrogen partitioning and root growth of young field grown Thompson seedless grapevines. Vitis. 1988;27:21–32.
15. Hanson EJ, Howell GS. Nitrogen accumulation and fertilizer use efficiency by grapevines in short-season growing areas. Hortscience. 1995;30(3):504–507. doi:10.21273/HORTSCI.30.3.504
 © 2020 The Author(s). This work is published and licensed by Dove Medical Press Limited. The full terms of this license are available at https://www.dovepress.com/terms.php and incorporate the Creative Commons Attribution - Non Commercial (unported, v3.0) License.
By accessing the work you hereby accept the Terms. Non-commercial uses of the work are permitted without any further permission from Dove Medical Press Limited, provided the work is properly attributed. For permission for commercial use of this work, please see paragraphs 4.2 and 5 of our Terms.
© 2020 The Author(s). This work is published and licensed by Dove Medical Press Limited. The full terms of this license are available at https://www.dovepress.com/terms.php and incorporate the Creative Commons Attribution - Non Commercial (unported, v3.0) License.
By accessing the work you hereby accept the Terms. Non-commercial uses of the work are permitted without any further permission from Dove Medical Press Limited, provided the work is properly attributed. For permission for commercial use of this work, please see paragraphs 4.2 and 5 of our Terms.