Back to Journals » Journal of Inflammation Research » Volume 16
Nucleotide‐Binding Oligomerization Domain (NOD)-Like Receptor Subfamily C (NLRC) as a Prognostic Biomarker for Glioblastoma Multiforme Linked to Tumor Microenvironment: A Bioinformatics, Immunohistochemistry, and Machine Learning-Based Study
Authors Han S, Zhang Z, Ma W ![]() , Gao J, Li Y
, Gao J, Li Y ![]()
Received 19 November 2022
Accepted for publication 3 February 2023
Published 10 February 2023 Volume 2023:16 Pages 523—537
DOI https://doi.org/10.2147/JIR.S397305
Checked for plagiarism Yes
Review by Single anonymous peer review
Peer reviewer comments 3
Editor who approved publication: Professor Ning Quan
Shiyuan Han,1 Zimu Zhang,2 Wenbin Ma,1 Jun Gao,1 Yongning Li1,3
1Department of Neurosurgery, Chinese Academy of Medical Sciences and Peking Union Medical College, Peking Union Medical College Hospital (Dongdan Campus), Beijing, People’s Republic of China; 2Department of General Surgery, Chinese Academy of Medical Sciences and Peking Union Medical College, Peking Union Medical College Hospital (Dongdan Campus), Beijing, People’s Republic of China; 3Department of International Medical Service, Chinese Academy of Medical Sciences and Peking Union Medical College, Peking Union Medical College Hospital (Dongdan campus), Beijing, People’s Republic of China
Correspondence: Yongning Li, Department of Neurosurgery and Department of International Medical Service, Chinese Academy of Medical Sciences and Peking Union Medical College, Peking Union Medical College Hospital (Dongdan campus), No. 1 Shuaifuyuan Wangfujing Dongcheng District, Beijing, People’s Republic of China, Tel +86 13901074129, Fax +86 1069152530, Email [email protected]
Purpose: Glioblastoma multiforme (GBM) remains the deadliest primary brain tumor. We aimed to illuminate the role of nucleotide‐binding oligomerization domain (NOD)-like receptor subfamily C (NLRC) in GBM.
Patients and Methods: Based on public database data (mainly The Cancer Genome Atlas [TCGA]), we performed bioinformatics analysis to visually evaluate the role and mechanism of NLRCs in GBM. Then, we validated our findings in a glioma tissue microarray (TMA) by immunohistochemistry (IHC), and the prognostic value of NOD1 was assessed via random forest (RF) models.
Results: In GBM tissues, the expression of NLRC members was significantly increased, which was related to the low survival rate of GBM. Additionally, Cox regression analysis revealed that the expression of NOD1 (among NLRCs) served as an independent prognostic marker. A nomogram based on multivariate analysis proved the effective predictive performance of NOD1 in GBM. Enrichment analysis showed that high expression of NOD1 could regulate extracellular structure, cell adhesion, and immune response to promote tumor progression. Then, immune infiltration analysis showed that NOD1 overexpression correlated with an enhanced immune response. Then, in a glioma TMA, the results of IHC revealed that the increase in NOD1 expression indicated high recurrence and poor prognosis of human glioma. Furthermore, the expression level of NOD1 showed good prognostic value in the TMA cohort via RF.
Conclusion: The value of NOD1 as a biomarker for GBM was demonstrated. The possible mechanisms may lie in the regulatory role of NLRC-related pathways in the tumor microenvironment.
Keywords: glioblastoma multiforme, NLRC family, biomarker, tumor microenvironment, prognostic model, tissue microarray
Introduction
Glioblastoma multiforme (GBM), with an incidence rate of 3.19/100,000, is the most malignant primary brain tumor (Grade IV WHO Classification).1 The survival rate is only 4–5% in 5 years, even with standard multi-regimen treatment.2 Molecular biomarkers that correlate with the progression of GBM will facilitate an accurate diagnosis, the development of treatment targets, and improve prognosis. However, the molecular heterogeneity and complex microenvironment of GBM leads to challenges and conflicts in prognostic analysis and therapeutic efficacies of these biomarkers.2–4 For instance, although the IDH1 G105G SNP has been previously reported to harbor prognostic significance in an unspecific GBM cohort, a recent study revealed no significant impact of the IDH1 G105G SNP on patient outcome in an IDH-wildtype cohort.5 Furthermore, nontumoral cells, which comprise 30% of the glioma mass and tumor microenvironment, drastically impact tumor development and progression.4 Therefore, additional biomarkers that are associated with tumoral and nontumoral cells need to be identified to further understand the mechanism and improve the prognosis of GBM.
Nucleotide‐binding oligomerization domain (NOD)-like receptor subfamily C (NLRC, consisting of NLRX1, NOD1 [or NLRC1], NOD2 [or NLRC2], NLRC3, NLRC4, and NLRC5) is the second largest subfamily of the pattern-recognition receptor (PRR), which regulates innate immune responses against pathogens. Disruption of NLRC expression may induce an imbalance between proinflammatory and anti-inflammatory pathways.6 The NLRC family plays a multifaceted role in several cancers by modulating tumor immunity and the proliferative microenvironment.6,7 For example, upregulation of NOD1 in gastric cancer was reported to be correlated with a higher inflammatory environment, which plays a vital role in the development and progression of cancer.8 Activation of the NLRC4/inflammasome in macrophages resulted in tumor angiogenesis in breast cancer, wherein a poorer prognosis was associated with a higher level of NLRC4 mRNA transcription.9 However, in some cases, specific NLRCs show antitumor abilities and act as negative regulators of the proinflammatory pathways to confer immunosurveillance on tumor progression. For example, in contrast to the tumor progression role in breast cancer, reduced NLRC4 expression correlates with the progression of colorectal cancer (CRC), wherein an activated NLRC4/inflammasome participates in pathways that control the development and growth of inflammation-induced tumors.10,11 Moreover, overexpression of NOD1 and NOD2 reduces cell proliferation in breast cancer models via disruption of the NF-κB and MAPK signaling pathways.12,13 However, the potential role of the NLRC family in GBM has not been elucidated.
In the current study, via bioinformatics, immunohistochemistry, and machine learning analyses, we intended to synthetically analyze the therapeutic and prognostic value of NLRC (especially NOD1) expression in GBM at the transcriptional, messenger RNA (mRNA), and protein levels. Moreover, we shed some light on the potential mechanisms underlying NLRC activities in the GBM microenvironment to promote tumorigenesis and progression.
Materials and Methods
Patients
The current work was a retrospective study based on bioinformatics, immunohistochemistry, and machine learning. A tissue microarray (TMA) (HBraG159Su01) containing 159 primary human brain tumor tissues was purchased from Outdo Biotech (Shanghai, China). The Medical Ethics Committee of Peking Union Medical College Hospital approved this study (JS-2012).
Data Acquisition
We obtained and incorporated clinicopathological characteristics of tumor samples and unpaired normal samples from the Genotype-Tissue Expression Project (GTEx, 1152 normal brain tissues) and The Cancer Genome Atlas (TCGA, 168 tumor samples and 5 normal tissues). Further analyses were based on the transcripts per million reads converted from the level 3 high-throughput sequencing fragments per kilobase per million (HTSeq-FPKM) gene expression data. R (Version 3.6.3) was employed to perform the following data visualization and statistical process. Please refer to the Data Availability section for website links of all online platforms used in this study.
Identification of Differentially Expressed NLRCs
In the Oncomine database, NLRC (NOD1, NOD2, NLRC3, NLRC4, NLRC5, NLRX1) expression across cancers (p value < 0.05, fold change > 1.5, top 10% gene rank) was analyzed based on Student’s t-test.
The expression differences of the NLRC family in unpaired GBM and normal brain samples in the TCGA and GTEx were identified by the Wilcoxon rank sum test. The results were shown in the form of boxplots and a six-gene complex heatmap by the ComplexHeatmap (v.2.2.0) and ggplot2 (v.3.3.3) R packages.
Analysis of NLRC Alteration and Methylation
In the current study, the genetic alteration data of the NLRC family was screened from the cBioPortal platform based on Glioblastoma (TCGA, Cell 2013, 141 complete patients/samples) with mRNA expression z score ± 2.0 as the threshold. A visual summary of the different mechanisms of NLRC alteration was achieved under the “Oncoprint” tab. Correlations between genetic alterations and survival of GBM were analyzed under the tab of “Comparison/Survival”.
Using the MethSurv online platform, we analyzed the prognostic value of the NLRC methylation level in GBM based on gene islands (TCGA cancer datasets, GBM, March 2017).
Survival Analysis
Using the “Multiple Gene Analysis” module of GEPIA, we plotted survival plots concerning NLRC expression (group cutoff = median expression of each NLRC member) and survival rate in patients with GBM. The Kaplan–Meier method was used to construct survival curves, and the Log rank test was used to analyze the differences between survival curves.
To further determine the effects of NLRC expression on GBM, we performed multivariate Cox proportional hazard regression analysis to assess independent prognostic factors of overall survival using the survival package (v. 3.2–10). The forest plot via the ggplot2 package (v.3.3.3) was applied to visualize the results.
Then, a nomogram was established based on the optimal multivariate Cox regression analysis to predict the 1-, 2-, and 3-year OS probabilities of GBM patients via the RMS R package (v.6.2–0) and survival R package (v.3.2–10). The concordance index (C-index) was used to evaluate the predictive accuracies of the nomogram model using a bootstrap method with 1000 resamples.
Differentially Expressed Genes Analysis
The DESeq2 R package (v.1.26.0) was employed to indicate differentially expressed genes (DEGs) in GBM (p<0.05, absolute fold change >1.5). According to the median expression of NOD1 in tumor samples, patients from TCGA datasets were divided into low- and high-expression groups. ggplot2 (v.3.3.3) was used to visualize all DEGs in the form of a heatmap and volcano plot.
Gene Enrichment
The R Package of ClusterProfiler (V.3. 14.3) allows us to use the reference genome from the Molecular Characteristic Database Collection for gene ontology analysis (GO) and genome enrichment (GSEA) (false discovery rate < 0.25, p<0.05). The GO terms were divided into molecular function (MF), cell composition (CC), and biological process (BP). GSEA initially generated an ordered list on the classification of the DEGs and then elucidated the significant difference between high- and low-NOD1 groups with gene set permutations performed 1000 times for each analysis. For GSEA, we sequenced the enrichment pathways by standardized enrichment points (NES).
Protein Interactions
The protein‒protein interaction (PPI) network of DEGs was built by using the Search Tool for the Retrieval of Interacting Genes/Proteins (STRING) and then analyzed in Cytoscape (confidence score >0.4). First, the DEGs were imported into STRING. Subsequently, Cytoscape (v3.7.1) software was used to visualize the PPI network and analyze the significant modules and hub genes. The MCODE app in Cytoscape was used to check clustering modules (degree cutoff = 2, node score cutoff = 0.2, maximum depth = 100, and k-score = 2), while the cytoHubba plugin used a variety of topological algorithms to select hub genes (degree>10).
Immune Infiltration Analysis
We then used the Tumor IMmune Estimation Resource (TIMER) to further explore the links between NOD1 expression and immune invasion in GBM. ssGSEA (GSVA R Software Package [V.1. 34.0]) method was applied to compare the expression of 24 types of immune cells between the NOD1-high and NOD1-low groups and to calculate the association between NOD1 and the levels of these cells using the GSVA package (v.1.34.0).14 The Wilcoxon rank-sum test was used to compare differential expression of immune cells between the NOD1-high and NOD1-low groups. Spearman correlation analysis was used to evaluate the relationship between NOD1 expression and immune cells.
In addition, we used the R package of estimate (v.1.0.13) to examine the association between stromal and immune scores of GBM patients by comparing the score distributions with different NOD1 expression levels.
Immunohistochemistry
The TMA was dewaxed in xylene and rehydrated through gradient alcohol, incubated with a polyclonal rabbit antibody against Nod1 (bs-7085R, 1:500; Bioss Biotechnology, Beijing, China), and then stained with 3,3′-diaminobenzidine (DAB) and hematoxylin, followed by photographing under a microscope (Leica, Wetzlar, Germany). The weighted staining score obtained by multiplying the staining percentage (0% = 0, 1–25% = 1, 26–50% = 2, 51–75% = 3, 76–100% = 4) and intensity (negative = 0, weak = 1, medium = 2, strong = 3) resulted in 0 to 12 points.
Efficiency of the Prognostic Value of NOD1
A random forest (RF) model based on a stratified 3-fold cross-validation method was further established to assess the prognostic value of NOD1 within the TMA cohort. The receiver operating characteristic curves (ROC curves) and the area under the curves (AUCs) were calculated. The prognostic efficacy of the model was evaluated with average AUCs from cross-validation and corresponding ROC curves. We utilized Python (Version 3.9) to conduct machine learning analysis.
Results
Aberrant High NLRC Expression in GBM
According to Oncomine, NLRC expression levels were significantly high in several cancers. Furthermore, we found that the transcriptional levels of NOD1/2, NLRC5, and NLRX1 were significantly upregulated in GBM samples (all p < 0.05; Figure 1A). Based on the TCGA and GTEx databases, the mRNA expression levels of NOD1, NOD2, NLRC4, NLRC5 and NLRX1 in GBM tissues (all p < 0.001) were significantly higher than those in normal brain tissues (Figure 1B and C).
 |
Figure 1 NLRC expression in cancer. (A) According to Oncomine, Graph of the number of datasets showing statistically significant increase (red) or decrease (blue) of NLRC family mRNA expression in GBM samples and corresponding normal tissues. Heatmap (B) and Box plots (C) showing the relative expression level of NLRC family between GBM and normal samples in GTEx/TCGA. ***p < 0.001. Abbreviations: NS, not significant; GTEx, The Genotype-Tissue Expression Project; TCGA, The Cancer Genome Atlas. |
Analysis of NLRC Alteration, Methylation, and Their Associations with Prognosis in GBM
As shown in Figure 2A, we found that NOD1, NOD2, NLRC3, NLRC4, NLRC5, and NLRX1 were genetically altered in 9%, 7%, 4%, 6%, 6%, and 5% of the queried GBM samples, respectively. Overall, these genes were altered in 24.11% of 141 cases; among them, “mRNA low” was the most frequent alteration. For mutations, only variants of uncertain significance (VUS) were detected in NOD1 (2/141), NOD2 (2/141), NLRC4 (1/141), and NLRC5 (1/141) (Figure S1); their mRNA expression was not significantly influenced by these mutations (Figure S2). Furthermore, we found that the overall survival curves of patients in the unaltered NLRC group were significantly lower than those in the altered NLRC group. Figure 2B; (p=0.0308). These results indicated that low expression of NLRC correlated with favorable survival of GBM.
 |
Figure 2 Analysis of NLRC alteration, methylation, and their associations with prognosis in GBM. (A) Summary plot displaying alterations of NLRC family in 141 GBM patients/samples. (B) Altered NLRC significantly linked to poor prognosis. (C) The Product-limit Estimate survival of the promoter methylation of NLRC family. |
MethSurv showed the effects of the level of NLRC family methylation on prognosis in GBM, wherein higher methylation values of cg17946043 of NOD1 (p=0.035, HR=0.589, 955 CI=0.351–0.989), cg26963976 of NLRC5 (p=0.028, HR=0.555, 95% CI=0.318–0.969), and cg17231661 (p=0.026, HR=0.626, 95% CI=0.414–0.946) and cg17231661 (p=0.047, HR=0.656, 95% CI=0.431–0.998) of NLRX1 were correlated with longer OS (Figure 2C).
Prognostic Value of NLRC Expression in GBM
Disease-free survival (DFS) and overall survival (OS) curves are shown in Figure 3A and B, wherein survival of low NOD1 (OS, p=0. 0036; DFS p=0. 025), NOD2 (DFS, p=0. 0063), and NLRC4 (DFS, p=0. 025) group were significantly better than those of the low NOD1, NOD2, and NLRC4 groups. As shown in Figure 3C, multivariate Cox regression analysis confirmed that, among other NLRC members, NOD1 expression was significantly associated with GBM survival (95% confidence interval [95% CI] = 1.007–2.335, hazard ratio = 1. 534, p=0. 046). These results indicated that NOD1 expression was an independent potential prognostic biomarker for GBM. Thus, the following analyses focused on NOD1.
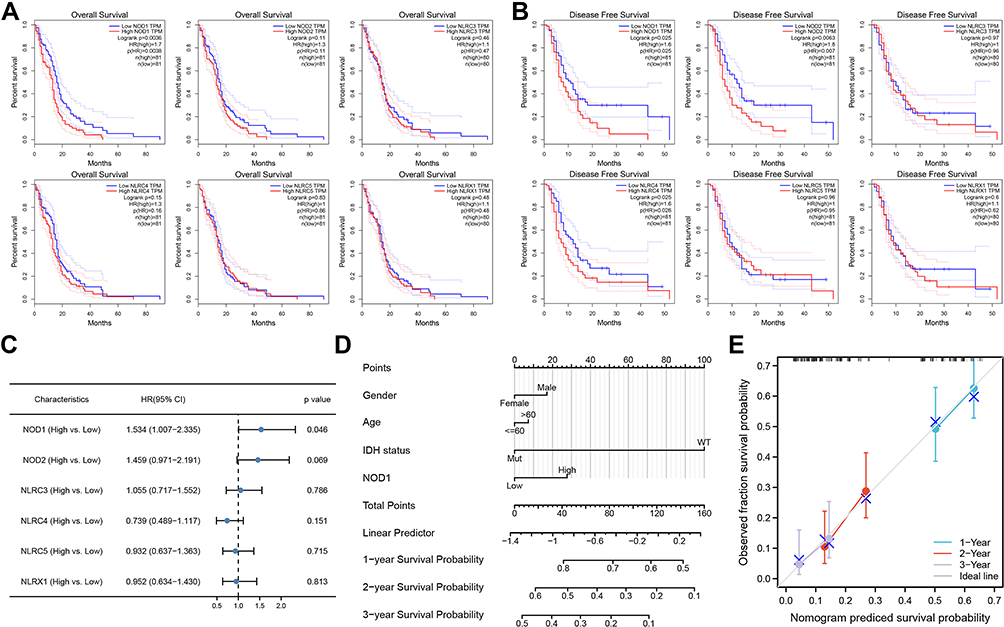 |
Figure 3 Influence of NLRC expression on GBM survival. (A) The DFS curves. (B) The OS curves. (C) Multivariate Cox analysis forest map summary. Nomogram (D) and calibration curve (E) were used to predict the probability of OS in GBM patients in 1, 2 and 3 years. Abbreviations: CI, confidence interval; DFS, disease-free survival; OS, overall survival. |
Prognostic Prediction Model Integrating NOD1 Expression and Clinicopathological Factors
Based on Cox analysis, a nomogram model that integrated NOD1 expression and other clinicopathological parameters was established to enable a quantitative prediction of the prognosis of GBM patients (Figure 3D). In the nomogram, higher points indicated a worse prognosis (probability of survival) in GBM. For instance, a 60-year-old (0 point) female (0 point) GBM patient with high NOD1 expression (27.5 points) and wild-type IDH status (100 points) received a total point score of 127.5. The probabilities of 1-, 2-, and 3-year survival of the patient were approximately 56%, 18%, and < 10%, respectively. The C-index value was 0.577 (0.529–0.585), and the calibration plots indicated a good prediction performance of the nomogram based on NOD1 expression (Figure 3E).
Identification of DEGs
The GBM cohort (168 samples) from the TCGA was grouped into two subgroups, one containing 84 NOD1-high-expression samples and the other containing 84 NOD1-low-expression controls (Table 1). Finally, 550 DEGs (Figure 4A) were identified, including 136 upregulated genes and 414 downregulated genes. Figure 4B shows the top 10 DEGs in the two groups.
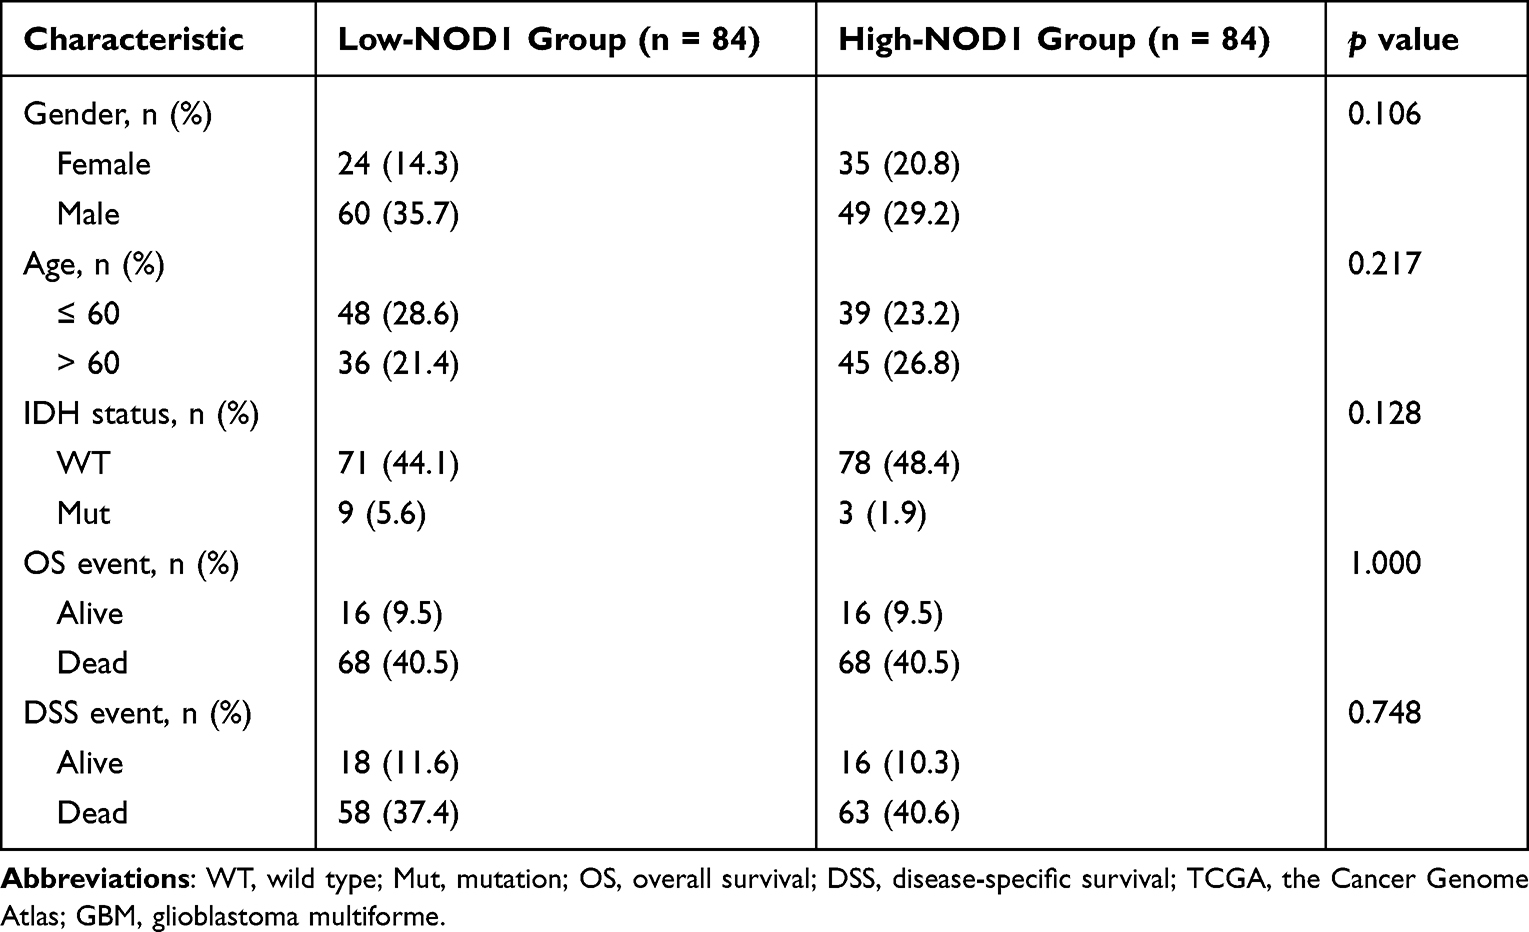 |
Table 1 Characteristics of NOD1-High and -Low GBM Samples from TCGA |
 |
Figure 4 Identification and enrichment analysis of DEG. (A) DEG volcano map. (B) Heat map showing the top 10 DEGs. (C) Bubble map showing NOD1-GO results of DEG in low and high expression samples. (D) GSEA analysis of DEGs between low and high expression groups of NOD1. Abbreviations: GO, gene ontology analysis; GSEA, gene set enrichment analysis; DEG, differentially expressed gene. |
Enrichment Analyses of NOD1 in GBM
According to GeneRatio, the bubble chart shows each of the five most significant MF, CC, and BP terms, including receptor‒ligand activity, collagen-containing extracellular matrix, leukocyte migration, etc. (Figure 4C; Table S1).
The differentially enriched NOD1-related pathways in GBM are shown in Figure 4D (Table S2). The low NOD1 expression group showed a significant negative association (p=0.020 for all) with the neuronal system (NES = −2.350), nonsense-mediated decay (NES = −2.193), response of EIF2AK4 (GCN2) to amino acid deficiency (NES = −2.236), and translation elongation (NES = −2.357). Furthermore, the high NOD1 expression group showed significant positive enrichment (p=0.020 for both) in MAPK activation (NES = 3.104) and in the complement cascade (NES = 3.074).
PPI Network Analysis of NOD1
Based on STRING analysis, a PPI network with 259 nodes (DEGs) along with 646 edges (interactions) was plotted (Figure 5A). The hub genes (Figure 5B, Table S3) were IL6, GRIN1, SNCB, CCK, OPALIN, HTR5A, KCNJ9, GABRA1, ATP2B3, and SLC17A7.
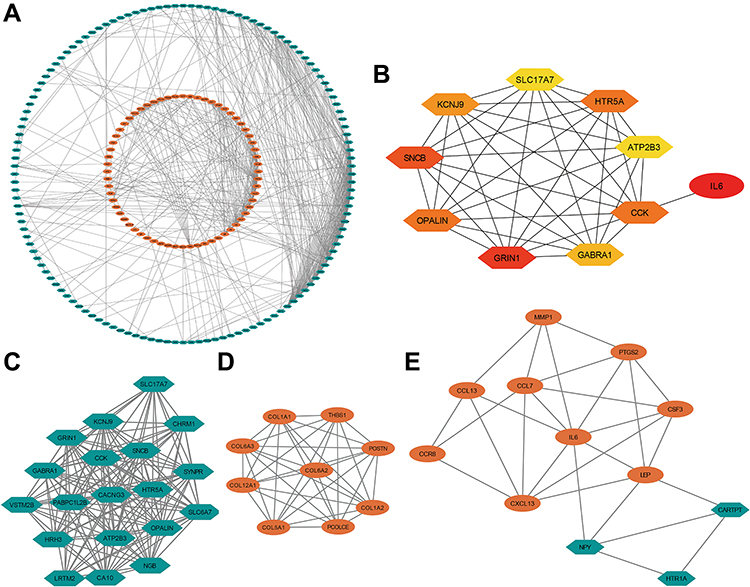 |
Figure 5 Protein interaction of NOD1 in GBM. (A) PPI network. (B) The 10 hub genes presented from low (yellow) to high (red) degree value. (C) Cluster 1 consisting of 19 downregulated DEGs and 148 interactions, MCODE score = 16.444. (D) Cluster 2 consisting of 9 upregulated DEGs and 36 interactions, MCODE score = 9. (E) Cluster 3 consisting of 12 DEGs and 28 interactions, MCODE score = 5.091. Orange represented up regulated genes and green represented downregulated genes. Abbreviations: PPI, protein–protein interaction; MCODE, molecular complex detection; DEG, differentially expressed gene. |
Then, three hub gene clusters (degree values ≥5.0) were extracted from the PPI network (Figure 5C–E). Notably, all hub DEGs except IL6 were found in Cluster 1. The gene with the highest degree value of 33, IL6, was enriched in Cluster 3 (Table S3).
Immune Infiltration Analysis of NOD1 Expression in GBM
TIMER showed (Figure 6A) that NOD1 expression was negatively linked to CD8+ T lymphocyte infiltration (Cor=−0.158, p=1.20e-3) and positively associated with dendritic cell (DC) and CD4+ T-cell infiltration (Cor=0.345, p=3.77e-13; Cor=0.158, p=1.23e-3, respectively). Moreover, the clinical outcome was evaluated with regard to the six immune cells (Table 2) and showed that the outcomes of GBM patients were statistically linked to NOD1 expression (p=0.047), DCs (p=0.020), and B lymphocytes (p=0.041).
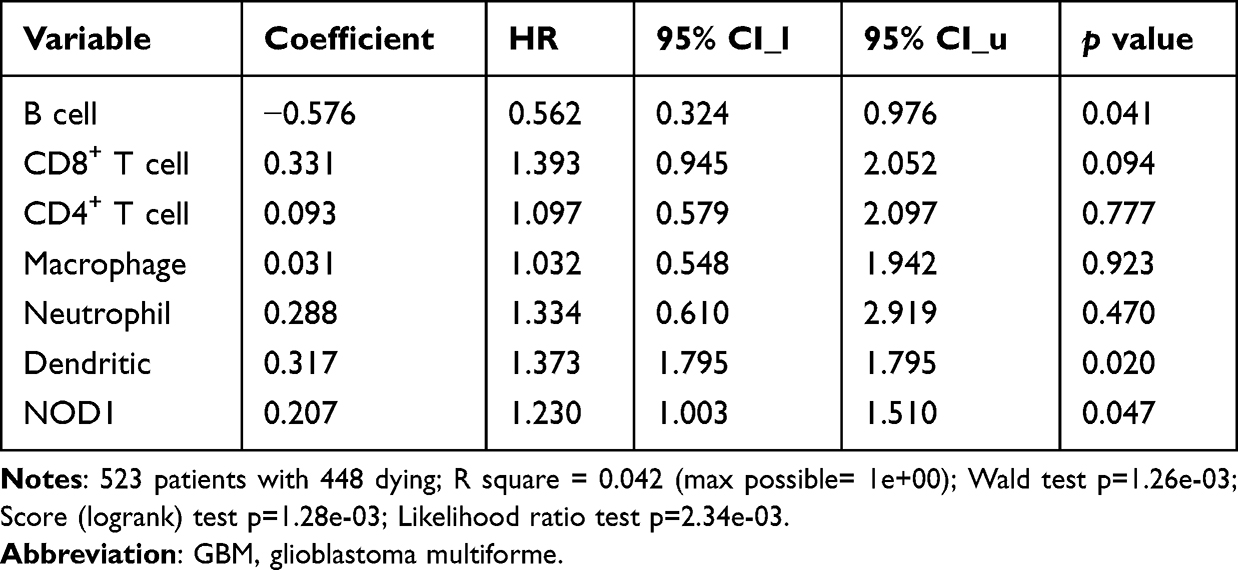 |
Table 2 COX Model of NOD1 and Six Immune Cells in GBM |
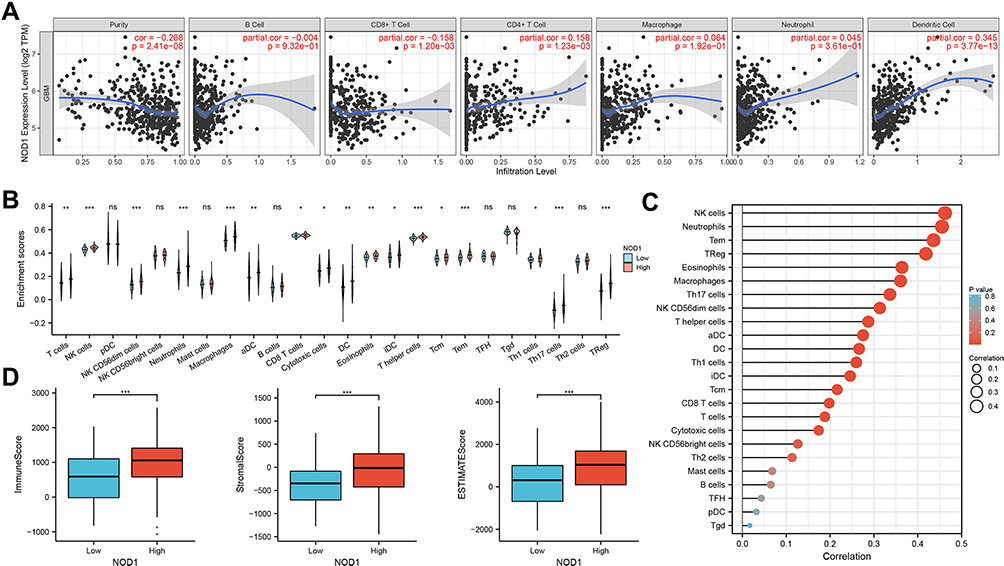 |
Figure 6 Immune analysis of NOD1 in GBM patients. (A) NOD1 expression was positively correlated with CD4 + T lymphocyte and dendritic cell concentration, and negatively correlated with CD8 + T lymphocyte infiltration. (B) Correlation between NOD1 expression and immune cells. (C) Correlation analysis between NOD1 expression and corresponding immune cells in GBM. (D) Distribution of the immune, stromal, and ESTIMATE scores among groups with high and low levels of NOD1 expression in TCGA. *p<0.05; **p<0.01; ***p<0.001. Abbreviations: TCGA, The Cancer Genome Atlas; DC, dendritic cell; aDC, activated DC; iDC, interdigitating DC; pDC, plasmacytoid DC; NK cell, natural killer cell; Tem, effector memory T cell; Tcm, central memory T cell; TFH, follicular helper T cell; TReg, regulatory T cell; Tgd, gammadelta T cell. |
Next, by ssGSEA, we investigated the relationship between immune infiltration and NOD1 expression in GBM. Compared with the low expression of NOD1, the high expression of NOD1 was linked to the high infiltration of 17 immune cells (Figure 6B). The correlation between the expression level of NOD1 and immune cells quantified was analyzed by Spearman correlation. The results unveiled a relatively positive relationship between NOD1 and innate immunocytes, including natural killer (NK) cells, neutrophils, memory effector T cells (Tem), and regulatory T cells (TReg) (coefficient 0.462, 0.455, 0.436, 0.419, respectively; p<0.001 for all; Figure 6C, Table S4). These results indicated that NOD1 expression significantly influenced the abundance of immune cells in the GBM microenvironment.
In addition, the association of stromal and immune scores with GBM patient pathologic characteristics was examined by comparing the score distributions with different expression levels of NOD1 (Figure 6D). As shown in Figure 6D, we found that the group with high NOD1 expression had significantly higher immune, stromal, and ESTIMATE scores than the group with low NOD1 expression (all p<0.001). How NOD1 correlates with the ratio of nontumoral cells and tumor purity will be discussed later.
TMA Specimens and Immunohistochemistry
To further validate our findings, we examined the expression of NOD1 by immunohistochemistry (IHC) in an independent cohort of glioma patients (158 samples included; Table S5). The expression of NOD1 protein in GBM samples was significantly higher than that in WHO I–III glioma samples (Figure 7A–C). The expression level of NOD1 was positively correlated with the WHO classification of glioma (p<0.001, Pearson’s R = 0.278; Figure S3). According to our ROC curve, the score of NOD1 had satisfactory diagnostic value; if the staining score was less than 8, it was judged as low expression, and if the staining score was 8–12, it indicated high expression (Figure 7D, AUC = 0.766, cutoff = 7). The survival curve indicated that the levels of NOD1 were significantly associated with patient overall survival (Figure 7E). These data revealed that high NOD1 predicted a poor prognosis in human glioma.
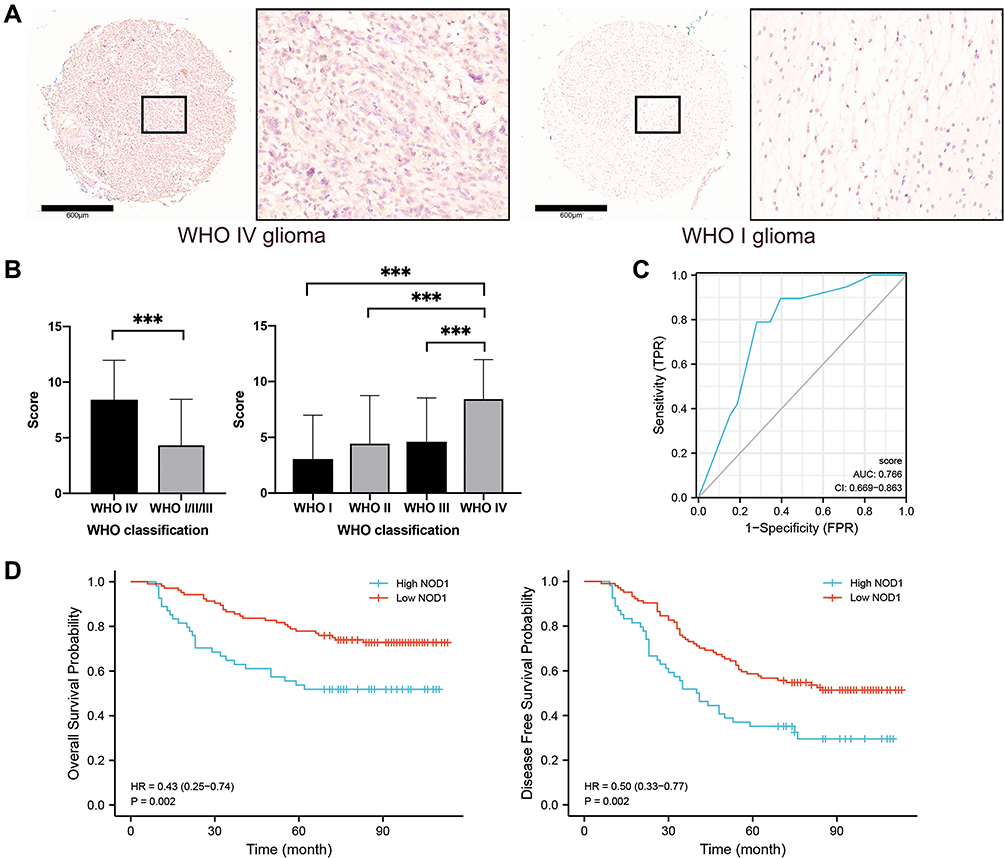 |
Figure 7 Immunohistochemical staining results of NOD1 in microarray cohort. (A) The immunohistochemical staining showing NOD1 expression were higher in WHO IV glioma tissues, compared to WHO I glioma tissues, bar=600μm. (B) Bar chart showing NOD1 expression score were significantly higher in WHO IV glioma tissues, compared to WHO I–III glioma tissues. (C) The ROC curve of microarray cohort. (D) Survival curve showing the high NOD1expression significantly related to the poor prognosis of glioma patients. ***p<0.001. |
Efficiency of the Prognostic Value of NOD1
The prognostic ability of the expression level (low, high; AUC of 0.83 by RF) and expression score (0–12; AUC of 0.84 by RF) combined with the WHO classification was better than the prognostic ability of the WHO classification alone (AUC of 0.82 by RF) for 5-year DFS (Figure 8A). For 5-year OS (Figure 8B), the prognostic ability of the expression level (low, high; AUC of 0.89 by RF) combined with the WHO classification was better than the prognostic ability of the WHO classification alone (AUC of 0.88 by RF). These results indicated that inclusion of the expression level of NOD1 will help to improve the prognostic efficacy of WHO classification alone, in line with the current tendency of narrowing molecular classification of gliomas.
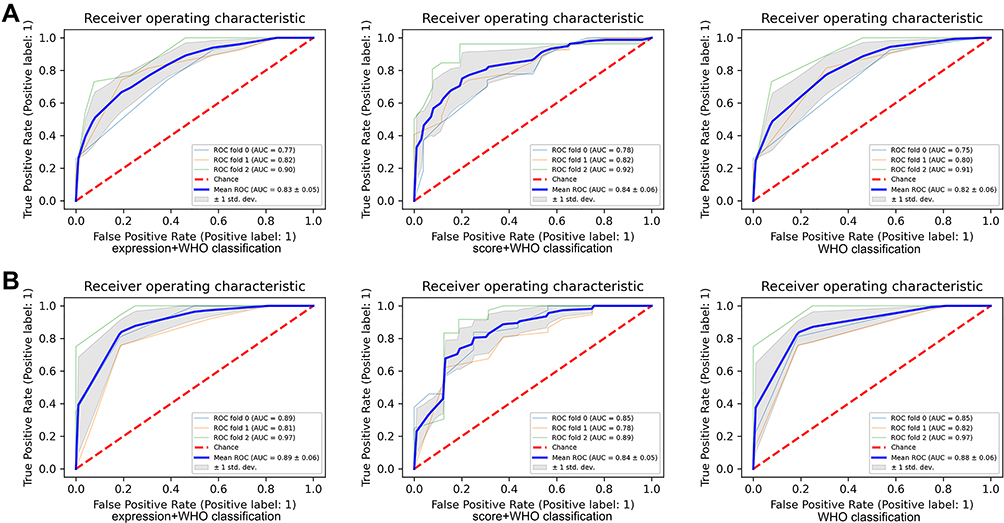 |
Figure 8 The prognostic value of NOD1 expression combining WHO classification in TMA cohort. (A) The ROC and AUC of NOD1 with WHO classification for 5-year DFS. (B) The ROC and AUC of NOD1 with WHO classification for 5-year OS. Abbreviations: TMA, tissue microarray; OS, overall survival; DFS, disease-free survival. |
Discussion
In this study, we revealed that members of the NLRC family were significantly upregulated in several cancers, including GBM. Furthermore, high expression of NOD1/2 and NLRC4 significantly correlated with worse survival in GBM. Our results revealed that NLRC alterations (the “mRNA low” was the most frequent genetic alteration) were associated with favorable OS. In addition, promoter hypermethylation, which leads to downregulation of NLRC expression, of NOD1, NLRC5, and NLRX1 predicted a favorable prognosis in GBM.15 Our results are in line with the finding that NLRC4/inflammasome overexpression may lead to poor survival in glioma, wherein high levels of NLRC4 in turn drive NF-κB and inflammasome activation.16 Moreover, Zong et al reported that downregulation of NLRC5 markedly suppressed the malignant bioactivities of glioma cells by weakening the Wnt/beta-catenin pathway.17 In addition to their role in activating NF-κB and MAPK signaling, it has been reported that a gain-of-function mutation of NLRC4 promotes spontaneous activation of Caspase-1 and increases the production of IL-1 and IL-18 in monocytes or macrophages, which can lead to several autoinflammatory diseases and cancers.9
The abovementioned findings suggest the role of the NLRC family as an oncogene in GBM. Furthermore, we found that among all members of the NLRC family, NOD1 was an independent prognostic marker for GBM. This provides the basis for further exploration of NOD1 as a potential biomarker for GBM. The tumor microenvironment, which comprises ostensibly normal cells (except heterogeneous cancer cells), including stromal and immune cells, is presumed to be genetically stable and less affected by tumor heterogeneity and has a crucial impact on GBM subtype, recurrence, drug resistance, and, subsequently, the survival of patients;18 it is acknowledged that these nontumoral cells drastically impact tumor development and progression.4 Thus, the most promising potential for a therapeutic breakthrough lies in pathways targeting the tumor microenvironment of GBM, since therapeutic regimens that target gliomagenesis pathways are inhibited due to the heterogeneity of the tumor.3 Moreover, we performed further analyses of the potential mechanisms to investigate the functions of NOD1 in the GBM microenvironment.
Our GO analysis showed that NOD1 potentially participates in tumor invasion and metastasis by modulating the extracellular structure, cell adhesion, and immune response.18 Of note, collagen, the most abundantly expressed extracellular matrix (ECM) protein in the cancer stroma, provides tissues with tensile strength and resistance against deformation, thereby enabling the ECM to store and present growth factors in a temporospatial order that is essentially required for tissue development and regeneration, which, in turn, facilitate invasion and metastasis.19 Furthermore, the enriched GSEA pathways of highly expressed NOD1 in GBM were linked to impaired neurological function, downregulation of the nonsense-mediated decay (NMD) pathway and amino acid-deficiency response, diminished translation elongation cycle, enhanced complement cascade, and upregulation of the MAPK pathway. Jiang et al indicated that NOD1 augmented CRC metastasis via the MAPK pathway.20 The NMD pathway activates the destruction of mRNAs of tumor suppressor genes (eg, p53), which are deemed to be linked to the oncogenesis of multiple cancers.21 Moreover, NOD1 was enriched in the decreased EIF2AK4 (GCN2) response, whose amino acid sensor potency in T cells is required for antitumor immunity in mouse models of glioma.22 Our findings are also aligned with clinical data that show a negative correlation between eEF2K expression, which slows the translation elongation rate, and prognosis in GBM patients.23 In addition, the complement system mainly contributes to the interaction between the adaptive and innate immune responses.24 The complement activation cascade is also correlated with worsening of clinical prognosis and tumor progression in grade II–IV glial tumors. Consistently, IDH-mutated GBMs manifest reduced complement activation and immune cell infiltration.25 Thus, therapies targeting NOD1 may protect patients against GBM progression and metastasis.
PPI network and key module analyses were performed, and all of the top 10 hub genes were encompassed in Clusters 1 and 3. IL6, a crucial protumorigenic cytokine in GBM, was the only upregulated hub gene among the top 10 hub genes. Notably, the mRNA expression of IL6 in GBM samples is significantly greater than that in lower grade gliomas.26 In breast and colorectal cancer patients, IL-6 impairs the ability of DCs to stimulate T lymphocytes (T lymphocytes can trigger the immune response and inflammatory cascade against tumors).27,28 In GBM, it is well established that the IL6/STAT3 pathway contributes to tumorigenesis, angiogenesis, invasion, and migration, which results in poor prognosis.26 Recently, Lamano et al discovered that in a murine model, inhibition of GBM-derived IL6 signaling was linked to decreased expression of programmed death ligand 1, diminished glioma growth, and better survival.29 OPALIN refers to the oligodendrocytic myelin paranodal and inner loop protein gene, which was found to be significantly correlated with the KPS score of elderly GBM patients.30 Moreover, downregulated GRIN1, KCNJ9, GABRA1, ATP2B3, and SLC17A7 in Module 1 were also enriched in the GSEA pathway terms that were associated with impaired neurological function; the low expression of the abovementioned genes highly correlated with worse OS in patients with low-grade glioma.31 In addition, D’Urso et al reported that downregulation of miR-155 expression restored GABRA1 expression, which makes GBM cells more vulnerable to GABRA1-mediated anti-proliferation signals.32
It is now evident that a negative prognostic influence of infiltrating immune cells, which facilitate glioma maintenance and progression, leads to poor clinical outcomes.33 Consistently, in the present study, NOD1 overexpression correlated with an enhanced immune response and increased infiltration by several types of immune cells. Tumor-associated microglia and macrophages, covering the largest proportion of infiltrating immune cells, are associated with more aggressive phenotypes of GBM.4 In contrast, NK cells recognize target cells and directly lyse tumor cells but cover the lowest part of all GBM immune infiltrations.34 The ESTIMATE algorithm revealed a positive link between stromal/immune infiltrations and NOD1 expression. Previous studies have shown that the ratio of stromal cells to immune cells is negatively correlated with tumor purity, and lower tumor purity is usually associated with lower survival rates, which confirms that overexpression of NOD1 is associated with a higher ESTIMATE score and lower survival outcome in this study.35,36 It is postulated that stromal and immune cells, whose increase in population reduces the purity of tumor cells, are responsible for angiogenesis and invasion.36 Xiong et al suggested that decreased tumor purity was associated with the enrichment of neural or mesenchymal molecular subtypes of GBM that generally correlate with malignant tumor progression.35 Similar findings were noted in gastric tumors, where NOD1 plays an oncogenic role.37
Finally, we validated our findings on the basis of the TMA cohort and found that inclusion of the expression level of NOD1 achieved better prognosis prediction of GBM, which meets the goal of narrowing molecular grading for tailored individual treatment. Additionally, with the assistance of highly confident and reliable artificial intelligence models, molecular grading can facilitate an accurate diagnosis, mechanism exploration, drug development, prognosis improvement, and outcome prediction.38–40
There exist some limitations in this study. First, the current study was a retrospective analysis. Second, the relationship between NLRC expression and GBM prognosis should have been further comprehensively analyzed; however, several clinical parameters, such as paired control samples from the same GBM patient, individual treatments, pathologic stages, long-term outcomes, and molecular subtypes, were not included due to data limitations of the databases and the unique nature of GBM. Finally, we validated our findings in a glioma TMA but not a specific GBM TMA. However, these data still revealed the oncogenic nature of NOD1 in GBM. Analysis of larger homogenous cohorts with efficient and reliable machine learning models is necessary.
Conclusion
We revealed that at the transcriptional, mRNA, and protein levels, high NOD1 was independently and significantly correlated with a low survival rate and high recurrence rate in GBM based on its regulatory role in the tumor microenvironment. Given the current limited understanding of GBM tumorigenesis and the apparent futility of GBM treatment strategies, our comprehensive investigation of NOD1 in GBM provides insight into the mechanisms of GBM promotion, thereby potentially increasing the number of selective and efficient therapeutic approaches for GBM and, possibly, for other malignancies.
Data Sharing Statement
TCGA is available at https://www.cancer.gov/about-nci/organization/ccg/research/structural-genomics/tcga. Oncomine is available at https://www.oncomine.org/resource/main.html. GEPIA is available at http://gepia.cancer-pku.cn/index.html. cBioPortal and MethSurv are available at https://www.cbioportal.org and https://biit.cs.ut.ee/methsurv/, respectively. STRING is available at database http://stringdb.org/. TIMER is available at http://cistrome.org/TIMER/. TMA data are available in Additional File, Table S5. The homepage of Outdo Biotech (Shanghai, China) is available at outdobiotech.com.
Acknowledgments
We thank our colleagues from our institution.
Funding
This study was supported by the Scientific Research Foundation of the State Human Resource Ministry and Education Ministry for returned Chinese scholars, China (A421200) for Yongning Li.
Disclosure
The authors report no conflicts of interest in this work.
References
1. Zhao HF, Wang J, Shao W, et al. Recent advances in the use of PI3K inhibitors for glioblastoma multiforme: current preclinical and clinical development. Mol Cancer. 2017;16(1):100.
2. Batash R, Asna N, Schaffer P, Francis N, Schaffer M. Glioblastoma multiforme, diagnosis and treatment; recent literature review. Curr Med Chem. 2017;24(27):3002–3009.
3. Muir M, Gopakumar S, Traylor J, Lee S, Rao G. Glioblastoma multiforme: novel therapeutic targets. Expert Opin Ther Targets. 2020;24(7):605–614.
4. Bianconi A, Aruta G, Rizzo F, et al. Systematic review on tumor microenvironment in glial neoplasm: from understanding pathogenesis to future therapeutic perspectives. Int J Mol Sci. 2022;23(8):54.
5. Saaid A, Monticelli M, Ricci AA, et al. Prognostic analysis of the IDH1 G105G (rs11554137) SNP in IDH-wildtype glioblastoma. Genes. 2022;13(8):25.
6. Velloso FJ, Trombetta-Lima M, Anschau V, Sogayar MC, Correa RG. NOD-like receptors: major players (and targets) in the interface between innate immunity and cancer. Biosci Rep. 2019;39(4):65.
7. Kong X, Yuan Z, Cheng J. The function of NOD-like receptors in central nervous system diseases. J Neurosci Res. 2017;95(8):1565–1573.
8. Castaño-Rodríguez N, Kaakoush NO, Mitchell HM. Pattern-recognition receptors and gastric cancer. Front Immunol. 2014;5:336.
9. Kay C, Wang R, Kirkby M, Man SM. Molecular mechanisms activating the NAIP-NLRC4 inflammasome: implications in infectious disease, autoinflammation, and cancer. Immunol Rev. 2020;297(1):67–82.
10. Liu R, Truax AD, Chen L, et al. Expression profile of innate immune receptors, NLRs and AIM2, in human colorectal cancer: correlation with cancer stages and inflammasome components. Oncotarget. 2015;6(32):33456–33469.
11. Hu B, Elinav E, Huber S, et al. Inflammation-induced tumorigenesis in the colon is regulated by caspase-1 and NLRC4. Proc Natl Acad Sci U S A. 2010;107(50):21635–21640.
12. Velloso FJ, Sogayar MC, Correa RG. Expression and in vitro assessment of tumorigenicity for NOD1 and NOD2 receptors in breast cancer cell lines. BMC Res Notes. 2018;11(1):222.
13. Velloso FJ, Campos AR, Sogayar MC, Correa RG. Proteome profiling of triple negative breast cancer cells overexpressing NOD1 and NOD2 receptors unveils molecular signatures of malignant cell proliferation. BMC Genom. 2019;20(1):152.
14. Bindea G, Mlecnik B, Tosolini M, et al. Spatiotemporal dynamics of intratumoral immune cells reveal the immune landscape in human cancer. Immunity. 2013;39(4):782–795.
15. Zhang X, Justice AC, Hu Y, et al. Epigenome-wide differential DNA methylation between HIV-infected and uninfected individuals. Epigenetics. 2016;11(10):750–760.
16. Lim J, Kim MJ, Park Y, et al. Upregulation of the NLRC4 inflammasome contributes to poor prognosis in glioma patients. Sci Rep. 2019;9(1):7895.
17. Zong Z, Song Y, Xue Y, et al. Knockdown of LncRNA SCAMP1 suppressed malignant biological behaviours of glioma cells via modulating miR-499a-5p/LMX1A/NLRC5 pathway. J Cell Mol Med. 2019;23(8):5048–5062.
18. Hanahan D, Weinberg RA. Hallmarks of cancer: the next generation. Cell. 2011;144(5):646–674.
19. Kai F, Drain AP, Weaver VM. The extracellular matrix modulates the metastatic journey. Dev Cell. 2019;49(3):332–346.
20. Jiang HY, Najmeh S, Martel G, et al. Activation of the pattern recognition receptor NOD1 augments colon cancer metastasis. Protein Cell. 2020;11(3):187–201.
21. Bidou L, Bugaud O, Belakhov V, Baasov T, Namy O. Characterization of new-generation aminoglycoside promoting premature termination codon readthrough in cancer cells. RNA Biol. 2017;14(3):378–388.
22. Rashidi A, Miska J, Lee-Chang C, et al. GCN2 is essential for CD8(+) T cell survival and function in murine models of malignant glioma. Cancer Immunol Immunother. 2020;69(1):81–94.
23. Leprivier G, Remke M, Rotblat B, et al. The eEF2 kinase confers resistance to nutrient deprivation by blocking translation elongation. Cell. 2013;153(5):1064–1079.
24. Mäkelä K, Helén P, Haapasalo H, Paavonen T. Complement activation in astrocytomas: deposition of C4d and patient outcome. BMC Cancer. 2012;12:565.
25. Petterson SA, Sørensen MD, Kristensen BW. Expression profiling of primary and recurrent glioblastomas reveals a reduced level of pentraxin 3 in recurrent glioblastomas. J Neuropathol Exp Neurol. 2020;79(9):975–985.
26. West AJ, Tsui V, Stylli SS, et al. The role of interleukin-6-STAT3 signalling in glioblastoma. Oncol Lett. 2018;16(4):4095–4104.
27. Ohno Y, Kitamura H, Takahashi N, et al. IL-6 down-regulates HLA class II expression and IL-12 production of human dendritic cells to impair activation of antigen-specific CD4(+) T cells. Cancer Immunol Immunother. 2016;65(2):193–204.
28. Yu S, Liu C, Su K, et al. Tumor exosomes inhibit differentiation of bone marrow dendritic cells. J Immunol. 2007;178(11):6867–6875.
29. Lamano JB, Lamano JB, Li YD, et al. Glioblastoma-derived IL6 induces immunosuppressive peripheral myeloid cell PD-L1 and promotes tumor growth. Clin Cancer Res. 2019;25(12):3643–3657.
30. Yang Y, Chu L, Zeng Z, et al. Four specific biomarkers associated with the progression of glioblastoma multiforme in older adults identified using weighted gene co-expression network analysis. Bioengineered. 2021;12(1):6643–6654.
31. Zhang B, Wu Q, Xu R, et al. The promising novel biomarkers and candidate small molecule drugs in lower-grade glioma: evidence from bioinformatics analysis of high-throughput data. J Cell Biochem. 2019;120(9):15106–15118.
32. D’Urso PI, D’Urso OF, Storelli C, et al. miR-155 is up-regulated in primary and secondary glioblastoma and promotes tumour growth by inhibiting GABA receptors. Int J Oncol. 2012;41(1):228–234.
33. Demaria O, Vivier E. Immuno-oncology beyond tils: unleashing TILCs. Cancer Cell. 2020;37(4):428–430.
34. Huang S, Song Z, Zhang T, et al. Identification of immune cell infiltration and immune-related genes in the tumor microenvironment of glioblastomas. Front Immunol. 2020;11:585034.
35. Xiong Y, Xiong Z, Cao H, Li C, Wanggou S, Li X. Multi-dimensional omics characterization in glioblastoma identifies the purity-associated pattern and prognostic gene signatures. Cancer Cell Int. 2020;20:37.
36. Schulze Heuling E, Knab F, Radke J, et al. Prognostic relevance of tumor purity and interaction with MGMT methylation in glioblastoma. Mol Cancer Res. 2017;15(5):532–540.
37. Wang H, Wu X, Chen Y. Stromal-immune score-based gene signature: a prognosis stratification tool in gastric cancer. Front Oncol. 2019;9:1212.
38. Lee K, Do T, Nguyen-Trinh T-D, Nguyen N, Hung T, Thi Thu Trang N. Identification of gene expression signatures for psoriasis classification using machine learning techniques. Med Omics. 2020;1:125.
39. Ho Thanh Lam L, Le NH, Van Tuan L, et al. Machine learning model for identifying antioxidant proteins using features calculated from primary sequences. Biology. 2020;9(10):542.
40. Vo TH, Nguyen NTK, Kha QH, Le NQK. On the road to explainable AI in drug-drug interactions prediction: a systematic review. Comput Struct Biotechnol J. 2022;20:2112–2123.
 © 2023 The Author(s). This work is published and licensed by Dove Medical Press Limited. The
full terms of this license are available at https://www.dovepress.com/terms
and incorporate the Creative Commons Attribution
- Non Commercial (unported, 3.0) License.
By accessing the work you hereby accept the Terms. Non-commercial uses of the work are permitted
without any further permission from Dove Medical Press Limited, provided the work is properly
attributed. For permission for commercial use of this work, please see paragraphs 4.2 and 5 of our Terms.
© 2023 The Author(s). This work is published and licensed by Dove Medical Press Limited. The
full terms of this license are available at https://www.dovepress.com/terms
and incorporate the Creative Commons Attribution
- Non Commercial (unported, 3.0) License.
By accessing the work you hereby accept the Terms. Non-commercial uses of the work are permitted
without any further permission from Dove Medical Press Limited, provided the work is properly
attributed. For permission for commercial use of this work, please see paragraphs 4.2 and 5 of our Terms.
Recommended articles
Prognostic Model and Tumor Immune Microenvironment Analysis of Complement-Related Genes in Gastric Cancer
Gu X, Shen H, Zhu G, Li X, Zhang Y, Zhang R, Su F, Wang Z
Journal of Inflammation Research 2023, 16:4697-4711
Published Date: 18 October 2023