Back to Journals » Cancer Management and Research » Volume 11
NSE from diffuse large B-cell lymphoma cells regulates macrophage polarization
Authors Zhu MY, Liu WJ, Wang H, Wang WD, Liu NW, Lu Y
Received 26 January 2019
Accepted for publication 20 April 2019
Published 17 May 2019 Volume 2019:11 Pages 4577—4595
DOI https://doi.org/10.2147/CMAR.S203010
Checked for plagiarism Yes
Review by Single anonymous peer review
Peer reviewer comments 2
Editor who approved publication: Professor Harikrishna Nakshatri
Meng-yuan Zhu,1–3,* Wen-jian Liu,1,2,* Hua Wang,1,2,* Wei-da Wang,1,2 Na-wei Liu,1,2 Yue Lu1,2
1State Key Laboratory of Oncology in South China, Collaborative Innovation Center for Cancer Medicine, Sun Yat-sen University Cancer Center, Guangzhou, Guangdong 510060, People’s Republic of China; 2Department of Hematological Oncology, Sun Yat-sen University Cancer Center, Guangzhou, Guangdong 510060, People’s Republic of China; 3Department of Oncology, The Seventh Affiliated Hospital, Sun Yat-sen University, Shenzhen, Guangdong, 518107, People’s Republic of China
*These authors contributed equally to this work
Background/aims: Diffuse large B-cell lymphoma (DLBCL) is a highly common type of malignant and heterogeneous non-Hodgkin’s lymphoma. Tumor-associated macrophages, specially the M2-type, promote tumor progression and drug resistance. The clinical outcome of patients with high neuron-specific enolase (NSE) expression is worse than that with low NSE expression. The tumor-promoting mechanism of NSE, however, remains unclear. This study explored the role of NSE in macrophage polarization associated with the immune microenvironment of DLBCL.
Results: Our results showed that NSE protein expression was higher in lymphoma cell lines than in the B lymphocytes. Functional studies demonstrated that upregulation of NSE in lymphoma cells could promote M2 polarization and migration ability of macrophage, thereby consequently promoting the progression of lymphoma in vitro and in vivo. Further mechanism studies revealed that lymphoma-derived exosomes could mediate NSE into macrophages, NSE enhanced nuclear p50 translocation with subsequent defective classical nuclear factor-κB activity in macrophages.
Conclusions: These results indicate that NSE may be a potential target for lymphoma therapy and a prognosis marker for lymphoma.
Keywords: neuron-specific enolase, diffuse large B-cell lymphoma, macrophage
Introduction
Diffuse large B-cell lymphoma (DLBCL) accounts for 30–40% of cases of highly aggressive and heterogeneous non-Hodgkins’ lymphoma.1 Patients with DLBCL who receive chemotherapy with rituximab exhibit a 5-year overall survival rate of 60–70%.2 Variations in the genetic and immune tumor microenvironment (TME) contribute to the heterogeneity of lymphoma. The TME plays an important role in the proliferation, angiogenesis, migration, and metastasis of tumors by promoting the secretion of growth factors, angiogenic factors, and adhesion molecules.3 Microenvironmental cells, such as stromal cells, mesenchymal stem cells, normal T cells, monocytes/macrophages, and follicular dendritic cells, form a specific intercellular network with cytokines and chemokines to promote tumor formation and proliferation.4
As one of the important microenvironmental cells, macrophages originate from mononuclear phagocytic cells and are characterized on the basis of two distinct polarization states: classical activation (M1) or alternative activation (M2). The responses of macrophages to lipopolysaccharide (LPS) agonists lead to M1 polarization, which is involved in type-I helper cell (Th1) response. Macrophages also respond to IL-4, resulting in the formation of M2 phenotypes that are involved in Th2-type responses. Macrophages exhibit plasticity for different types of responses: the proinflammatory M1 phenotype expresses IL-12, tumor necrosis factor α (TNF-α), and nitric oxide (NO), whereas the anti-inflammatory M2 phenotype expresses immunosuppressive compounds, such as IL-10, mannose receptor (CD206), and arginase 1 (Arg-1).4–6 Specifically, there are some differences in M1 and M2 macrophages between murine and human.7–9 For instance, NO and Arg-1 were only expressed in murine macrophages and 12-O-tetradecanoylphorbol-13-acetate (PMA)-induced THP-1 macrophages, but not expressed in primary human monocyte-derived macrophages.9–14 Recent studies showed that tumor-associated macrophages (TAMs), predominantly M2 phenotype, are involved in tumor initiation and progression and promote neoplastic transformation by releasing factors during chronic inflammation.1,15–18 TAMs are associated with the poor clinical outcome of patients with DLBCL even under rituximab treatment.19–21 Nevertheless, the mechanism involved in the interaction between lymphoma cells and macrophages in the TME remains unclear.
Neuron-specific enolase (NSE), also called enolase 2 (ENO2), is a member of the enolase family that is expressed in neuronal and neuroendocrine cells in mammals.22,23 Enolase is an essential enzyme that converts 2-phosphoglyceric acid into phosphoenolpyruvate, which is involved in glycolysis. Elevated levels of NSE were also found in lymphoma.24 Our group previously demonstrated that high serum and immunohistochemical (IHC) NSE levels are correlated with the poor prognosis of patients with DLBCL, particularly in patients with non-germinal center B cell-like lymphoma.25,26
Exosomes are extracellular vesicles with diameters of 30–150 nm and are secreted by intracellular lysosomal microparticles that are formed through the accumulation of multiple cysts. Exosomes act as mediators by transferring proteins and genetic contents between tumor and stromal cells.27,28 In cancer cells, exosomes play important roles in intercellular communication and promote the M2-like functional polarization of TAMs.29
However, the mechanism underlying the overexpression and biological characteristics of NSE in DLBCL remains unclear. In the present study, we investigated the association between DLBCL-excreted NSE and macrophage differentiation in the TME.
Materials and methods
Cell cultures and co-culture
This study was approved by the Institutional Review Board and the ethics committees of Sun Yat-sen University Cancer Center. Written informed consents were obtained from all healthy volunteers to obtain blood samples, in accordance with the Declaration of Helsinki. Lymphoma cell lines, namely, SU-DHL-2, SU-DHL-4, SU-DHL-6, OCI-LY1, OCI-LY3, RAJI, ROMAS, DB, and human monocyte cell THP-1 were obtained from the American Type Culture Collection (ATCC, Manassas, VA, USA). The cells lines were cultivated in RPMI1640 (Invitrogen, Waltham, MA, USA) suspension supplemented with 10% FBS (Invitrogen), 1% Pen–Strep at 37°C and 5% CO2.
Peripheral blood mononuclear cells (PBMCs) were isolated from blood samples of healthy donors (normal controls) in density gradient centrifugation method with Ficoll-Paque Premium (GE Healthcare). Monocytes were further purified from the PBMCs by magnetic-activated cell sorting according to manufacturer’s instructions (Miltenyi Biotec) resulting in a population of monocytes of approximately 95% purity. The purified B-cells were isolated from PBMCs with Easy Sep™ direct human B-cell isolation kit according to manufacturer’s instructions (Miltenyi Biotec). To generate naive macrophages (Mф), purified monocytes were grown in 6-well plate with RPMI 1640 containing 10% FBS, 1% Pen–Strep, and 50 ng/mL macrophage colony stimulating factor (M-CSF) (Peprotech), with the medium exchanged every second day, totally for 7 days. THP-1 cells were activated to form macrophages using 100 nmol/L PMA (Sigma–Aldrich, St Louis, MO, USA) for the first 24 hrs of culture; these cells were set as blank control groups. THP-1 or Mф cells (1×10⁵) in 1 mL of RPMI1640 were plated in transwell chambers (24 mm, 0.4 μm microporous; Corning Inc., Corning, NY, USA) filter in six-well plate. Lymphoma cells were cultured at the bottom of the six-well plate with 1 mL RPMI1640.
Lentiviral infection and screening of stable cell lines
High-titer lentiviral vector stocks were produced in HEK293T cells (ATCC) through the liposomal-mediated transfection of the modified transfer vector HBLV-CMVIE-ZsGreen-T2A-puro (GeenCopoeia) and the packaging vectors pSPAX2 (GeenCopoeia) and pMD2G (GeenCopoeia). Viral particles were harvested after 48 hrs of transfection, then filtered and concentrated through ultrafiltration. The titers of the viral preparations were determined by measuring the number of green fluorescence protein (GFP)-positive HEK293T cells after infection with several viral solutions accompanied by 8 mg/mL polybrene (Invitrogen). Lymphoma cells were infected with the viral solutions at a multiplicity of infection of 90. For transduction, virus-infected cells were centrifuged at 1,000× g for 90 mins, resuspended in fresh medium, and recultivated. Infectivity was determined after 72 hrs of cultivation through the fluorescence-activated cell sorting analysis of GFP-positive cells. All GFP-positive cells were screened using puromycin (2 µg/mL) (Sigma–Aldrich).
Transfection of NF-κB (p50) siRNA into THP-1 cells
The siRNA targeting nuclear factor-kappa B (NF-κB) p50 (NF-κB (p50) siRNA) and scrambled siRNA were purchased from Sigma–Aldrich. After treatment with 100 nmol/L PMA for 24 hrs, the medium was replaced and siRNA was added with Lipofectamine® 2000 (Invitrogen). After 6 hrs of incubation, the medium was replaced and THP-1 cells were plated in transwell chambers (24 mm, 0.4 μm microporous; Corning Inc.) filter in six-well plate, and lymphoma cells were cultured at the bottom of the six-well plate.
Exosome isolation and identification
Exosomes were isolated from the supernatant of DLBCL sublines 48 hrs after establishment of the culture. Briefly, collected culture supernatant was differentially centrifuged at 300, 1,200, and 10,000 g for 10, 20, and 30 mins, respectively, at 4°C. Subsequently, the supernatant was filtered (0.22 μM Millex GP) and ultracentrifuged at 100,000 g for 3 hrs at 4°C. After removing the supernatant, the exosomes pellets were washed in a large volume of ice-cold PBS and centrifuged at 100,000 g for another 3 hrs at 4°C and resuspended with sterile PBS.
Nanoparticle tracking analysis (NTA) is a method used to detect the size distribution and the relative concentration of exosomes. NTA measurements were performed with a NanoSight LM10 (NanoSight). Collected exosomes were suspended and then diluted at 1:100 in PBS before the analysis. NTA Version 2.3 (NanoSight) was used to capture and analyze data.
Exosomes pellets were dissolved in PBS buffer dropped in a carbon-coated copper grid and then stained with 2% sodium phosphotungstate. The samples were observed using a transmission electron microscope (TEM).
Exosome labeling and tracking
Exosomes were subjected to PKH-67 (Sigma–Aldrich) membrane staining and then incubated at 37°C for 20 mins. THP-1 cells were incubated with 10 μg/mL PKH-67-labeled exosomes for 4 hrs at 37°C. Following incubation, the cells were washed three times with PBS and fixed with 4% paraformaldehyde. Next, 0.1% of Triton X-100 was used to rupture cell membranes, and then cells were stained with 10 μg/mL of DAPI (Thermo Fisher Scientific, Waltham, MA, USA) and 10 μg/mL of phalloidin TRITC (Thermo Fisher Scientific) for 15 mins. After washing three times with PBS, images were finally obtained using an Olympus fluorescence confocal microscope (Olympus, Tokyo, Japan).
Extraction of protein and western blotting
Cells were lysed through cold radioimmunoprecipitation assay. The cell lysates were supplemented with proteinase inhibitor cocktail (Roche, Basel, Switzerland) and phosphatase inhibitor cocktails 2 and 3 (Sigma–Aldrich); then, cytoplasmic protein was obtained. Homogenate cells with Dounce homogenator, centrifuge at 1,800 g, 10 mins, discard supernatant, lysis the pellet with RIPA buffer, on ice, 30 mins, then centrifuge at 14,000 g, 15 mins, transfer the supernatant to a new Ep tube, then nuclear protein was obtained. Protein concentrations were normalized using Bradford protein assay (Bio-Rad, Hercules, CA, USA). Protein extracts were subjected to SDS-PAGE, transferred onto polyvinylidene fluoride membranes (Millipore, Billerica, MA, USA), and then blocked with 1× PBS buffer containing 0.1% Tween 20 and 5% (w/v) skimmed milk powder or 5% BSA. The protein extracts were then probed with primary antibodies and with an anti-rabbit or an anti-mouse secondary antibody, followed by enhanced chemiluminescence detection (Millipore). The expression levels of GAPDH and Lamin B1 were used as the loading controls for total protein and nuclear protein, respectively. The primary antibodies of anti-NSE, anti-p65, anti-p50, anti-CD206, anti-inhibitor kappa B kinase-beta (IKK-β), anti-Arg1, anti-Lamin B1, anti-GAPDH, anti-BCL-2, anti-BAX, anti-CD9, and anti-BAD were purchased from Cell Signaling Technology. Anti-mouse IgG and anti-rabbit IgG (Santa Cruz, Dallas, TX, USA) antibodies conjugated with horseradish peroxidase were used as the secondary antibodies.
Gel electrophoretic mobility shift assay (EMSA)
This test was followed by the EMSA kits instructions (Beyotime). Nuclear proteins were extracted, bound with the labeled probe, and incubated at room temperature (RT) for 30 mins. The p50 antibody was added to induce super shift, and the proteins were incubated again for an additional 30 mins. Polyacrylamide gel was run without any sample at 150 V for 30 mins with 0.5× TBE as the running buffer. Afterward, samples were run on polyacrylamide gel for ~2 hrs at 150 V. The gel was then transferred to a nylon membrane and then exposed.
Cell viability
Cell viability was detected using a Cell Counting Kit 8 (CCK8) (Dojindo). The cells were seeded into 96-well plates at a concentration of 2×10⁴ cells/well. Then, at 72 hrs of incubation, CCK8 reagent was added to each well at 10% of the total volume. The cells were then diluted with normal culture medium at 37°C after 1–2 hrs of incubation. The absorbance values of each well were measured using a microplate reader set at 450 nm. All experiments were performed thrice, and the average percentages of cells are shown as the results.
Transwell migration assay of THP-1
We used transwell chambers with a filter insert (8 μm pore; Corning Inc.) for the migration assays. 2×10⁴ PMA-stimulated THP-1 cells resuspended in 500 μL of serum-free RPMI1640 were placed in the upper chamber of each insert. Lymphoma cells with serum-free RPMI1640 were added to the lower chambers, and serum-free RPMI1640 without lymphoma cells was added to the blank control. After 24 hrs of incubation, THP-1 cells on the lower surface of the filter were fixed, stained with crystal violet, and examined through microscopy (Nikon, Tokyo, Japan). THP-1 cells were enumerated from 5 different fields to obtain the average number of cells per mm2.
ELISA
Supernatant harvested from the treated cells were stored at −80°C until assayed for NSE and IL-10 content using Quantikine ELISA Kit (R&D Systems, Minneapolis, MN, USA). Standard and treated cell samples were diluted using dilution buffer included with the ELISA Kit. The optical density of each well was determined within 30 mins using a microplate reader set at 450 nm.
Flow cytometry
Macrophages were co-cultured with tumor cells harvested after 72 hrs of cultivation and then labeled with FITC-conjugated anti-CD206 antibody (BD, Franklin Lakes, NJ, USA). Cells were incubated with 1 μL of antibody per 1×10⁵ cells at RT for 60 mins in accordance with the manufacturer’s instructions prior to detection with flow cytometry. Cells incubated without antibodies were used as negative controls. For the EDU assay (Invitrogen), lymphoma cells were harvested at 72 hrs and were stained and detected in accordance with the manufacturer’s instructions.
For the analysis of lymphoma cell apoptosis, lymphoma cells were collected and stained with Annexin V-PE and 7-AAD (Thermo Fisher Scientific) in binding buffer for 15 mins in accordance with the manufacturer’s instructions.
Reverse transcription PCR (RT-PCR) and quantitative real-time PCR analysis
Total cellular RNA was extracted from cultured cells using the RNeasy Kit (Qiagen) following the manufacturer’s instructions. For RT-PCR, total RNA was spectrophotometrically quantified, and equal amounts (1 μg) were transcribed into cDNA in accordance with the manufacturer’s protocol (Roche). mRNA levels were quantified through real-time qPCR analysis. NSE, Arg-1, IL-10, TNF-α, IL-12p40, CD206, CD86, and GAPDH primers were used to amplify 200 ng of cDNA following the instructions included with SUPER SYBR Green ROX Mix (Life Technology). Sense and antisense primers for NSE (AGCCTCTACGGGCATCTATGA; TTCTCAGTCCCATCCAACTCC), Arg-1 (GTGGAAACTTGCATGGACAAC; AATCCTGGCACATCGGGAATC), IL-10 (GACTTTAAGGGTTACCTGGGTTG; TCACATGCGCCTTGATGTCTG), TNF-α (AGGCGGTGCTTGTTCCTCAG; GTTATCTCTCAGCTCCACGC), IL-12p40 (CTCTGGCAAAACCCTGACC; GCTTAGAACCTCGCCTCCTT), CD206 (GGGTTGCTATCACTCTCTATGC; TTTCTTGTCTGTTGCCGTAGTT), CD86 (CCATCAGCTTGTCTGTTTCATTC; GCTGTAATCCAAGGAATGTGGTC) as well as GAPDH (GGAAGGTGAAGGTCGGAGTC; TGGGTGGAATCATATTGGAACA) primers, were used for real-time qPCR analysis. The relative levels of GAPDH mRNA were quantified using the comparative Ct method.
Immunocytofluorescence staining and nuclear translocation analysis
THP-1 cells were fixed in cold methanol for 20 mins at 4°C and permeabilized in 2% Triton X-100 at RT for 15 mins. Then, the cells were incubated with 1% BSA for 1 hrs at RT. Slides were incubated with the primary antibodies against p50 and p65 at RT for 1 hrs and then with FITC-conjugated secondary antibody (2 µg/mL; BD). Nuclei were stained with DAPI (1 µg/mL; Invitrogen). Cells were then visualized using laser scanning confocal microscope (Olympus). Colocalization Rr values (using Pearson’s correlation coefficient) were used to quantify nuclear translocation with the Image-Pro Plus 6.0 software.
Animal experiments
The effect of NSE on the growth of lymphoma tumors was evaluated using a xenograft mouse model. Six-week-old Balb/c nu/nu mice were maintained in a pathogen-free environment. NSE-vector, NSE-WT, and NSE-shRNA1 from OCI-LY1 were prepared as the experimental treatments, and OCI-LY1 was prepared as the blank control. Each group included eight mice (ie, 32 mice in total). Cells (1×10⁷) were inoculated subcutaneously into the flanks of Balb/c nu/nu mice. Tumor growth was visible 16 days after the first injection; the mice were euthanized after 24 days. The length, width, and height of the tumors were measured using calipers every 2 days. Tumor volume was calculated using the following formula: volume = (π × length × width × height)/6. The body weights of the mice were also recorded. Animal experiments were approved by the Animal Research Committee of Sun Yat-sen University Cancer Center and were performed in strict accordance with the recommendations established by the Animal Care and Ethics Committee of Sun Yat-sen University and the US National Institutes of Health Guide for the Care and Use of Laboratory Animals.
Double immunohistofluorescence, immunohistochemistry and histological evaluation
DLBCL xenografts were fixed, embedded in paraffin, and sectioned into 5 μm thickness. After deparaffinization and rehydration, antigenic retrieval was performed with citrate buffer (pH 6.0) using a 700-W microwave for 10 mins. The sections were then incubated in H2O2 (3%) for 10 mins, blocked in goat serum at RT for 30 mins, and then were subjected to double immunohistofluorescence (IHF) and IHC staining procedure.
For double IHF, the treated sections mentioned above were incubated with primary antibodies against CD68 (mouse; Abcam) and CD206 (rabbit; Abcam); CD68 (mouse; Abcam) and CD86 (rabbit; Abcam) overnight at 4°C. After washing, the tissue sections were incubated with Alexa Fluor 488 goat anti-mouse and Alexa Fluor 594 goat anti-rabbit secondary antibodies (2 µg/mL; Invitrogen) at RT for 2 hrs and then nuclei were stained with DAPI (1 µg/mL; Invitrogen). The sections were counted from 5 different fields to obtain the average number of CD68+ CD206+ M2 macrophages and CD68+ CD86+ M1 macrophages per mm2.
For IHC, the treated sections mentioned above were incubated with primary antibodies NSE and Ki67 (Cell Signaling Technology) overnight at 4°C. An EnVision kit (DAKO, Glostrup, Denmark) was used to detect the primary antibodies followed by 3, 3-diaminobenzidine substrate visualization and counterstaining with hematoxylin. The sections were counted from 5 different fields to obtain the average number of positive cells per mm2.
Apoptosis was evaluated using the TUNEL assay (Invitrogen). Pathological slides were dewaxed in xylene, fixed in 4% paraformaldehyde, and permeabilized with proteinase K. Mixed enzymes from labeled solutions were added to the slices, which were then incubated at 37°C for 60 mins. The sections were counted from 5 different fields to obtain the average number of apoptosis cells per mm2.
Statistical analysis
All data are presented as the mean ± SD. Graph generation and statistical analyses were performed using GraphPad Prism software (GraphPad Software, Inc., La Jolla, CA, USA) and unpaired Student’s t-tests. Changes were considered significantly different when P<0.05.
Results
The expression of NSE was detected in lymphoma cells
Western blot was used to quantify NSE levels in lymphoma cell lines and isolated B-cells from the peripheral blood of healthy volunteers (normal controls). Results showed that NSE expression was higher in lymphoma cell lines than in the normal controls (Figure 1A). To evaluate the functional significance of NSE in DLBCL, we chose SU-DHL-2 and OCI-LY1 to established stable NSE-overexpressing (NSE-WT) and NSE-knockdown (NSE-shRNA1 and NSE-shRNA2) by lentiviral transduction and verified by western blot and real-time qPCR. And, cells were transfected with NSE-vector as control (Figure 1B). We also detected the supernatant from culture medium of stable cell lines at 24, 48, and 72 hrs. Results showed that the variations in the NSE levels secreted by stable cell lines were dependent on the content of total cellular protein and slightly changed over time (Figure 1C).
 | Figure 1 Quantification of NSE expression in lymphoma cell lines and screening of stable cell lines. (A) Comparison of western blot results for NSE level in human lymphoma cell lines and in isolated B-cells from healthy volunteers. (B) Western blot and real-time qPCR were performed to confirm the stability of lentiviral-infected OCI-LY1 and SU-DHL-2 cells. (C) ELISA results for NSE levels in the supernatant of stable cell lines over time. Data were shown as the mean ± SD (n=3), **P<0.01, ***P<0.001, ****P<0.0001 versus corresponding group.Abbreviation: NSE, neuron-specific enolase. |
NSE from lymphoma cells regulates polarization and migration ability of macrophage
We analyzed the expression of CD206, a marker of M2 polarization, under transwell cabinet co-culture conditions. To prevent cross-contamination between cells, we separated the cells through a membrane with a pore size of 0.4 µm. We then co-cultured stable lymphoma cell lines with THP-1 for 72 hrs and then detected CD206 expression through flow cytometry and western blot analysis. CD206 expression increased in all co-cultured groups in contrast that in macrophages cultured alone (negative control). CD206 protein content significantly increased in the NSE-WT group relative to that in the NSE-vector group. However, CD206 protein levels in the NSE-shRNA1 and NSE-shRNA2 groups were lower than those in the NSE-vector group. Primary macrophages exhibited similar results (Figure 2A and B). We performed real-time qPCR analysis to quantify the mRNA levels of three different molecular markers, namely, Arg-1, CD206, and IL-10 of THP-1. The expression levels of Arg-1, CD206, and IL-10 of THP-1 exhibited similar trends (Figure 3A). In addition, we also evaluated the M1 polarization markers (TNF-α, IL-12p40, and CD86 mRNA) in THP-1 co-cultured with lymphoma cells, no significant differences were seen between the co-cultured groups and blank control (Figure S1).
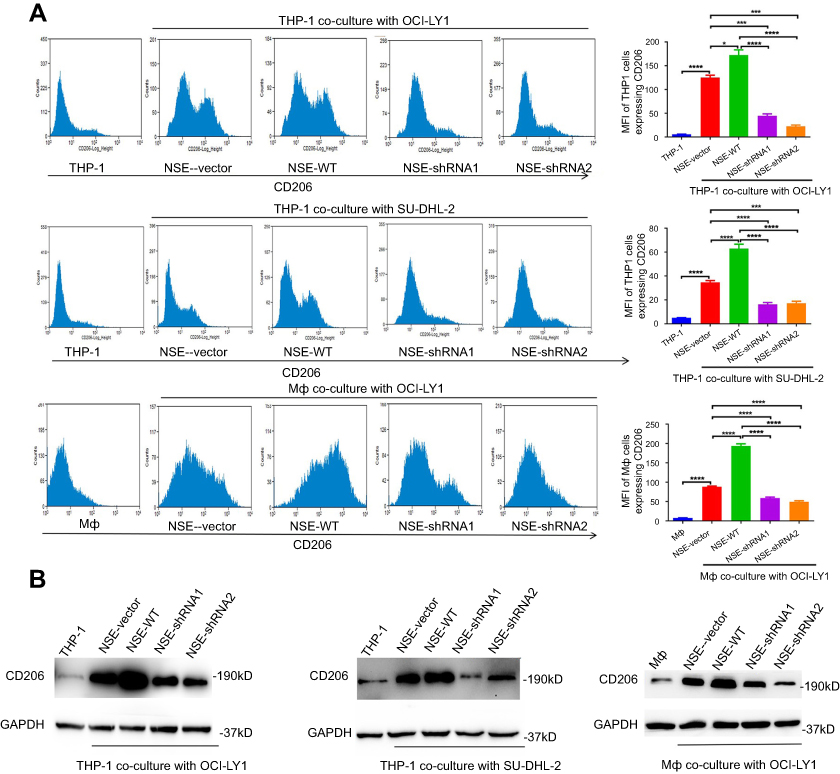 | Figure 2 NSE secreted from lymphoma cells enhanced CD206 expression in macrophages. (A) THP-1, Mф cells, and different stable cell lines were co-cultured for 72 hrs. Then, CD206 expression in macrophages was determined by flow cytometry and quantitatively analyzed. (B) CD206 protein expression was analyzed by western blot assay at 72 hrs following co-culture. Data were shown as the mean ± SD (n=3), *P<0.05, ***P<0.001, ****P<0.0001 versus corresponding group.Abbreviation: NSE, neuron-specific enolase. |
 | Figure 3 NSE could promote M2 polarization and the migration of macrophages. (A) THP-1 cells were co-cultured with different lymphoma cells for 72 hrs and then the M2 phenotype marker mRNA levels of Arg-1, CD206, and IL-10 were analyzed using real-time qPCR and statistically analyzed. (B) THP-1 cells were co-cultured with different lymphoma cells in the existence of diverse agonists (PBS as blank control, 100 ng/mL of LPS, or 10ng/mL IL-4), and then IL-10 level was measured from supernatant at 24, 48, and 72 hrs of co-culture using ELISA. (C) Transwell assays were conducted to analyze the migration of THP-1 co-cultured with different lymphoma cells. Data were shown as the mean ± SD (n=3), *P<0.05, **P<0.01, ***P<0.001, ****P<0.0001 versus corresponding group.Abbreviations: NSE, neuron-specific enolase; LPS, lipopolysaccharide. |
Different agonists can induce plasticity and phenotype differentiation. Specifically, THP-1 could be classically activated to M1 type by LPS and alternatively activated to M2 type by IL-4.30 IL-10, an immunosuppressive factor, was highly expressed in M2-type macrophages but barely expressed in M1-type macrophages. By detecting the expression levels of IL-10, we determined whether NSE has affected THP-1 polarization under diverse treatments. The results are shown in Figure 3B. Among all treatment groups, the highest expression of IL-10 was observed in response to IL-4 (20 ng/mL), and the lowest was observed in response to LPS (100 ng/mL). In addition, IL-10 was upregulated in the NSE-WT group under each treatment. This study revealed that NSE increased IL-10 expression, thereby directing the differentiation of THP-1 to the M2 phenotype even though it was under potential LPS-induced M1 polarization.
We performed migration assays to determine whether NSE is required for macrophage migration. We detected the migration ability of THP-1 through transwell assays. As expected, NSE-WT enhanced the migration of macrophages (Figure 3C). This result indicated that malignant lymphoma recruited macrophage and induced the M2 polarization of macrophages, and NSE enhanced this response.
NSE affected the growth of lymphoma cells when co-cultured with THP-1
We evaluated the biological functions of NSE in lymphoma cells and found that neither cell proliferation nor apoptosis was affected in NSE overexpression and knockdown lymphoma cells (Figure S2), indicating that the change of NSE levels did not affected the growth of lymphoma cells.
Next, we attempted to identify whether NSE-overexpressed or NSE-knockdown lymphoma cells was affected when co-cultured with macrophages. We analyzed the cell proliferation through EdU by flow cytometry (Figure 4A) and performed CCK8 assays to quantitatively analyze the cell viability (Figure 4C). The results showed that cell growth was significantly enhanced in the NSE-WT group compared to other groups. The knockdown of NSE could markedly increase the numbers of apoptotic cells (Figure 4B). We further confirmed this apoptotic trend by detecting the expression of apoptosis-related genes in OCI-LY1 sublines. The expression of the apoptosis-stimulating gene BAD and BAX increased while the anti-apoptosis protein BCL-2 decreased in NSE-shRNA groups (Figure 4D).
 | Figure 4 NSE knockdown induced the apoptosis of lymphoma cells whereas NSE overexpression promoted proliferation. Stable OCI-LY1 and SU-DHL-2 sublines were co-cultured with THP-1 for 72 hrs. (A) Proliferation of OCI-LY1 and SU-DHL-2 sublines was analyzed by EdU. (B) Apoptosis of OCI-LY1 and SU-DHL-2 sublines were analyzed by AnnexinV PE/7AAD. (C) Cell viability of OCI-LY1 and SU-DHL-2 sublines was analyzed by CCK8 assay. (D) The expression of apoptosis-related genes (BCL-2, BAX, and BAD) in OCI-LY1 sublines was detected by western blot. Data were shown as the mean ± SD (n=3), *P<0.05, **P<0.01, ****P<0.0001 versus corresponding group. Abbreviations: NSE, neuron-specific enolase; CCK8, Cell Counting Kit 8. |
NSE overexpression could promote p50 nuclear translocation
The classical NF-κB pathway is composed of p50 and p65 subunits (p50/p65 heterodimer) and is characterized as a potent activator of the expression of several pro-inflammatory genes. However, the p50 nuclear translocation and p50/p50 homodimer formation in macrophages could cause defects in the classical NF-κB pathway. M1 phenotype differentiation was associated with classical NF-κB activation, while M2 phenotype differentiation was associated with defective classical NF-κB activation.31
We investigated whether NSE affects the intracellular distribution of NF-κB components in the NSE-WT group compared to that in NSE-shRNA groups. For this assay, we used NSE-vector and THP-1 as controls. First, we co-cultured the stable OCI-LY1 cell lines with THP-1 without any treatment for 24 hrs. Results showed that the levels of nuclear p50 increased in all co-culture groups, particularly in the NSE-WT group; the levels of p65 levels slightly increased, particularly in the co-cultured NSE-shRNA group (Figure 5A). Next, we determined whether NSE has an affected THP-1 polarization under treatments of LPS (100 ng/mL) or IL-4 (20 ng/mL) for 24 hrs. Results also revealed that THP-1 co-cultured with NSE-WT lymphoma cells showed increased levels of nuclear p50 and decreased levels of nuclear p65 even though they were under treatments of LPS or IL-4 (Figure 5A). The western blot results of nuclear p50 and p65 levels were similar to the immunofluorescence results, whereas those for cytoplasmic p50 and p65 levels showed an opposing trend (Figure 5B).
 | Figure 5 NSE overexpression could increase p50 nuclear translocation. THP-1 cells were pretreated with diverse agonists (PBS as blank control, 100 ng/mL of LPS, or 10ng/ml IL-4), and then were co-cultured with different lymphoma cells: (A) Representative immunofluorescence image of p50 and p65 distribution in THP-1. THP-1 cells were stained for p50 or p65 as indicated (green), or with DAPI for nuclear counterstaining (blue) and visualized by confocal microscope. (B) Western blotting was conducted to analyze the p50 and p65 NF-κB protein content of cytoplasmic and nuclear extracts from THP-1 cells. And then THP-1 was transfected into NF-κB (p50) siRNA and then co-cultured with OCI-LY1/NSE-WT: (C) The mRNA levels of IL-10, Arg-1, and CD206 in THP-1 were measured. (D) Cytoplasm and nucleus levels of p50 and p65 in THP-1 were measured. Data were shown as the mean ± SD (n=3), ns P>0.05, *P<0.05, **P<0.01, ***P<0.001 ****P<0.0001 versus corresponding group.Abbreviations: NSE, neuron-specific enolase; NF-κB, nuclear factor-κB. |
To definitively assess the role of p50 in the cytokine expression by TAMs co-cultured with NSE overexpression lymphoma cells, THP-1 was transfected into NF-κB (p50) siRNA and then co-cultured with NSE-overexpressed lymphoma cells. Lack of p50 in THP-1 resulted in an appreciable decrease in the levels of Arg-1, IL-10, and CD206 mRNA. These results suggest that M2 polarization of TAMs stimulated by NSE overexpression lymphoma cells was associated with elevated nuclear translocation of p50 and defective classical NF-κB activation (Figure 5C and D).
NSE secreted by lymphoma-derived exosomes downregulated IKK-β expression and inhibited the classical NF-κB signaling pathway in macrophages
We have proved that NSE promoted the progression of DLBCL through regulating the polarization of TAMs. However, how the NSE in DLBCL cells interacted with macrophages and regulated functional polarization were not fully understood. We hypothesized that NSE can be secreted from cells via the transport of exosomes and these NSE-containing exosomes can regulate polarization of macrophages.
We isolated exosomes by high-speed centrifugation from the conditioned medium of the OCI-LY1 sublines, TEM revealed that the particles have the cup-shaped morphology and the sizes of exosomes were mostly around 50 nm (Figure 6A). NTA revealed that the sizes of exosomes were mostly around 80 nm (Figure 6B). The difference of the TEM and NTA results can be attributed to NTA, which monitors the hydrodynamic diameter of the exosomes in the solution, and the strong contribution of larger particles to light scattering than the smaller particles, thereby leading to a shift compared with NTA.32
 | Figure 6 NSE secreted by lymphoma-derived exosomes downregulated IKK-β expression and inhibited the classical NF-κB signaling pathway in macrophages. We isolated exosomes from OCI-LY1 sublines: (A) TEM showed the structures and sizes of exosomes. (B) NTA showed the particle size distribution of exosomes. (C) NSE levels of exosomes by western blot. (D) THP-1 cells were incubated with PKH67 (Green)-labeled lymphoma-derived exosomes for 4 hrs to confirm the uptake of DLBCL-derived exosomes by THP-1. (E) EMSA was performed to check the NF-κB promoter binding of p50 dimmer, when added NSE-overexpressed exosomes (10 μg/mL), the p50 dimmer was obviously binding to the promoter of NF-κB, and decreased as NSE was knockdown. (F) THP-1 cells were treated with exosomes from OCI-LY1 sublines for 24 hrs, and then western blot was performed to evaluate the IKK-β, cytoplasmic and nuclear p50 levels in THP-1. (G) Model for the role of NSE which was enriched in lymphoma cells derived exosomes in the regulation of macrophage M2 polarization in lymphoma microenvironment.Abbreviations: NSE, neuron-specific enolase; NF-κB, nuclear factor-κB; IKK, inhibitor kappa B kinase; TEM, transmission electron microscope; EMSA, electrophoretic mobility shift assay. |
Then, we detected the NSE expression level in exosomes; when NSE was overexpressed or knockdown in OCI-LY1, the NSE levels in exosomes were increased or decreased accordingly (Figure 6C). Then, the uptake and intracellular localization of OCI-LY1 derived exosomes in THP-1 was studied by fluorescence confocal microscope. After 4 hrs incubation, the PKH-67 select signal could be detected in the cell cytoplasm, indicating that OCI-LY1 derived exosomes had been internalized in THP-1 (Figure 6D).
An EMSA was performed to illustrate the translocation of p50 to the nucleus (p50 DNA binding activity). When we added NSE overexpressed exosomes to THP-1 cells, the p50 DNA binding activity increased, and the binding activity was decreased as NSE downregulated exosomes was added (Figure 6E).
Inhibitor kappa B kinase (IKK)-β is a key subunit of IKK complex that mediates the classical NF-κB pathway. We also determined the effect of exosomal NSE on the classical NF-κB pathway. THP-1 cells were treated with exosomes from OCI-LY1 sublines for 24 hrs, and then western blot was performed to evaluate the IKK-β, cytoplasmic and nuclear p50 levels in THP-1. The addition of NSE overexpressed exosomes decreased the levels of the IKK-β (Figure 6F). Overall, these results suggest NSE might play an important role in the polarization of M2 macrophages through defecting classical NF-κB pathway in TME (Figure 6G).
NSE knockdown inhibited tumor growth and M2 polarization of TAMs in vivo
We determined the in vivo effect of NSE on tumor growth using a xenograft Balb/c nu/nu mouse model. We aimed to confirm the regulatory roles of NSE in macrophage polarization and involvement in enhanced lymphoma growth and survival. Stable OCI-LY1 sublines (NSE-vector, NSE-WT, and NSE-shRNA1) and OCI-LY1 cells (control) were subcutaneously injected into the flanks of model mice. The tumors that developed at the local injection sites were palpable and visible at 16 days after injection. The tumors were then measured every 2 days. NSE knockdown significantly inhibited tumor growth (Figure 7A1 and A2). Double IHF revealed that the number of CD68+ CD206+ M2 macrophages in NSE-WT group was higher than that in other groups (Figure 7C1 and C2), while no significant different number of CD68+ CD86+ M1 macrophages were seen among the four groups (Supplementary Figure). In addition, NSE knockdown induced apoptosis, as shown by quantitative analysis through TUNEL assay (Figure 7B1 and B2). Moreover, IHC analysis indicated that NSE overexpression promoted tumor proliferation (higher Ki67 expression) (Figure 7D1 and D2).
 | Figure 7 NSE knockdown inhibited tumor growth in vivo. Stable OCI-LY1 sublines were subcutaneously injected into the flanks of Balb/c nu/nu mice. (A1) In vivo tests were terminated at 24 days after injection when tumors were observed in mice. (A2) Tumor growth curves were analyzed on the basis of tumor volume measured on the indicated days. Data of three separate experiments are presented as mean ± SD (n=4). (B1) and (B2) Apoptosis was analyzed through TUNEL assays. Data were shown as the mean ± SD (n=4). (C1) and (C2) Expression levels of CD68+ CD206+ cells in xenografts tissues were quantified through double immunohistofluorescence. Data were shown as the mean ± SD (n=4). (D1) and (D2) Expression levels of NSE and Ki67 in xenografts tissues were quantified through immunohistochemistry. Data were shown as the mean ± SD (n=4), ns P>0.05, ***P<0.001 ****P<0.0001 versus corresponding group.Abbreviation: NSE, neuron-specific enolase. |
Discussion
NSE is typically overexpressed in tumors of neurogenic and neuroendocrine origin, such as glioblastoma,33 neuroblastoma,34 medullary thyroid carcinoma,34 and small cell lung cancer.34 For example, NSE was upregulated in glioblastoma cells exposed to stress conditions such as hypoxia and serum starvation, indicating that glioblastoma cells might upregulate NSE to adapt to increase glycolysis.33 Since it is well known that hypoxia and starvation associate with progression and drug resistance by inducing biological changes in tumor cells, one of them being increased glycolysis.35 Moreover, the C-terminal peptide of NSE, which is not related to glycolytic pathway, was demonstrated to promote survival, differentiation and regeneration of neuroblastoma cells by activation of the phosphatidylinositol-3-kinase/protein kinase B (AKT) and mitogen-activated protein kinase/ERK signal pathways.36 In addition, the C-terminal peptide of NSE was also showed to impair apoptosis of pheochromocytoma cells by interacting with p75 neurotrophin receptor (p75NTR) and then suppressing the activation of its downstream effectors in apoptotic signals.37 These additional functions could be important also in other cancer cells either to promote tumor cell progression or protect tumor cells from stressful conditions. Thus, as a pro-tumor factor, the function of NSE is far more than its well-recognized metabolic role as a glycolytic enzyme.
Apart from tumors of neurogenic and neuroendocrine origin, NSE levels in tumor tissues or sera can be also regarded as an adverse prognostic factor in tumors originating from epithelial tissues (breast cancer38 and non-small cell lung cancer39) and lymphoid tissues (DLBCL25,26). NSE increased significantly in some originally NSE-negative cells (breast cells and urothelial cells) when they gained the ability of malignant transformation such as colony formation and infinite proliferation under exposure of Arsenic or cadmium, and the increased NSE expression may be influenced by methylation or histone modifications.40,41 Similarly, the current study showed that NSE expression was higher in DLBCL cell lines than that in the B-cells of normal controls. The possible explanation for NSE overexpression in non-neuron/neuroendocrine derived tumors may be that the epigenetic alterations during carcinogenesis may cause NSE overexpression to accommodate the neoplastic state. However, the following pro-tumor mechanisms of NSE have not yet been proposed.
Next, we investigated the pro-tumor function of NSE in DLBCL. Results showed that neither NSE overexpression nor NSE knockdown affected the growth and apoptosis of DLBCL cells, indicating that NSE played the pro-tumor role not by inducing direct biological changes (proliferation and apoptosis) in DLBCL cells. Our findings were not quite consistent with previous research showing that NSE knockdown significantly reduced migration of glioblastoma cells.33 The reasons for the inconsistencies may be due to the differences in cell origin. Thus, we proposed assumption that NSE promoted DLBCL progression through interacting with TME.
TAMs increase up to 50% of the component of immunity system in TME, and M2 phenotype is predominant, especially in the hypoxia area.5 TAMs have been widely illustrated to be regarded as prognostic biomarker in lymphoma, including Hodgkin’s lymphoma,42 follicular lymphoma,43 DLBCL,19–21 and extranodal NK/T-cell lymphoma.44 The dynamic interaction between tumors and TAMs coordinates key events leading to tumorigenesis and drug resistance.17,45,46 However, studies on cell–cell interactions between lymphoma cells and macrophages are limited. Komohara et al found that co-culture with macrophages significantly promoted proliferation of lymphoma cells; the M2 macrophages, rather than the M1 macrophages, induced a notable increase in lymphoma cell proliferation.47 Cytokine analysis indicated that C5a from co-cultured macrophages influenced lymphoma by activating STAT3signals,48 suggesting that macrophage contacting with molecules from lymphoma cells could produce biomolecules that affected lymphoma cells.
We investigated whether NSE participated in cell–cell interactions between DLBCL cells and macrophages. Similar to the above studies, after the co-culture of macrophages and lymphoma cells, the following phenomenon was observed: (1) macrophages co-cultured with NSE-overexpressed lymphoma cells showed enhanced capability of migration and elevated expression of CD206, Arg-1 and IL-10, indicating differentiation toward M2 phenotype; (2) cell growth capacity was enhanced and apoptosis rate was decreased in NSE-overexpressed DLBCL cells when co-cultured with macrophages, indicating that macrophages contacting with NSE from DLBCL cells might produce biomolecules, such as IL-10, which could promote DLBCL progression in turn.
Then, we continued to explore the following mechanisms of NSE on macrophages regulation. NF-κB linked inflammation and tumorigenesis could be divided into two activation pathways: classical and alternative.49,50 The classical pathway of IKK-β/NF-κB is composed of p50 and p65 subunits (p50/p65 heterodimer), and the activation of classical IKK-β/NF-κB pathway in macrophages results in the secretion of pro-inflammatory cytokines during the early stage of carcinogenesis.5,51 However, the p50 nuclear translocation and p50/p50 homodimer formation in macrophages could cause defects in the classical NF-κB pathway and associate with anti-inflammatory cytokines. Alessandra et al reported that the TAMs with M2 activation and defective M1 activation were associated with elevated nuclear translocation of p50; while TAMs from p50―/― mice expressed higher levels of IL-12p40 and TNF-α mRNA, and lower levels of IL-10 mRNA, resulting in tumor growth retardation.31
We observed that classical NF-κB activation became defective in THP-1 cells co-cultured with lymphoma cells. The highest level of p50 translocation accompanied with highest levels of CD206, Arg-1, and IL-10 was observed in the NSE-WT group. Moreover, THP-1 cells cultured alone in IL-4 or LPS culture media showed high nuclear p50 or p65 translocation, respectively. These results further confirmed that p50 translocation was associated with M2 polarization and defective M1 polarization. Even under all co-culture conditions, nuclear p50 content increased most in the NSE-WT group, whereas p65 was slightly upregulated in the NSE-shRNA group compared with the NSE-vector group. Moreover, we observed that downregulation of p50 in TAMs antagonized the M2 polarization induced by NSE-overexpressed lymphoma cells.
Tumor-derived exosomes can be an efficient platform for the transfer of soluble crosstalk factors, and the exchanges of cellular contents between tumor and TME cells mediated by exosomes play a key role in regulating TME functions, including lymphomas. Aung et al showed that B-cell lymphoma cells released exosomes could carry CD20, combine with therapeutic anti-CD20 antibodies, consume complement, and protect target cells from antibody attack, which were modulated by the lysosome-related organelle-associated ATP-binding cassette transporter A3.52 Yoon et al demonstrated that the accumulation of miR-155 mediated by Burkitt’s lymphoma-derived exosomes might increase transcriptional and translational levels of vascular endothelial growth factor-A and promote neovascularization in the TME.53 Similarly, we observed that lymphoma-derived exosomes contained NSE and could be taken up by macrophages. Exosomal NSE promoted nucleus translocation of p50 and downregulated IKK-β expression, resulting in defective classical IKK-β/NF-κB signaling pathway in macrophages.
We further verified our results in vivo using a Balb/c nu/nu murine model, which exhibited various tumor volumes under different treatments. NSE knockdown decreased tumor size, whereas NSE overexpression upregulated CD68+ CD206+ M2 macrophage expression. The results further supported our hypothesis on the relationship between lymphoma-secreted NSE and macrophages.
This study still has some limitations. First, the main macrophage model was based on PMA-induced THP-1, which is an acute monocytic leukemia cell line. Second, the results observed were compatible to an experimental setting (in vitro and in vivo). It is not possible to guarantee that the same will be observed in patients where differences on the immune response play a complex role in the tissue microenvironment composition. Further researches using primary human monocytes-derived macrophages model for mechanism research, and exploring the relationship between NSE expression and TAMs levels in DLBCL patients’ tissues, are urgent to conduct.
Conclusion
NSE from lymphoma cells regulates the polarization of macrophages to M2 phenotype, thereby contributing to the proliferation and progression of lymphoma. The parallel changes in the levels of NSE and NF-κB p50 nuclear translocation indicate that NSE promoted M2 polarization via p50 nuclear translocation. Our findings not only reveal the contribution of DLBCL and macrophages interaction in lymphoma progression, but also provide comprehensive insights into the role of NSE in TAMs formation and pro-tumor characteristics. Identifying the key role of DLBCL-secreted NSE in regulating TAMs polarization provides potential molecular targets for the treatment of DLBCL.
Acknowledgments
This study was supported by the National Natural Science Foundation of China (contract/grant number: 81272620), Science and Technology Projects of Guangdong Province (contract/grant numbers: 2014A020212577), and Medical Research Foundation of Guangdong Province (contract/grant number: A2015008). The authenticity of this article has been validated by uploading the key raw data onto the Research Data Deposit public platform (
Disclosure
The authors report no conflicts of interest in this work.
References
1. Mantovani A, Sozzani S, Locati M, Allavena P, Sica A. Macrophage polarization: tumor-associated macrophages as a paradigm for polarized M2 mononuclear phagocytes. Trends Immunol. 2002;23(11):549–555.
2. Marcus R, Hagenbeek A, The therapeutic use of rituximab in non-Hodgkin‘s lymphoma. Eur J Haematol Suppl. 2007;67:5–14. doi:10.1111/j.1600-0609.2006.00789.x
3. Coussens LM, Werb Z. Inflammation and cancer. Nature. 2002;420(6917):860–867. doi:10.1038/nature01322
4. Qian BZ, Pollard JW. Macrophage diversity enhances tumor progression and metastasis. Cell. 2010;141(1):39–51. doi:10.1016/j.cell.2010.03.014
5. Biswas SK, Sica A, Lewis CE. Plasticity of macrophage function during tumor progression: regulation by distinct molecular mechanisms. J Immunol. 2008;180(4):2011–2017.
6. Kakizaki A, Fujimura T, Kambayashi Y, et al. Comparison of CD163+ macrophages and CD206+ cells in lesional skin of CD30+ lymphoproliferative disorders of lymphomatoid papulosis and primary cutaneous anaplastic large-cell lymphoma. Acta Derm Venereol. 2015;95(5):600–602. doi:10.2340/00015555-2016
7. Mestas J, Hughes CC. Of mice and not men: differences between mouse and human immunology. J Immunol. 2004;172(5):2731–2738.
8. Martinez FO, Helming L, Milde R, et al. Genetic programs expressed in resting and IL-4 alternatively activated mouse and human macrophages: similarities and differences. Blood. 2013;121(9):e57–69. doi:10.1182/blood-2012-06-436212
9. Murray PJ, Wynn TA. Obstacles and opportunities for understanding macrophage polarization. J Leukoc Biol. 2011;89(4):557–563. doi:10.1189/jlb.0710409
10. Jung SH, Hwang JH, Kim SE, Kim YK, Park HC, Lee HT. Human galectin-9 on the porcine cells affects the cytotoxic activity of M1-differentiated THP-1 cells through inducing a shift in M2-differentiated THP-1 cells. Xenotransplantation. 2017;24:4. doi:10.1111/xen.2017.24.issue-4
11. Mandal A, Das S, Kumar A, et al. l-Arginine uptake by cationic amino acid transporter promotes intra-macrophage survival of leishmania donovani by enhancing arginase-mediated polyamine synthesis. Front Immunol. 2017;8:839. doi:10.3389/fimmu.2017.00839
12. Gutierrez P, Closa D, Piner R, Bulbena O, Menendez R, Torres A. Macrophage activation in exacerbated COPD with and without community-acquired pneumonia. Eur Respir J. 2010;36(2):285–291. doi:10.1183/09031936.00118909
13. Feng R, Morine Y, Ikemoto T, et al. Nrf2 activation drive macrophages polarization and cancer cell epithelial-mesenchymal transition during interaction. Cell Commun Signal. 2018;16(1):54. doi:10.1186/s12964-018-0262-x
14. Ning Y, Feng W, Cao X, et al. Genistein inhibits stemness of SKOV3 cells induced by macrophages co-cultured with ovarian cancer stem-like cells through IL-8/STAT3 axis. J Exp Clin Cancer Res. 2019;38(1):19. doi:10.1186/s13046-018-1010-1
15. Estko M, Baumgartner S, Urech K, et al. Tumour cell derived effects on monocyte/macrophage polarization and function and modulatory potential of Viscum album lipophilic extract in vitro. BMC Complement Altern Med. 2015;15:130. doi:10.1186/s12906-015-0650-3
16. Hagemann T, Wilson J, Burke F, et al. Ovarian cancer cells polarize macrophages toward a tumor-associated phenotype. J Immunol. 2006;176(8):5023–5032.
17. Movahedi K, Laoui D, Gysemans C, et al. Different tumor microenvironments contain functionally distinct subsets of macrophages derived from Ly6C(high) monocytes. Cancer Res. 2010;70(14):5728–5739. doi:10.1158/0008-5472.CAN-09-4672
18. Zeng YJ, Lai W, Wu H, et al. Neuroendocrine-like cells-derived CXCL10 and CXCL11 induce the infiltration of tumor-associated macrophage leading to the poor prognosis of colorectal cancer. Oncotarget. 2016;7:27394–27407.
19. Nam SJ, Go H, Paik JH, et al. An increase of M2 macrophages predicts poor prognosis in patients with diffuse large B-cell lymphoma treated with rituximab, cyclophosphamide, doxorubicin, vincristine and prednisone. Leuk Lymphoma. 2014;55(11):2466–2476. doi:10.3109/10428194.2013.879713
20. Kridel R, Steidl C, Gascoyne RD. Tumor-associated macrophages in diffuse large B-cell lymphoma. Haematologica. 2015;100(2):143–145. doi:10.3324/haematol.2015.124008
21. Marinaccio C, Ingravallo G, Gaudio F, et al. Microvascular density, CD68 and tryptase expression in human diffuse large B-cell lymphoma. Leuk Res. 2014;38(11):1374–1377. doi:10.1016/j.leukres.2014.09.007
22. Isgro MA, Bottoni P, Scatena R. Neuron-specific enolase as a biomarker: biochemical and clinical aspects. Adv Exp Med Biol. 2015;867:125–143. doi:10.1007/978-94-017-7215-0_9
23. Gonzalez-Quevedo A, Gonzalez-Garcia S, Hernandez-Diaz Z, et al. Serum neuron specific enolase could predict subclinical brain damage and the subsequent occurrence of brain related vascular events during follow up in essential hypertension. J Neurol Sci. 2016;363:158–163. doi:10.1016/j.jns.2016.02.052
24. Massarelli G, Onida GA, Piras MA, Marras V, Mura A, Tanda F. Neuron-specific enolase (gamma enolase, gamma-gamma dimer) expression in Hodgkin‘s disease and large cell lymphomas. Anticancer Res. 1999;19(5B):3933–3938.
25. Wang L, Liu P, Geng Q, Chen X, Lv Y. Prognostic significance of neuron-specific enolase in patients with diffuse large B-cell lymphoma treated with rituximab-based immunochemotherapy. Leuk Lymphoma. 2011;52(9):1697–1703. doi:10.3109/10428194.2011.578187
26. Wang L, Liu P, Chen X, Geng Q, Lu Y. Serum neuron-specific enolase is correlated with clinical outcome of patients with non-germinal center B cell-like subtype of diffuse large B-cell lymphoma treated with rituximab-based immunochemotherapy. Med Oncol. 2012;29(3):2153–2158. doi:10.1007/s12032-011-0049-z
27. Hoshino A, Costa-Silva B, Shen TL, et al. Tumour exosome integrins determine organotropic metastasis. Nature. 2015;527(7578):329–335. doi:10.1038/nature15756
28. Zhou W, Ke SQ, Huang Z, et al. Periostin secreted by glioblastoma stem cells recruits M2 tumour-associated macrophages and promotes malignant growth. Nature Cell Biology. 2015;17(2):170–182. doi:10.1038/ncb3090
29. Ying X, Wu Q, Wu X, et al. Epithelial ovarian cancer-secreted exosomal miR-222-3p induces polarization of tumor-associated macrophages. Oncotarget. 2016;7(28):43076–43087. doi:10.18632/oncotarget.9246
30. Gordon S, Taylor PR. Monocyte and macrophage heterogeneity. Nat Rev Immunol. 2005;5(12):953–964. doi:10.1038/nri1733
31. Saccani A, Schioppa T, Porta C, et al. p50 nuclear factor-kappaB overexpression in tumor-associated macrophages inhibits M1 inflammatory responses and antitumor resistance. Cancer Res. 2006;66(23):11432–11440. doi:10.1158/0008-5472.CAN-06-1867
32. Sokolova V, Ludwig AK, Hornung S, et al. Characterisation of exosomes derived from human cells by nanoparticle tracking analysis and scanning electron microscopy. Colloids Surf B. 2011;87(1):146–150. doi:10.1016/j.colsurfb.2011.05.013
33. Yan T, Skaftnesmo KO, Leiss L, et al. Neuronal markers are expressed in human gliomas and NSE knockdown sensitizes glioblastoma cells to radiotherapy and temozolomide. BMC Cancer. 2011;11:524. doi:10.1186/1471-2407-11-524
34. Tapia FJ, Polak JM, Barbosa AJ, et al. Neuron-specific enolase is produced by neuroendocrine tumours. Lancet. 1981;1(8224):808–811.
35. Zeng W, Liu P, Pan W, Singh SR, Wei Y. Hypoxia and hypoxia inducible factors in tumor metabolism. Cancer Lett. 2015;356(2 Pt A):263–267. doi:10.1016/j.canlet.2014.01.032
36. Hafner A, Obermajer N, Kos J. gamma-Enolase C-terminal peptide promotes cell survival and neurite outgrowth by activation of the PI3K/Akt and MAPK/ERK signalling pathways. Biochem J. 2012;443(2):439–450. doi:10.1042/BJ20111351
37. Pislar AH, Kos J. C-terminal peptide of gamma-enolase impairs amyloid-beta-induced apoptosis through p75(NTR) signaling. Neuromol. Med. 2013;15(3):623–635. doi:10.1007/s12017-013-8247-9
38. Hao X, Sun B, Hu L, et al. Differential gene and protein expression in primary breast malignancies and their lymph node metastases as revealed by combined cDNA microarray and tissue microarray analysis. Cancer. 2004;100(6):1110–1122. doi:10.1002/cncr.20095
39. Ferrigno D, Buccheri G, Giordano C. Neuron-specific enolase is an effective tumour marker in non-small cell lung cancer (NSCLC). Lung Cancer. 2003;41(3):311–320.
40. Soh MA, Garrett SH, Somji S, et al. Arsenic, cadmium and neuron specific enolase (ENO2, gamma-enolase) expression in breast cancer. Cancer Cell Int. 2011;11(1):41. doi:10.1186/1475-2867-11-41
41. Soh M, Dunlevy JR, Garrett SH, et al. Increased neuron specific enolase expression by urothelial cells exposed to or malignantly transformed by exposure to Cd(2)(+) or As(3)(+). Toxicol Lett. 2012;212(1):66–74. doi:10.1016/j.toxlet.2012.05.003
42. Steidl C, Lee T, Shah SP, et al. Tumor-associated macrophages and survival in classic Hodgkin‘s lymphoma. N Engl J Med. 2010;362(10):875–885. doi:10.1056/NEJMoa0905680
43. Kridel R, Xerri L, Gelas-Dore B, et al. The prognostic impact of CD163-positive macrophages in follicular lymphoma: a study from the BC cancer agency and the lymphoma study association. Clin Cancer Res. 2015;21(15):3428–3435. doi:10.1158/1078-0432.CCR-14-3253
44. Wang H, Li P, Wang L, et al. High numbers of CD68+ tumor-associated macrophages correlate with poor prognosis in extranodal NK/T-cell lymphoma, nasal type. Ann Hematol. 2015;94(9):1535–1544. doi:10.1007/s00277-015-2401-4
45. Caras I, Tucureanu C, Lerescu L, et al. Influence of tumor cell culture supernatants on macrophage functional polarization: in vitro models of macrophage-tumor environment interaction. Tumori. 2011;97(5):647–654. doi:10.1700/989.10726
46. Liao J, Feng W, Wang R, et al. Diverse in vivo effects of soluble and membrane-bound M-CSF on tumor-associated macrophages in lymphoma xenograft model. Oncotarget. 2016;7(2):1354–1366. doi:10.18632/oncotarget.6362
47. Komohara Y, Niino D, Saito Y, et al. Clinical significance of CD163(+) tumor-associated macrophages in patients with adult T-cell leukemia/lymphoma. Cancer Sci. 2013;104(7):945–951. doi:10.1111/cas.12167
48. Bai B, Horlad H, Saito Y, et al. Role of Stat3 activation in cell-cell interaction between B-cell lymphoma and macrophages: the in vitro study. J Clin Exp Hematop. 2013;53(2):127–133.
49. Karin M, Greten FR. NF-kappaB: linking inflammation and immunity to cancer development and progression. Nat Rev Immunol. 2005;5(10):749–759. doi:10.1038/nri1703
50. Bonizzi G, Karin M. The two NF-kappaB activation pathways and their role in innate and adaptive immunity. Trends Immunol. 2004;25(6):280–288. doi:10.1016/j.it.2004.03.008
51. Greten FR, Eckmann L, Greten TF, et al. IKKbeta links inflammation and tumorigenesis in a mouse model of colitis-associated cancer. Cell. 2004;118(3):285–296. doi:10.1016/j.cell.2004.07.013
52. Aung T, Chapuy B, Vogel D, et al. Exosomal evasion of humoral immunotherapy in aggressive B-cell lymphoma modulated by ATP-binding cassette transporter A3. Proc Natl Acad Sci U S A. 2011;108(37):15336–15341. doi:10.1073/pnas.1102855108
53. Yoon C, Kim J, Park G, et al. Delivery of miR-155 to retinal pigment epithelial cells mediated by Burkitt‘s lymphoma exosomes. Tumour Biol. 2016;37(1):313–321. doi:10.1007/s13277-015-3769-4
Supplementary materials
 | Figure S1 NSE from lymphoma cells did not affect the expression of M1 polarization markers. (A) THP-1 cells were co-cultured with different lymphoma cells for 72 hrs and then the M1 phenotype marker mRNA levels of CD86, IL-12p40, and TNF-α were analyzed using RT-qPCR and statistically analyzed. Data were shown as the mean ± SD (n=3), ns P>0.05. (B1) and (B2) Expression levels of CD68+ CD86+ cells in xenografts tissues were quantified through double immunohistofluorescence. Data were shown as the mean ± SD (n=4). ns P>0.05. |
 | Figure S2 Change of NSE levels did not affect the growth of lymphoma cells. (A) Proliferation of OCI-LY1 and SU-DHL-2 sublines was analyzed by EdU. (B) Apoptosis of OCI-LY1 and SU-DHL-2 sublines were analyzed by AnnexinV PE/7AAD. (C) Cell viability of OCI-LY1 and SU-DHL-2 sublines was analyzed by CCK8 assay. Data were shown as the mean ± SD (n=3). ns P>0.05. |
 © 2019 The Author(s). This work is published and licensed by Dove Medical Press Limited. The
full terms of this license are available at https://www.dovepress.com/terms
and incorporate the Creative Commons Attribution
- Non Commercial (unported, 3.0) License.
By accessing the work you hereby accept the Terms. Non-commercial uses of the work are permitted
without any further permission from Dove Medical Press Limited, provided the work is properly
attributed. For permission for commercial use of this work, please see paragraphs 4.2 and 5 of our Terms.
© 2019 The Author(s). This work is published and licensed by Dove Medical Press Limited. The
full terms of this license are available at https://www.dovepress.com/terms
and incorporate the Creative Commons Attribution
- Non Commercial (unported, 3.0) License.
By accessing the work you hereby accept the Terms. Non-commercial uses of the work are permitted
without any further permission from Dove Medical Press Limited, provided the work is properly
attributed. For permission for commercial use of this work, please see paragraphs 4.2 and 5 of our Terms.