Back to Journals » OncoTargets and Therapy » Volume 13
NR1D2 Accelerates Hepatocellular Carcinoma Progression by Driving the Epithelial-to-Mesenchymal Transition
Authors Tong H, Liu X, Li T ![]() , Qiu W, Peng C, Shen B, Zhu Z
, Qiu W, Peng C, Shen B, Zhu Z
Received 8 November 2019
Accepted for publication 25 March 2020
Published 8 May 2020 Volume 2020:13 Pages 3931—3942
DOI https://doi.org/10.2147/OTT.S237804
Checked for plagiarism Yes
Review by Single anonymous peer review
Peer reviewer comments 2
Editor who approved publication: Professor Yong Teng
Hui Tong,1,* Xiaohui Liu,2,* Tao Li,1 Weihua Qiu,1 Chenghong Peng,1 Baiyong Shen,1 Zhecheng Zhu1
1Department of General Surgery, Ruijin Hospital, Shanghai Jiao Tong University School of Medicine, Shanghai 200025, People’s Republic of China; 2CNRS-LIA124, Sino-French Research Center for Life Sciences and Genomics, State Key Laboratory of Medical Genomics, Ruijin Hospital, Shanghai Jiao Tong University School of Medicine, Shanghai 200025, People’s Republic of China
*These authors contributed equally to this work
Correspondence: Zhecheng Zhu; Baiyong Shen
Email [email protected]; [email protected]
Introduction: A poor prognosis owing to cancer invasion and metastasis, hepatocellular carcinoma (HCC) is one of the leading causes of malignancy deaths worldwide. A dominant epithelial-to-mesenchymal transition or EMT function in tumour metastasis is substantially evidenced. Prior reports identified a likely correlation of the nuclear hormone receptor NR1D2 with HCC progression, but the underlying molecular mechanisms and role of invasion and metastasis are still to be adequately documented.
Methods: We carried out PROGgeneV2 platform database analysis and compared NR1D2 expression in HCC tissues with that in adjacent noncancerous tissues by Western blotting. Cell proliferation, invasion, and migration were also assessed using a lentivirus system. Moreover, the relevant signalling proteins were evaluated.
Results: The PROGgeneV2 platform database analysis suggested an upregulated NR1D2 expression related to poor overall survival, or OS, in HCC, with higher levels in HCC, compared to the adjoining non-cancerous tissue. Depleting NR1D2 decreased HCC cell proliferation, migration and invasion in vitro, whilst in vivo downregulation revealed fewer metastatic nodules in the lungs. Furthermore, NR1D2 knockdown amplified epithelial marker, namely E-cadherin expressions, and decreased mesenchymal markers, ie, N-cadherin and vimentin expressions, with β-catenin overexpression.
Conclusion: NR1D2 is shown to accelerate HCC progression via driving EMT.
Keywords: hepatocellular carcinoma, NR1D2, epithelial-to-mesenchymal transition
Introduction
Hepatocellular carcinoma was the sixth most common malignancy diagnosed, and the fourth main reason for mortality worldwide, as of 2018, registering around 841,000 new patients, and 782,000 deaths per year.1 The 5-year survival rate is below 12%.2 HCC is mostly misdiagnosed at the early stages due to a lack of typical clinical manifestations, which often leads to poor prognosis.3 Thus, an enhanced knowledge of the mechanisms underlying HCC occurrence, as also its progression, is critical.
REV-ERBs, the nuclear hormone receptors nuclear receptor subfamily 1 group D member 1 (NR1D1, also known as REV-ERBα) and NR1D2 (also known as REV-ERBβ), are haem-binding circadian clock components. NR1D2 is a variant of NR1D1. Substantive evidence has demonstrated that disruption of the circadian clock is associated with tumourigenesis.4,5 Pharmacological modulation of NR1D2 may be suitable as an effective anticancer strategy.5 Notably, NR1D2 is aberrantly upregulated in HCC cells.6 A previous study revealed that NR1D2 also regulated epithelial-to-mesenchymal transition (EMT) and cell motility in glioblastoma cells.7
Biologically, the EMT process involves a transient de-differentiation that alters epithelial cell plasticity, thereby inducing a mesenchymal phenotype.8 The characteristic transformations during EMT include decreased E-cadherin, an epithelial marker, and increased N-cadherin and vimentin, both constituting mesenchymal markers.9,10 EMT aids cell proliferation, invasion and metastases during HCC progression, as exhaustively demonstrated.11–13 Interestingly, aberrant Wnt pathway activation is a critical key process in many cancers, including HCC.2 The Wnt/β-catenin pathway is a signalling-initiated EMT in several cancers, which include HCC and lung cancer as well.14–16 Wnt/β-catenin signalling can increase hypoxia-induced EMT in HCC.17
NR1D2 functionality in HCC, as also the underlying molecular mechanisms, require further study. We therefore performed both in vitro and in vivo analyses for more information on the same.
Materials and Methods
Bioinformatics Analysis
The ProgeneV2 prognostic (http://genomics.jefferson.edu/proggene/) database sourced the data relevant to evaluating NR1D2 function in HCC survival.18,19 Kaplan-Meier plots were used for overall survival rates, then compared with the Log rank test.
Clinical Samples
The Medical Ethics Committee at Shanghai Jiao Tong University School of Medicine’s Ruijin Hospital approved this study. All 52 participants, primarily HCC patients who were enrolled from Feb’2015 to Nov’2016, presented written informed consent forms. Primary HCC and adjoining non-cancerous tissues were collected during hepatectomies. Table 1 comprehensively summarizes clinical characteristics of patients. The HCC as well as adjacent tissue samples were verified via haematoxylin and eosin, or H&E staining.
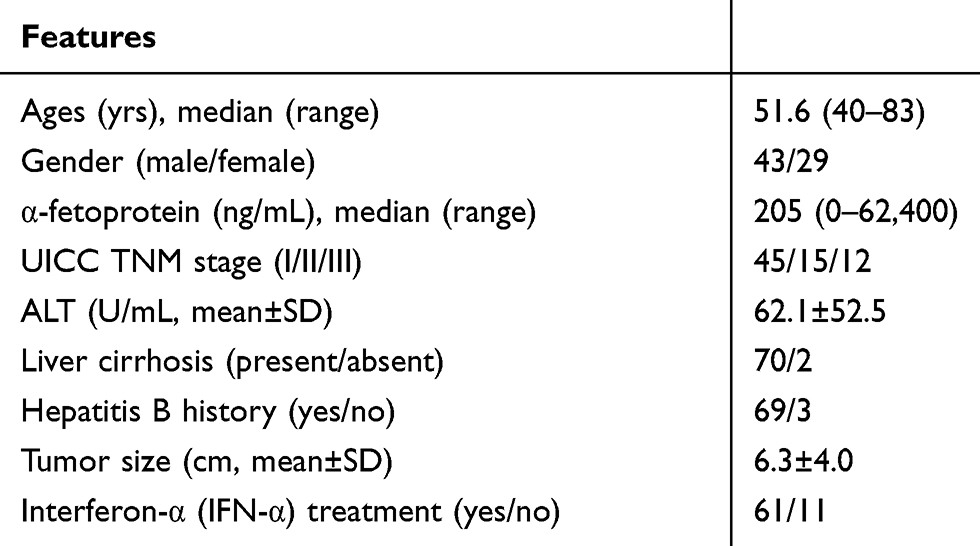 |
Table 1 Clinical Characteristics of the HCC Patients |
Immunohistochemistry (IHC)
A pathologist conducted the IHC staining, which helped us assess NR1D2 expression. Slides incubated overnight at 4°C using the primary antibody rabbit anti-NR1D2 (1:200; R&D Systems, Shanghai, China), were infused with secondary antibody (1:1000, Abcam, Shanghai, China) for 30 min at 37°C the following day, and the expression then quantified with ImageJ software.
Cell Culture
The American Type Culture Collection (Manassas, VA, USA) sourced our purchase of immortalized human hepatocyte, namely MIHA and THLE3, as well as HCC cell lines of HCCLM3, HepG2, Huh7, and SK-HEP-1, all of which are commercially available. The latter were cultured in Dulbecco’s modified Eagle medium, or DMEM (Sigma-Aldrich, Shanghai, China) after supplementing 10% foetal bovine serum, or FBS (Invitrogen Gibco, Carlsbad, CA, USA), and then incubated at 37°C in a 5% CO2 incubator.
CCK8 Assay
The cells were cultured to approximately 75% confluence. A CCK8 assay (Thermo Fisher Scientific, Waltham, MA, USA) was carried out to assess cell viability, and the absorbance then was measured at 570 nm.
Reverse-Transcription Quantitative Polymerase Chain Reaction (RT-qPCR)
RT-qPCR was carried out using an ABI PRISM 7500 sequence detection system (Applied Biosystems, Foster City, CA, USA). All gene transcripts were quantified by RT-qPCR with the Power SYBR Green PCR Master Mix and the ABI StepOnePlus System (Applied Biosystems). The forward primer sequences for NR1D2 and GAPDH, the internal control, were 5ʹ-TTTAGTGGCATGGTTCTACTGTG-3ʹ and 5ʹ-AGCCTTCGCAAGCATGAACT-3ʹ, respectively, and the reverse sequences were Forward 5ʹ-CGCGCCCCCGGTTTCTA-3ʹ and Reverse 5ʹ-GGCTCGGCTGGCGAC-3ʹ,24 respectively. The 2−ΔΔCt method was applied to calculate relative mRNA expression.
Western Blot (WB) Analysis
Total protein was extracted using radioimmunoprecipitation assay (RIPA) buffer (Sigma-Aldrich, St. Louis, MO, USA), and protein concentrations were assessed using the BCA Protein Assay Kit (Beyotime, Shanghai, China). The total proteins separated via gel electrophoresis using a 10% sodium dodecyl sulphate polyacrylamide gel were then transferred to polyvinylidene fluoride membranes, which, after an approximately 60-min blocking in 5% bovine serum albumin, were incubated overnight at 4°C with β-actin (1:2000; Cell Signaling Technology, Danvers, MA, USA), NR1D2 (1:1000; R&D Systems), E-cadherin (1:1000; Abcam), N-cadherin (1:1000; Abcam), vimentin, activated β-catenin (1:1000; Cell Signaling Technology), and total β-catenin (1:1000; Cell Signaling Technology) antibodies. A horseradish peroxidase-conjugated goat anti-rabbit IgG (1:1000, Beyotime, Shanghai, China) secondary antibody was then applied for 60 min at 37°C. β-actin internally controlled all Western blots. The Bio-Rad Quantity One software (Bio-Rad, Hercules, CA, USA) helped quantify protein expression.
Lentivirus Infection
We obtained a commercial sample of the lentiviral short hairpin RNA, or shRNA construct targeting NR1D2, and built two shRNA sequences, which interfered with human NR1D2 (cat. no. SHCLNV-NM_005126, Merck Life Science Co., Ltd., Shanghai, China; Table 1). Oligonucleotides were then phosphorylated and annealed into the pLKO.1-cloning vector (Sigma-Aldrich). Lentivirus-overexpressing β-catenin particles and overexpressing control particles (overexpression control group, OE-NC) were purchased from GenePharma Co., Ltd. (Shanghai, China). Lentivirus infection was executed as per manufacturer directives. The cells were first incubated in a growth medium, with lentivirus particles and polybrene (1 μg/mL), and the infection medium replaced after 18 h. Transfected cells, after 48 h, were screened with 1 µg/mL puromycin for 7 days, to yield stable NR1D2-knockdown cell lines. RT-qPCR and Western blot (WB) analyses quantified NR1D2 expression. Subsequent experiments utilized these stable transfected cells.
Colony Formation Assay
Colony formation assays conducted, as previously described,25 entailed seeding cells in a 6-well plate, at a 400-cells-per-well density, subsequent to lentivirus infection for 72 h, culturing those cells for 10 days in 5% CO2 at 37°C, fixing the colonies for 15 min with 4% paraformaldehyde, and then staining for 5 min using Giemsa solution (#G5637; Sigma-Aldrich, St. Louis, MO, USA). A microscope helped count single colonies comprising over 50 cells. All experiments were done in triplicate wells, with the assays repeated thrice.
Flow Cytometry Analysis
The expression of NR1D2 was analysed by flow cytometry at 72 h after lentivirus infection. The target cells incubated for 30 min at 4°C with anti-human NR1D2 PE and its isotype control (R&D Systems), and then washed and examined via a FACSCanto flow cytometer. FlowJo vX software was used for data analysis.
Wound Healing Assay
The cells seeded into 12-well plates were cultured to approximately 100% confluence, and a pipette tip was used to scratch a straight line wound in the cell layer. The cells washed with PBS were then treated with DMEM, minus FBS. Cell migration was captured with photographs, and the wound width measured.
Transwell Migration Assay
Cell culture inserts were seeded (24-well, pore size 8 μm; Sigma-Aldrich) with approximately 1 × 10⁵ cells in 200 μL DMEM, minus FBS. DMEM with 5% FBS (500 μL) that served as a chemotactic agent, was supplemented in the lower chamber, and 12 h later, a cotton-tipped swab was used to remove cells on the upper side of the membrane, whereas the lower cells were fixed with 4% paraformaldehyde. Cells were counted subsequent to 0.1% crystal violet staining. Experiments were separately conducted with inserts in triplicates, and five microscopic fields counted per insert.
Transwell Invasion Assay
Matrigel (BD Biosciences, San Jose, CA, USA) was supplemented to each well, as per manufacturer directives, prior to seeding cells (2 × 10⁵) on the upper chamber. Incubation at 37°C for 24 h yielded non-invasive cells at the top of matrigel, which were gently removed using a cotton-tipped swab. Invasive cells at the matrigel base were fixed in 4% paraformaldehyde, and counted after 0.1% crystal violet staining. Experiments were separately executed with inserts in triplicate, and five microscopic fields counted per insert.
In vivo Model of Tumor Pulmonary Metastasis
The Institutional Animal Research Committee at Shanghai Jiao Tong University School of Medicine’s Ruijin Hospital approved the animal study. All animal studies must follow the ARRIVE guidelines (Supplemental Material 1). Our study model was based on an established model from a previous study of pulmonary metastasis in nude mice by subcutaneous injection.26 Briefly, 12 BALB/c nude mice, 5 weeks old and weighing 18–20 g (SLAC laboratory animal C), were reared within specific pathogen free, or SPF grade settings and fed a sterilized diet, whilst maintaining 18–22°C temperatures, 50–60%, humidity, ammonia concentrations below 20 ppm, and 10–20 times/h ventilation frequency. These mice were injected with HCCLM3 cells, and randomized into an NC group that was without scrambled shRNA, and an sh group, with lentiviral shRNA transfection. The mice (n = 6 per group), subcutaneously inoculated with 1 × 10⁷ HCCLM3 cells suspended in PBS, were monitored daily for tumour volumes, and sacrificed 6 weeks later. The formula: V (cm3) = width2 (cm2) × length (cm)/2 was used to calculate tumour volumes. The lungs were thereafter harvested, and examined for metastatic foci. A dissecting microscope was used to count metastatic nodules on the H&E-stained lung surface.
Statistical Analysis
SPSS 20.0 software (IBM Corp., Armonk, NY, USA) helped perform all statistical analyses. Experiments were conducted in triplicates at least, and data presented as mean ± standard deviations. The two-tailed Student’s t-test assessed statistical significance; a one-way variance analysis with Dunnett’s test was used when comparing two groups. Repeated measures ANOVA was used to compare the tumour volume between two groups in the in vivo assay. For analysis of relationship between NR1D2 expression and clinical pathological features, chi-square tests were performed. A Cox regression model was also performed to analyze whether NR1D2 can be used as a prognostic factor for HCC patients. P-values ≤0.05 were considered statistically significant.
Results
Upregulated NR1D2 mRNA Expressions in HCC Tissues are Related to Poor Survival
The ProgeneV2 prognostic database analysis indicated increased NR1D2 mRNA expression in HCC tissue correlated with poor OS (high NR1D2, n = 40; low NR1D2, n = 40; hazard ratio = 3.1, P = 0.046) (Figure 1).
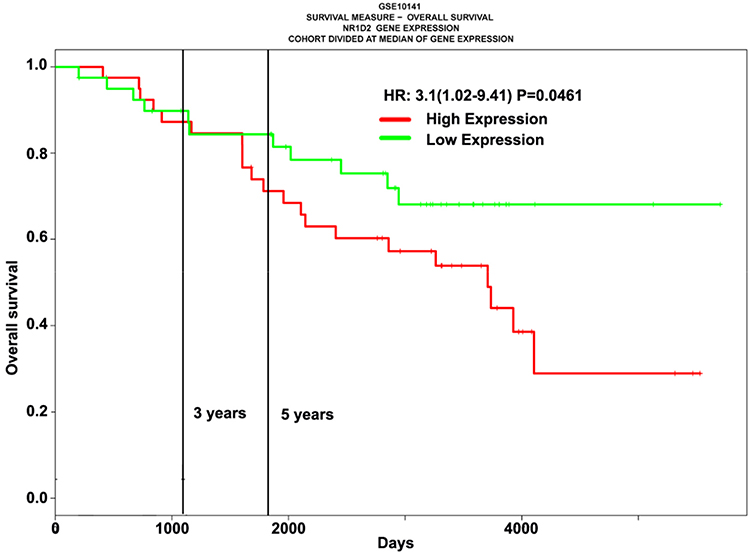 |
Figure 1 High NR1D2 mRNA levels in hepatocellular carcinoma tissues are associated with poor overall survival. Analysis of the ProgeneV2 prognostic database. Overall survival curve of patients with high and low nuclear hormone receptor NR1D2 mRNA expression. Statistical analysis was performed using the Log rank test. |
NR1D2 Levels Were Higher in HCC and Associated with TNM Stage. Moreover, NR1D2 Expression Was an Independent Risk Factor for HCC
IHC revealed significantly higher NR1D2 levels in HCC, relative to adjoining non-cancerous tissues (Figure 2A and B; P <0.05), evaluated via WB and PCR. Adjoining non-cancerous tissue revealed smaller NR1D2 mRNA levels, as compared to HCC tissue (Figure 2C and D; P < 0.05). Moreover, higher NR1D2 mRNA and protein levels were reported in HCC cell lines, which include HCCLM3, HepG2, Huh7, and SK-HEP-1, than in natural hepatocyte THLE3 and MIHA cell lines (Figure 2E and F; P < 0.05).
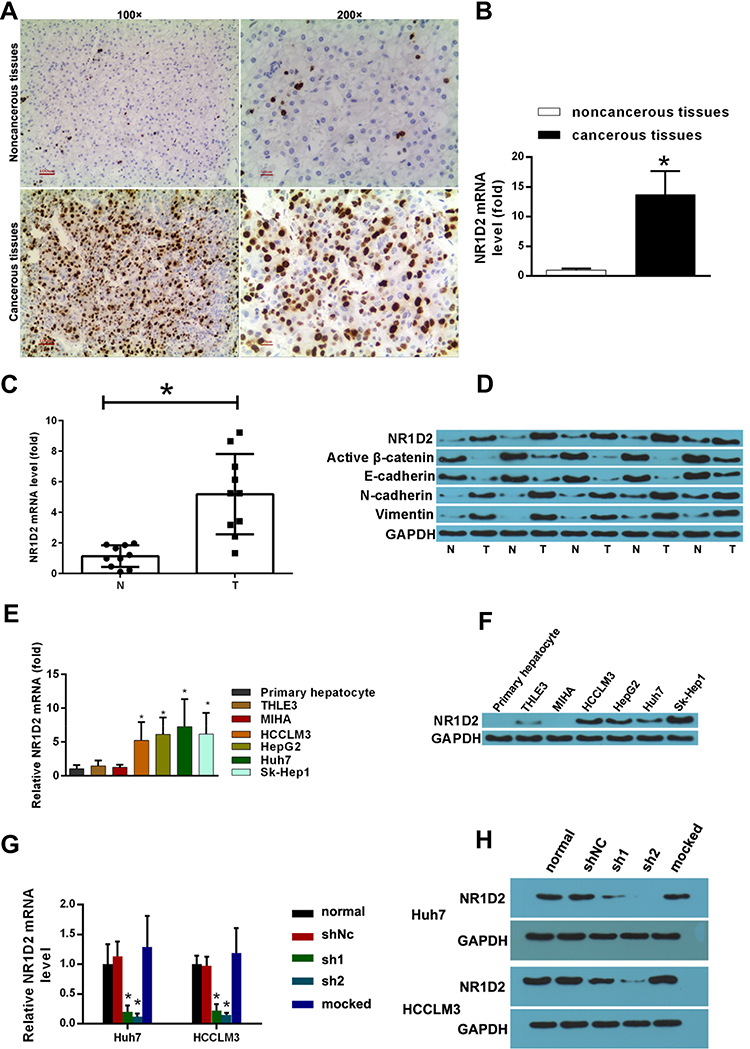 |
Figure 2 Expression of NR1D2 in hepatocellular carcinoma and the establishment of NR1D2-knockdown cells. (A and B) Immunohistochemical staining for NR1D2 expression in hepatocellular carcinoma (HCC) tissues. Representative image of HCC tissues and adjacent matched noncancerous tissues (magnification: 100×, 200×); Paired t-test was used to compare the expression levels of NR1D2 in HCC tissues and adjacent matched noncancerous tissues. *P < 0.05, significantly different compared with adjacent matched noncancerous tissues. (C) NR1D2 mRNA levels in HCC and noncancerous tissues (T, tumour tissue; N, adjacent matched noncancerous tissue) were assessed by quantitative polymerase chain reaction analysis (qPCR). Paired t-test was used. *P < 0.05, significantly different compared with adjacent matched noncancerous tissues. (D) NR1D2, activated β-catenin, E-cadherin, N-cadherin, and vimentin levels in HCC and noncancerous tissues (T, tumour tissue; N, adjacent matched noncancerous tissue) were assessed by Western blot (WB) analysis. (E) NR1D2 mRNA levels in HCC cell lines (HCCLM3, HepG2, Huh7, and SK-HEP-1), normal hepatocyte cell lines, and primary hepatocytes (THLE3 and MIHA) assessed by qPCR. The independent Student’s t test was used to compare gene expression between two groups. *P < 0.05, significantly different compared with THLE3 cells. (F) NR1D2 mRNA levels in HCC cell lines (HCCLM3, HepG2, Huh7, and SK-HEP-1), normal hepatocyte cell lines (THLE3 and MIHA), and primary hepatocytes assessed by WB. The images are representative of five independent experiments. (G) NR1D2 mRNA levels analysed by qPCR. The independent Student’s t-test was used to compare gene expression between two groups. *P < 0.05, significantly different compared with the normal group. The data are presented as mean ± standard deviations. Each experiment was repeated at least five times. shNC, control short hairpin RNA group; sh1, short hairpin RNA1; sh2, short hairpin RNA2; mock, mock treatment. (H) Protein expression of NR1D2 analysed by WB. The images are representative of five independent experiments. |
To investigate the correlation of NR1D2 expression and clinical features, using the 13-point score analysis of IHC,20 single-factor analysis were performed. NR1D2 expression was associated with TNM stage (P < 0.05, Table 3). Moreover, a Cox regression model analysis was carried out to analyze the correlation of NR1D2 and the prognosis of HCC. The regression analysis showed that NR1D2 expression was a prognostic factor of HCC patients (P < 0.05, Table 4).
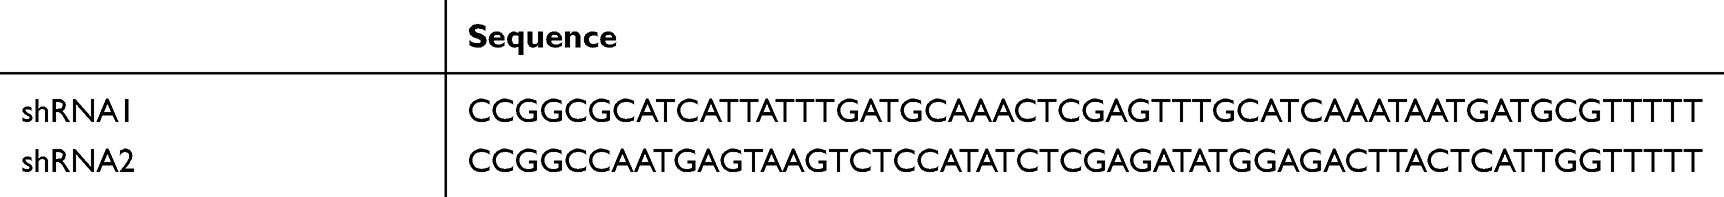 |
Table 2 Short Hairpin RNAs Sequences Interfering Human NR1D2 |
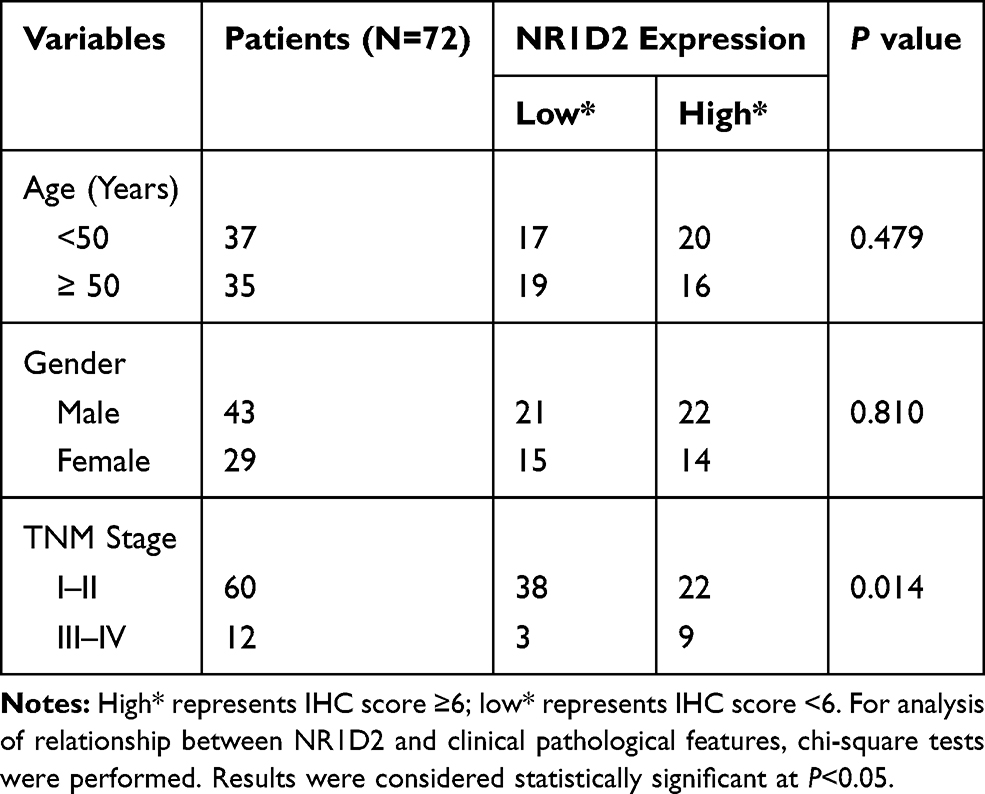 |
Table 3 Correlation Between NR1D2 and Clinical Pathological Features |
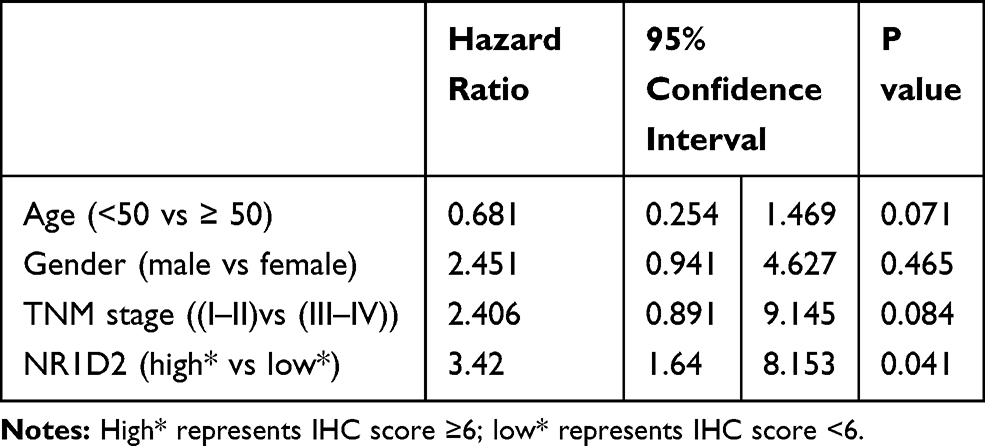 |
Table 4 NR1D2 Levels Were a Prognostic Factor for HCC Patients |
Downregulate NR1D2 Levels in Huh7 and HCCLM3 Cell Lines by shRNAs
To investigate the regulating mechanisms of an NR1D2 and HCC correlation, we depicted the cellular effects when deploying lentiviral RNA interference vectors expressing shRNA, namely sh-NR1D2, for a stable NR1D2 expression knockdown in human HCC Huh7 and HCCLM3 cell lines. Protein and NR1D2 mRNA levels were examined 72 h after lentivirus infection (Figure 2G and H; P < 0.05). Moreover, the time course of the expression of NR1D2 after lentivirus infection was analysed and is shown in Supplemental Material 1. The expression of NR1D2 was analysed by flow cytometry at 72 h after lentivirus infection (Supplemental Material 2).
NR1D2 mRNA and protein expressions were significantly decreased by shRNA1 and shRNA2 (P < 0.05).
Cell Proliferation and Viability Decrease Due to NR1D2 Knockdown
shRNAs downregulated NR1D2 expression, relative to control groups. CCK8 assayed a significantly reduced cell proliferation, owing to NR1D2 knockdown, at 72 h (Figure 3A and B; P < 0.05). Furthermore, significantly less colony formation was observed in the NR1D2 depletion group at day 10 (Figure 3C; P < 0.05).
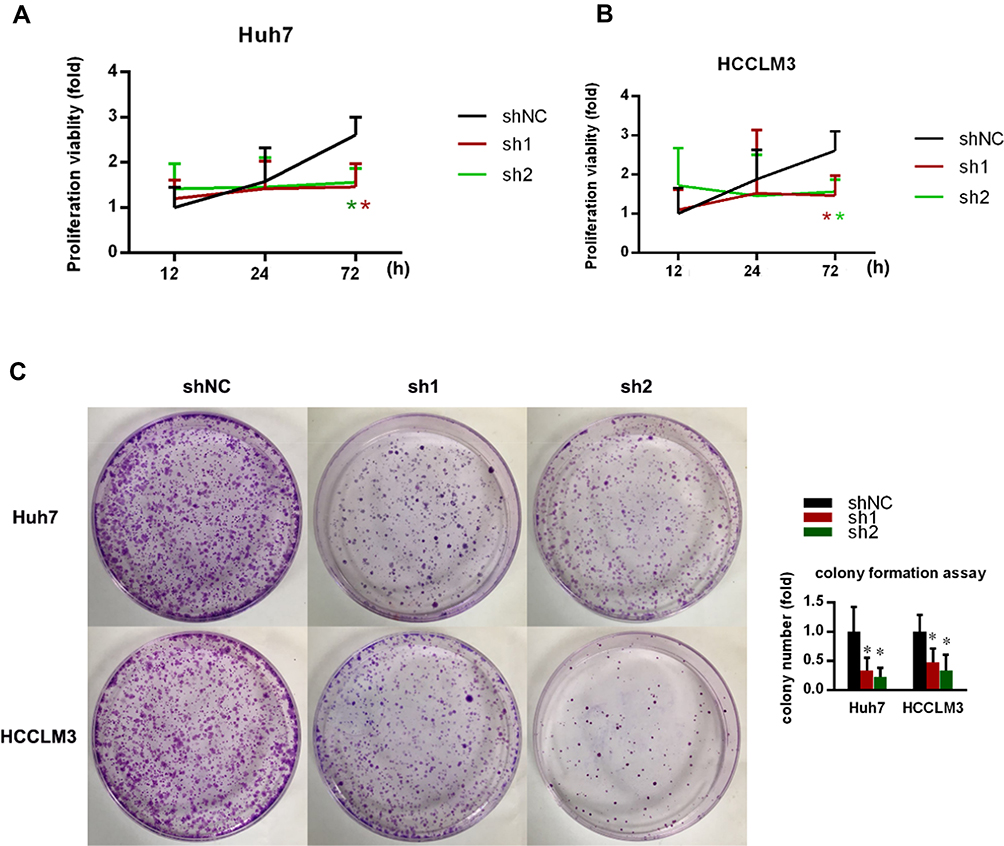 |
Figure 3 The effects of NR1D2 knockdown on cell proliferation. (A) Effect of NR1D2 on cell viability evaluated by a CCK8 assay in Huh7 cells. The relative proliferation rate of Huh7 cells following lentivirus transfection at 12, 24 and 72 h. (B) Effect of NR1D2 on cell viability evaluated by a CCK8 assay in HCCLM3 cells. The relative proliferation rate of HCCLM3 cells following lentivirus transfection at 12, 24, and 72 h. (C) Effect of NR1D2 on cell viability evaluated by colony formation assay. The data are presented as mean ± standard deviations. Each experiment was repeated at least five times. shNC, control short hairpin RNA group; sh1, short hairpin RNA1; sh2, short hairpin RNA2; The independent Student’s t-test was used. *P < 0.05 compared with the shNC group. |
NR1D2 Knockdown Reduces HCC Cell Migration and Invasion
The colony formation/transwell/invasion assays were normalized by the cell numbers per well. Markedly fewer cells migrated through the pores following suppression of NR1D2 at 12 h (Figure 4A and D). Moreover, significantly fewer cells invaded through the pores following suppression of NR1D2 at 24 h (Figure 4B and E). A wound-healing assay was also carried out to evaluate the role of NR1D2 on cell migration. NR1D2 knockdown significantly decreased the wound-closure capacity of cells at 1 day post-injury (Figure 4C and F).
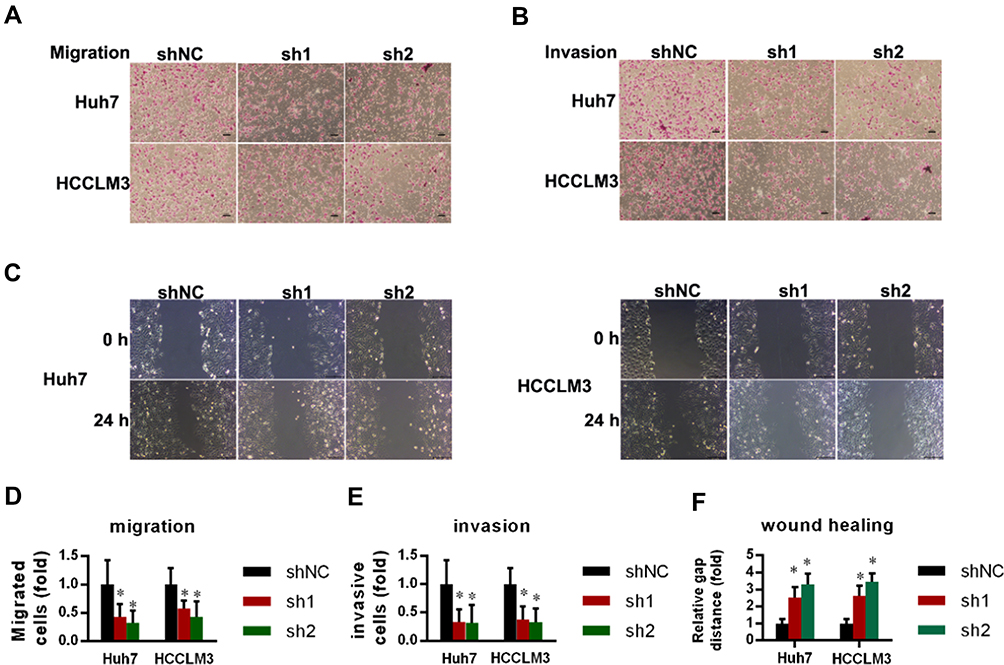 |
Figure 4 NR1D2 knockdown decreased migration and invasion by HCC cell lines. (A and D) A transwell assay was performed to assess cell migration capabilities. The numbers of cells were counted on six microscopic fields per insert (magnification = 200×). The independent Student’s t test was used. *P < 0.05 compared with the shNC group. All data are expressed as mean ± standard deviation. (B and E) A transwell assay was performed to assess the cell invasion capability. The numbers of cells were counted on six microscopic fields per insert (magnification = 200×). The independent Student’s t test was used. *P < 0.05 compared with the shNC group. All data are expressed as mean ± standard deviation. (C and F) Wound-healing assay was performed to evaluate cell migration (magnification = 200×). The images are representative of five independent experiments. The relative widths of the wound gaps were measured using ImageJ software. All data are expressed as mean ± standard deviation. The independent Student’s t-test was used. *P < 0.05 compared with the shNC group. |
NR1D2 Depletion Decreases the EMT in Huh7 and HCCLM3 Cell Lines
The levels of mesenchymal (N-cadherin and vimentin) and epithelial (E-cadherin) markers were evaluated. WB analyses showed that N-cadherin and vimentin were increased due to NR1D2 knockdown. On the contrary, cells with downregulated NR1D2 expression had higher E-cadherin expression (Figure 5).
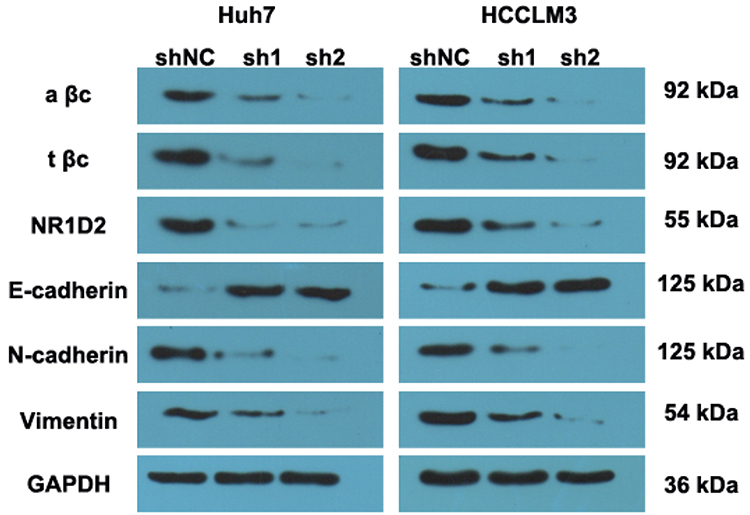 |
Figure 5 NR1D2 knockdown downregulated the expression of epithelial-to-mesenchymal transition (EMT)-associated markers and β-catenin. Images are representative of five independent experiments. Protein levels of E-cadherin, N-cadherin, vimentin, NR1D2 and β-catenin were assessed by WB. A βc, activated β-catenin protein; t βc, total β-catenin protein. |
NR1D2 Depletion Inhibits β-Catenin Signalling
The possible underlying molecular mechanism was investigated by evaluating the Wnt/β-catenin signalling pathway. The downregulation of NR1D2 significantly decreased the levels of total β-catenin and activated β-catenin (Figure 5).
Next, we investigated the effects of lentiviral β-catenin overexpression on E-cadherin, N-cadherin, and vimentin expression in NR1D2-knockdown cells. The cells were pre-treated by β-catenin overexpression for two days. Interestingly, supplementation with the β-catenin-overexpressing lentivirus decreased E-cadherin levels in both the mock-transfected and NR1D2-knockdown cells (Figure 6). On the contrary, the expressions of vimentin and N-cadherin in both the mock-transfected and NR1D2-knockdown cells were significantly upregulated with the β-catenin-overexpressing lentivirus (Figure 6).
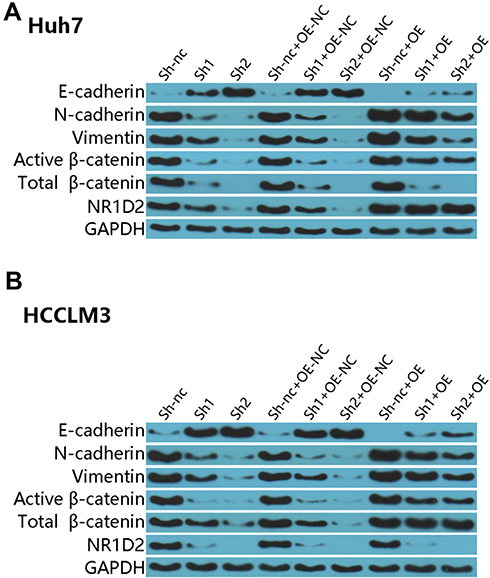 |
Figure 6 The effects of overexpressing β-catenin lentivirus on the expression of EMT markers. Protein levels of E-cadherin, N-cadherin, vimentin and β-catenin were assessed by WB. The images are representative of three independent experiments. A βc, activated β-catenin protein; t βc, total β-catenin protein; shNC, control short hairpin RNA group; sh1, short hairpin RNA1; sh2, short hairpin RNA2; siR, β-catenin siRNA; siRctrl, control siRNA. |
NR1D2 Knockdown Impairs Lung Metastasis in vivo
As shown in Figure 7, the number of lung metastases in the NR1D2-knockdown (sh) group was significantly lower than that in the shNC group. Moreover, the volumes of the HCC xenografts in mice injected with NR1D2-knockdown (sh) cells were notably smaller than those in the controls.
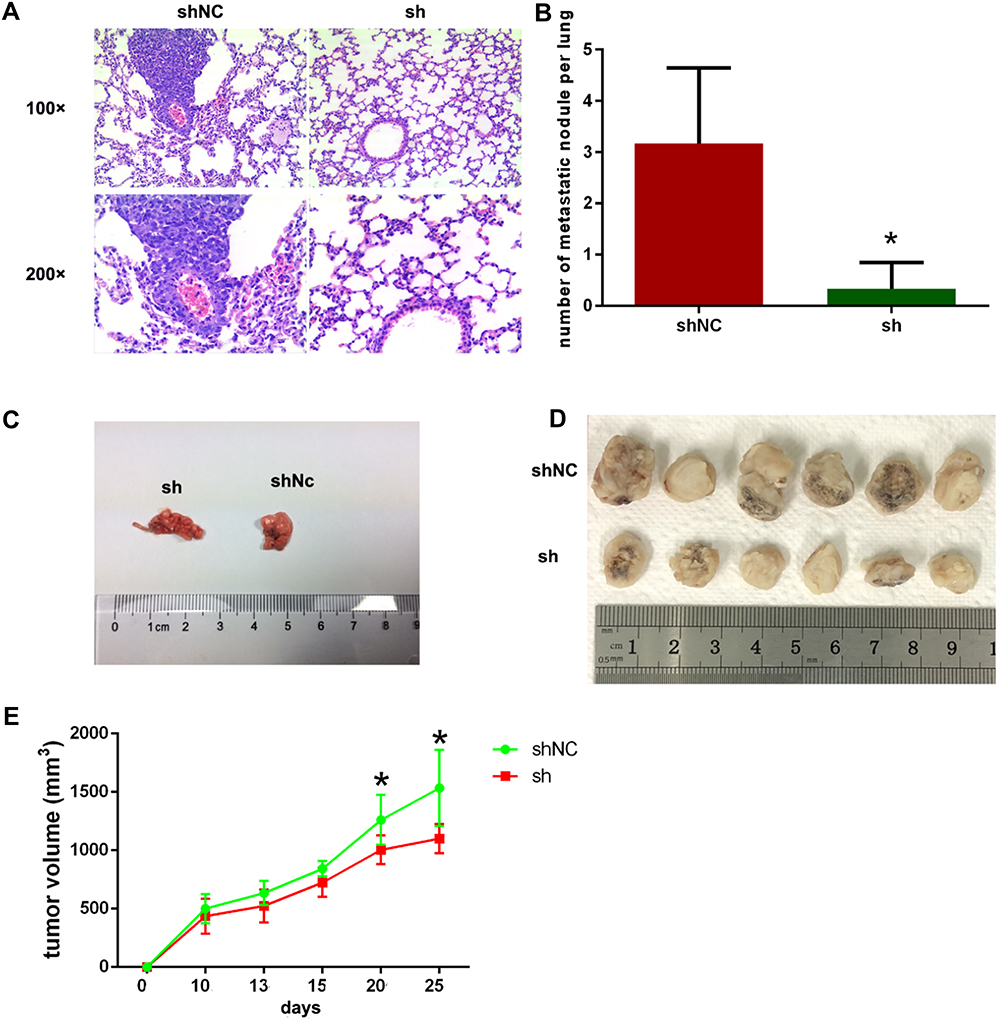 |
Figure 7 Depletion of NR1D2 inhibits growth and lung metastasis in HCCLM3 cells. (A) Haematoxylin and eosin-stained lung sections. (B) The numbers of pulmonary metastasis nodules in the NR1D2-knockdown and control groups were counted (n = 6). All data are expressed as mean ± standard deviation. The independent Student’s t-test was used. *P < 0.05 compared with the shNC group. (C) Gross pathology image showing lung metastasis. (D) Gross images of tumour tissues. (E) Tumour volume at days 0, 10, 15, 20, and 25. sh, NR1D2-knockdown (sh) group. Repeated measures ANOVA was used to compare the tumour volume between two groups. *P < 0.05 compared with the shNC group. |
Discussion
HCC, the sixth most prevalent cancer, registers at least 1 million new cases globally.1 Specific molecular targets that improve outcomes in patients with HCC are urgent, given its prognosis. NR1D2 is a suppressor gene involved in the circadian rhythm.7 Moreover, NR1D2 is a major variant in various cancer cells.6 The bioinformatics analysis we conducted indicated lower NR1D2 expression levels in HCC patients related to a higher survival rate. Also, NR1D2 levels were significantly higher in HCC tissue, relative to adjoining non-cancerous tissues. Furthermore, normal hepatocyte cell lines had lower NR1D2 levels, as compared to HCC cell lines. HCC cells’ proliferation, migration and invasion ability also diminished following downregulated NR1D2 expressions. An in vivo tumour metastasis model helped us investigate NR1D2 role in HCC metastases, and significantly fewer metastatic nodules were detected in lung tissues comprising NR1D2-knockdown cells, which implied that NR1D2 is an HCC tumour-inducing gene.
EMT role in HCC is also attracting interest. Mounting evidence confirms EMT adversely effects HCC survival rates.13 EMT is a complex process wherein epithelial cells lose distinctive features to acquire mesenchymal features such as invasiveness, motility, and even an ability to evade immune system surveillance.21 E-cadherin, an EMT marker, is primarily expressed in epithelial cells, and its decrease or loss activates a series of signalling molecules.22 EMT-induced changes involve amplified expressions of mesenchymal proteins, namely vimentin and N-cadherin.23 Meng et al revealed that driving the EMT accelerated tumour aggressiveness. Similarly, we discovered NR1D2 depletion reduced E-cadherin expression, whilst enhancing those of N-cadherin and vimentin. Furthermore, the lung metastases count in the NR1D2-knockdown group was lower, relative to the shNC group. The volumes of the HCC xenografts in mice injected with NR1D2-knockdown (sh) cells were notably smaller, indicating that NR1D2 promoted the EMT process in HCC cells.
Growing evidence indicates multiple E-cadherin and β-catenin interactions with EMT-inducing transcriptional repressors that stabilize invasive mesenchymal phenotypes in epithelial tumour cells.24 The Wnt/β-catenin signalling pathway contributes to the activation of EMT in cancers.25 Gang et al26 indicated that downregulation of β-catenin in HCC led to decreased proliferation and survival. Likewise, in our study, NR1D2 depletion inhibited β-catenin. Upregulation of β-catenin also rescued the downregulation of EMT-associated markers by NR1D2 knockdown. NR1D2 upregulated the expression of β-catenin to regulate the progression of EMT, in which NR1D2 may bind to the promoter region to promote the transcription of β-catenin (Supplemental Material 4).
Pervious reported demonstrated that ARN5187, a novel lysosomotropic NR1D2 ligand, was an effective strategy for eliciting cytotoxicity in cancer cells.27 Gabriele et al also indicated two agonists of NR1D2 (SR9009 and SR9011) were specifically lethal to cancer cells and oncogene-induced senescent cells.28 These results strongly indicate that pharmacological modulation of NR1D2 is an innovative and selective strategy for cancer treatment.
Our study had several limitations. First, later studies needed to investigate the involvement of other signalling. Recently, Yu et al revealed that NR1D2 regulate EMT by targeting AXL.7 Second, the results should be checked in other HCC cell lines. Third, an overexpression experiment with NR1D2 to promote tumourigenesis will ultimately test the oncogenic function of NR1D2. We intend to carry out the necessary additional studies to complete our analysis of NR1D2. Finally, our sample size was very small, which may have resulted in selection bias.
Conclusions
In conclusion, in HCC, NR1D2 accelerates β-catenin-induced EMT.
Data Sharing Statement
The datasets used in this study are available from the corresponding author upon reasonable request.
Ethics and Consent Statement
All patients signed an informed consent form, and the experimental protocol was approved by the Ethics Committee of Ruijin Hospital of Shanghai Jiao Tong University School of Medicine [no. 2014 (PW‑R‑041)]. The present study was approved by the Animal Care and Use Committee of Ruijin Hospital of Shanghai Jiao Tong University School of Medicine.
Author Contributions
All authors contributed to data analysis, drafting and revising the article, gave final approval of the version to be published, and agree to be accountable for all aspects of the work.
Funding
This study was sponsored by the sub subject of biological medicine of Science and Technology Commission of Shanghai Municipality (15411950404).
Disclosure
The authors declare that they have no competing interests in this work.
References
1. Bray F, Ferlay J, Soerjomataram I, Siegel RL, Torre LA, Jemal A. Global cancer statistics 2018: GLOBOCAN estimates of incidence and mortality worldwide for 36 cancers in 185 countries. CA Cancer J Clin. 2018;68(6):394–424. doi:10.3322/caac.21492
2. Dong B, Lee JS, Park YY, et al. Activating CAR and beta-catenin induces uncontrolled liver growth and tumorigenesis. Nat Commun. 2015;6(1):5944. doi:10.1038/ncomms6944
3. Zeng B, Lin Z, Ye H, et al. Upregulation of LncDQ is associated with poor prognosis and promotes tumor progression via epigenetic regulation of the EMT pathway in HCC. Cell Physiol Biochem. 2018;46(3):1122–1133. doi:10.1159/000488841
4. Hastings MH, Reddy AB, Maywood ES. A clockwork web: circadian timing in brain and periphery, in health and disease. Nat Rev Neurosci. 2003;4(8):649–661. doi:10.1038/nrn1177
5. Ercolani L, Ferrari A, De Mei C, Parodi C, Wade M, Grimaldi B. Circadian clock: time for novel anticancer strategies? Pharmacol Res. 2015;100:288–295. doi:10.1016/j.phrs.2015.08.008
6. Chauvet C, Vanhoutteghem A, Duhem C, et al. Control of gene expression by the retinoic acid-related orphan receptor alpha in HepG2 human hepatoma cells. PloS one. 2011;6(7):e22545. doi:10.1371/journal.pone.0022545
7. Yu M, Li W, Wang Q, Wang Y, Lu F. Circadian regulator NR1D2 regulates glioblastoma cell proliferation and motility. Oncogene. 2018;37(35):4838–4853. doi:10.1038/s41388-018-0319-8
8. Giannelli G, Koudelkova P, Dituri F, Mikulits W. Role of epithelial to mesenchymal transition in hepatocellular carcinoma. J Hepatol. 2016;65(4):798–808. doi:10.1016/j.jhep.2016.05.007
9. Ma CQ, Yang Y, Wang JM, et al. The aPKCiota blocking agent ATM negatively regulates EMT and invasion of hepatocellular carcinoma. Cell Death Dis. 2014;5(3):e1129. doi:10.1038/cddis.2014.91
10. Yang Y, Zhang N, Zhu J, et al. Downregulated connexin32 promotes EMT through the Wnt/β-catenin pathway by targeting snail expression in hepatocellular carcinoma. Int J Oncol. 2017;50(6):1977–1988. doi:10.3892/ijo.2017.3985
11. Yang HD, Eun JW, Lee KB, et al. T-cell immune regulator 1 enhances metastasis in hepatocellular carcinoma. Exp Mol Med. 2018;50(1):e420. doi:10.1038/emm.2017.166
12. Wang M, Zhang L, Liu Z, et al. AGO1 may influence the prognosis of hepatocellular carcinoma through TGF-beta pathway. Cell Death Dis. 2018;9(3):324. doi:10.1038/s41419-018-0338-y
13. Kodama T, Newberg JY, Kodama M, et al. Transposon mutagenesis identifies genes and cellular processes driving epithelial-mesenchymal transition in hepatocellular carcinoma. Proc Natl Acad Sci U S A. 2016;113(24):E3384–93. doi:10.1073/pnas.1606876113
14. Huang M, Wu S, Hu Q, et al. Agkihpin, a novel SVAE may inhibit the migration and invasion of liver cancer cells associated with the inversion of EMT induced by Wnt/beta-catenin signaling inhibition. Biochem Biophys Res Commun. 2016;479(2):283–289. doi:10.1016/j.bbrc.2016.09.060
15. Yang M, Li SN, Anjum KM, et al. A double-negative feedback loop between Wnt-beta-catenin signaling and HNF4alpha regulates epithelial-mesenchymal transition in hepatocellular carcinoma. J Cell Sci. 2013;126(24):5692–5703. doi:10.1242/jcs.135053
16. Yang S, Liu Y, Li MY, et al. FOXP3 promotes tumor growth and metastasis by activating Wnt/beta-catenin signaling pathway and EMT in non-small cell lung cancer. Mol Cancer. 2017;16(1):124. doi:10.1186/s12943-017-0700-1
17. Zhang Q, Bai X, Chen W, et al. Wnt/beta-catenin signaling enhances hypoxia-induced epithelial-mesenchymal transition in hepatocellular carcinoma via crosstalk with hif-1alpha signaling. Carcinogenesis. 2013;34(5):962–973. doi:10.1093/carcin/bgt027
18. Luo L, McGarvey P, Madhavan S, Kumar R, Gusev Y, Upadhyay G. Distinct lymphocyte antigens 6 (Ly6) family members Ly6D, Ly6E, Ly6K and Ly6H drive tumorigenesis and clinical outcome. Oncotarget. 2016;7(10):11165–11193. doi:10.18632/oncotarget.7163
19. Goswami CP, Nakshatri H. PROGgeneV2: enhancements on the existing database. BMC Cancer. 2014;14(1):970. doi:10.1186/1471-2407-14-970
20. Li X, Huang L, Gao W. Overexpression of tripartite motif conaining 55 (TRIM55) inhibits migration and invasion of hepatocellular carcinoma (HCC) cells via epithelial-mesenchymal transition and matrix metalloproteinase-2 (MMP2). Med Sci Monit. 2019;25:771–777. doi:10.12659/MSM.910984
21. Jayachandran A, Dhungel B, Steel JC. Epithelial-to-mesenchymal plasticity of cancer stem cells: therapeutic targets in hepatocellular carcinoma. J Hematol Oncol. 2016;9(1):74. doi:10.1186/s13045-016-0307-9
22. Savagner P. Epithelial-mesenchymal transitions: from cell plasticity to concept elasticity. Curr Top Dev Biol. 2015;112:273–300. doi:10.1016/bs.ctdb.2014.11.021
23. Liu H, Yin J, Wang H, et al. FOXO3a modulates WNT/β-catenin signaling and suppresses epithelial-to-mesenchymal transition in prostate cancer cells. Cellular Signalling. 2015;27(3):510–518. doi:10.1016/j.cellsig.2015.01.001
24. Schmalhofer O, Brabletz S, Brabletz T. E-cadherin, beta-catenin, and ZEB1 in malignant progression of cancer. Cancer Metastasis Rev. 2009;28(1–2):151–166. doi:10.1007/s10555-008-9179-y
25. Jiang YG, Luo Y, He DL, et al. Role of Wnt/beta-catenin signaling pathway in epithelial-mesenchymal transition of human prostate cancer induced by hypoxia-inducible factor-1alpha. Int J Urol. 2007;14(11):1034–1039. doi:10.1111/j.1442-2042.2007.01866.x
26. Zeng G, Apte U, Cieply B, Singh S, Monga SPS. siRNA-mediated β-catenin knockdown in human hepatoma cells results in decreased growth and survival. Neoplasia. 2007;9(11):951–959. doi:10.1593/neo.07469
27. De Mei C, Ercolani L, Parodi C, et al. Dual inhibition of REV-ERBbeta and autophagy as a novel pharmacological approach to induce cytotoxicity in cancer cells. Oncogene. 2015;34(20):2597–2608. doi:10.1038/onc.2014.203
28. Sulli G, Rommel A, Wang X, et al. Pharmacological activation of REV-ERBs is lethal in cancer and oncogene-induced senescence. Nature. 2018;553(7688):351–355. doi:10.1038/nature25170
 © 2020 The Author(s). This work is published and licensed by Dove Medical Press Limited. The
full terms of this license are available at https://www.dovepress.com/terms
and incorporate the Creative Commons Attribution
- Non Commercial (unported, 3.0) License.
By accessing the work you hereby accept the Terms. Non-commercial uses of the work are permitted
without any further permission from Dove Medical Press Limited, provided the work is properly
attributed. For permission for commercial use of this work, please see paragraphs 4.2 and 5 of our Terms.
© 2020 The Author(s). This work is published and licensed by Dove Medical Press Limited. The
full terms of this license are available at https://www.dovepress.com/terms
and incorporate the Creative Commons Attribution
- Non Commercial (unported, 3.0) License.
By accessing the work you hereby accept the Terms. Non-commercial uses of the work are permitted
without any further permission from Dove Medical Press Limited, provided the work is properly
attributed. For permission for commercial use of this work, please see paragraphs 4.2 and 5 of our Terms.