Back to Journals » Drug Design, Development and Therapy » Volume 14
Novel Fast and Reliable Method for Nano-Erythrosome Production Using Shear Force
Authors Capossela S, Mathew V, Boos M ![]() , Bertolo A, Krupkova O, Stoyanov JV
, Bertolo A, Krupkova O, Stoyanov JV ![]()
Received 15 April 2020
Accepted for publication 7 October 2020
Published 28 October 2020 Volume 2020:14 Pages 4547—4560
DOI https://doi.org/10.2147/DDDT.S258368
Checked for plagiarism Yes
Review by Single anonymous peer review
Peer reviewer comments 2
Editor who approved publication: Professor Manfred Ogris
Simona Capossela,1 Vikas Mathew,1 Manuela Boos,2 Alessandro Bertolo,1 Olga Krupkova,2– 4 Jivko V Stoyanov1,5
1SCI Biobanking and Translational Medicine, Swiss Paraplegic Research, Nottwil, Switzerland; 2Institute for Biomechanics, D-HEST, ETH Zurich, Zurich, Switzerland; 3Department of Spinal Surgery, University Hospital Basel, Basel, Switzerland; 4Department of Biomedicine, University of Basel & University Hospital Basel, Basel, Switzerland; 5Center for Applied Biotechnology and Molecular Medicine (CABMM), Zurich, Switzerland
Correspondence: Jivko V Stoyanov
Swiss Paraplegic Research, Nottwil CH-6207, Switzerland
Tel +41 41-939-6635
Fax +41 41-939-6640
Email [email protected]
Purpose: The production of nano-erythrosomes (NEs) by extrusion, which is considered the “gold standard”, has several disadvantages such as difficult equipment assembly, long procedure time, variable pressure, and problems with sterility. An alternative approach, using ultrasound probe, has been shown to overheat the sample and have suboptimal results compared to the extrusion method. In our study, we propose, develop, and test a new method for the fabrication of NEs based on shear force and then compare it to the “gold standard” extrusion approach.
Methods: The new method consists of mechanical shear force disruption of the hemoglobin-depleted erythrocyte ghost membranes, with the aid of a rotor stator based tissue homogenizer. Using the same batches of erythrocyte ghost membranes, we compared NEs produced by shear force to NEs produced by the well-established extrusion approach. NEs were characterized for yield, size, encapsulation efficiency, morphology, and stability by flow cytometry (FC), transmission electron microscopy (TEM), and zeta potential analysis.
Results: The shear force based process was easier to set up, significantly faster, had better sterility control, and decreased variability between batches. The shear force method generated NEs with the desired size distribution (particles diameter ∼ 125 nm), which were morphologically and functionally equivalent to the NEs produced by extrusion. NEs produced by shear force were stable in terms of counts, size, and fluorescence intensity for 3 weeks at +4°C. Moreover, they showed colloidal stability and minimal influence to centrifugal stress, turbulence shock, and hemolytic potential.
Conclusion: The newly proposed shear force method allows faster, easier, and highly reproducible NEs production when compared to the conventional extrusion approach. The new setup allows simultaneous production of sterile batches of NEs, which have homogenous size distribution, good stability, and improved shelf life storage. The ability of the shear force method to process also high concentration samples indicates a future potential development of large-scale NEs production and industrial application, which has been a challenge for the extrusion method.
Keywords: erythrocytes, nanotechnology, nanoerythrosomes, extrusion, shear force, new method
Introduction
Nanotechnology-based drug carriers have emerged, in the last decade, as a promising delivery system to enhance the bioavailability and half-life of drugs, reducing deleterious side-effects caused by their toxicity or instability.1 In the field of personalized medicine, the use of autologous nanocarriers, based on erythrocytes (RBC, red blood cells), is seen as one of the most feasible and promising approaches.
Erythrocytes are readily available and their extraction by phlebotomy is both minimally invasive and routine, which improves the safety of the patient. Use of preparation based on own blood cells is 100% biocompatible and the use of membranes from blood group compatible donors is also non-immunogenic. Erythrocytes have a long circulating half-life in the circulatory system (8.5 weeks) and remarkable in vitro and in vivo stability.2–5 When hemoglobin is removed from the erythrocytes, usually by a hypo-osmotic method, the empty erythrocyte membrane is called an erythrocyte ghost. Such ghosts can be seen with conventional phase contrast microscopy, loaded with pharmaceutical molecules and used as supercarriers for drugs, biologicals, and nanoparticles delivery systems.6 Developing of RBC-hitchhiked nanoparticles improved their delivery to chosen organs,7 compared to free nanoparticles, which accumulate in liver and spleen rapidly after injection.8
To improve cellular uptake, the diameter of the drug carriers need be be reduced to nanoscale,9 therefore erythrocyte membrane derived nano-erythrosomes (NEs) were developed as efficient drug carriers.10 NEs blend the favorable characteristics of having erythrocyte membranes with enhanced pharmacokinetics and bio-distribution properties, which are typical for nano-sized particles.11–14 Until now, NEs with an average diameter of 100–200 nm could be produced from the erythrocyte ghosts by two main methods – sonication and extrusion – or some combination between them.11,14 During the sonication process erythrocyte ghosts can be converted into small vesicles using pulsed, high frequency sound waves.15 The major drawbacks in the sonication procedure include overheating of the sample, due to high sonic energy transfer, leading to release of metal particles and denaturation or inactivation of some thermolabile agents to be encapsulated. This can be partially solved using a bath type instead of probe tip type sonicator device, but the process is much slower and less efficient.15 Another disadvantage is that the sonication process is not easily reproducible, resulting in variable sizes of the particles obtained, and depending on the time of sonication employed.16
Therefore, extrusion has so far been the most used procedure to produce NEs.12,13,17 It consists of consecutive physical extrusion cycles of erythrocyte ghosts through polycarbonate membrane filters of defined pore size (from 0.1–1 μm), using compressed air or, preferably, to avoid oxidation, compressed nitrogen gas pressure, at 37°C in a thermostatically controlled extrusion device.11 A broad range of pressure might be required to carry out an extrusion cycle, as pressure is highly dependent on the pore size of the membrane and the type of vesicles being extruded.14,18,19 Variable pressure and difficult assembling are some of the disadvantages of the extrusion process, along with the long procedure time, necessity of repeated cycles, experiencing leaks and concerns regarding process reproducibility, sample sterility, and sample recovery.20 Furthermore, when using concentrated suspensions, the membrane filter pores have the tendency to get clogged. The following retrieval of the unfiltered sample and the replacing of the filter prolongs the processing time, compromises the sterility, and results in sample loss, which makes it difficult to quantify the yield and efficiency of the process.
Facing the above described issues and considering the fact that NEs seem to self-assemble by two distinctively different methods (sonication and extrusion),20 we made the hypothesis that a new method, which uses a more controllable physical force and cleaner, streamlined process, can produce NEs with equivalent properties. Here we develop an approach for NEs production based on mechanical disruption of erythrocyte membranes using shear force, generated with a rotor stator based tissue homogenizer. Morphological and functional characteristics of the NEs produced by shear force were analyzed and compared to NEs produced with the conventional extrusion method.
Finally, NEs produced by shear force were tested as carriers of a bioactive compound present in green tea, Epigallocatechin 3-gallate (EGCG), which was been shown to possess significant anti-inflammatory and anti-catabolic effects on intervertebral disc cells in vitro.21 Moreover, EGCG encapsulated in nanoparticles showed an inhibitory effect on human breast cancer cells.22 In our study, EGCG loaded NEs produced by shear force were tested for stability in terms of zeta potential, hemolysis rate, turbulence stress, and in vitro release of drug.
Materials and Methods
Ethics Statement
This study was approved by Ethikkommision Nordwest-und Zentralschweiz (EKNZ, Project-ID: 11042 PB_2016-02608, approved Dec 2016). Written informed consent from volunteer donors was obtained for the use of blood samples. The study was conducted in accordance with the Declaration of Helsinki.
Preparation of Human Erythrocyte Ghosts
Human blood (8 mL) from three healthy volunteers was collected in EDTA monovette tubes (Sarstedt, Sevelen, Switzerland) after signing written informed consent. To prepare erythrocyte ghosts, 2.5 mL of blood was lysed with 45 mL of 1X ACK (Ammonium-Chloride-Potassium) pH 7.3 lysing buffer: (155 mM NH4Cl, 10 mM KHCO3, 0.1 mM EDTA; all Axon Lab, Baden-Dättwil, Switzerland) for 5 minutes, until the suspension clears up. The suspension was then centrifuged at 800 g for 5 minutes to pellet the white blood cells. The supernatant was transferred to a new falcon tube and centrifuged at 15,000 g for 30 minutes to pellet the erythrocyte ghosts, which were then washed in 0.9% NaCl (Axon Lab) to remove the remaining hemoglobin and centrifuged again at 15,000 g for 30 minutes. This step was repeated twice. Finally, the erythrocyte ghosts were resuspended in 5 mL of 0.9% NaCl and counted with a Scepter Handheld Automated Cell Counter and 40 µm sensor (Merck & Cie, Schaffhausen, Switzerland). Erythrocyte ghosts were diluted to 1x10⁹ ghosts/mL in 0.9% NaCl and stored at 4°C.
Substrate Loading and Resealing of Erythrocyte Ghosts
To mimic loading with high molecular weight bioactive drug, we used Fluorescein Isothiocyanate-Dextran (FITC-Dextran) 20 kDa (Sigma-Aldrich Chemie GmbH, Buchs, Switzerland), which was freshly dissolved in 0.09% NaCl to create a stock in hypotonic buffer with a concentration of 5 mg/mL. FITC-Dextran was encapsulated in erythrocyte ghosts using a previously published hypotonic procedure and subsequent resealing of membrane in isotonic solution.23 Briefly, erythrocyte ghosts (1x10⁹ cells/mL) were loaded with 0.6 mg/mL FITC-Dextran in 4.5 mL total volume of hypotonic NaCl solution (30–80 mOsm), for 15 minutes at 4°C. Then, membrane pores were resealed by restoring the isotonicity (~ 300 mOsm) adding hypertonic 7.2% NaCl solution to 5 mL final volume and incubating at 37°C for 1 hour. Empty NEs control samples, without FITC-Dextran, were prepared in parallel with the same erythrocyte ghosts and identical loading and resealing procedures.
Epigallocatechin 3-gallate (EGCG – Sigma-Aldrich Chemie GmbH) was encapsulated in erythrocyte ghosts at a concentration of 2.5 mM using the same procedure. The stock was prepared dissolving EGCG in NaCl 0.9% at a concentration of 10 mM and filtering.
NEs Production by Extrusion Based Method
The extrusion process was done with the medium-sized LiposoFast LF50 pressure extruder device (Avestin Europe Gmbh, Mannheim, Germany). Water from an external water bath was circulated through the extruder in order to perform the process at controlled temperature of 37°C. FITC-Dextran-loaded or control erythrocyte ghost suspension was transferred to the extruder barrel and compressed air pressure of about 4 bar was applied. NEs were obtained by extruding the ghosts sequentially through Whatman Nucleopore polycarbonate hydrophilic membranes (GE Healthcare, Glattbrugg, Switzerland), three times through pore size 1 µm and once through pore size 0.4 µm. The extruder was opened, loaded, and closed between the cycles and it was disassembled and reassembled again to change the filter. Additionally, filtering after extrusion was done through a standard sterile PES syringe filter of pore size 0.22 µm (Cobetter - Chemie Brunschwig AG, Basel, Switzerland).
NEs Production by Shear Force Based Method
The shear force process was done with the gentleMACS dissociator (Miltenyi Biotech GmbH, Bergisch Gladbach, Germany). FITC-Dextran-loaded or control erythrocyte ghost suspension was transferred to gentleMACS C tubes (Miltenyi Biotech GmbH) and subjected to five cycles of gradient shear force. The shear force gradient profile started from 700 rpm to 4,000 rpm in a time period of 40 seconds. The obtained NEs suspension was then filtered through a standard sterile PES syringe filter of pore size 0.22 µm (Cobetter, Brunschwing).
Flow Cytometer (FC) Analysis
FC analysis was performed with a CytoFLEX flow cytometer (Beckman Coulter Life Sciences, Nyon, Switzerland). Data were acquired using the detector configuration violet side scatter (V-SSC) with 405 nm filter. The 488 nm laser was used to detect FITC fluorescence. Each sample was acquired for 1 minute at a flow rate of 10 μL/min. Polystyrene monodisperse micro particle size standards of 100, 200, and 500 nm (Sigma-Aldrich Chemie GmbH) were used to compare the size distribution. The size of NEs was calculated based on violet side scattering geometric mean area of size standards. Data were analyzed using FlowJo v.10.0 software (Treestar, Ashland, OR, USA). The violet side scattering and the FITC fluorescence area response in the logarithmic scale was plotted against the total event counts. The fluorescence was quantified as geometric mean of fluorescence intensity (MFI).
Transmission Electron Microscopy
The morphology and structure of NEs were examined using a transmission electron microscope (FEI Morgagni 268 operated at 100 kV). A carbon coated grid (Quantifoil) was positively glow discharged for 30 seconds to image the structure. A drop of 5 μL NE solution was deposited on the grid and incubated for 5 minutes. The sample was quickly washed in water, partially blotted, and placed upside down on a drop of 2% uranyl acetate for 20 seconds. The grid was picked up with tweezers, excess uranyl acetate was blotted away, and the grid was left to air dry. The dried grids were then imaged at different magnifications.
Encapsulation Efficiency
The percentage of drug that was successfully entrapped into the nanoparticles (% Encapsulation efficiency) was calculated diving the amount of drug entrapped to the total amount of drug added. To calculate the amount of drug entrapped, non-encapsulated free drug was removed from the suspension by centrifuging for 30 minutes at 1,000 g in Amicon ultra centrifugal filter with a 30 kDa cut-off (Sigma-Aldrich Chemie GmbH).
The amount of drug in the FITC-dextran loaded NEs was calculated by FC analysis, measuring the fluorescence intensity geometric mean. The amount of drug in the EGCG loaded NEs was calculated by ferrous tartrate assay, as described before:24, 125 µL of sample were mixed with 125 µL of ferrous tartrate solution and immediately the absorbance was measured at 540 nm in duplicate in transparent 96-well (TPP - Faust Lab Science, Klettgau, Switzerland) using a plate reader (DTX 880 Multimode detector - Beckman Coulter Life Sciences). The ferrous tartrate solution was prepared as follows: 1 g ferrous sulfate and 5 g potassium sodium tartrate tetrahydrate (both Sigma-Aldrich Chemie GmbH) in 1 L distilled water mixed with 0.067 M potassium phosphate buffer (pH 7.5) at a ratio of 1:4. Concentrations were calculated using a standard curve.
Stability Tests
Zeta Potential
The zeta potential of NEs produced by shear force was measured using ZetaView® (Particle Metrix, Germany) instrument. Parameters were adjusted for sensitivity (75), shutter (150), and trace length (15). For each experiment, Nanoparticle Tracking Analysis (NTA) range of measurement and performance quality were established by size-specific calibration beads. Empty control NEs were diluted 1:50 with 0.9% NaCl for measurements. EGCG loaded NEs were measured undiluted. Each sample was measured three times.
Hemolysis
The degree of hemolysis of NEs produced by shear force was measured by incubating empty or EGCG loaded NEs (98%) with blood (2%), at 37°C for 30 minutes in the dark. After centrifugation at 5000 rpm for 10 minutes, the amount of hemoglobin released was measured at 540 nm using a NanoDrop spectrophotometer (Thermo Fisher scientific, Life Technologies Europe B.V., Zug, Switzerland). Data were normalized on 100% of hemolysis caused by distilled water.
Turbulence Stability
EGCG loaded NEs suspension produced by shear force was passed through a 27 gauge L1/2ʹ’ needle (Sterican – B. Braun Medical AG, Sempach, Switzerland) at a flow rate of 10 mL/min, comparable with the blood flow rate in vivo. After 10 and 20 passages, EGCG-NEs were centrifuged for 30 minutes at 1,000 g in Amicon ultra centrifugal filter with a 30 kDa cut-off and the retained EGCG was measured by ferrous tartrate assay, as described above.
Centrifugation Stability
The centrifugation stability was analyzed by centrifuging EGCG loaded NEs at 4,000, 8,000, and 12,000 rpm, for 10 minutes at 4°C. Then, samples were centrifuged for 30 minutes at 1,000 g in Amicon ultra centrifugal filter with a 30 kDa cut-off and the retained EGCG was measured by ferrous tartrate assay, as described above.
In-vitro Release
The in-vitro release of EGCG was analyzed as described by Gupta et al.17 The EGCG-NEs suspension (2 mL) was loaded with a syringe in a dialysis cassette (Slide-A-Lyzer, 3500 MWCO, Thermo Fisher scientific) and the cassette was immersed in a beaker with 200 mL of NaCl 0.9% and placed at 37°C with moderate stirring. At predetermined time intervals (30, 60, 120, and 240 minutes), 200 µl of sample were withdrawn and EGCG concentration was measured by ferrous tartrate assay, as described above. As control, the release of plain EGCG (2.5 mM) was monitored.
Statistical Analysis
For statistical analysis, a non-parametric test (Mann–Whitney U-test) was used to determine the significance levels. For storage stability analysis, a one-way repeated measures ANOVA and post hoc analysis with a Bonferroni adjustment was conducted to determine whether there were statistically significant differences over the time. The assumption of sphericity was met, as assessed by Mauchly’s test of sphericity (P>0.05). Data analysis was performed with SPSS v.24.0 for Windows (SPSS Inc.). Significance indicated as * represents P<0.05.
Results
Shear Force Based Method is Faster and Easier
The erythrocyte ghost suspensions were transferred to sterile homogenization tubes with a plastic blade integrated in the cap and subjected to five cycles of shear force using the tissue homogenizer, as described in the Methods section. The total processing time was about 10 minutes: five times repeated homogenization, each of 40 seconds, followed by the filtration of the obtained NEs suspension through a sterile syringe filter to ensure uniform particle size distribution. The shear force homogenizer did not need assembling or cleaning steps, two samples could be processed at the same time, and the procedure was problem-free.
On the contrary, the extrusion method had the drawback of complicated assembling of the device, the necessity of compressed air, and a water bath circulation to perform the process at controlled temperature of 37°C. Only one-step of one sample could be processed in the extruder device, intermittently cleaning and disinfection was required between samples, without the option of proper sterilization. For these reasons and because of more passages, changing of the membrane filter and extrusion speed, the processing time was much longer compared to the shear force approach. Depending on the sample, the extrusion speed could be very slow, especially at the second or the third passage, and the membrane filters could get clogged, resulting in sample loss and increasing processing time. We timed the total extrusion process between 30 and 60 minutes per sample. Furthermore, the sterility during the extrusion process was not guaranteed, because of opening, disassembling, and re-assembling of the device during repetitive cycles, changing of membrane filters, and processing of different samples.
Briefly, the shear force-based protocol was faster and easier – for example, when processing two samples we had 10 minutes for the shear force method versus up to 120 minutes for the extrusion method. Table 1 compares the shear force and the extrusion methods in terms of processing time, sterility, and ease of use during the assembling, production of NEs, and cleaning steps.
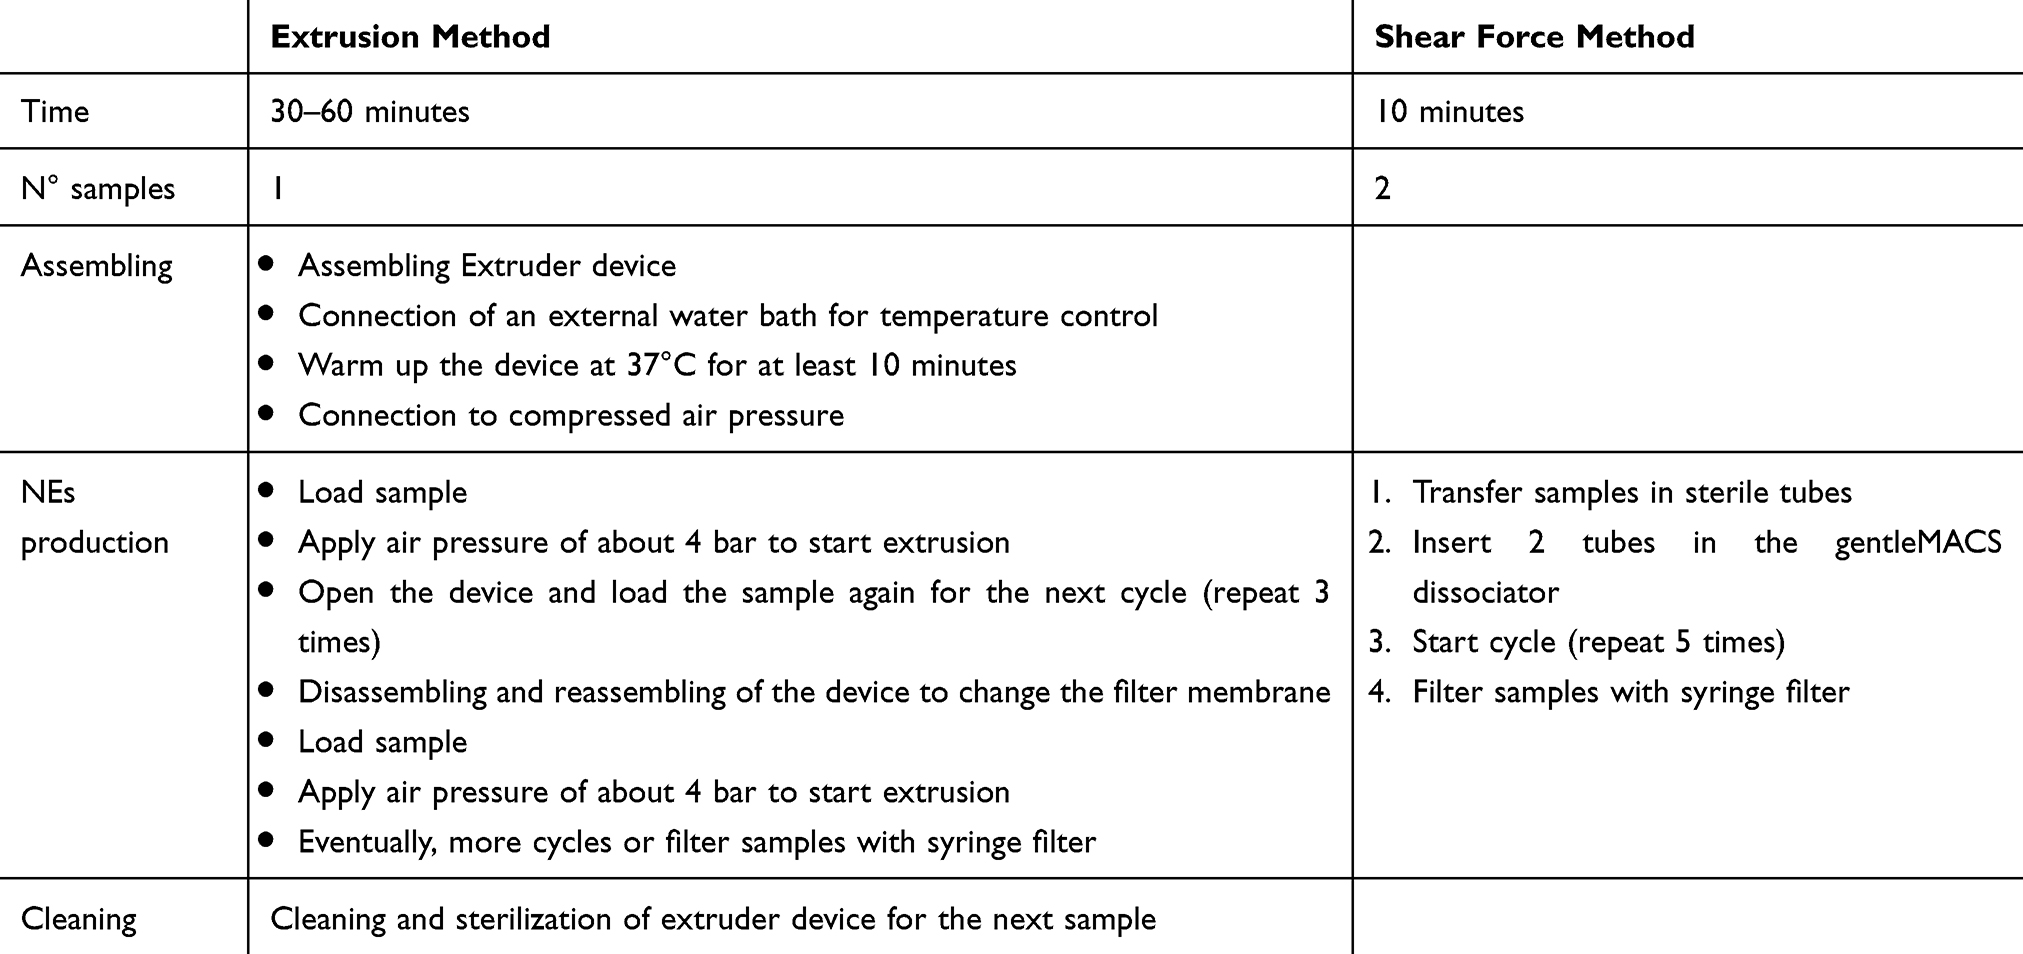 |
Table 1 Comparison of the Extrusion and Shear Force Methods in Terms of Time and Convenience |
Both Methods Have Comparable Total Yield of NEs
Three batches of NEs were produced by shear force and extrusion methods using a range of erythrocyte ghosts in final concentrations of 12.5 up to 200 million ghosts per mL. The total counts of NEs analyzed by FC was plotted against the numbers of erythrocyte ghosts used (Figure 1). The values are expressed per mL of preparation. By both methods, the highest number of NEs was obtained when starting with a high number of ghosts (100–200 million per mL). At these erythrocyte ghost concentrations, both methods resulted in a comparable yield. Low amounts of erythrocyte ghosts showed a better yield by extrusion approach, but the differences were not significant. In the following experiments, we always compared shear force and extrusion NEs production methods using a final concentration of 200 million of ghosts/mL.
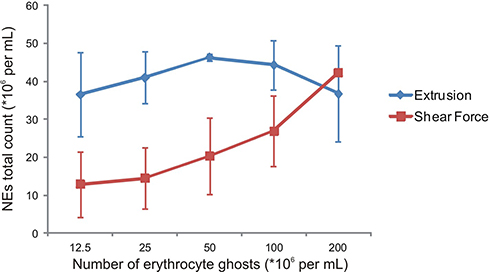 |
Figure 1 Total yield of NEs. Total counts of NEs obtained by extrusion (blue) and shear force (red) method per number of erythrocyte ghosts employed (n=3). Values are expressed per milliliter of preparation. |
Homogenous Size Distribution of NEs Produced by Shear Force
The FC analysis showed a homogenous size distribution of NEs produced by shear force compared to extrusion, which often displayed a second peak of bigger size NEs (observed in five of six samples) (Figure 2A). To remove the second peak, NEs produced by extrusion (n=3) were filtered through a standard syringe filter of pore size 0.22 µm and compared in terms of size and total counts to not-filtered extrusion and shear force samples. Based on standard size profiles, NEs size quantification showed identical diameters: the mean diameter was 125 nm for shear force, 127 nm for the main peak (88% of total NEs) of NEs produced by extrusion, and 125 nm for filtered extrusion samples (Figure 2B). There were no significant differences in total amount of NEs obtained with shear force, extrusion, and extrusion-filtered methods (Figure 2C). The averages of particle size and total counts of six samples with relative standard deviations are represented in Table 2.
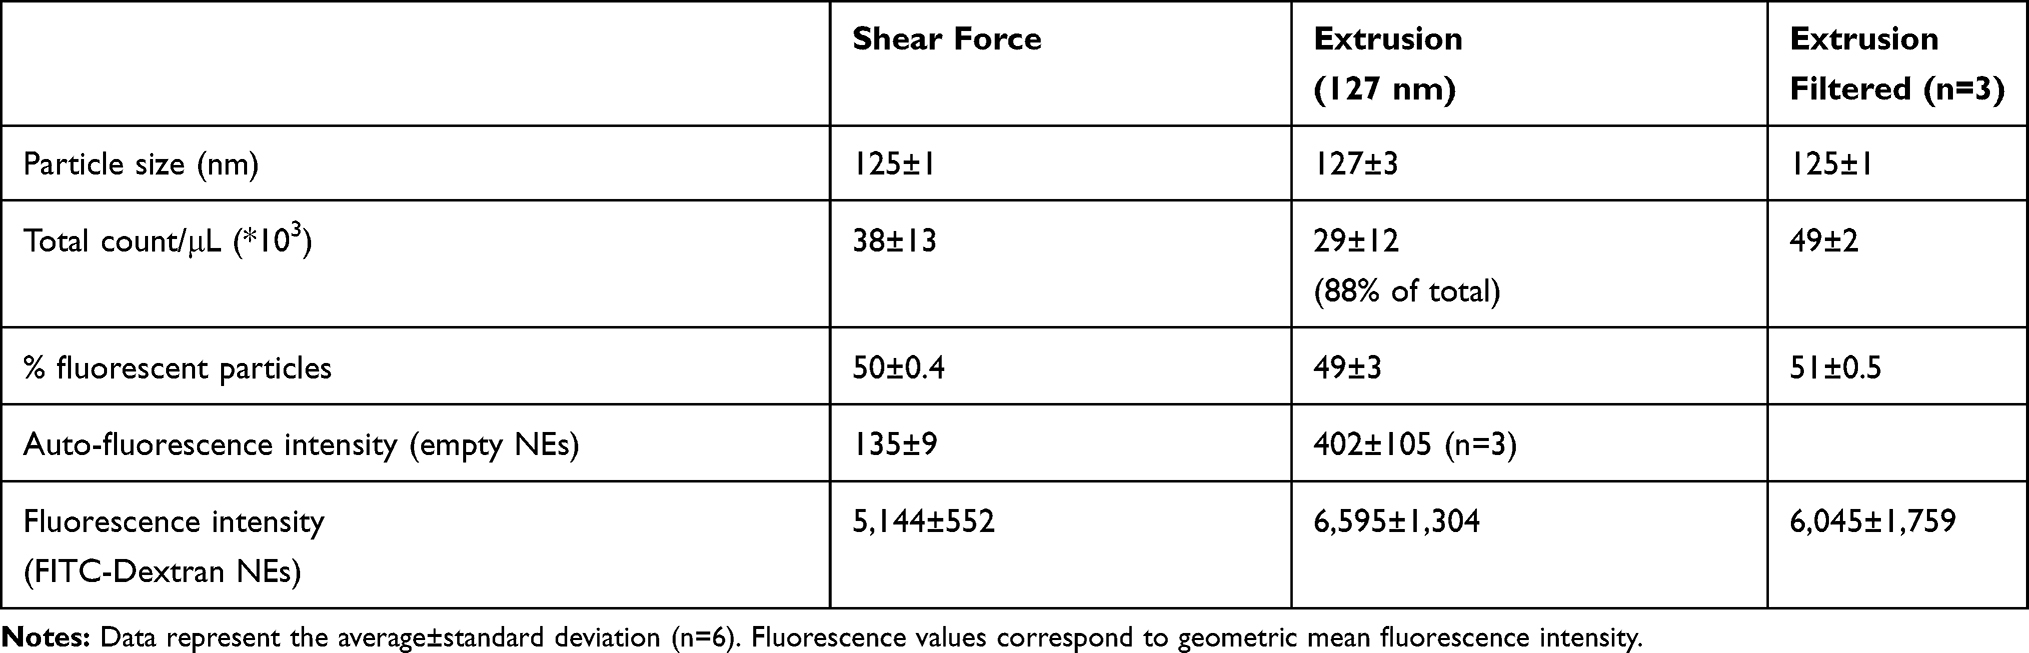 |
Table 2 Characteristics of NEs Produced by Shear Force and Extrusion Methods |
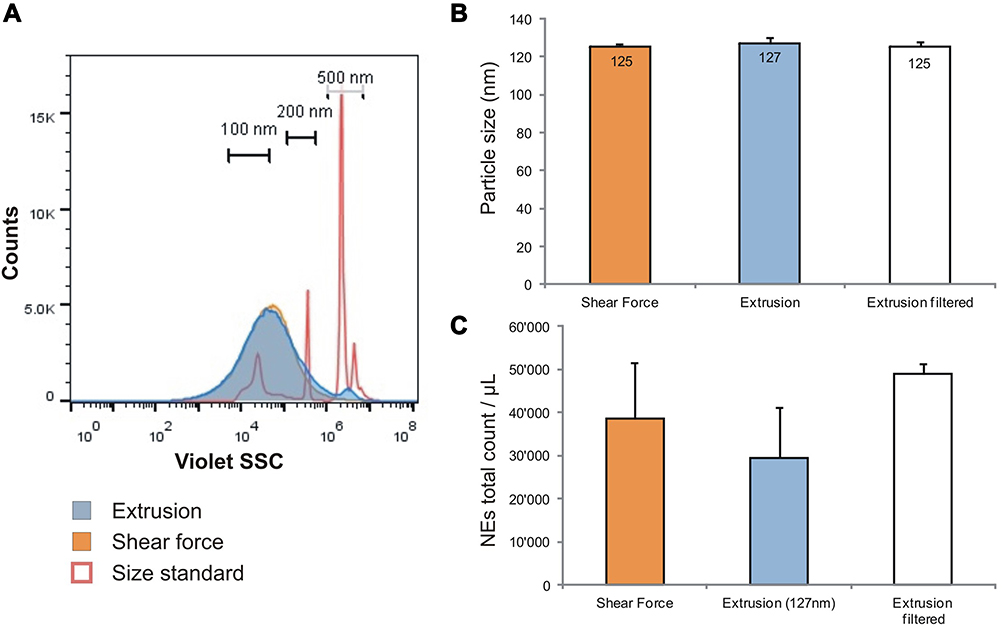 |
Figure 2 NEs size distribution. (A) Representative NEs particle size distribution corresponding to shear force (orange) and extrusion (blue) methods. In red the size standards correspond to 100, 200, and 500 nm. (B) Particle size quantification and (C) total counts/µL of NEs produced by shear force (orange) and extrusion (blue) method (n=6). White columns represent NEs produced by extrusion and then filtered (n=3). Data are represented as average with relative standard deviation. |
Similar Protein Content of NEs Produced by Shear Force and Extrusion
The proteins content was analyzed by SDS-PAGE and a semi-quantitative analysis was performed by Image J (Supplementary Figure 1). NEs produced by shear force showed the same protein pattern compared to NEs produced by extrusion method, except for a band at ~23 kDa – weaker in the shear force sample – and a band at 15 kDa – weaker in the extrusion sample. For both preparation processes, a band at 40 kDa and some weak bands around 250 were not visible compared to the initial ghost protein profile. The SDS page was repeated with three different samples (n=3).
Lower Auto-Fluorescence of NEs Produced by Shear Force
To mimic loading with high molecular weight bioactive drugs, erythrocyte ghosts were loaded with fluorescent FITC-Dextran and NEs were prepared using shear force and extrusion methods.
Empty (control) and FITC-Dextran-loaded NEs were visualized using transmission electron microscopy (TEM) (Figure 3). For both methods, the morphology of structures appeared to be intact, and described as spherical closed vesicles with thin dark stained membrane.
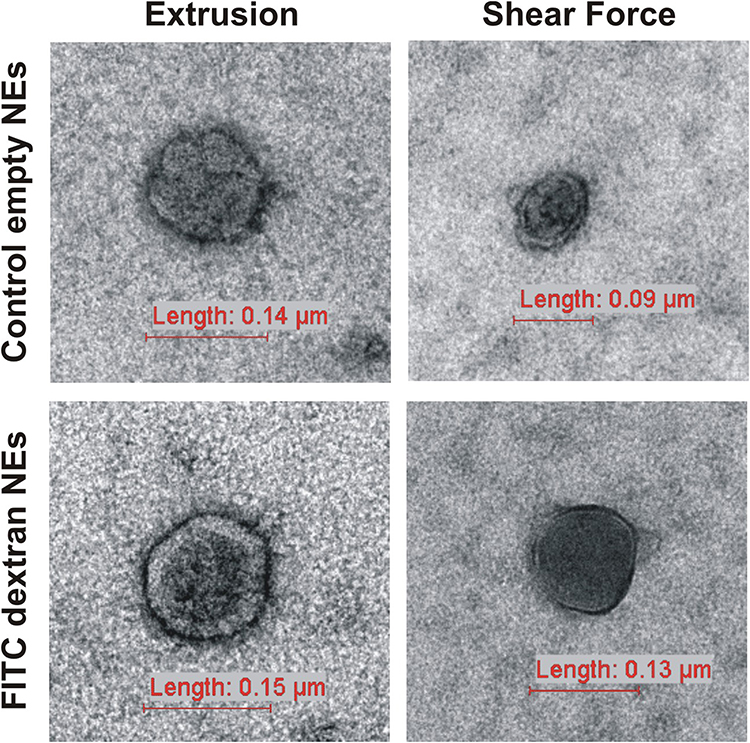 |
Figure 3 TEM images. Representative images of NEs in the size range of 90–150 nm. Control empty (upper) and FITC Dextran-loaded (lower) NEs produced by extrusion and shear force. |
The fluorescence distribution by FC analysis showed lower auto-fluorescence for control empty NEs produced by shear force, compared to extrusion samples (Figure 4A – not filled peaks). The quantification analysis of control empty NEs confirmed higher auto-fluorescence for extrusion samples, with a geometric mean fluorescence intensity (MFI) significantly higher (P<0.05; n=6 shear force, n=3 extrusion) compared to shear force (Figure 4B).
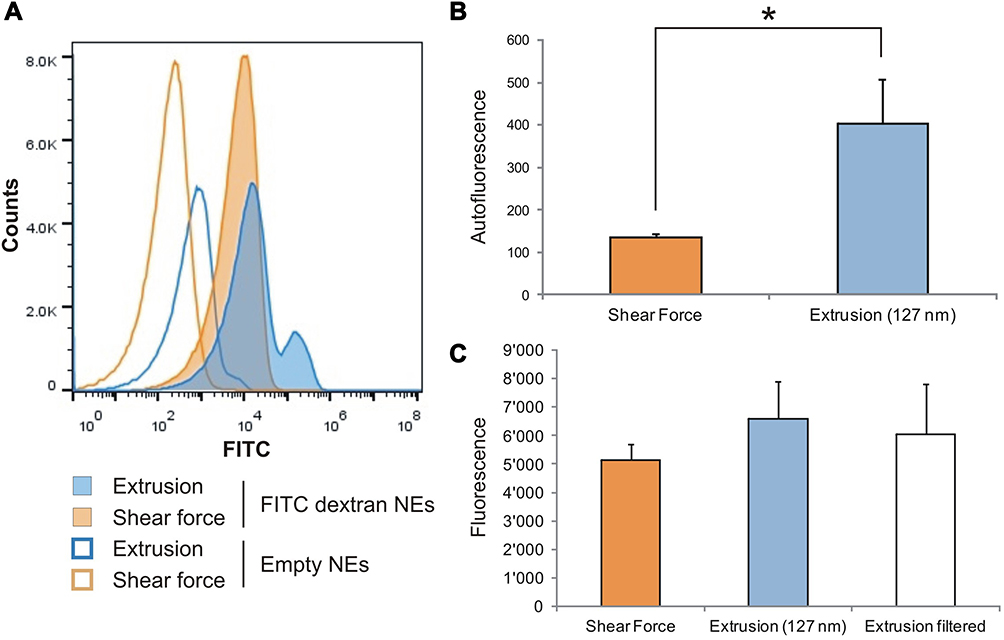 |
Figure 4 Lower auto-fluorescence for NEs shear force based. (A) Representative fluorescence distribution of FITC-Dextran loaded NEs, corresponding to shear force (orange) and extrusion (blue) method. No filled peaks represent auto-fluorescence signals of control empty NEs. (B) Auto-fluorescence intensity quantification of empty control NEs (n=6 shear force and n=3 extrusion samples). (C) Fluorescence intensity of FITC Dextran loaded NEs produced by shear force (orange) and extrusion (blue) methods (n=6). White column represents NEs produced by extrusion and then filtered (n=3). Fluorescence intensity was calculated as geometric mean. Data represent average with standard deviations. Statistical significance *P<0.05. |
To exclude fluorescence differences due to NEs size, we selected the main peak of the extrusion samples, corresponding to NEs with an average size of 127 nm, and quantified the relative fluorescence. The quantification analysis of six batches of FITC-Dextran loaded NEs produced with both methods, showed not significant differences in the MFI. Furthermore, there were not significant differences with filtered extrusion samples (n=3) (Figure 4C). Data were normalized to the auto-fluorescence intensity. The fluorescence counts were approximately 50% of NEs total counts, for both shear force and extrusion methods. The average of MFI and relative standard deviations are represented in Table 2.
FITC-Dextran NEs Encapsulation Efficiency
The amount of FITC-dextran in loaded NEs was calculated by measuring the fluorescence intensity geometric mean (n=2) by FC analysis, after removing of non-encapsulated free drug. The encapsulation efficiency was 63±1% for NEs produced by shear force (Figure 5A) and 47±7% for NEs prepared by extrusion (Figure 5B). Further washing steps resulted in gradual loss of fluorescence, with a decrease of fluorescence intensity of about 80% after the third wash, compared to initial fluorescence intensity values, for both NEs suspensions produced by shear force and extrusion methods.
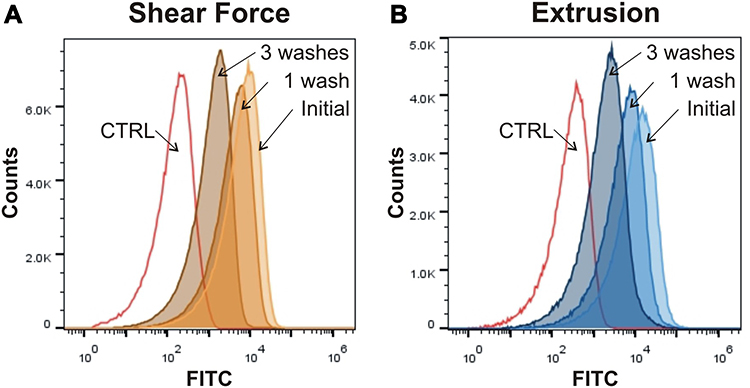 |
Figure 5 Encapsulation efficiency of FITC-Dextran-NEs. The encapsulation efficiency, calculated measuring the fluorescence geometric mean intensity after removing of free FITC-dextran (1 wash), was 63% for shear force (A) and 47% for extrusion (B) (n=2). After three consecutive washes, the fluorescence intensity decreased of about 80% for both NEs produced by shear force and extrusion. Controls (CTR) represent the auto-fluorescence signal of empty NEs. |
Storage Stability and Shelf Life
FITC-Dextran loaded NEs were stored at 4°C and analyzed by FC for total counts, particle size, and fluorescence distribution on day 0, day 7, and day 21. Data were statistically analyzed by multiple pairwise comparison. NEs produced by extrusion were significantly 3% bigger after 21 days compared to day 0 (P=0.046), while the size of NEs produced by shear force did not significantly change with the time (Figure 6). We did not find significant differences in NEs total counts and MFI over the course of 3 weeks storage, for both methods. Results are represented in Table 3 as average and relative standard deviation (n=4).
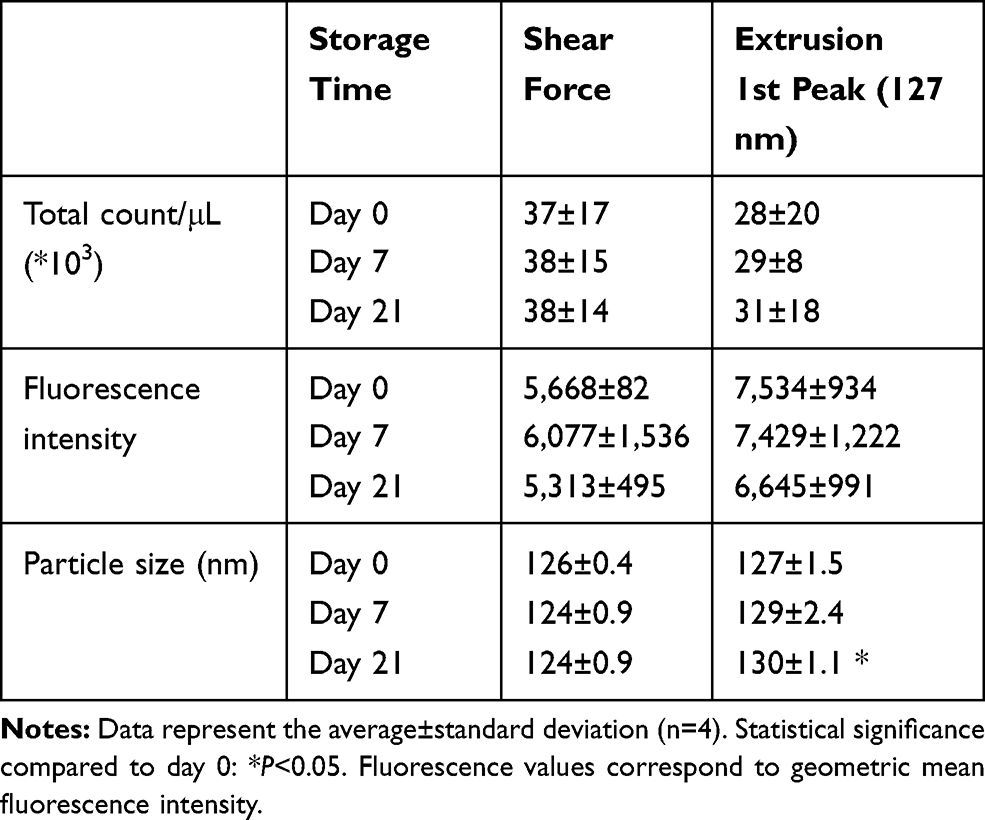 |
Table 3 Storage Stability |
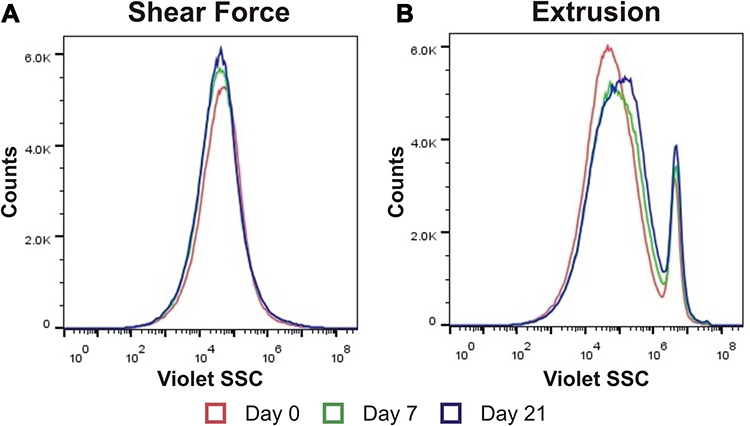 |
Figure 6 Size storage stability. Representative size distribution of FITC-Dextran loaded NEs produced by shear force (A) and extrusion (B) methods at day 0 (red), day 7 (green), and day 21 (blue) storage at +4°C. |
Stability Tests of EGCG Loaded NEs
NEs produced by shear force were loaded with Epigallocatechin 3-gallate (EGCG) and their stability was analyzed in terms of zeta potential, hemolysis rate, turbulence stress, and in vitro drug release. The amount of EGCG in loaded NEs was measured by ferrous tartrate assay, after removing of non-encapsulated free drug. The encapsulation efficiency was calculated as 33±4.2% (n=5).
Colloidal stability of NEs was assessed by measuring the zeta potential. The zeta potential measured was −34±8.5 for EGCG-loaded NEs and −32±1 for empty control samples (n=2). During the zeta potential measurements, the images showed NEs well distributed and not aggregated. NEs loaded with EGCG appeared bigger compared to empty control NEs (Figure 7A). Particle size quantification by flow cytometry analysis confirmed that NEs loaded with EGCG (128±3 nm) were significantly (n=8; P<0.01) bigger than empty NEs (124±2 nm).
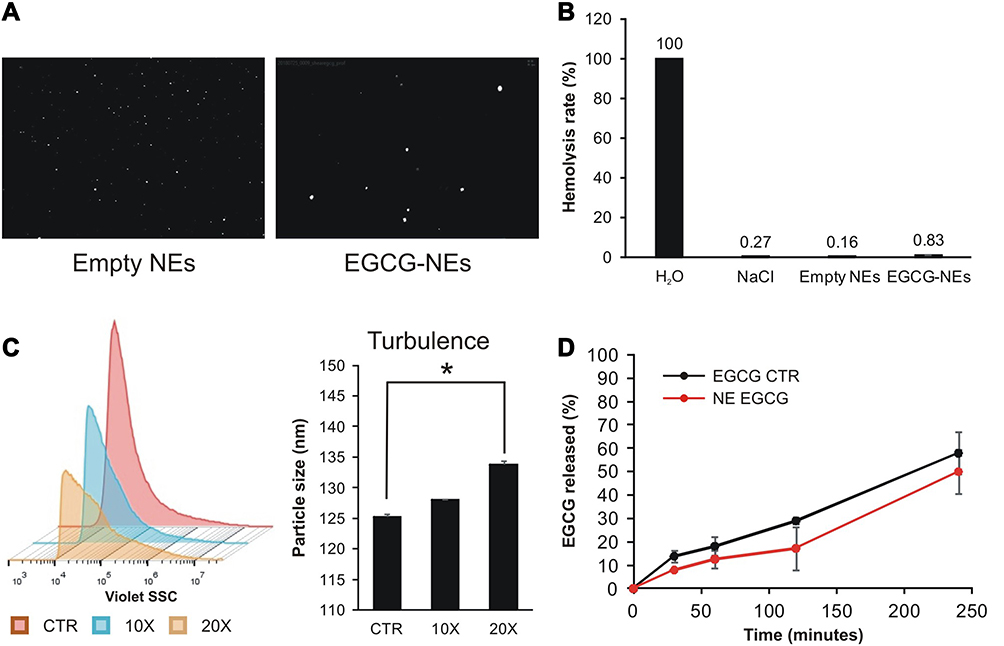 |
Figure 7 Stability tests. (A) Representative images of empty and EGCG loaded NEs during zeta potential measurement. The instrument setting: sensitivity (75), shutter (150), and trace length (15). (B) The hemolysis test showed that empty and EGCG loaded NEs caused both very low hemolysis of blood, compared to 100% hemolysis of water (n=2). The value of the hemolysis caused by NaCl was 0.27%. (C) A particle size distribution of NEs after 10 (blue) and 20 (orange) passages thought 27½ gauge needle during the turbulence test, showed a significant little increase of particle size after 20 passages (n= 4). In red the size distribution of control NEs. (D) In vitro drug release of EGCG loaded NEs (red) and plain EGCG (black). Data represent average with standard deviations. Statistical significance *p<0.05. |
The hemolysis index of NEs produced by shear force was measured by incubating empty control and EGCG loaded NEs with whole blood at a ratio of 98:2. Compared to 100% of hemolysis caused by distilled water, NEs produced by shear force showed minimal hemolysis: 0.16±0.2% for empty control NEs and 0.83±0.2% for EGCG-loaded NEs (n=2) (Figure 7B). The value of the hemolysis caused by NaCl 0.9% was 0.27%.
The turbulence stability test showed no significant increase of EGCG leakage after 10 and 20 passages through a 27-gauge needle. The leakage of EGCG was, respectively, 2.5±3.7% after 10 passages and 5.2±6.1% after 20 passages, compared to the control sample (n=4). However, the FC analysis showed that the NEs had a little (6%) significant (P<0.05) increase of size particles after 20 passages (Figure 7C).
The centrifugation stability test showed no significant differences of EGCG leakage and particle size after centrifugation at 4,000, 8,000, and 12,000 rpm (data not shown).
The in vitro release profile of EGCG loaded in NEs showed a slower release of the drug, compared to the plain EGCG (Figure 7D).
Discussion
In this study, we proposed, developed, and validated a new method for fabrication of NEs based on mechanical shear force, which involves physical disruption of erythrocyte ghost membranes with the aid of a rotor based tissue homogenizer. The shear force based method was easier, faster, and highly reproducible compared to the more complicated conventional extrusion approach. The concept of this technology relies entirely on a readily available homogenizer tube with an inbuilt rotor/stator mechanism and drive unit to impart the rotation cycles. When erythrocyte ghost suspension is subjected to shear forces, due to these relative movements between the stator and rotor, the membranes break into smaller structures and seal themselves to form vesicles. The shear force process is easy to implement, takes only a few minutes, and guarantees the sterility because samples are prepared in pre-sterilized tubes, without the need to open between the shear cycles.
Now we have an easy and fast method to produce NEs, which is able to overcome most drawbacks of the conventional methods – sonication and extrusion. So far, extrusion is the preferred method because it is reproducible and avoids typical problems of the sonication method, such as overheating of the sample and the need to remove organic solvents or detergents from the final preparation.16 However, the extrusion has the disadvantages of elaborate assembling of the device, with the necessity of compressed air and the combination of a water bath to work at controlled temperature of 37°C.11 The long procedure time is another significant disadvantage, due to repeated cycles with sometimes very slow sample recovery, the disassembling and reassembling of the device for changing of filter membranes with additional problems of sterility and sample loss, and the cleaning and the sterilization of the device between cycles and samples.20
The shear force method was more suitable to process concentrated erythrocyte ghost samples, with similar yield of NEs and less variability compared to the extrusion method. A lower (not significant) yield of NEs was obtained by shear force when starting with more diluted erythrocyte ghost suspensions; however since erythrocytes are readily available, we cannot think of a practical use for this aspect of the comparison. Moreover, we can recommend the shear force approach for larger scale experiments, because it is fast and multiple samples can be easily processed and then analyzed in parallel.
Shear force and extrusion methods produced NEs with an average size of 125 and 127 nm, respectively. However, we observed in NEs produced by extrusion, particles of bigger size (12% of total counts). More extrusion cycles,13,25 and/or slowly reducing of extrusion membranes,17 were necessary to reduce all erythrocyte ghosts to NEs of smaller size. Nevertheless, more extrusion cycles and changing membranes drastically increase the times and difficulties of the procedure. We introduced a final filtering step in the extrusion protocol, which enabled us to remove the NEs of bigger size and have a homogenous distribution with particles of 125 nm. We did not find significant differences between filtered extrusion and shear force samples, in terms of NE counts, particle size, and fluorescence intensity.
NEs produced by shear force were shown to be equivalent to NEs produced by extrusion, both are closed intact spherical structures, suggested by side scatter flow cytometry (FC) and confirmed by transmission electron microscopy (TEM). The NEs produced by both methods also showed similar protein profiles by SDS-PAGE analysis. Most of the proteins present in ghost RBCs were preserved in NEs, while few of them were not visible in both shear force and extrusion samples. Further specific protein analyses are necessary to identify these proteins and understand if they are missing or weakly expressed.
To analyze the encapsulation efficiency, NEs were loaded with a 20 KDa fluorescent molecule (FITC-Dextran), as has been previously reported in the literature.12,17 There were no significant differences in fluorescence intensity between the two methods, despite empty controls NEs produced by shear force showed significant lower auto-fluorescence. We speculate that, during the extrusion process, the several passages through the polycarbonate membranes result in an increase of accumulation of auto-fluorescence. There were no significant differences in terms of encapsulation efficiency between shear force and extrusion NEs (around 50–60%), after removing of non-encapsulated free molecules using a centrifugation molecular cut-off device. After further washes, we observed, for both methods, a gradual decrease of fluorescence intensity, up to 80% after the third wash. Dialysis,12 hypotonic pre-swelling,26 or other gentler purification approaches can be tried to remove non-encapsulated drugs and study drug release in vitro. However, it is highly likely that the method of choice will be dependent on the properties of the substance to be incorporated and, thus, must be optimized, case-per-case.
The storage stability of NEs produced with the two methods was also analyzed. NEs produced by shear force appeared stable in terms of total counts, size, and fluorescence intensity, over the course of 3 weeks storage at +4°C. Similarly, the total number and the fluorescence intensity did not change for NEs produced by extrusion, but we found a small (3%) significant increase of size after 21 days, indicating NEs fusion. This small increase of size was also found by Gupta et al17 and Dong et al12 after 21 days storage at 4°C. Cho et al20found that synthetic lipid vesicles produced by extrusion and stored for 12 days at 4°C decreased in size and were vulnerable to aging.
Further characterization of NEs was done by incorporating a bioactive compound present in green tea, the Epigallocatechin 3-gallate (EGCG), into NEs produced by the new method. NEs loaded with EGCG showed an encapsulation efficiency around 33% and good response to stability tests. The zeta potential measurements provided good colloidal stability,27,28 showing values above 30 mV for both empty and EGCG-loaded NEs. During zeta potential measurements, NEs appeared to be well dispersed and showed no aggregation. The potential hemolytic interaction with the blood was also analyzed. Both empty and EGCG-loaded NEs caused minimal hemolysis, compared to the positive control hemolysis induced by water. The values were comparable to hemolysis rates previously described for NEs.12,17 Similarly, NEs loaded with EGCG were not significantly disturbed during the simulation of blood flow rate by turbulence stability test and showed only a 5% increase of drug leakage after 20 passages through a 27 gauge needle. A further FC analysis showed a significant 6% increase of particle sizes after 20 passages. The increase of size can indicate partial aggregation due to turbulence stress; however, the NEs still remained within the nanoparticles size. Moreover, EGCG-NEs were not affected by centrifugation stress. The release of EGCG was studied in vitro by dialysis and showed a slower release profile compared to the release of plain EGCG. Summarizing, NEs produced by shear force appeared to be stable, and showed no aggregation, a good reaction with blood cells, and slightstress to passages through a needle. However, an in vivo test to validate drug delivery and biocompatibility should be done for each compound intended to be delivered using NEs as carriers.
The limitation of our study is that we cannot know at this stage how NEs produced by shear force will react to different drugs, ie, unique combinations of physical–chemical proprieties (pH, polarity, hydrophobic/hydrophilic, molecular weight, size, osmolality). Encapsulation, loading amount, and particles properties can have an impact on RBCs and their integrity.29,30 Protocols based on osmotic shock and membrane resealing can provide acceptable biocompatible encapsulation of drugs.31 Furthermore, human and murine RBC fusion proteins with engineered affinity ligands were developed to offer advantages of biocompatibility.32,33 Therefore, biocompatibility and other adverse effects (drug pharmacokinetics, distribution, and interaction) should be consistently and singularly analyzed.31,34
Conclusions
In conclusion, we proposed a new, easy, fast, and highly reproducible method to produce NEs based on shear force, which can overcome the drawbacks of the more complicated conventional approaches and allow increased efficiency in research involving NEs. NEs produced by shear force had homogenous size distribution, storage stability, and the advantage to be sterile. These cleaner means of production of NEs can also promote them to become a method of choice in translational research, as a suitable delivery system of drugs or other molecules for future biomedical applications.
Abbreviations
NEs, nano-erythrosomes; FC, Flow cytometry; TEM, transmission electron microscopy; FITC-Dextran, Fluorescein Isothiocyanate-Dextran; MFI, geometric mean fluorescence intensity; Epigallocatechin 3-gallate (EGCG).
Ethics Approval and Consent to Participate
This study was approved by Ethikkommision Nordwest und Zentralschweiz (EKNZ, Project-ID: 11042 PB_2016-02608, approved Dec 2016). Written informed consent from volunteer donors was obtained for the use of blood samples.
Acknowledgments
We thank Prof. Dr. Karin Würtz-Kozak for contribution to the initial discussion of the proposal and administrative support. We thank ScopeM-ETH Zurich, Switzerland for help with transmission electron microscope.
Funding
This work was supported by Center for Applied Biotechnology and Molecular Medicine (CABMM) and by Swiss Paraplegic Research and Swiss Paraplegic Foundation.
Disclosure
The authors report no conflicts of interest in this work.
References
1. Wilczewska AZ, Niemirowicz K, Markiewicz KH, Car H. Nanoparticles as drug delivery systems. Pharmacol Rep. 2012;64(5):1020–1037. doi:10.1016/S1734-1140(12)70901-5
2. Hamidi M, Zarrin A, Foroozesh M, Mohammadi-Samani S. Applications of carrier erythrocytes in delivery of biopharmaceuticals. J Control Release. 2007;118(2):145–160. doi:10.1016/j.jconrel.2006.06.032
3. Zarrin A, Foroozesh M, Hamidi M. Carrier erythrocytes: recent advances, present status, current trends and future horizons. Expert Opin Drug Deliv. 2014;11(3):433–447. doi:10.1517/17425247.2014.880422
4. Gutiérrez Millán C, Bravo DG, Lanao JM. New erythrocyte-related delivery systems for biomedical applications. J Drug Deliv Sci Technol. 2017;42:38–48. doi:10.1016/j.jddst.2017.03.019
5. Patel PD, Dand N, Hirlekar RS, Kadam VJ. Drug loaded erythrocytes: as novel drug delivery system. Curr Pharm Des. 2008;14(1):63–70. doi:10.2174/138161208783330772
6. Villa CH, Anselmo AC, Mitragotri S, Muzykantov V. Red blood cells: supercarriers for drugs, biologicals, and nanoparticles and inspiration for advanced delivery systems. Adv Drug Deliv Rev. 2016;106(Pt A):88–103. doi:10.1016/j.addr.2016.02.007
7. Brenner JS, Pan DC, Myerson JW, et al. Red blood cell-hitchhiking boosts delivery of nanocarriers to chosen organs by orders of magnitude. Nat Commun. 2018;9(1):2684. doi:10.1038/s41467-018-05079-7
8. Gustafson HH, Holt-Casper D, Grainger DW, Ghandehari H. Nanoparticle uptake: the phagocyte problem. Nano Today. 2015;10(4):487–510. doi:10.1016/j.nantod.2015.06.006
9. Suri SS, Fenniri H, Singh B. Nanotechnology-based drug delivery systems. J Occup Med Toxicol. 2007;2:16. doi:10.1186/1745-6673-2-16
10. Hu CM, Zhang L, Aryal S, Cheung C, Fang RH, Zhang L. Erythrocyte membrane-camouflaged polymeric nanoparticles as a biomimetic delivery platform. Proc Natl Acad Sci U S A. 2011;108(27):10980–10985. doi:10.1073/pnas.1106634108
11. Zhang H. Erythrocytes in nanomedicine: an optimal blend of natural and synthetic materials. Biomater Sci. 2016;4(7):1024–1031. doi:10.1039/C6BM00072J
12. Dong X, Niu Y, Ding Y, et al. Formulation and drug loading features of nano-erythrocytes. Nanoscale Res Lett. 2017;12(1):202.
13. Lejeune A, Moorjani M, Gicquaud C, Lacroix J, Poyet P, Gaudreault R. Nanoerythrosome, a new derivative of erythrocyte ghost: preparation and antineoplastic potential as drug carrier for daunorubicin. Anticancer Res. 1994;14(3A):915–919.
14. Payghan S. Nanoerythrosomes: engineered erythrocytes as a novel carrier for the targeted drug delivery. Asian J Pharm. 2016;10:S223–S233.
15. Uhumwangho MUOR. Current trends in the production and biomedical applications of liposomes: a review. J Med Biomed Res. 2005;4(1):9–21.
16. Lapinski MM, Castro-Forero A, Greiner AJ, Ofoli RY, Blanchard GJ. Comparison of liposomes formed by sonication and extrusion: rotational and translational diffusion of an embedded chromophore. Langmuir. 2007;23(23):11677–11683. doi:10.1021/la7020963
17. Gupta N, Patel B, Ahsan F. Nano-engineered erythrocyte ghosts as inhalational carriers for delivery of fasudil: preparation and characterization. Pharm Res. 2014;31(6):1553–1565. doi:10.1007/s11095-013-1261-7
18. Hunter DG, Frisken BJ. Effect of extrusion pressure and lipid properties on the size and polydispersity of lipid vesicles. Biophys J. 1998;74(6):2996–3002. doi:10.1016/S0006-3495(98)78006-3
19. Patty PJ, Frisken BJ. The pressure-dependence of the size of extruded vesicles. Biophys J. 2003;85(2):996–1004. doi:10.1016/S0006-3495(03)74538-X
20. Cho NJ, Hwang LY, Solandt JJR, Frank CW. Comparison of extruded and sonicated vesicles for planar bilayer self-assembly. Materials (Basel). 2013;6(8):3294–3308. doi:10.3390/ma6083294
21. Krupkova O, Sekiguchi M, Klasen J, et al. Epigallocatechin 3-gallate suppresses interleukin-1beta-induced inflammatory responses in intervertebral disc cells in vitro and reduces radiculopathic pain in rats. Eur Cell Mater. 2014;28:372–386. doi:10.22203/eCM.v028a26
22. Zeng L, Yan J, Luo L, Ma M, Zhu H. Preparation and characterization of (-)-Epigallocatechin-3-gallate (EGCG)-loaded nanoparticles and their inhibitory effects on Human breast cancer MCF-7 cells. Sci Rep. 2017;7:45521.
23. Ihler GM, Tsang HC. Hypotonic hemolysis methods for entrapment of agents in resealed erythrocytes. Methods Enzymol. 1987;149:221–229.
24. Turkmen N, Sari F, Velioglu YS. Effects of extraction solvents on concentration and antioxidant activity of black and black mate tea polyphenols determined by ferrous tartrate and Folin–Ciocalteu methods. Food Chem. 2006;99(4):835–841. doi:10.1016/j.foodchem.2005.08.034
25. Buss N, Yasa O, Alapan Y, Akolpoglu MB, Sitti M. Nanoerythrosome-functionalized biohybrid microswimmers. APL Bioeng. 2020;4(2):026103. doi:10.1063/1.5130670
26. Tajerzadeh H, Hamidi M. Evaluation of hypotonic preswelling method for encapsulation of enalaprilat in intact human erythrocytes. Drug Dev Ind Pharm. 2000;26(12):1247–1257. doi:10.1081/DDC-100102306
27. Jacobs C, Kayser O, Muller RH. Nanosuspensions as a new approach for the formulation for the poorly soluble drug tarazepide. Int J Pharm. 2000;196(2):161–164. doi:10.1016/S0378-5173(99)00412-3
28. Wissing SA, Kayser O, Muller RH. Solid lipid nanoparticles for parenteral drug delivery. Adv Drug Deliv Rev. 2004;56(9):1257–1272. doi:10.1016/j.addr.2003.12.002
29. Pan D, Vargas-Morales O, Zern B, et al. The effect of polymeric nanoparticles on biocompatibility of carrier red blood cells. PLoS One. 2016;11(3):e0152074. doi:10.1371/journal.pone.0152074
30. Pan DC, Myerson JW, Brenner JS, et al. Nanoparticle properties modulate their attachment and effect on carrier red blood cells. Sci Rep. 2018;8(1):1615. doi:10.1038/s41598-018-19897-8
31. Villa CH, Cines DB, Siegel DL, Muzykantov V. Erythrocytes as carriers for drug delivery in blood transfusion and beyond. Transfus Med Rev. 2017;31(1):26–35. doi:10.1016/j.tmrv.2016.08.004
32. Carnemolla R, Villa CH, Greineder CF, et al. Targeting thrombomodulin to circulating red blood cells augments its protective effects in models of endotoxemia and ischemia-reperfusion injury. FASEB J. 2017;31(2):761–770. doi:10.1096/fj.201600912R
33. Villa CH, Pan DC, Johnston IH, et al. Biocompatible coupling of therapeutic fusion proteins to human erythrocytes. Blood Adv. 2018;2(3):165–176.
34. Villa CH, Seghatchian J, Muzykantov V. Drug delivery by erythrocytes: “Primum non nocere”. Transfus Apher Sci. 2016;55(3):275–280. doi:10.1016/j.transci.2016.10.017
 © 2020 The Author(s). This work is published and licensed by Dove Medical Press Limited. The
full terms of this license are available at https://www.dovepress.com/terms
and incorporate the Creative Commons Attribution
- Non Commercial (unported, 3.0) License.
By accessing the work you hereby accept the Terms. Non-commercial uses of the work are permitted
without any further permission from Dove Medical Press Limited, provided the work is properly
attributed. For permission for commercial use of this work, please see paragraphs 4.2 and 5 of our Terms.
© 2020 The Author(s). This work is published and licensed by Dove Medical Press Limited. The
full terms of this license are available at https://www.dovepress.com/terms
and incorporate the Creative Commons Attribution
- Non Commercial (unported, 3.0) License.
By accessing the work you hereby accept the Terms. Non-commercial uses of the work are permitted
without any further permission from Dove Medical Press Limited, provided the work is properly
attributed. For permission for commercial use of this work, please see paragraphs 4.2 and 5 of our Terms.