Back to Journals » International Journal of Nanomedicine » Volume 18
Novel Dual-Mode NIR-II/MRI Nanoprobe Targeting PD-L1 Accurately Evaluates the Efficacy of Immunotherapy for Triple-Negative Breast Cancer
Authors Liu WL, Zhang YQ, Luo XJ, Zhu YY, Song L, Ming ZH, Zhang LX, Li MJ, Lv RC, Zhang GJ, Chen M ![]()
Received 20 April 2023
Accepted for publication 25 August 2023
Published 8 September 2023 Volume 2023:18 Pages 5141—5157
DOI https://doi.org/10.2147/IJN.S417944
Checked for plagiarism Yes
Review by Single anonymous peer review
Peer reviewer comments 2
Editor who approved publication: Professor Lijie Grace Zhang
Video abstract of “NIR-II/MRI Nanoprobe for TNBCx” [ID 417944].
Views: 95
Wan-Ling Liu,1– 4,* Yong-Qu Zhang,1– 5,* Xiang-Jie Luo,6 Yuan-Yuan Zhu,1– 4 Liang Song,7 Zi-He Ming,1– 4 Li-Xin Zhang,1– 4 Meng-Jun Li,1– 4 Rui-Chan Lv,8 Guo-Jun Zhang,1– 4,9,* Min Chen2– 4,*
1Department of Breast-Thyroid-Surgery and Cancer Center, Xiang’an Hospital of Xiamen University, School of Medicine, Xiamen University, Xiamen, People’s Republic of China; 2Fujian Key Laboratory of Precision Diagnosis and Treatment in Breast Cancer, Xiang’an Hospital of Xiamen University, Xiamen, People’s Republic of China; 3Xiamen Key Laboratory of Endocrine-Related Cancer Precision Medicine, Xiamen, People’s Republic of China; 4Xiamen Research Center of Clinical Medicine in Breast & Thyroid Cancers, Xiamen, People’s Republic of China; 5Department of Breast Center, Cancer Hospital of Shantou University Medical College, Shantou, People’s Republic of China; 6College of Chemistry and Chemical Engineering, Xiamen University, Xiamen, People’s Republic of China; 7Xiamen Institute of Rare Earth Materials, Haixi Institute, Chinese Academy of Sciences and Technology University, Xiamen, People’s Republic of China; 8Engineering Research Center of Molecular and Neuro Imaging, Ministry of Education, School of Life Science and Technology, Xidian University, Xi’an, Shanxi, People’s Republic of China; 9Cancer Research Center, School of Medicine, Xiamen University, Xiamen, People’s Republic of China
*These authors contributed equally to this work
Correspondence: Min Chen; Guo-Jun Zhang, Email [email protected]; [email protected]
Background: Durable responses to immune-checkpoint blocking therapy (ICT) targeting programmed cell death protein-1/ligand-1 (PD-1/PD-L1) have improved outcomes for patients with triple negative breast cancer (TNBC). Unfortunately, only 19– 23% of patients benefit from ICT. Hence, non-invasive strategies evaluating responses to therapy and selecting patients who will benefit from ICT are critical issues for TNBC immunotherapy.
Methods: We developed a novel nanoparticle-Atezolizumab (NPs-Ate) consisting of indocyanine green (ICG), gadolinium-diethylenetriamine pentaacetic acid (Gd-DTPA), human serum albumin (HSA), and Atezolizumab. The efficiency of Gd-DTPA linking was verified using mass spectrometry, and the size of NPs-Ate was characterized using Nano-flow cytometry. The synthesized NPs-Ate were evaluated for fluorescence stability, penetration depth, and target specificity. TNBC cell lines and tumor-bearing mice models were used to identify the feasibility of this dual-modal second near-infrared/magnetic resonance imaging (NIR-II/MRI) system. Additionally, ICT combination with chemotherapy or radiotherapy in TNBC tumor-bearing mice models were used to assess dynamic changes of PD-L1 and predicted therapeutic responses with NPs-Ate.
Results: Atezolizumab, a monoclonal antibody, was successfully labeled with ICG and Gd-DTPA to generate NPs-Ate. This demonstrated strong fluorescence signals in our NIR-II imaging system, and relaxivity (γ 1) of 9.77 mM− 1 s− 1. In tumor-bearing mice, the NIR-II imaging signal background ratio (SBR) reached its peak of 11.51 at 36 hours, while the MRI imaging SBR reached its highest as 1.95 after 12 hours of tracer injection. NPs-Ate specifically targets cells and tumors expressing PD-L1, enabling monitoring of PD-L1 status during immunotherapy. Combining therapies led to inhibited tumor growth, prolonged survival, and increased PD-L1 expression, effectively monitored using the non-invasive NPs-Ate imaging system.
Conclusion: The NIR-II/MRI NPs-Ate effectively reflected PD-L1 status during immunotherapy. Real-time and non-invasive immunotherapy and response/prognosis monitoring under NIR-II/MRI imaging guidance in TNBC is a promising and innovative technology with potential for extensive clinical applications in the future.
Keywords: dual-modal imaging, triple-negative breast cancer, immune-checkpoint blocking therapy, programmed cell death protein ligand-1, monitoring therapeutic response
Graphical Abstract:

Introduction
Triple-negative breast cancer (TNBC) lacks estrogen receptor, progesterone receptor, and human epidermal growth factor receptor 2 exhibiting an aggressive phenotype and poor prognosis.1,2 TNBC’s higher mutational load,3 tumor infiltrating lymphocyte frequency,4–6 and programmed cell death ligand-1 (PD-L1) expression,6,7 suggest heightened immunogenicity compared to other breast cancer subtypes.
PD-L1 and programmed cell death protein-1 (PD-1) inhibitors, or immune checkpoint inhibitors (ICIs), have shown promising durable responses in clinical studies and approvals.8–10 Atezolizumab when combined with chemotherapy increases survival rates by nearly 10 months, and median overall survival (OS) in patients with PD-L1-positive tumors.8 Pembrolizumab significantly improves OS rates when combined with chemotherapy when compared with controls in high combined positive score patients (CPS ≥ 10).9,10 ICIs are promising strategies for improving current clinical TNBC treatments. However, recent studies have reported that effective clinical rates for immune-checkpoint blocking therapy (ICT) are only 20–30%.11 Therefore, screening for ICI benefits is essential if patient OS rates are to be increased, quality of life improved, and medical resources saved. PD-L1 expression, mismatch repair deficiency, high microsatellite instability, and tumor mutation burden are clinically useful biomarkers used to predict therapeutic effects.
Previous studies have reported that patients who are more than likely to benefit from PD-1/PD-L1 blockage therapies can be identified using PD-L1 expression levels from immunohistochemistry (IHC) assays (eg, Dako28-8, Dako22C3, Ventana SP142, and Ventana SP263 assays).12,13 However, PD-L1 spatial and temporal heterogeneity often constrains the practical application of these assays.14 Moreover, PD-L1 tumor expression is dynamic and may be influenced by several cytokines, including interferon (IFN) and toll-like receptor ligands,15,16 and also by treatment strategies such as radiotherapy,17 chemotherapy,18–20 or cancer targeted therapy.21 Thus, real-time, and dynamic PD-L1 evaluation is essential to select the right patients who will benefit from ICTs.
Innovative molecular imaging techniques have real-time assessment of PD-L1 levels and real-time assessment of PD-L1 levels.22 PD-L1 quantification using particular radionuclides23–25 or optical probes26,27 has shown promising preliminary results. In clinical studies, Bensch et al25 observed that patients with lower-than-median therapy uptake were more likely to progress or die, suggesting that zirconium-89-labeled atezolizumab (89Zr-Atezolizumab) uptake could predict ICT responses. In human tumor xenograft models, 89Zr-radiolabeled monoclonal antibodies (mAbs) effectively reflected paclitaxel-induced PD-L1 up-regulation.28 These findings demonstrated the practical utility of molecular imaging in predicting immunotherapy outcomes.
However, the patient management involving radioactive agents is subject to strict safety protocols, with objective radiation safety limits being strictly enforced. Furthermore, the use of radionuclides with long half-lives, such as isotopes of copper and zirconium (64Cu and 89Zr), poses challenges for repeated imaging and dynamic observation of PD-L1 expression changes over short periods. As a result, radionuclide probes that accurately assess PD-L1 expression for clinical transformation are limited by polar environments.29,30
Fluorescence imaging, with no ionizing radiation, has attracted considerable research attention. Zhang et al31 labeled an anti-PD-L1 antibody with a first near infrared (NIR-I) dye (IRDye800CW) and identified PD-L1 levels in tumors that were 5.05-fold higher than controls. Compared to NIR-I, second near infrared (NIR-II) fluorescence imaging (900–1700 nm) offers reduced scattering and tissue absorption, thereby improving spatial resolution and tissue penetration depth.32,33 Dai et al34 observed a signal background ratio (SBR) as high as ~40 when PD-L1 was functionalized to rare-earth nanoparticles in NIR-II. Recently, indocyanine green (ICG), also known as a NIR-I agent, was reported to emit fluorescence in the NIR-II range. As an FDA-approved contrast agent, ICG enables NIR-II fluorescence imaging.35,36 Therefore, ICG labeled functionalized imaging probes hold potential for evaluating PD-L1 status and ICT responses, warranting further clinical investigation.
Nanotechnology, which can integrate multiple functional materials into a single nanoparticle, offers tremendous opportunities for visual evaluation of immunotherapy. Because of their biocompatibility, low toxicity, and low immunogenicity, nanoparticles can encapsulate or bind to their payloads and deliver them to target regions in immunotherapy.37 Given that different imaging methods have unique benefits and drawbacks, combinations many provide improved outcomes. In 2018, Du et al27 generated a novel PD-L1-PCI-Gd nanoprobe and tested its efficacy in dual-modal NIR-I/MRI for PD-L1 and suggested that PD-L1 NIR/MRI imaging could predict ICT responses.
In this study, we developed and characterized a novel nanoparticle, NPs-Ate, incorporating atezolizumab, ICG, and Gd-DTPA, and performed in vitro and in vivo dual-modal NIR-II/MRI feasibility studies. In TNBC mouse models, we utilized this novel probe in vivo to monitor responses dynamically and continuously to ICT when combined with chemotherapy in real-time. (Scheme 1).
 |
Scheme 1 NPs-Ate study workflow showing the dynamic monitoring and evaluation of PD-1 therapeutic effectiveness by NIR-II fluorescence imaging. |
Materials and Methods
Materials
For probe synthesis, an anti-PD-L1 monoclonal antibody (atezolizumab) was obtained from MedChemExpress (USA). Human IgG (H+L) was obtained from Sangong Biotech (Shanghai, China). A PD-1 mAb (SHR-1210) was obtained from Suncadia Biopharmaceuticals (Suzhou, China). For Western blotting and IHC, an anti-PD-L1 antibody (ab233482) was purchased from Abcam. Diethylenetriaminepentaacetic acid dianhydride (DTPAA, 95%) and gadolinium (III) chloride hexahydrate (99.9%) were purchased from Alfa Asear. Human serum albumin (HSA) was purchased from Beyotime Biotechnology (Shanghai, China). N-(3-dimethylaminopropyl)-N’-ethylcarbodiimide hydrochloride (EDC•HCl) and N-hydroxysuccinimide (NHS) were purchased from Energy Chemicals (Shanghai, China). NHS-PEG2000-COOH was purchased from Aladdin (Shanghai, China).
NPs-Ate Synthesis
2 g HSA was dissolved in 30 mL of 0.1 M NaHCO3 (pH 8.2) solution. Then, 2 g diethylenetriaminepentaacetic acid dianhydride (DTPAA) was dissolved in 10 mL dry dimethyl sulfoxide (DMSO) and added to the HSA solution. The pH was adjusted to 8.2 using 1 M NaOH, the solution was stirred for 2 h at room temperature, and dialyzed against deionized water. Then, GdCl3 was added at pH 6.5 to generate GdDTPA-HSA. Matrix-assisted laser-desorption ionization time-of-flight mass spectrometry was used to verify Gd-linking efficiency. Subsequently, 60 mg GdDTPA-HSA in water was mixed with free ICG (10 mg in 2 mL DMSO) and stirred for 12 h at room temperature. Lastly, the mixture was purified on a Sephadex G50 column (PD-10; GE 121 Healthcare, Piscataway, NJ, USA). GdDTPA-HSA@ICG was examined using a G2 F30 twin transmission electron microscope (FEI/TECNAI, Hillsboro, OR, USA).
25mg of NHS-PEG2000-COOH was used to link GdDTPA-HSA@ICG nanoparticles to the 2mg PD-L1 antibody (Atezolizumab, MPDL3280A). The carboxylic group was activated by EDC•HCl and NHS to generate a fluorescent/magnetic resonance bimodal probe for functionalized PD-L1 antibody-targeting to tumors. IgG was used to construct a control probe GdDTPA-HSA@ICG-IgG (NPs-IgG). The size of NPs-Ate (IgG) was calculated using Nano-flow cytometry (NanoFCM, XiamenFuliu, Xiamen, China).38
NPs-Ate and NPs-IgG Characterization
UV/Vis absorption and fluorescence emission spectra (740–1000 nm) at excitation wavelength = 720 nm was measured on a fluorescence spectrophotometer (Varian Eclipse, Cary Eclipse). NIR-II fluorescence emission spectra were measured using a fluorescent spectrometer (Edinburgh Instruments, FLS980) at excitation wavelength = 808 nm.
Using sodium dodecyl sulfate-polyacrylamide gel electrophoresis and coomassie brilliant blue staining to evaluate the binding stability. Using a dual-modal multispectral laser scan imager (Azure Sapphire RGBNIR) gels were scanned at 758 nm.
To investigate fluorescence stability, probes were separately dissolved in phosphate buffered saline (PBS), 10% fetal bovine serum (FBS) and DMSO. After storage at 4°C for different times (1, 6, 12, 24, 48, and 96 h), probe fluorescence intensity was examined using a fluorescence imaging system (Suzhou Yingrui Optical Technology, Series III 900/1700).
To compare penetration depth between NIR-I and NIR-II probes, capillary glass tubes containing NPs-Ate (10 mg/mL) were placed in a transparent dish. Then, 1% intralipids in different volumes were added to dishes to generate different heights (0–7 mm) in glass tubes. Tubes were analyzed for NIR-I and NIR-II fluorescence signals. Additionally, for fast vascular imaging, mice vein fluorescence signals were detected at 5 min after NP injection. Fluorescence intensity ratios between blood vessels and surrounding tissue were calculated.
Cell Culture
Breast cancer 4T1 (mouse), MDA-MB-231, and MCF-7 (human) cell lines were purchased from Procell Life Science & Technology (Wuhan, China). MDA-MB-231 and MCF-7 cells were cultivated in Dulbecco’s Modified Eagle Medium plus 10% fetal calf serum, whereas 4T1 cells were cultured in Roswell Park Memorial Institute 1640 medium (all from Gibco, USA). Cells were cultivated at 37°C in 5% CO2.
Cell Transfections
MDA-MB-231 and 4T1 cells were stably transfected with lentivirus to generate PD-L1 expressing cancer cell lines (MDA-MB-231-PD-L1, 4T1-PD-L1, and associated controls: MDA-MB-231-EV and 4T1-EV cells). According to recommended multiplicity of infection values, human and mouse lentivirus (PHBLV-CMV-HPD-L1-3Flag-EF1-ZSgreen-T2A-PURO and control PHBLV-CMV-3Flag-EF1-ZSgreen-T2A-PURO, Hankhin Biologics) were added to fresh medium. After infection for 24 h, the culture medium containing lentivirus particles was removed and normal culture medium was added. PD-L1 expression in transduced cells was verified by Western blotting.
Cytotoxicity Assay
NPs-Ate cytotoxicity was assessed using the Cell Counting Kit-8 (CCK8) method MedChemExpress (USA). MDA-MB-231, 4T1, and MCF-10A cells were seeded at 1×10⁴ cells/well in a 96-well plate and incubated for 24 h. Cells were then incubated with NPs-Ate at different times (0, 24, 48, and 72 h) and different concentrations (40, 80, and 160 µg/mL). After incubation times, fresh culture medium plus 10 µL CCK8 solution was added to wells and plates were incubated for 2 h at 37°C. Optical density values at 450 nm were measured using a Multiskan™ FC microplate reader (Thermo Scientific).
Immunofluorescence Staining
Cells (1×10⁵/well) were incubated on sterile slides for 24 h. NPs-Ate and NPs-IgG were added to 12-well plates according to the final concentration of 20 µg/mL and incubated for 2 h. After washing in PBS, cells were fixed in 4% paraformaldehyde, sealed with 4’,6-diamidino-2-phenylindole (DAPI) sealing tablets (Beyotime Biotechnology, Shanghai, China), and observed under fluorescence microscopy (Leica DM2500, customized ICG fluorescence filter).
Monitoring PD-L1 Dynamic Changes Induced by INF-γ
4T1 cells were incubated in 6-well plates at 1×10⁵ cells/well for 24 h. INF-γ (Peprotech, Thermo fisher Scientific) was added at 50, 100, and 200 IU/mL concentrations and plates further incubated for 48 h. The cells were incubated with NPs-Ate and observed as described.
The Mouse Models
BALB/c and BALB/c nude female mice were purchased from Vital River (Beijing, China). For in vivo dynamic fluorescence imaging, Ate-NPs (20 mg/kg; 100 ul) was intravenously injected into animals. Mice were then randomly selected for studies and maintained in standard barrier conditions. MDA-MB-231 tumors were generated by the sub cutaneous (s.c.) injection of 5×10⁶ MDA-MB-231 cells in 100 μL PBS. 4T1 tumors were generated by the s.c. injection of 1×10⁵ 4T1 cells. By observation, mice with subcutaneous tumors were judged to be successful models and were randomly used in subsequent experiments.
In three tumor models, 1×10⁵ 4T1-EV cells, 5×10⁴ 4T1-PD-L1 cells mixed with 5×10⁴ 4T1-EV cells, and 1×10⁵ 4T1-PD-L1 cells were s.c. injected into the same mice.
Tumor volumes were estimated from the largest (a) and smallest (b) diameters; V = ab2/2.
In vivo Safety
After injecting NPs-Ate, mouse body weights were monitored every 3 days. Routine bloods and liver and kidney function indices were examined at different times (1, 3, 7, and 28 days). Mice were humanely sacrificed by cervical dislocation, and the main organs removed for hematoxylin and eosin (H&E) staining to observe if morphology had altered and pathological changes had occurred.
In vivo Fluorescence Imaging
NPs-PD-L1 bio-distribution and target specificity outcomes were examined by fluorescence imaging in three mice/groups. Data were collected from different tumor models (MDA-MB-231, MDA-MB-PD-L1, and 4T1, 4T1-PD-L1) after injecting NPs-Ate (n=3; 19.72 mg/kg NPs-Ate =1 mg/kg ICG-loaded), the same dose of ICG-loaded NPs-IgG (22.03 mg/kg) was injected as a control group. In blocking studies, 50 mg/kg free atezolizumab was intravenously injected into animals.
In vitro and in vivo MRI
NPs-Ate (IgG) and Gd-DTPA were prepared at 0.0375, 0.075, 0.15, 0.3, and 0.6 mM (Gd3+) concentrations. Longitudinal relaxation times were used to calculate relaxation rates.
Mice containing 4T1-PD-L1 (n=9) and MDA-MB-231 (n=9) tumors were imaged by T1-weighted MRI to evaluate NPs-Ate as the contrast agent specifically targeted tumors. Gd-DTPA and NPs-IgG were used as controls. Mice (3 per group) were imaged using a 9.4T MRI scanner (Biospec System 70/20, Bruker, Germany), with T1 RARE parameters as fat suppression ON, TR 1000 ms, TE 8.3, NEX 4, FA 180.0 deg, slice thickness 0.5 mm, FOV4.0×4.0 cm, and MTX 256×256, and with RARE-T1-axi; MRI signal intensities in regions of interest were tested using intravenous NPs-Ate injections. For quantitative comparisons, SBR values were calculated using a Radiant DICOM Viewer 2020.2.
ICT Treatment
1×10⁶ 4T1 cells were injected into the right thigh of 6–8 weeks BALB/C mice (n=144). On day 3, mice were divided to 12 groups. Mice were undergoing chemotherapy, radiation therapy, and INF-γ, separately. (Chemotherapy: 25 mg/kg i.v. QD. 5 times (paclitaxel for injection (Albumin Bound) Hengrui Pharma, Jiangsu China); Radiation therapy: 2 Gy×4, X-ray biology irradiator (RS2000, Rad source, USA) and INF-γ: intratumoral injection, 1000 IU, QD. 5 times, Recombinant Murine IFN-γ, PeproTech). Then, anti-PD-1 treatments were used every 2 days (intraperitoneal; D-1 15 mg/kg; 4 times). NPs-Ate was injected on days 8 and 15 (n=5) (20 mg/kg NPs-Ate). Fluorescence signals were gathered after 36 h. Mice with a tumor volume greater than 1200 mm3 or a body weight loss greater than 25% were considered humane endpoints and euthanized.
Statistics and Data Analysis
Data are represented as the mean ± SD. T-tests were used to compare data. P-values < 0.05 were deemed statistically significant. GraphPad Prism 6.0 was used for all analyses.
Results
NPs-Ate Characterization
Mass spectrometry and dynamic light scattering (DLS) analyses of free human serum albumin (HSA) and GdDTPA-HSA (Supplementary Figure 1a and b) confirmed the successful labeling of GdDTPA with HSA. GdDTPA-HSA@ICG molecules were spherical, measured 7–10 nm (Supplementary Figure 1b), and showed that ICG had successfully induced a self-assembled complex in transmission electron micrographs (Figure 1a). Nano-flow cytometry measurements indicate that the particle size of NPs-Ate is approximately 60.8 nm, while the particle size of NPs-IgG is around 59.2 nm (Supplementary Figure 1c). Fluorescence scanning analyses (Supplementary Figure 1d) showed stable NPs-Ate conjugates. The absorption spectra of free ICG, NPs, and NPs-Ate are shown (Figure 1b). Characteristic peaks for ICG (~780 nm) indicated successful NPs-Ate fabrication with ICG. It was observed that 1mg of NPs-Ate contained 0.0507 mg of ICG, whereas 1mg of NPs-IgG contained 0.0454 mg of ICG. Additionally, 1 mg of pure NPs contained 0.0688 mg of ICG Fluorescence emission peaks for NPs-Ate were ~800 nm (Ex: 720 nm) with a fluorescent trail at 1000 nm (Ex: 808 nm) (Figure 1c and d). In the NIR-II imaging system, NPs-Ate demonstrated high-intensity fluorescence signals upon excitation at 808 nm (Supplementary Figure 1e).
 |
Figure 1 NPs-Ate and NPs-IgG characterization. (a) Transmission electron micrograph image of GdDTPA-HSA@ICG (NPs). (b) Absorption spectra of NPs-Ate (IgG). (c and d) Fluorescence emission spectra of NPs-Ate (IgG) in (c) NIR-I (Ex: 720 nm), and (d) NIR-II (Ex: 808 nm) (FI: Fluorescence intensity). ICG and NPs in PBS were used as controls. (e) T1-weighted MR phantom images (Upper: pseudo-color) and NPs-Ate longitudinal relaxivity (γ1). Scale bar = 100 nm. |
NPs-Ate fluorescence intensity remained stable during a 96-hour observation window, confirming tracer’s fluorescence stability (Supplementary Figure 2a). Furthermore, fluorescence images of capillaries filled with NPs-Ate solutions showed that the NIR-II (5 mm) penetration depth was significantly higher than NIR-I (2 mm) (Supplementary Figure 2b). Fast vascular BALB/C nude mice imaging after NP injection at 808 nm laser excitation further confirmed that NIR-II imaging at ~1000 nm generated higher SBR (3.77) compared to NIR-I (1.77) (Supplementary Figure 2c). Thus, in the NIR-II, NPs-Ate showed better contrast traits in deeper tissue.
To assess NPs-Ate as a potential MRI contrast agent, longitudinal relaxivity (γ1) was measured. The γ1 values for NPs-Ate and NPs were 9.77 mM−1 s−1 and 7.64 mM−1 s−1, respectively (Figure 1e, Supplementary Figure 3). The γ1 value of NPs-Ate was nearly two times higher when compared with the clinical MRI agent Gd-DTPA (γ1 = 4.2 mM−1 s−1).
NPs-Ate Specifically Target in vitro PD-L1
A Cell Counting Kit 8 assay was used to examine probe cytotoxicity in MDA-MB-231, 4T1, and MCF-10A cells. Even though cells were incubated at high NPs-Ate concentrations (160 µg/mL) for 72 h, good cell survival was observed (Supplementary Figure 4). This suggested the probe had no adverse effects on cell viability and was suitable for imaging.
To validate targeting in human breast cancer cell lines, NPs-Ate was added to MDA-MB-231 cells at different concentrations and times (Supplementary Figure 5a and c). Quantitative cell fluorescence analyses showed that probe uptake was higher in NPs-Ate cells when compared with the control group (4 µg/mL ICG) (60.36 ± 6.48 and 10.96 ± 3.64 (mean ± standard deviation (SD)), respectively; P<0.05) and in 2 h (22.21±2.49 and 5.003±0.33 (mean ± SD), respectively; P<0.05) (Supplementary Figure 5b and d). Thus, 80 µg/mL NPs-Ate (4 µg/mL ICG) and 2 h were ideal incubation conditions.
NPs-Ate was incubated in high/low PD-L1 expressing cells (Figure 2a), and co-incubated with free Atezolizumab to induce competitive blocking (Figure 2b). NPs-Ate showed the highest binding in high-PD-L1 expressing cells MDA-MB-231-PD-L1 (mean ± SD, 62.78±0.57, Figure 2c), while in low PD-L1 expressing cells, fluorescence intensity was significantly lower at 4.88 ± 0.76 (MCF-10A) and 0.20 ± 0.4 (MCF-7) (Figure 2c). In competitive blocking studies, free atezolizumab (800 µg/mL) and NPs-Ate (80 µg/mL, 4 µg/mL ICG) were co-incubated with MDA-MB-231 cells (Figure 2d) and fluorescence intensity decreased (mean, 30.52 vs 14.04; P<0.05), thereby indicating specific NPs-Ate binding to PD-L1. These data suggested that probes could be used to detect different PD-L1 expression levels in human breast cancer cells.
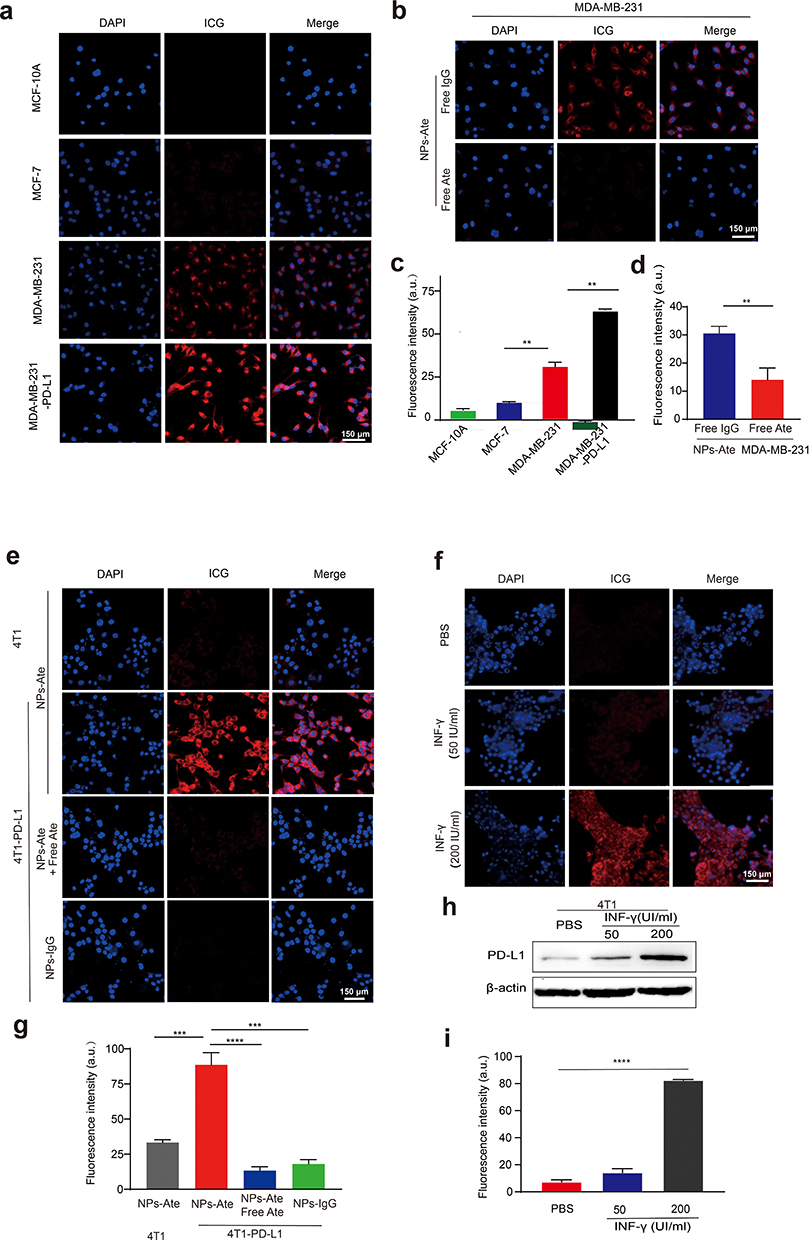 |
Figure 2 In vitro NPs-Ate fluorescence imaging. (a) Fluorescence microscopy images showing MDA-MB-231 cells after incubation with NPs-Ate (80 μg/mL, 4 μg/mL ICG) and (b) blocking with free atezolizumab (0.8 mg/mL). Low PD-L1 expression cell lines: MCF-7 and MCF-10A, and high PD-L1 expression cell line MDA-MB-231-PD-L1 were used as controls. Quantification (mean fluorescence intensity; MFI) (c and d). (e) Fluorescence microscopy images showing 4T1 and 4T1-PD-L1 cells after a 2 h incubation with NPs-Ate (80 μg/mL, 4 μg/mL ICG), and blocking with free anti-PD-L1 (Atezolizumab) (0.8 mg/mL). Quantification (g). (f, h and i) 4T1 cells incubated for 48 h with different INF-γ concentrations (50 and 200 UI/mL) (f) Fluorescence microscopy images and (i) quantification. (h) Western blots showing PD-L1 expression. Data are represented as the mean ± standard deviation (n=3), **** P<0.0001, *** P<0.001, and **P<0.01. Scale bar = 150 µm. |
To further investigate the roles of NPs-Ate in immunotherapy, we conducted incubation experiments with NPs-Ate on various PD-L1 expressed cells (Figure 2e), including those with overexpressed PD-L1 (4T1-PD-L1) (Supplementary Figure 6). Additionally, we co-incubated NPs-Ate with free Atezolizumab to induce competitive blocking (Figure 2f), like how it was done with human cell lines. NPs-Ate uptake closely resembled PD-L1 levels in cell lines (Figure 2g). Furthermore, fluorescence signals also decreased in cells cultured with free atezolizumab, dropping from 88.62 ± 8.67 to 13.33 ± 2.73 (mean ± SD; P<0.05) (Figure 2g). This finding indicated that NPs-Ate specifically adhered to PD-L1 in mouse breast cancer cells. To determine probe sensitivity in detecting up-regulated PD-L1, we used different murine interferon-γ (INF-γ) concentrations to induce up-regulated PD-L1 expression in 4T1 cells (Figure 2f, h and i). After 48 h, PD-L1 expression had significantly increased (Figure 2h) and was detected by NPs-Ate (Figure 2f and i). The fluorescent intensity of NP-Ate was 7.29±1.60 a.u in the control group and increased to 82.47 ± 0.61 a.u in 200 IU/mL INF-γ inducing group (mean ± SD), at the cell level.
NPs-Ate Specifically Accumulates in Tissue Expressing PD-L1
To assess NPs-Ate safety, probes were injected into nude mice. Mouse body weights showed no significant differences when compared with controls. Also, no obvious histological changes or pathological damage (H&E staining) were observed in tissue sections from major organs, not was liver or kidney function impacted (Supplementary Figure 7). Therefore, probes did not exert any obvious toxicity, demonstrated good biocompatibility in vivo, and could be used for in vivo imaging. Bio-distribution analyses showed high fluorescence signals in the liver and kidneys. The spleen, where PD-L1 expression occurs, also showed specific NPs-Ate accumulation (Supplementary Figure 8).
We also investigated specific NPs-Ate targeting in an MBA-MD-231-injected mouse model at different time points (6, 12, 24, 36, 48, and 72 h, Figure 3a). The highest SBR was observed in the NPs-Ate group and was 2.90-fold higher when compared with the NPs-IgG group (P=0.01; n=3) (Figure 3b). The SBR in MBA-MD-231-PD-L1-injected mice increased to 11.51±1.35 (Figure 3b). By adding the free anti-PD-L1 antibody atezolizumab, probe uptake reduced by 34.2% (SBR, 6.08 vs 4.0; P=0.03; n=3), thus NPs-Ate binding was specific in vivo (Figure 3b). Therefore, NPs-Ate could be potentially used to detect different PD-L1 expression levels in human breast cancer cells.
 |
Figure 3 In vivo NPs-Ate fluorescent imaging. (a) Images of MDA-MB-231 and MDA-MB-231-PD-L1 tumor mice (n=3) treated with NPs-Ate, NPs-IgG, and free atezolizumab blocking at different times post injection (p.i.) (6, 12, 24, 36, 48, 60, and 72 h). Quantification (c). (b) 4T1-PD-L1 and 4T1 tumor mice (n=3) treated with NPs-Ate, NPs-IgG, and free atezolizumab blocking at different times p.i. (6, 12, 24, 36, 48, and 72 h) and quantification (d). (e) Image of the three-tumor mouse model (left to right: 4T1-EV, 1/2 4T1-PD-L1+1/2 4T1-EV, and 4T1-PD-L1) (n=3) (f). In vitro tumor tissue (g) and PD-L1 IHC (h). Data are represented as the mean ± standard deviation (n=3), ** P<0.01, and *P<0.05. Scale bar = 100 µm. |
NPs-Ate targeting in a BABL/C mouse model was also examined (Figure 3c and d). When compared with low PD-L1 expression 4T1 tumors, 4T1-overexpressed PD-L1 (4T1-PD-L1) tumors showed higher probe uptake (SBR, 3.17 vs 11.14; P=0.006). Upon free atezolizumab addition, SBR was −2.22-fold lower (P<0.05) and decreased to 5.03±1.08. In a three-tumor mouse model, three different PD-L1 expressing tumors (Figure 3e) showed different NPs-Ate uptake rates with respect to SBR (8.665 vs 5.321 vs 3.464, respectively; P<0.05; n=3) in the same mice (Figure 3f–h). Therefore, NPs-Ate potentially detected different PD-L1 expression levels in a 4T1 mouse tumor model. To further verify NPs-Ate targeting in vivo, MMTV-PyVT transgenic mice were also injected with NPs-Ate to detect PD-L1 expression. NPs-Ate specifically gathered in tumors concomitant with high PD-L1 expression levels (Supplementary Figure 9).
We next explored in vivo MRI imaging. T1-weighted imaging data at different time points were collected (Figure 4, Supplementary Figure 10). Considerable T1 contrast signals were observed after NPs-Ate injection when compared with Gd-DTPA and NPs-IgG in MDA-MB-231 model (Figure 4a and b) and 4T1-PD-L1 model (Figure 4c and d). Tumor signal strength was at a maximum at 12 h post-injection (p.i.) in the MDA-MB-231 model (Figure 4a and b) and 4 h p.i. in the 4T1-PD-L1 model (Figure 4c and d). Therefore, NPs-Ate appeared to enhance T1-weighted MRI signals.
 |
Figure 4 In vivo NPs-Ate MRI imaging. Images showing MDA-MB-231 (a and c), 4T1-PD-L1 (b and d) tumor-bearing mice signal to background ratio (SBR) at different times (c and d). NPs-IgG and Gd-DTPA with a 23.5 mg Gd3+/kg dose. Data are represented as the mean ± standard deviation (n=3), ** P<0.01. |
NPs-Ate Can Be Used to Monitor Dynamic PD-L1 Changes in vivo
To assess PD-L1 expression in tumor cells in response to different therapies, 4T1 tumor-bearing mice were treated with chemotherapy, radiation, and INF-γ intervention (Figure 5a; Supplementary Figure 11). At day 7, significantly increased NPs-Ate uptake was observed when compared with controls in vivo (SBR: 10.426 vs 4.133, P<0.05 n=8; 8.185 vs 3.856, P<0.05 n=8; 12.98 vs 3.775 P<0.05 n=5, respectively) (Supplementary Figure 12) and in vitro (mean; 50,235 vs 26,972 P<0.05; 51,228 vs 26,085 P<0.05; and 54,933 vs 17,541, respectively P<0.05; n=3) (Figure 5b, c, h and i; Supplementary Figure 11b and c) fluorescence signals. These data suggested that NPs-Ate successfully detected increased PD-L1 expression levels when induced by radiation therapy, chemotherapy (Nanoparticle albumin-bound paclitaxel (Nab-paclitaxel), and INF-γ.
 |
Figure 5 NPs-Ate can be used to monitor PD-L1 dynamic changes and predict therapeutic effects in vivo. (a) The treatment processes. (b–g) Nab-paclitaxel combined with PD-1 therapy. (h–m) IR combined with PD-1 therapy. (b and h) On day 8, the fluorescence pictures of tumor tissue after Nab-pax (b) and IR (h) intervention and (c and i) their quantitation (n=5). (d and j) On day 15, in vivo fluorescence pictures of treatment model under PD-1 combined (d) Nab-pax and (j) IR intervention and (e and k) their quantitation. (f and l) Tumor volume during treatment (n=3). (g and m) Overall survival curves. Data are represented as the mean ± standard deviation (n=3), *** P<0.001, ** P<0.01, and *P<0.05. |
To further examine if NPs-Ate probes predicted PD-1 therapeutic responses, we examined fluorescence signals (Figure 5d, e, j and k; Supplementary Figure 11d and e) in tumors at day 14 and monitored tumor volume and survival (Figure 5f, g, l and m; Supplementary Figure11f and g). We observed that mice with PD-1 combined with Nab-paclitaxel, radiation, and INF-γ intervention had better SBR values (14.98 vs 9.512 P<0.05; 13.55 vs 10.0 P<0.05; and 16.41 vs 13.32 P<0.05; n=5, respectively) (Figure 5e and k; Supplementary Figure 11e). IHC staining showed that rising tracer uptake levels were related to increase PD-L1 expression (Figure 6, Supplementary Figure 13). Tumor growth inhibition was observed after PD-1 combination with Nab-paclitaxel, radiation, and INF-γ (330.9 vs 645.1, P<0.05; 236.7 vs 503.3 P<0.05; and 270.4 vs 588.6, P<0.05, respectively, n=5) and improved OS (Figure 5f, g, l and m; Supplementary Figure11f and g). CD8 IHC staining confirmed that the combined treatment group had increased CD8+ T cell infiltration (Figure 6, Supplementary Figure 13). However, without intervention, tumor volumes and fluorescence signals between anti-PD-1 and IgG therapies were not different. Better tumor growth inhibition and OS rates in the combination group showed that Nab- paclitaxel, radiation, and INF-γ may have altered 4T1 tumor-bearing mice from immunologically “inactive” to “active. Critically, NPs-Ate appeared to capture early PD-L1 expression changes during PD-1 combined therapy and potentially predicted PD-1 treatment effects.
 |
Figure 6 PD-L1 and CD8 expression after PD-1 therapy. The expression (immunohistochemistry) of PD-L1 and CD8 in every treatment group after PD-1 concomitant with Nab-paclitaxel (Nab-pax) (a) and IR (b) therapy. Scale bar =100 µm. |
Discussion
Recently, the Impassion 130 trial reported that Atezolizumab in combination with nab-paclitaxel increased progression-free survival rates in a metastatic TNBC patient subgroup with PD-L1 positivity.8 While ICT is anticipated to improve the clinical treatment of TNBC patients, previous studies have indicated that the associated clinical benefit rates are only 20%–30% for TNBC.11 Therefore, optimizing ICT outputs is vital to increase OS rates in patients, enhance the quality of life, and save medical resources. Non-invasive PD-L1 molecular imaging could be beneficial for assessing PD-L1 status at different time points and evaluating therapeutic responses to ICT. This approach has the potential to select ICT patient beneficiaries and predict treatment responses effectively.
Numerous studies have highlighted the effectiveness and efficiency of radionuclide imaging in assessing PD-L1 expression in malignancies.32,39,40 However, it is challenging to repeatedly perform radionuclide imaging, particularly for 64Cu and 89Zr which have extended half-lives. This limitation makes it difficult to dynamically track dynamic changes in PD-L1 expression over short periods due to concerns about radioactive patient management and radiation safety.29,30 To overcome these limitations, in this study, we designed and synthesized an NIR/MRI dual-mode probe called NPs-Ate which specifically targets PD-L1. The synthetic materials ICG, Gd-DTPA, and HSA, are widely used in the clinical settings and are safe and free from ionizing radiation. NPs-Ate probes exhibit stable fluorescence and magnetic resonance properties, enabling non-invasively monitoring of dynamic PD-L1 expression during treatments and potentially predicting ICT efficacy.
Currently, PD-L1 expression assessments are used to predict therapeutic responses in TNBC studies. PD-L1 expression has been associated with better disease-free survival.41,42 However, defining specific cut-off levels for high and low PD-L1 expression remains challenging. For instance, in the KEYNOTE-355 trial, PD-L1 was positively defined with a CPS of >10 in 22C3 assays, while in the IMpassion 130 trial, immune cell scores of ≥ 1 were defined in SP142 assays.12 Importantly, up-regulated PD-L1 was identified in tumor and antigen-presenting cells stimulated either by IFN and toll-like receptor ligands,15,16 radiotherapy,17 chemotherapy,18–20 or cancer targeted therapy.21 Some studies have suggested that PD-L1 levels should be interpreted as continuous variables rather than previously used high and low PD-L1 cut-off levels.22 Consequently, determining PD-L1 expression is a complex process both in vivo and in vitro, requiring accurate detection and prediction to assess ICT efficacy. It’s worth mentioning that detecting PD-L1 expression through IHC often necessitates core needle biopsy, which is an invasive procedure. Therefore, the development of non-invasive methods to accurately determine PD-L1 expression is highly desirable.
Currently, visible fluorescence dyes like IRDye800CW and fluorescent nanoparticles are widely used in imaging techniques.43 However, their application is often hindered, due to in vivo scattering and spontaneous fluorescence.32 Fluorescence imaging using NIR, particularly NIR-II, has attracted considerable research attention due to its advantages, such as no ionizing radiation, less interference from spontaneous tissue fluorescence, and deep penetration.25 Antaris et al first reported an NIR-II tail (>1000 nm) in some fluorescence ICG and IRDye800CW dyes.44 ICG exhibited higher quantum yields compared to some NIR-II dyes, making further research into this phenomenon promising. Identifying optimal fluorophores will accelerate the clinical translation of NIR-II bio-imaging.28,45 The limited biosafety of rare earth, quantum dot, and other materials emitting NIR fluorescence has hindered their clinical translation, highlighting the need for safer materials for comprehensive NIR-II imaging to monitor ICT efficacy. In our study, NPs-Ate was synthesized by loading ICG into HSA and identifying robust NIR-II fluorescence signals; the highest SBR signals were observed at 11.51 at 36 h p.i. in mice bearing 4T1-PD-L1 xenografted tumors.
Different molecular imaging technologies have distinct benefits and drawbacks. Combining two or more modes can generate complementing data and increase sensitivity and specificity. Importantly, our molecular imaging strategy demonstrated potential in screening potential patients, and evaluating immunotherapy efficacy and prognoses. In clinical settings, MRI is a widely used imaging technique, and is a non-invasive, non-ionizing, high spatial resolution, high tissue penetration, and highly-performing anatomical imaging modality.46 Therefore, combining MRI with other imaging techniques provides supplementary information and improves diagnoses for optimal image-assisted cancer treatments.47,48
NIR fluorescence is highly sensitive and capable of detecting low tumor-associated biomarker concentrations, making it valuable for early malignant tumor diagnosis. However, bimodality imaging probes with synergetic MRI and NIR fluorescence combinations represent an unmet need in early malignant tumor diagnosis. Several NIR/MRI bimodal probes were shown to provide high sensitivity and spatial resolution for molecular imaging and surgical guidance.49,50 However, most studies have focused on NIR-I fluorescence imaging, with few addressing immunotherapy efficacy. In a study by Du et al they demonstrated that PD-L1 antibody specificity and targeting extended PD-L1-Gd life in the circulation, leading to enhanced and persistent MRI signals. Anatomical references can be observed by combining NIR fluorescence with the high spatial resolution of MRI and extending effective imaging windows.27 In our study, we first monitored PD-L1 expression after radiotherapy, chemotherapy, and INF-γ therapy when combined with PD-1 treatment, and preliminarily indicated that NIR-II fluorescence and MRI dual molecular imaging could be used to monitor dynamic PD-L1 expression. Moreover, relationships between increased PD-L1 expression levels and treatments were explored by monitoring tumor size and mouse prognosis after treatment, while probe signal uptake was preliminarily related to therapeutic effects in mice.
Molecular imaging techniques now hold significant potential for evaluating immunotherapy efficacy. However, many challenges exist: 1) The limited numbers of receptors and ligands respond to immunotherapeutic efficacy and are currently used in molecular imaging. In the future, more imaging targets must be identified to monitor immunotherapy mechanisms and responses. 2) Due to shortcomings in existing molecular tracers, safe, highly sensitive, and highly specific tracers must be developed to ensure stability in the body, to distinguish between cancer and immune cells, and to accurately detect PD-L1 and other target protein expression.
Most tracers have been evaluated in preclinical studies; therefore, ongoing clinical studies must confirm molecular imaging feasibility, clinical safety, and immune monitoring prediction outcomes for patients who may potentially benefit from immunotherapy.
Conclusion
We have developed a novel nanoparticle NPs-Ate probe composed of Atezolizumab, ICG, and GD-DTPA. This innovative dual-mode NIR-II/MRI imaging platform holds the potential to guide ICT precisely and effectively, either as a mono-immunotherapy or in combination with chemotherapy or radiotherapy, specifically in TNBC patients. The translation of our novel imaging platform into clinical settings offers the opportunity to optimize and monitor the therapeutic outcomes of ICT, thereby enhancing its effectiveness.
Abbreviations
DAPI, 6-diamidino-2-phenylindole; CCK8, Cell Counting Kit-8; CPS, Combined positive score; DTPA, Diethylenetriamine pentaacetic acid; DTPAA, Diethylenetriaminepentaacetic acid dianhydride; DMSO, Dimethyl sulfoxide; FBS, Fetal bovine serum; NIR-I, First near infrared; Gd, Gadolinium; H&E, Hematoxylin & eosin; HSA, Human serum albumin; ICIs, Immune checkpoint inhibitors; ICT, Immune-checkpoint blocking therapy; IHC, Immunohistochemistry; IHC, Immunohistochemistry; ICG, Indocyanine green; IFN, Interferon; MRI, Magnetic resonance imaging; mAbs, Monoclonal antibodies; EDC•HCl, N-(3-dimethylaminopropyl)-N’-ethylcarbodiimide hydrochloride; NPs-Ate, Nanoparticle-atezolizumab; NHS, N-hydroxysuccinimide; OS, Overall survival; PBS, Phosphate buffered saline; PD-1(L1), Programmed cell death protein-1/ligand-1; NIR-II, Second near-infrared; SBR, Signal background ratio; TNBC, Triple negative breast cancer; 89Zr-Atezolizumab, Zirconium-89-labeled atezolizumab.
Data and Material Availability
Study data are included in the article or uploaded as supplementary information. Data are available in the main text or supplementary materials.
Ethical Approval and Consent to Participate
Animal studies were conducted with approval from Xiamen University’s Institutional Animal Care and Use Committee. All procedures were performed in accordance with approved guidelines, including the National Standard for Laboratory Animals of the People’s Republic of China (GB14925-2010), and the Guidelines for Ethical Review of Laboratory Animal Welfare (GBT 35892-2018).
Author Contributions
All authors made a significant contribution to the work reported, whether that is in the conception, study design, execution, acquisition of data, analysis and interpretation, or in all these areas; took part in drafting, revising or critically reviewing the article; gave final approval of the version to be published; have agreed on the journal to which the article has been submitted; and agree to be accountable for all aspects of the work.
Funding
This work was supported by the Natural Science Foundation Committee of China (No.82172009, 32171363), Fujian Major Scientific and Technological Special Project for Social Development (No.2020YZ016002), Xiamen’s Key Laboratory of Precision Medicine for Endocrine-Related Cancers, Fujian Key Laboratory of Precision Diagnosis and Treatment in Breast Cancer.
Disclosure
Prof. Dr. Guo-Jun Zhang reports a patent 202210234058.7 pending to State Intellectual Property Office of China with listed licensee: Min Chen, Guojun Zhang, Wanling Liu, Yongqu Zhang and Yuanyuan Zhu. The authors declare no other competing interests in this work.
References
1. O’Brien KM, Cole SR, Tse C-K, et al. Intrinsic breast tumor subtypes, race, and long-term survival in the Carolina breast cancer study. Clin Cancer Res. 2010;16(24):6100–6110. doi:10.1158/1078-0432.CCR-10-1533
2. Lei S, Zheng R, Zhang S, et al. Breast cancer incidence and mortality in women in China: temporal trends and projections to 2030. Cancer Biol Med. 2021;18(3):900–909. doi:10.20892/j.issn.2095-3941.2020.0523
3. Budczies J, Bockmayr M, Denkert C, et al. Classical pathology and mutational load of breast cancer - integration of two worlds. J Pathol Clin Res. 2015;1(4):225–238. doi:10.1002/cjp2.25
4. Stanton SE, Adams S, Disis ML. Variation in the incidence and magnitude of tumor-infiltrating lymphocytes in breast cancer subtypes: a systematic review. JAMA Oncol. 2016;2(10):1354–1360. doi:10.1001/jamaoncol.2016.1061
5. Denkert C, von Minckwitz G, Darb-Esfahani S, et al. Tumour-infiltrating lymphocytes and prognosis in different subtypes of breast cancer: a pooled analysis of 3771 patients treated with neoadjuvant therapy. Lancet Oncol. 2018;19(1):40–50. doi:10.1016/S1470-2045(17)30904-X
6. Lotfinejad P, Asghari Jafarabadi M, Abdoli Shadbad M, et al. Prognostic role and clinical significance of Tumor-Infiltrating Lymphocyte (TIL) and Programmed Death Ligand 1 (PD-L1) expression in Triple-Negative Breast Cancer (TNBC): a systematic review and meta-analysis study. Diagnostics. 2020;10(9). doi:10.3390/diagnostics10090704
7. Kitano A, Ono M, Yoshida M, et al. Tumour-infiltrating lymphocytes are correlated with higher expression levels of PD-1 and PD-L1 in early breast cancer. ESMO Open. 2017;2(2):e000150. doi:10.1136/esmoopen-2016-000150
8. Schmid P, Adams S, Rugo HS, et al. Atezolizumab and Nab-Paclitaxel in advanced triple-negative breast cancer. N Engl J Med. 2018;379(22):2108–2121. doi:10.1056/NEJMoa1809615
9. Schmid P, Cortes J, Pusztai L, et al. Pembrolizumab for early triple-negative breast cancer. N Engl J Med. 2020;382(9):810–821. doi:10.1056/NEJMoa1910549
10. Cortes J, Rugo HS, Cescon DW, et al. Pembrolizumab plus chemotherapy in advanced triple-negative breast cancer. N Engl J Med. 2022;387(3):217–226. doi:10.1056/NEJMoa2202809
11. Sharma P, Allison JP. The future of immune checkpoint therapy. Science. 2015;348(6230):56–61. doi:10.1126/science.aaa8172
12. Doroshow DB, Bhalla S, Beasley MB, et al. PD-L1 as a biomarker of response to immune-checkpoint inhibitors. Nat Rev Clin Oncol. 2021;18(6):345–362. doi:10.1158/1078-0432.CCR-10-1533
13. Tibaldi C, Lunghi A, Baldini E. Use of programmed cell death protein ligand 1 assay to predict the outcomes of non-small cell lung cancer patients treated with immune checkpoint inhibitors. World J Clin Oncol. 2017;8(4):320–328. doi:10.5306/wjco.v8.i4.320
14. Sanmamed MF, Chen L. Inducible expression of B7-H1 (PD-L1) and its selective role in tumor site immune modulation. Cancer J. 2014;20(4):256–261. doi:10.1097/ppo.0000000000000061
15. Sun C, Mezzadra R, Schumacher TN. Regulation and function of the PD-L1 checkpoint. Immunity. 2018;48(3):434–452. doi:10.1016/j.immuni.2018.03.014
16. Chen S, Crabill GA, Pritchard TS, et al. Mechanisms regulating PD-L1 expression on tumor and immune cells. J Immunother Cancer. 2019;7(1):305. doi:10.1186/s40425-019-0770-2
17. Dovedi SJ, Illidge TM. The antitumor immune response generated by fractionated radiation therapy may be limited by tumor cell adaptive resistance and can be circumvented by PD-L1 blockade. Oncoimmunology. 2015;4(7):e1016709. doi:10.1080/2162402X.2015.1016709
18. Lim YJ, Koh J, Kim S, et al. Chemoradiation-induced alteration of programmed death-ligand 1 and CD8(+) tumor-infiltrating lymphocytes identified patients with poor prognosis in rectal cancer: a matched comparison analysis. Int J Radiat Oncol Biol Phys. 2017;99(5):1216–1224. doi:10.1016/j.ijrobp.2017.07.004
19. Parra ER, Villalobos P, Behrens C, et al. Effect of neoadjuvant chemotherapy on the immune microenvironment in non-small cell lung carcinomas as determined by multiplex immunofluorescence and image analysis approaches. J Immunother Cancer. 2018;6(1):48. doi:10.1186/s40425-018-0368-0
20. Leduc C, Adam J, Louvet E, et al. TPF induction chemotherapy increases PD-L1 expression in tumour cells and immune cells in head and neck squamous cell carcinoma. ESMO Open. 2018;3(1):e000257. doi:10.1136/esmoopen-2017-000257
21. Akbay EA, Koyama S, Carretero J, et al. Activation of the PD-1 pathway contributes to immune escape in EGFR-driven lung tumors. Cancer Discov. 2013;3(12):1355–1363. doi:10.1158/2159-8290.CD-13-0310
22. Nimmagadda S. Quantifying PD-L1 expression to monitor immune checkpoint therapy: opportunities and challenges. Cancers. 2020;12(11). doi:10.3390/cancers12113173
23. Hughes DJ, Chand G, Goh V, Cook GJR. Inter- and intraobserver agreement of the quantitative assessment of [(99m)Tc]-labelled anti-programmed death-ligand 1 (PD-L1) SPECT/CT in non-small cell lung cancer. EJNMMI Res. 2020;10(1):145. doi:10.1186/s13550-020-00734-x
24. Niemeijer AN, Leung D, Huisman MC, et al. Whole body PD-1 and PD-L1 positron emission tomography in patients with non-small-cell lung cancer. Nat Commun. 2018;9(1):4664. doi:10.1038/s41467-018-07131-y
25. Bensch F, van der Veen EL, Lub-de Hooge MN, et al. (89)Zr-atezolizumab imaging as a non-invasive approach to assess clinical response to PD-L1 blockade in cancer. Nat Med. 2018;24(12):1852–1858. doi:10.1038/s41591-018-0255-8
26. Du Y, Liang X, Li Y, et al. Nuclear and fluorescent labeled PD-1-Liposome-DOX-(64)Cu/IRDye800CW allows improved breast tumor targeted imaging and therapy. Mol Pharm. 2017;14(11):3978–3986. doi:10.1021/acs.molpharmaceut.7b00649
27. Du Y, Liang X, Li Y, et al. Liposomal nanohybrid cerasomes targeted to PD-L1 enable dual-modality imaging and improve antitumor treatments. Cancer Lett. 2018;414:230–238. doi:10.1016/j.canlet.2017.11.019
28. Truillet C, Oh HLJ, Yeo SP, et al. Imaging PD-L1 expression with ImmunoPET. Bioconjug Chem. 2018;29(1):96–103. doi:10.1021/acs.bioconjchem.7b00631
29. Wei SC, Duffy CR, Allison JP. Fundamental mechanisms of immune checkpoint blockade therapy. Cancer Discov. 2018;8(9):1069–1086. doi:10.1158/2159-8290.Cd-18-0367
30. Deng L, Liang H, Burnette B, et al. Irradiation and anti-PD-L1 treatment synergistically promote antitumor immunity in mice. J Clin Invest. 2014;124(2):687–695. doi:10.1172/jci67313
31. Zhang M, Jiang H, Zhang R, et al. Near-infrared fluorescence-labeled anti-PD-L1-mAb for tumor imaging in human colorectal cancer xenografted mice. J Cell Biochem. 2019;120(6):10239–10247. doi:10.1002/jcb.28308
32. Liu WL, Zhang YQ, Li LT, et al. Application of molecular imaging in immune checkpoints therapy: from response assessment to prognosis prediction. Crit Rev Oncol Hematol. 2022;176:103746. doi:10.1016/j.critrevonc.2022.103746
33. Yang RQ, Lou KL, Wang PY, et al. Surgical navigation for malignancies guided by near-infrared-II fluorescence imaging. Small Methods. 2021;5(3):e2001066. doi:10.1002/smtd.202001066
34. Zhong Y, Ma Z, Wang F, et al. In vivo molecular imaging for immunotherapy using ultra-bright near-infrared-IIb rare-earth nanoparticles. Nat Biotechnol. 2019;37(11):1322–1331. doi:10.1038/s41587-019-0262-4
35. Shi X, Zhang Z, Zhang Z, et al. Near-infrared window II fluorescence image-guided surgery of high-grade gliomas prolongs the progression-free survival of patients. IEEE Trans Biomed Eng. 2022;69(6):1889–1900. doi:10.1109/TBME.2021.3130195
36. Carr JA, Franke D, Caram JR, et al. Shortwave infrared fluorescence imaging with the clinically approved near-infrared dye indocyanine green. Proc Natl Acad Sci USA. 2018;115(17):4465–4470. doi:10.1073/pnas.1718917115
37. Reda M, Ngamcherdtrakul W, Nelson MA, et al. Development of a nanoparticle-based immunotherapy targeting PD-L1 and PLK1 for lung cancer treatment. Nat Commun. 2022;13(1):4261. doi:10.1038/s41467-022-31926-9
38. Liu H, Tian Y, Xue C, Niu Q, Chen C, Yan X. Analysis of extracellular vesicle DNA at the single-vesicle level by nano-flow cytometry. J Extracell Vesicles. 2022;11(4):e12206. doi:10.1002/jev2.12206
39. Maute RL, Gordon SR, Mayer AT, et al. Engineering high-affinity PD-1 variants for optimized immunotherapy and immuno-PET imaging. Proc Natl Acad Sci USA. 2015;112(47):E6506–14. doi:10.1073/pnas.1519623112
40. Heskamp S, Hobo W, Molkenboer-Kuenen JD, et al. Noninvasive imaging of tumor PD-L1 expression using radiolabeled anti-PD-L1 antibodies. Cancer Res. 2015;75(14):2928–2936. doi:10.1158/0008-5472.Can-14-3477
41. Botti G, Collina F, Scognamiglio G, et al. Programmed Death Ligand 1 (PD-L1) tumor expression is associated with a better prognosis and diabetic disease in triple negative breast cancer patients. Int J Mol Sci. 2017;18(2). doi:10.3390/ijms18020459
42. Vilain RE, Menzies AM, Wilmott JS, et al. Dynamic changes in PD-L1 expression and immune infiltrates early during treatment predict response to PD-1 blockade in Melanoma. Clin Cancer Res. 2017;23(17):5024–5033. doi:10.1158/1078-0432.Ccr-16-0698
43. Su Y, Yu B, Wang S, Cong H, Shen Y. NIR-II bioimaging of small organic molecule. Biomaterials. 2021;271:120717. doi:10.1016/j.biomaterials.2021.120717
44. Antaris AL, Chen H, Diao S, et al. A high quantum yield molecule-protein complex fluorophore for near-infrared II imaging. Nat Commun. 2017;8:15269. doi:10.1038/ncomms15269
45. Yu J, Wang L, Xie X, et al. Multifunctional nanoparticles codelivering doxorubicin and amorphous calcium carbonate preloaded with indocyanine green for enhanced chemo-photothermal cancer therapy. Int J Nanomedicine. 2023;18:323–337. doi:10.2147/ijn.S394896
46. Ananta JS, Godin B, Sethi R, et al. Geometrical confinement of gadolinium-based contrast agents in nanoporous particles enhances T1 contrast. Nat Nanotechnol. 2010;5(11):815–821. doi:10.1038/nnano.2010.203
47. Chen L, Chen J, Qiu S, et al. Biodegradable nanoagents with short biological half-life for SPECT/PAI/MRI multimodality imaging and PTT therapy of tumors. Small. 2018;14(4). doi:10.1002/smll.201702700
48. Lin J, Wang M, Hu H, et al. Multimodal-imaging-guided cancer phototherapy by versatile biomimetic theranostics with UV and γ-irradiation protection. Adv Mater. 2016;28(17):3273–3279. doi:10.1002/adma.201505700
49. Harrison VS, Carney CE, MacRenaris KW, Waters EA, Meade TJ. Multimeric near IR-MR contrast agent for multimodal in vivo imaging. J Am Chem Soc. 2015;137(28):9108–9116. doi:10.1021/jacs.5b04509
50. Li C, Cao L, Zhang Y, et al. Preoperative detection and intraoperative visualization of brain tumors for more precise surgery: a new dual-modality MRI and NIR nanoprobe. Small. 2015;11(35):4517–4525. doi:10.1002/smll.201500997
 © 2023 The Author(s). This work is published and licensed by Dove Medical Press Limited. The
full terms of this license are available at https://www.dovepress.com/terms
and incorporate the Creative Commons Attribution
- Non Commercial (unported, 3.0) License.
By accessing the work you hereby accept the Terms. Non-commercial uses of the work are permitted
without any further permission from Dove Medical Press Limited, provided the work is properly
attributed. For permission for commercial use of this work, please see paragraphs 4.2 and 5 of our Terms.
© 2023 The Author(s). This work is published and licensed by Dove Medical Press Limited. The
full terms of this license are available at https://www.dovepress.com/terms
and incorporate the Creative Commons Attribution
- Non Commercial (unported, 3.0) License.
By accessing the work you hereby accept the Terms. Non-commercial uses of the work are permitted
without any further permission from Dove Medical Press Limited, provided the work is properly
attributed. For permission for commercial use of this work, please see paragraphs 4.2 and 5 of our Terms.