")
Back to Journals » Infection and Drug Resistance » Volume 16
Novel Biomarker Panel of Let-7d-5p and MiR-140-5p Can Distinguish Latent Tuberculosis Infection from Active Tuberculosis Patients
Authors Liu J , Li Y, Liu T, Shi Y, Wang Y, Wu J , Qi Y
Received 29 March 2023
Accepted for publication 31 May 2023
Published 16 June 2023 Volume 2023:16 Pages 3847—3859
DOI https://doi.org/10.2147/IDR.S412116
Checked for plagiarism Yes
Review by Single anonymous peer review
Peer reviewer comments 2
Editor who approved publication: Prof. Dr. Héctor Mora-Montes
Jiaxing Liu,1 Ye Li,2 Ting Liu,2 Yuru Shi,2 Yun Wang,2 Jing Wu,2 Yingjie Qi2
1Department of Clinical Laboratory, Nanjing Drum Tower Hospital, The Affiliated Hospital of Nanjing University Medical School, Nanjing, Jiangsu Province, 210008, People’s Republic of China; 2Department of Laboratory Medicine, The First Affiliated Hospital of USTC, Division of Life Sciences and Medicine, University of Science and Technology of China, Hefei, Anhui, 230000, People’s Republic of China
Correspondence: Yingjie Qi, Department of Laboratory Medicine, The First Affiliated Hospital of USTC, Division of Life Sciences and Medicine, University of Science and Technology of China, Hefei, Anhui, 230000, People’s Republic of China, Email [email protected]
Background: Mycobacterium tuberculosis (Mtb) survives inside a human host for a long time in the form of latent tuberculosis infection (LTBI). Latent infection of tuberculosis has the opportunity of developing into active tuberculosis (ATB), which has greatly endangered human health. The existing diagnostic methods cannot effectively distinguish LTBI from ATB. Therefore, more effective diagnostic biomarkers and methods are urgently needed.
Methods: Here, we screened the GEO data set, conducted joint differential analysis and target gene enrichment analysis, after filtering the disease-related database, we screened the differential miRNA related to TB. The qPCR was used to verify the miRNAs in 84 serum samples. Different combinations of biomarkers were evaluated by logistic regression to obtain a biomarker panel with good performance for diagnosing LTBI.
Results: A panel with two miRNAs (hsa-let-7d-5p, hsa-miR-140-5p) was established to differentiate LTBI from ATB. Receiver operating characteristic (ROC) curve showed that the area under the curve (AUC) are 0.930 (sensitivity = 100%, specificity = 88.5%) and 0.923 (sensitivity = 100%, specificity = 92.3%) with the biomarker panel for the training set and test set respectively.
Conclusion: The findings indicated that the logistic regression model built by let-7d-5p and miR-140-5p has the ability to distinguish LTBI from active TB patients.
Keywords: tuberculosis, active tuberculosis, latent tuberculosis infection, miRNA
Introduction
Tuberculosis is one of the leading causes of death worldwide. In 2021, 10.60 million people were newly infected with Mycobacterium tuberculosis (Mtb), according to the data released by World Health Organization (WHO).1 China ranks third among countries with a high burden of tuberculosis in the world, with 780,000 new tuberculosis patients. Mtb can survive in macrophages of tuberculosis granuloma in host.2 The dominant host immune response can prevent bacterial growth and eliminate Mtb. On the contrary, Mtb can remain in the host for a long time and become latent tuberculosis infection (LTBI). Only 5–15% of population with LTBI will progress to active tuberculosis (ATB).3 Tuberculin skin test (TST) and interferon-γ release assay (IGRA) are common methods for screening Mtb infection, but they cannot distinguish those people with LTBI from ATB patients.4
The lack of effective diagnosis of LTBI has largely hampered the development of clinical diagnosis and therapy of tuberculosis. The T cell-based interferon γ release assay(IGRA) has contributed to the diagnosis of tuberculosis, but it still cannot distinguish those people with LTBI from ATB patients. Wang et al developed a method to diagnose LTBI, adding IL-2 as an additional biomarker, together with IFN-γ to distinguish those people with LTBI from those with ATB to enhance the diagnostic performance (area under the curve [AUC] of receiver operating characteristics [ROC] analysis is 0.7494 [95% CI: 0.6419–0.8569, P < 0.0001]).5 There are also lots of studies on diagnostic markers based on blood samples, miRNA, cytokines and proteins in peripheral blood have the potential to be used as diagnostic biomarkers.6–8
MicroRNA is an endogenous single stranded noncoding small RNA with length of 18–22 nucleotides. It participates in the pathogenesis of various diseases by triggering the translation inhibition or degradation of its target mRNA.9–11 MicroRNA plays a key role in the progress of tuberculosis. After tuberculosis infection, a large number of miRNA expression are up-regulated or down-regulated to regulate apoptosis,12 autophagy, inflammation and innate immune responses.13–15 More and more evidences show that miRNA may become a new tool for the diagnosis of tuberculosis.16
The stability of miRNA makes it as a good candidate with high potential to be used as biomarker. More and more evidences show that miRNAs play an important role in regulating tuberculosis infection. Zhu et al found that the down-regulation of miR-18b leads to the expression increasing of its target gene HIF-1α and promotes the inflammatory response, clearing Mtb inside of the macrophages.14 Zhu et al found that miR-378d was down regulated during the infection with Mtb, and the intracellular survival rate of Mtb was reduced by targeting Rab10.17 Yuan et al released that the overexpression of mir-18a down regulated its target gene ATM, and then promoted the survival of intracellular Mtb via the ATM pathway and autophagy process.18
In this study, we screened the data sets published in GEO, conducted joint differential analysis and target gene enrichment analysis, after filtering the disease-related database, we screened the differential miRNA related to TB, verified expression of real-time fluorescence quantitative PCR (qPCR), and validated the biomarkers for their performance for distinguishing populations with LTBI from ATB patients.
Methods and Materials
Data and Samples Collection
‘Tuberculosis’ was used as a keyword to search data sets in GEO database. Inclusion criterion of these data are as follows:
- Species should be human.
- Sample type should be peripheral blood mononuclear cell (PBMC) or whole blood or serum or plasma.
- Each data set contains ATB, LTBI and Healthy Control (HC) three groups.
- Data set should be normalized.
Three data sets, including two miRNA data sets and one mRNA data set, were downloaded from GEO databases and information in detail about each data set can be found in Table 1. All miRNA data sets in this study were openly available in GEO database (NCBI) and downloaded by searching GEO ID. Two miRNA target public databases including mirtarbase (https://mirtarbase.cuhk.edu.cn/) and mirDB (http://mirdb.org/) were also downloaded for analysis (Figure 1).
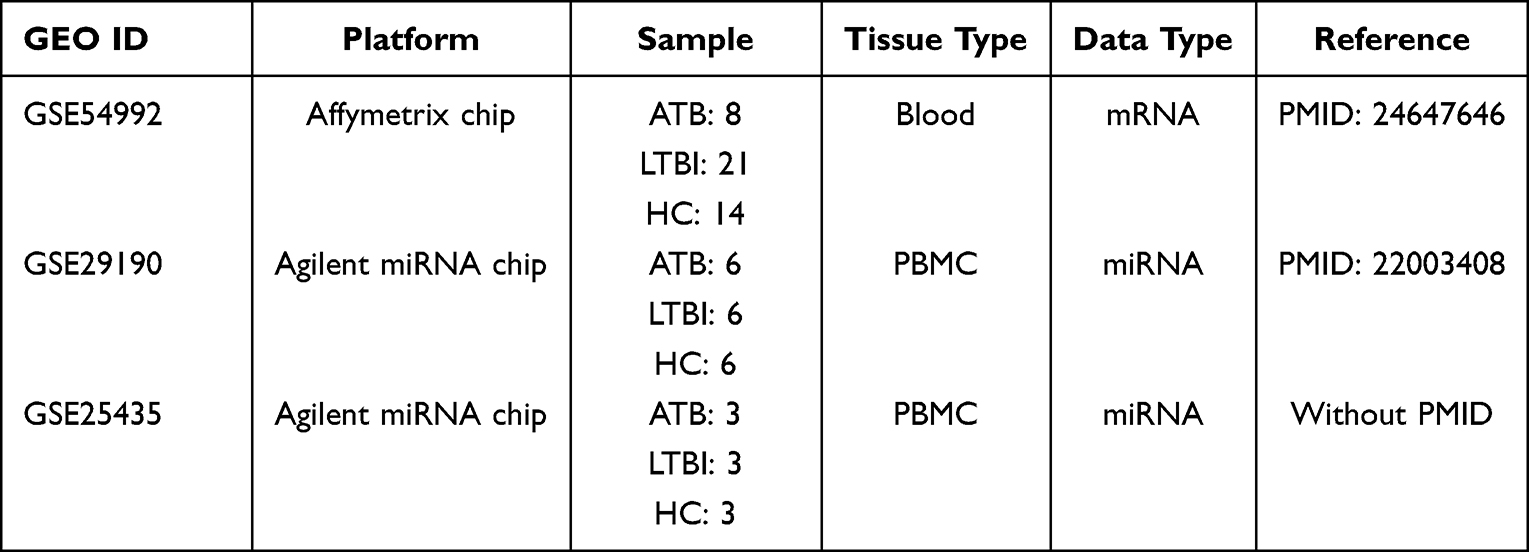 |
Table 1 Public Data sets |
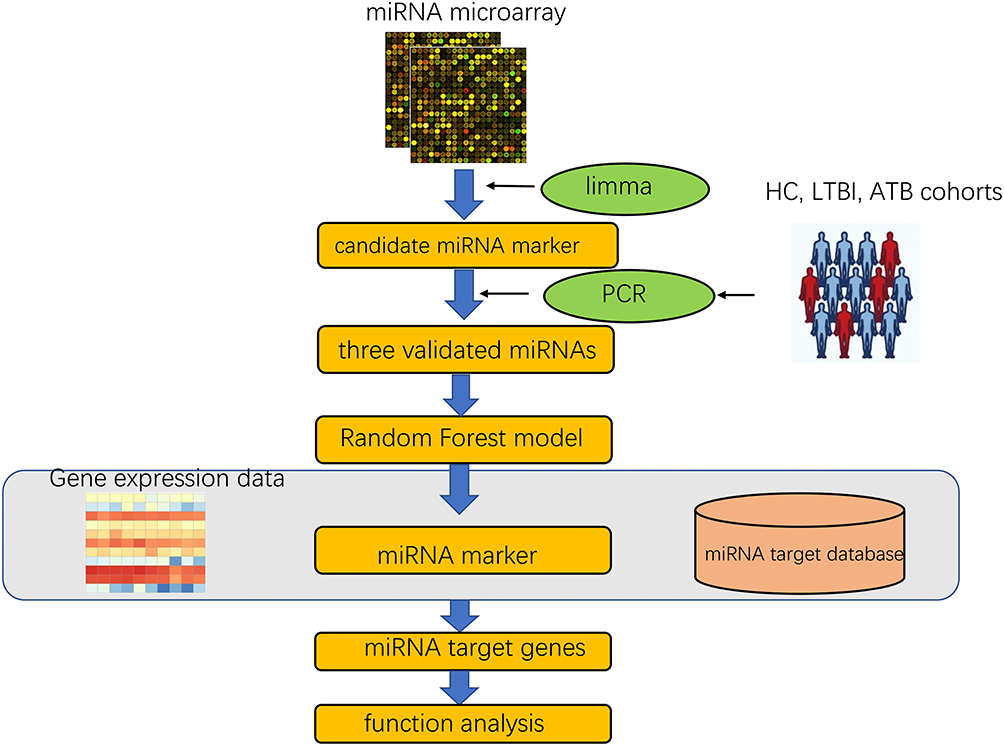 |
Figure 1 The study design and data analysis workflow. |
The study was performed using samples stored at the First Affiliated Hospital of University of Science and Technology of China (Anhui Provincial Hospital Infection Hospital).The diagnosis of ATB was based on clinical presentation, chest radiography, and bacterial plating culture results. Furthermore, IGRA results used to distinguish Mtb group and HC group. Inclusion criteria: 1) Active pulmonary tuberculosis, the diagnostic criteria for patients with latent tuberculosis were referred to China 2001 Guidelines for the diagnosis and treatment of tuberculosis developed by the Tuberculosis Branch of the Medical Association; 2) Patients with tuberculosis through sputum smear acid-fast bacillus or tuberculosis culture positive diagnosis; 3) The healthy subjects underwent routine physical examination and PPD test antigen specificity test and Mtb test were negative; 4) Patients with latent infection were specific for PPD tests and Mtb antigens test is positive, but the patient has no TB-related symptoms; 5) Age range from 18- to 69-years-old; 6) Informed consent of patients was obtained in this study. Exclusion criteria: 1) lung tumor disease; 2) Pulmonary fibrosis, silicosis, pneumoconiosis; 3) Patients infected with human immunodeficiency virus (HIV); and 4) along with other types of infectious diseases.The basic clinical characteristics of the participants were summarized in Table 2. A total of 84 serum samples were collected from 29 ATB patients, 25 LTBI patients and 30 HCs.
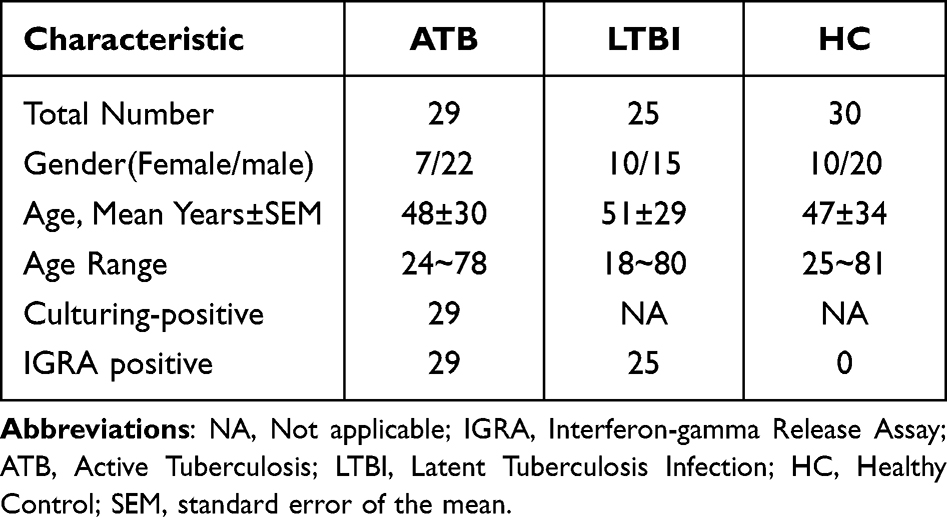 |
Table 2 Characteristics of Study Participants with ATB, LTBI and HCs |
MiRNA Differential Analysis
Limma (3.46.0) was used to perform differential analysis for each miRNA data set. P value (p<0.01) and fold change (|log2foldchange|≥1) were used to determine the differentially expressed miRNAs (DEMs) among the three groups of interest. DEMs results from two miRNA data sets were combined as total DEMs in each comparison group including ATB vs. LTBI and LTBI vs. HC.
Differential miRNA Target Genes Prediction
The mirtarbase contains miRNA-target interactions (MTIs) information. The collected MTIs are experimentally validated by reporters’ studies, such as Western blotting or microarray assays with overexpression or knockdown of miRNAs. And mirDB is an online database for miRNA target prediction and functional annotations. After selecting DEMs, this two databases were used to search target genes of each DEM. Furthermore, another mRNA public data set was used to filter DEMs’ target genes based on the theory that most miRNAs could down-regulated target genes.
Limma package was also used to analyze the differential expression of mRNA with p value (p<0.01) and fold change (|log2foldchange|≥1). Combined with MTI information, interactions with opposite expression trend were selected, which meant miRNA was up-regulated while mRNA down-regulated, vice versa.
Enrichment of Target Genes
In this study, metascape, a web enrichment tool was used to perform enrichment analysis through default databases and default parameters. After that, we intersected ATB vs. LTBI and LTBI vs. HC and determined the top 20 of enrichment results to find vital enrichment results in tuberculosis infection process.
MiRNA Filtering According to Enrichment Result
In order to research the roles of miRNAs in enrichment functions, single miRNA impact score (Simpact) was defined to estimate the importance of miRNAs in specific functional term (see Equation 1.1). MiRNAs with single impact score higher than 0.01 were selected. Furthermore, according to HMDD (the human miRNA disease database), only miRNAs related to tuberculosis were select to further analysis.
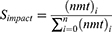
Note that nmt represents the number of miRNA target genes, n represents total number of miRNAs in specific enrichment term.
Serum Sample PCR Validation
MiRNA Extraction
In order to perform quantitative analysis of the target miRNAs, a final concentration of 10−4 pM commercial external control miRNAs (Cat: CR100-01, TIANGEN, Beijing, China) was equally added to each serum sample from ATB, LTBI and HC before miRNA extraction, which is a reference gene applied in the subsequent test.
Total miRNAs were extracted from patients’ serum using an miRNA isolation Kit (Cat: DP503, TIANGEN, Beijing, China). Briefly, 900μL lysis solution was add to 200μL serum and mixed given its two solutions sufficiently, then mixture sample was incubated for 5 min at room temperature to permit the complete disruption of nucleoprotein complexes. The tube containing the homogenate and 0.2mL chloroform was shaken vigorously to facilitate the denaturation and precipitation of proteins. After centrifugation at 12,000×g for 15 min at 4°C, the raw RNA in supernatant was transferred in aqueous to a fresh tube and purified following the manufacturer’s instruction.
Candidate miRNA Quantification by Real-Time qRT-PCR
TIANGEN miRcute Plus miRNA qPCR Kit (Cat: FP411-01, TIANGEN, Beijing, China) was used to determine the expression levels of miRNAs according to the manufacturer’s instruction in a CFX ConnectTm Real-Time System (Bio-Rad, Hercules, CA, USA).
The first-strand cDNA was synthesized from the total RNA using a miRcute Plus miRNA First-Strand cDNA Kit (Cat: KR211-02, TIANGEN, Beijing, China). Subsequently, quantitative real-time PCR was conducted using gene-specific primers to measure the expression levels of miRNAs. Gene-specific primers used in this assay were listed in Table 3. Following initial denaturation at 95°C for 30s, 40 cycles of PCR amplification were performed at 95°C for 5s and 60°C for 30s with a dissociation curve at the end of the amplification reaction.
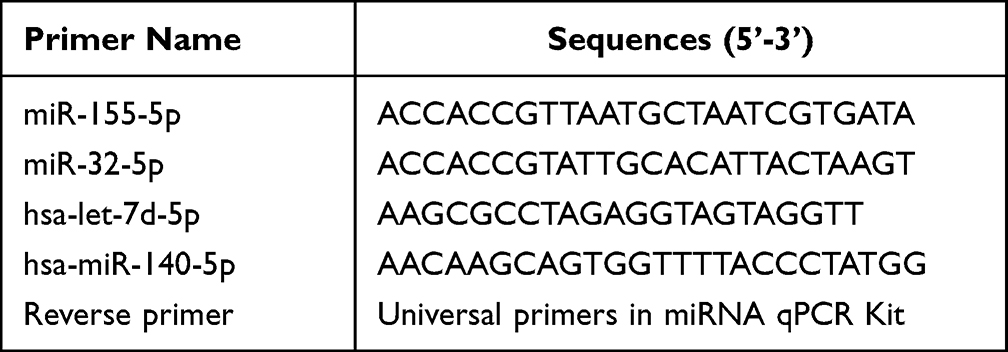 |
Table 3 Primers Used in the qPCR Assay |
The obtained qRT-PCR data were calculated using the 2−ΔΔCT method13 while the relative amount of the target gene miRNAs were normalized according to the difference in CT values of commercial external control miRNA.
The results of qRT-PCR were analyzed using GraphPad Prism (version 7.0). Differences between groups were statistically analyzed by analysis of Mann–Whitney-Wilcoxon. A P-value <0.05 was considered statistically significant.
Model Construction to Identify miRNA Marker
We evaluated different combinations of biomarkers by logistic regression to obtain a biomarker panel with good performance in diagnosing LTBI. LTBI samples as a whole was labeled as “1” and all HC+ATB samples as a control group with label “0”. Data were randomly divided into two sets for each of the three comparisons, with one set serving as a training set and the other as a test set. The training set was defined as the model used for training and test set was an independent data set to verify the validity of the model. A stepwise logistic regression model was used to select diagnostic microRNA markers based on the training data set and then checked by leave-one-out cross-validation.14 A test set of samples was used to verify the first set using stepwise logistic regression and the model established was then evaluated using a ROC curve.
Results
Differentially Expressed miRNAs Analysis
To identify DEMs in ATB vs. LTBI and LTBI vs. HC, P-value < 0.05 and |log2FC|≥1 were set as cut-off criteria. A total of 174 DEMs were identified among the two groups in GSE25435 data set including 51 upregulated miRNAs and 39 downregulated miRNAs in ATB vs. LTBI. However, only 24 DEMs were identified in GSE29190 data set (Table 4). The difference in the number of DEM screening between the two data sets may be due to the inconsistency of their experimental platform versions, where GES2435 is Agilent miRNA microarray (version 2.0) and GSE29190 is Agilent miRNA microarray (version 3). DEMs results were demonstrated by using volcano plots (Figure 2). 101 DEMs including 57 upregulated miRNAs and 44 downregulated miRNAs were found between ATB and LTBI after combined two data set results.97 DEMs including 43 upregulated miRNAs and 54 downregulated miRNAs were also identified between LTBI and HC by the same way.
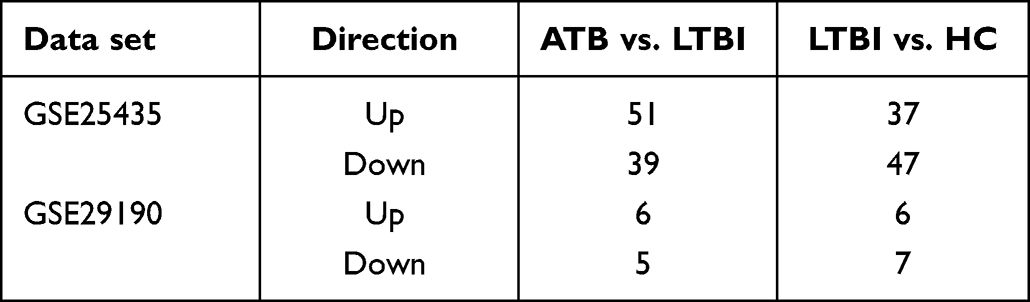 |
Table 4 Two Data sets miRNA Differential Analysis Results |
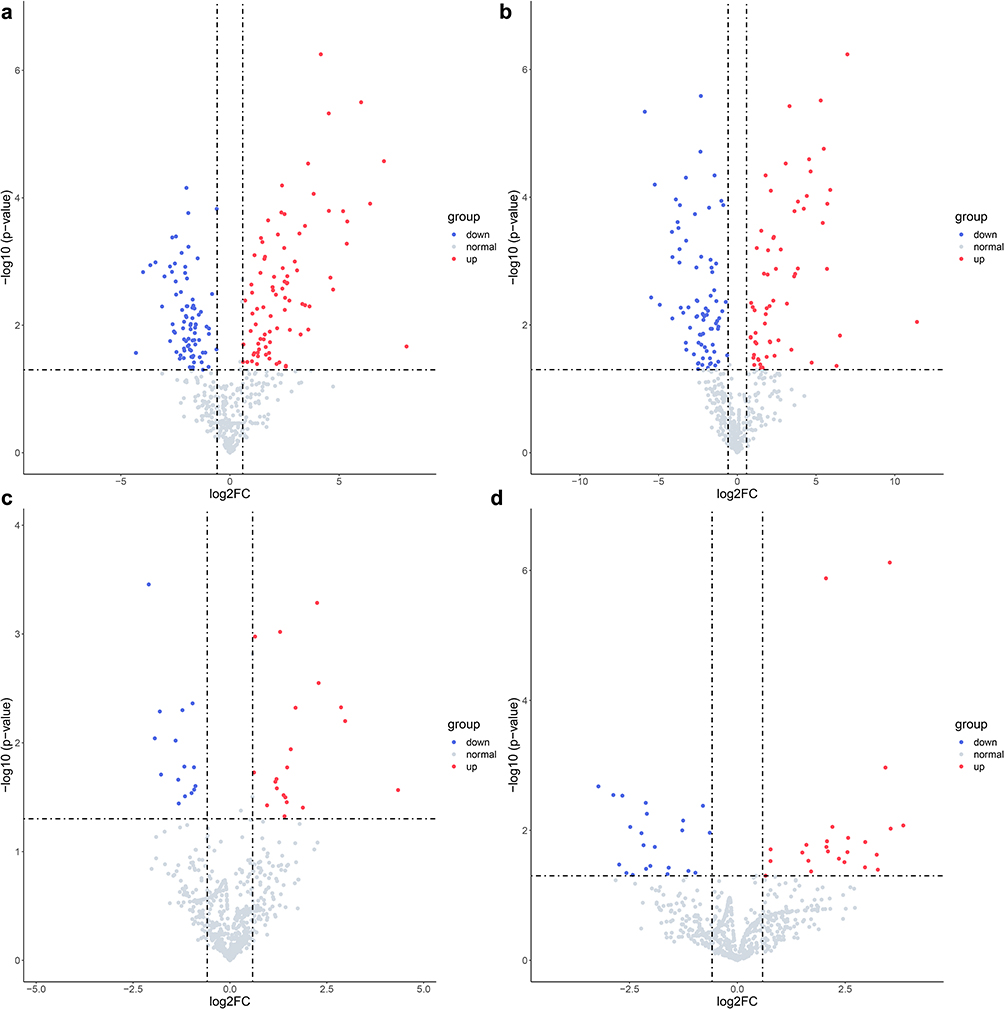 |
Figure 2 Volcano plot of differentially expressed miRNAs. (a) GSE25435 miRNA data set ATB vs. LTBI differential analysis; (b) GSE25435 miRNA data set LTBI vs. HC differential analysis; (c) GSE29190 miRNA data set ATB vs. LTBI differential analysis; (d) GSE29190 miRNA data set LTBI vs. HC differential analysis. Note that only top 10 up and down differential miRNAs were marked in the plots. |
Differentially Expressed miRNAs’ Target Genes Prediction
MiRNAs were important in different biological functions and pathways by regulating their target mRNAs. In this section, according to the MTI information and difference analysis results of mRNA data set, the most important miRNA-mRNA association was selected to further analyze which functions would affected by miRNAs. Totally, 86,781 paired miRNA-target gene including 2459 miRNAs and 8849 target genes were obtained from both mirtarbase and mirDB. MiRNAs could downregulate target genes due to the biological process that miRNAs bind to the 3’UTRs of their target genes and interfere with translation.19 2156 target genes regulated by 89 miRNAs between ATB and LTBI, and 2139 target genes regulated by 81 miRNAs between LTBI and HC were retained after removing miRNAs which upregulate mRNAs. Finally, the selected target genes were used to next function enrichment analysis.
Metascape Enrichment Analysis
The top 20 enriched functional terms of differentially expressed mRNA in ATB vs. LTBI were shown in Figure 3. Among that, response to growth factor (GO:0070848), pathways in cancer (hsa05200), blood vessel development (GO:0001568) and regulation of kinase activity (GO:0043549) were most significant. For LTBI vs. HC, Figure 4 was also shown the top 20 enriched functional terms. Some enriched terms such as response to growth factor, signaling by receptor tyrosine kinases (R-HSA-9006934), diseases of signal transduction by growth factor receptors and second messengers (R-HSA-5663202), pathways in cancer were identified. Some enriched terms were also found in previous researches.20 Pathways in cancer enriched term was found in both ATB vs. LTBI and LTBI vs. HC. Microbes caused diseases like Hepatitis B virus could lead to liver cancer. Previous research found that chronic tuberculosis infection could cause DNA damage in their vicinity.21
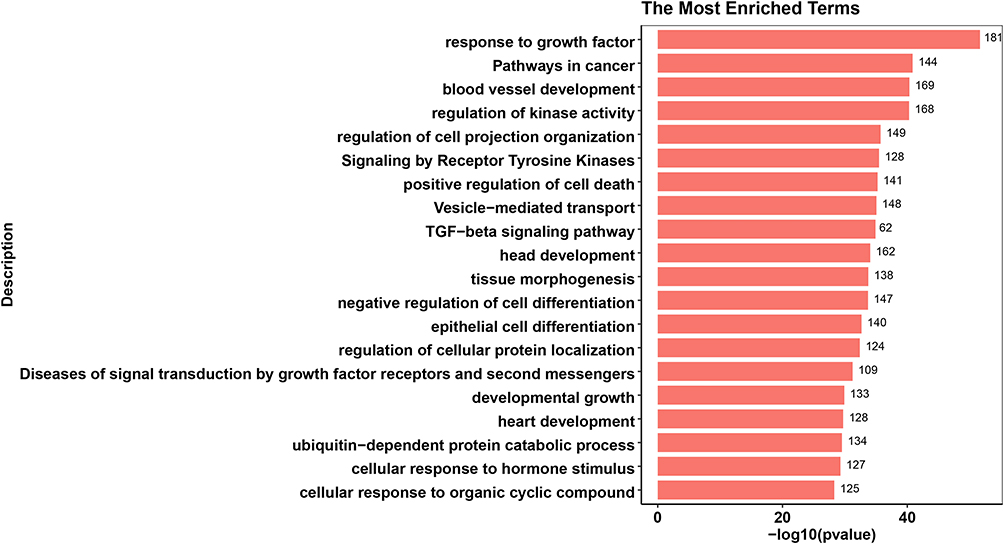 |
Figure 3 Top 20 enrichment terms in ATB vs. LTBI differentially expressed miRNA target genes enrichment terms. The value at the end of the bar indicates the number of genes enriched to this function. |
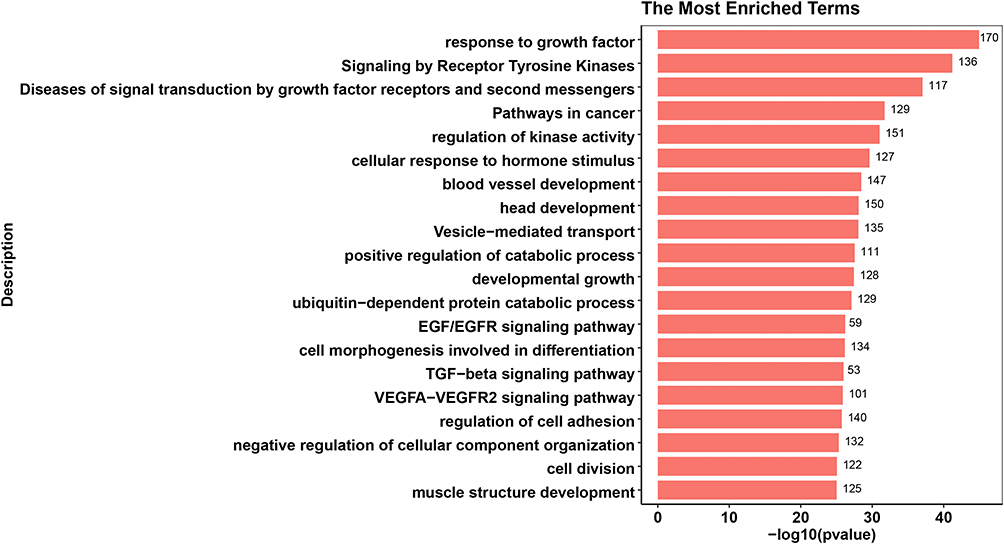 |
Figure 4 Top 20 enrichment terms in LTBI vs. HC differentially expressed miRNA target gene enrichment terms. The value at the end of the bar indicates the number of genes enriched to this function. |
Response to growth factor was most enriched term in both ATB vs. LTBI and LTBI vs. HC. This term may play an important role in the development of tuberculosis infection. Some growth factors like vascular endothelial growth factor(VEGF) are increased in ATB patients.22 Previous study also showed that deletion of TGF-β1 from the systems resulted in improved bacterial clearance and lesion sterilization.23 Furthermore, 181 genes regulated by 57 miRNAs were enriched in response to growth factor in ATB vs. LTBI. And 170 genes regulated by 60 miRNAs were also enriched in same term.
Vital miRNAs Filtered by Impact Score
In order to find vital miRNAs which can play important roles in most enriched terms. We defined miRNAs’ impact score to estimate miRNA impact value in specific term. Two comparisons’ (ATB vs. LTBI and LTBI vs. HC) most enriched term shared 11 miRNAs including hsa-let-7d-5p, hsa-miR-140-5p, hsa-miR-155-5p, hsa-miR-194-5p, hsa-miR-19a-3p, hsa-miR-29b-3p, hsa-miR-29c-3p, hsa-miR-30e-5p, hsa-miR-32-5p, hsa-miR-374a-5p and hsa-miR-92a-3p after removing miRNAs that impact score less than 0.01. In order to further screen out more reliable biomarker combinations, miRNAs were required to have a known relationship to tuberculosis. Thus, only 4 miRNAs including hsa-let-7d-5p, hsa-miR-140-5p, hsa-miR-155-5p, hsa-miR-32-5p were left after removing miRNAs not related to tuberculosis infection from HMDD database. The expression of four miRNAs in the three groups were validated by qPCR in serum samples from the validation/test cohort. (Figure 5).
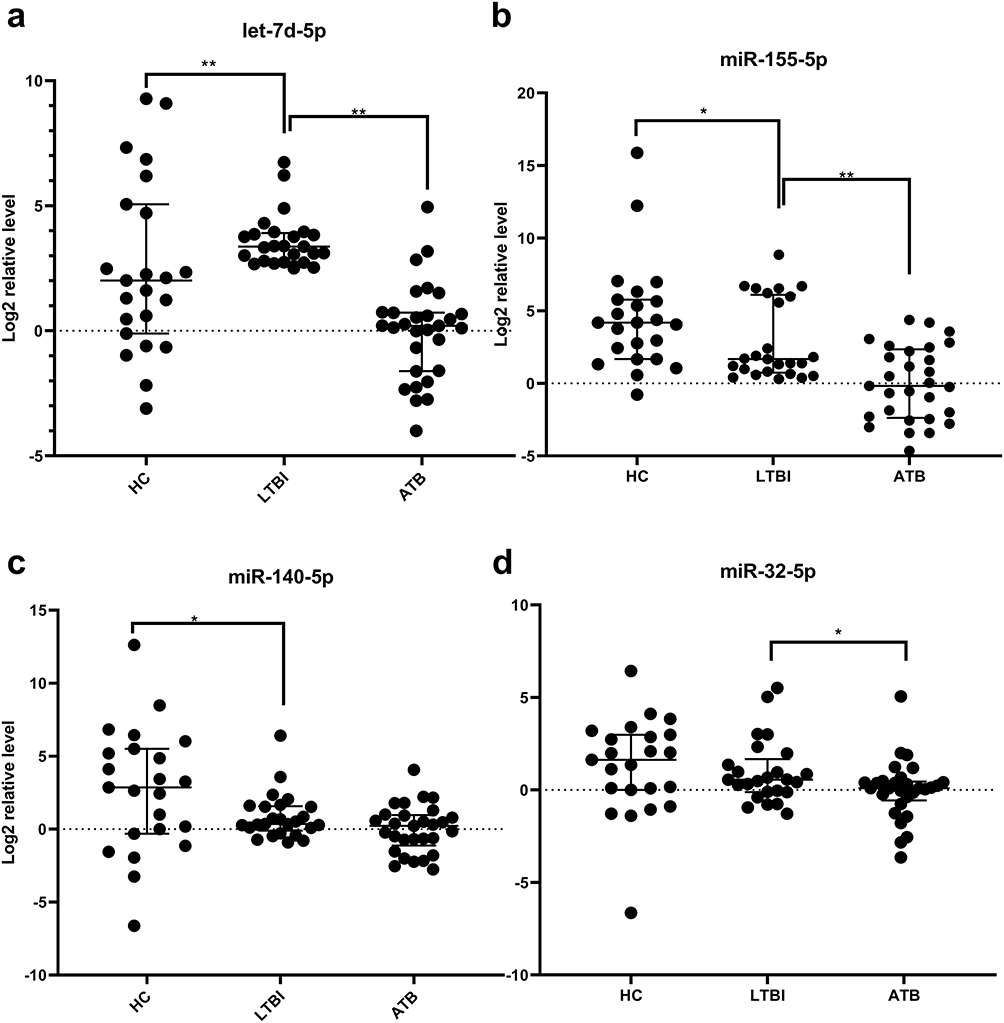 |
Figure 5 PCR results for four miRNAs. Notes: (a) serum hsa-let-7d-5p expression levels in three groups; (b) serum hsa-miR-155-5p expression levels in three groups; (c) serum hsa-miR140-5p expression levels in three groups; (d) serum hsa-miR-32-5p expression levels in three groups. The expression level of the validated miRNAs were normalized to CR100-01 (Log 2 relative level). Differences between groups were statistically analyzed by analysis of Mann–Whitney-Wilcoxon. *P<0.05, **P<0.01 |
MiRNAs Classification Model Building
Before model building, the assumptions of Logistic Regression was checked. First, as mentioned in method, the output label was binary and all samples were independent. The Pearson correlation coefficient between hsa-let-7d-5p and hsa-miR-140-5p was 0.2418 (P-value = 0.034). This indicates a low correlation between the two independent variables. Result of Box-Tidwell test shown that hsa-let-7d-5p (P = 0.9301) and hsa-miR-140-5p (P = 0.6186) have the linearity with log(odd) and that the assumption is satisfied. Models for the training sets were built using the logistic regression models: logit(P = LTBI) = −1.065+0.138*(hsa-let-7d-5p) −0.131 *(hsa-miR-140-5p).The diagnostic value of the data models derived from the training sets was validated with data from the test sets by examining ROC curves. The AUC value of the ROC curve was 0.930 (sensitivity = 100%, specificity = 88.5%) and 0.923 (sensitivity = 100%, specificity = 92.3%) with the biomarker panel for the training set and test set, respectively (Figure 6 and Table 5).
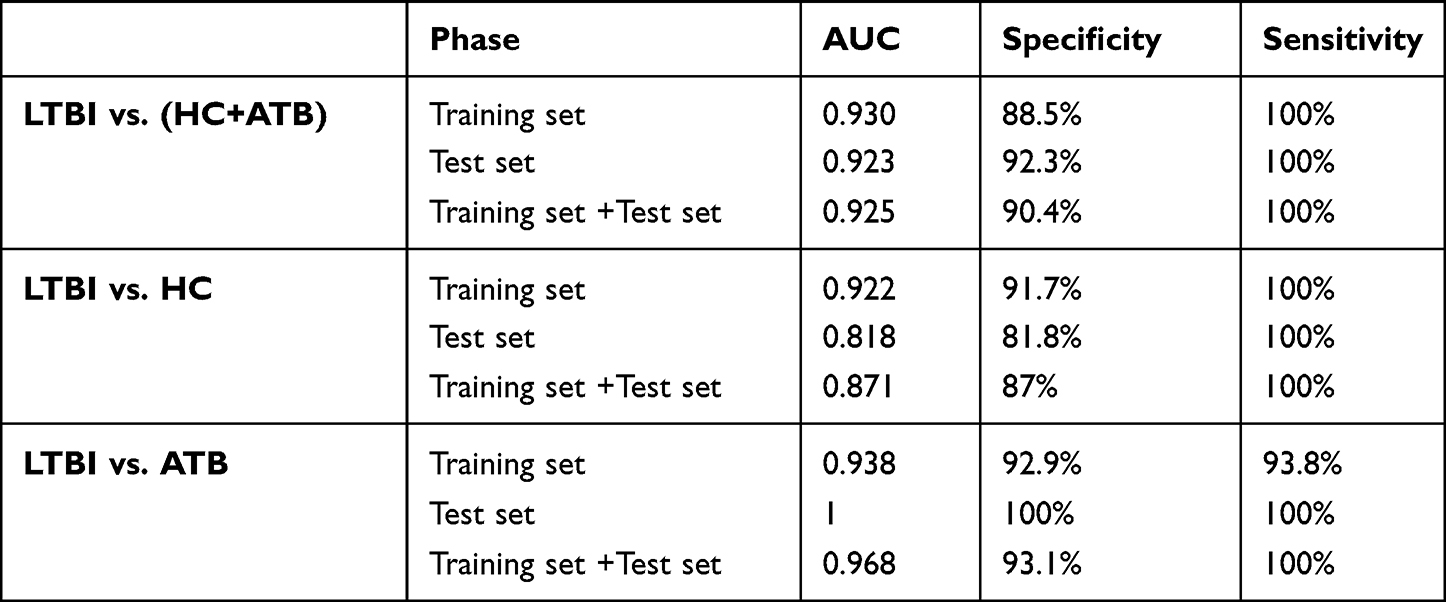 |
Table 5 The AUC, Specificity and Sensitivity of Two miRNA Panel |
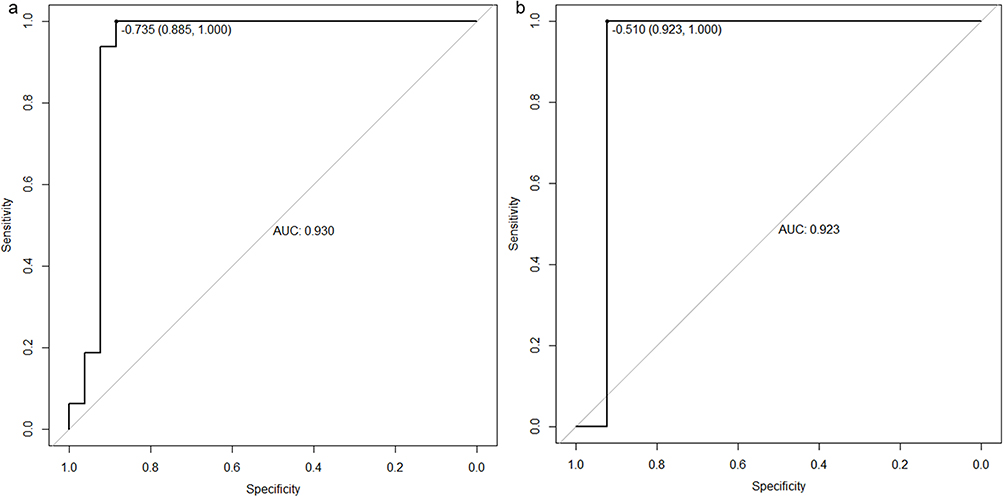 |
Figure 6 ROC curves for the biomarker panel of data sets. ROC curves of training set (a) showed AUC value was 0.93, the test set (b) showed AUC value was 0.923. |
Discussion
According to WHO estimation, the global TB latent infection population is close to 2 billion. The identification of LTBI is very important for TB prevention and control worldwide.1 Therefore, early detection and early treatment of LTBI is very necessary.
Biomarkers from peripheral blood are the best choice for clinical application due to their ease of collection and subsequent testing, which is also the main consideration in our selecting data sets. Here, we used a new filtration screening method to find serological diagnostic markers that can well distinguish the population with LTBI from those with pulmonary TB. Firstly, the miRNA expression of LTBI, ATB and HC from GEO data set were analyzed to select the DEMs. After filtering by miRNA impact score and disease database, 4 miRNAs were regarded as candidate biomarkers finally. After that, the combine panel of let-7d-5p and miR-140-5p obtained the lowest AIC in logistic regression model. ROC results of LOOCV shown that our model trained by let-7d-5p and miR-140-5p expression was good at distinguishing LTBI from ATB or HC with AUC higher than 0.9. As a result, we successfully discovered two reliable LTBI miRNA biomarkers.
Moreover, MiR-140-5p and let-7d-5p are not only important diagnostic markers for tuberculosis in this study. They are also widely studied in other diseases. In other studies, the levels of miR-140-5p were decreased in peripheral blood of children with Necrotizing pneumonia (NP), and miR-140-5p regulated the expressions of TLR4 in A549 cells.24 Moreover, Yang et al has showed that miR-140-5p regulates the inflammation of Acute Lung Injury (ALI) via TLR4/MyD88/NF-κB signaling pathway.25 Zhuo et al assessed that miR-140-5p inhibited cell proliferation and induced apoptosis of lung cancer cells and hindered the migration and invasion of lung carcinoma cells.26 In addition, Dong et al reported that miR-140-5p inhibited pulmonary fibrosis by blocking the activity of the Wnt1/β-catenin signaling pathway.27
As shown in study of Li et al, let-7d-5p was up-regulated in A549 cell exosomes, and participated in the generation and maintenance of cancerous bone pain in vivo.28 Let-7d-5p was also up-regulated in isolated pulmonary presentation (PSP-BHD), and inhibited the repair response of lung lesions.29 There was study shown that let-7d-5p may play its inhibitory role in the inflammatory response and apoptosis of intestinal epithelial cells in neonatal rats with necrotizing enterocolitis through the TLR4/NF-κB signaling pathway.30,31 Let-7d-5p expression was decreased in the plasma of patients with acute exacerbation of idiopathic pulmonary fibrosis (AE-IPF), indicating that let-7d-5p has potential as a marker for diagnosis and prediction of disease progression.10
However, the roles of miR-140-5p and let-7d-5p in the pathogenesis of tuberculosis have not been elucidated. In the present study, the expression of them were down-regulated in the serum of patients compared with HCs. And their target genes were enriched in terms of growth factor response, vascular development and kinase activity regulation. Whether they were involved in the pathogenesis of tuberculosis by regulating inflammation, apoptosis and other processes remains to be further explored.
For most marker identification methods, differentially expressed miRNAs or genes were used to identify markers. In this research, we selected miRNA markers to distinct different groups by combining miRNA functions. A new method was used to estimate miRNAs’ importance in specific pathway or enriched term. This method could be applied to other researches which aim to identify most important miRNAs in specific function terms.
Our research aimed at exploring biomarkers from peripheral blood, which are considered as highly valuable biomarkers and are conducive to large-scale further application. However, the sample size used in our research is insufficient, it is more necessary to use a larger number of samples to verify these targets. In addition, more subgroups such as patients with anti-TB therapies and cured TB need to be included in the study for further evaluation.
Conclusion
Response to growth factor was the most enriched term in both ATB vs. LTBI and LTBI vs. HC, which indicated that this term may have essential impact on the whole progression of tuberculosis infection. In our study, we coined Simpact to estimate miRNA values in specific function terms. This could help researchers to filter out important miRNAs. We believe that miRNAs’ Simpact which larger than 0.01 were important miRNAs. In this study, HMDD database was also considered to remove unrelated to tuberculosis infection miRNAs. It showed that the logistic regression model built by let-7d-5p and miR-140-5p have the ability to distinguish LTBI from active TB patients. However, our model still has some limitations. At present, our research results have only been verified in a small-scale sample, and its reliability has not yet been verified by a large-scale sample size, so it cannot be generalized for the time being. In addition, since the exact clinical features of LTBI have not yet been well-defined, there may be more influencing factors in the selection of LTBI samples that lead to changes in expression data. Although there are some limitations, our research can also provide strong data and theoretical support for future in-depth research and the development of tuberculosis early diagnosis products. The screening of biomarkers and their combinations is a huge and continuous research work. Although better miRNA combinations are screened at present, we believe that the combination of miRNA and other markers (such as mRNA, protein, etc.) will bring new breakthroughs in this field in the future. Finally, stable and reliable biomarker panels can also provide quantitative standards in the clinical definition of LTBI.
Data Sharing Statement
The data that support the findings of this study are openly available in GEO database (NCBI) at https://www.ncbi.nlm.nih.gov/geo/, which were downloaded by searching GEO ID: GSE54992, GSE29190 and GSE25435.
Ethics Approval and Informed Consent
Our study was approved by the Institutional Review Board of the First Affiliated Hospital of University of Science and Technology of China and the IRB number was 2021-BE(H)-005. We could not obtain written informed consent from the patients who have been discharged from hospital because this study is a retrospective study. But we obtained oral informed consent from all participants during telephone follow-up and the approval of the ethics committee of the First Affiliated Hospital of the University of Science and Technology of China. We insure that all data that could indicate the identity of the patients were kept strictly confidential in this study. Work on human beings is conducted in accordance with the Declaration of Helsinki.
Acknowledgments
Thanks to all authors for their contributions to this study.
Funding
This work was supported by “Natural Science Foundation of Anhui Province” (Number:S202302a04021214).
Disclosure
All authors declare that they have no conflicts of interest in this work.
References
1. World Health Organization. Global tuberculosis report 2021; 2021. Availble from: https://www.who.int/publications/digital/global-tuberculosis-report-2021.
2. Dorhoi A, Kaufmann SH. Pathology and immune reactivity: understanding multidimensionality in pulmonary tuberculosis. Semin Immunopathol. 2016;38:153–166. doi:10.1007/s00281-015-0531-3
3. Smith I. Mycobacterium tuberculosis pathogenesis and molecular determinants of virulence. Clin Microbiol Rev. 2003;16:463–496. doi:10.1128/CMR.16.3.463-496.2003
4. Herrera V, Perry S, Parsonnet J, Banaei N. Clinical application and limitations of interferon-gamma release assays for the diagnosis of latent tuberculosis infection. Clin Infect Dis. 2011;52:1031–1037. doi:10.1093/cid/cir068
5. Wang S, Diao N, Lu C, et al. Evaluation of the diagnostic potential of IP-10 and IL-2 as biomarkers for the diagnosis of active and latent tuberculosis in a BCG-vaccinated population. PLoS One. 2012;7:e51338. doi:10.1371/journal.pone.0051338
6. Schmidt CM, Lovero KL, Carvalho FR, et al. Serum anti-Mce1A immunoglobulin detection as a tool for differential diagnosis of tuberculosis and latent tuberculosis infection in children and adolescents. Tuberculosis. 2020;120:101893. doi:10.1016/j.tube.2019.101893
7. Sudbury EL, Clifford V, Messina NL, Song R, Curtis N. Mycobacterium tuberculosis-specific cytokine biomarkers to differentiate active TB and LTBI: a systematic review. J Infect. 2020;81:873–881. doi:10.1016/j.jinf.2020.09.032
8. Warsinske H, Vashisht R, Khatri P. Host-response-based gene signatures for tuberculosis diagnosis: a systematic comparison of 16 signatures. PLoS Med. 2019;16:e1002786. doi:10.1371/journal.pmed.1002786
9. Zhao YL, Zhang JX, Yang JJ, et al. MiR-205-5p promotes lung cancer progression and is valuable for the diagnosis of lung cancer. Thorac Cancer. 2022;13:832–843. doi:10.1111/1759-7714.14331
10. Min H, Fan S, Song S, et al. Plasma microRNAs are associated with acute exacerbation in idiopathic pulmonary fibrosis. Diagn Pathol. 2016;11:135. doi:10.1186/s13000-016-0583-2
11. Benfey PN. Molecular biology: microRNA is here to stay. Nature. 2003;425:244–245. doi:10.1038/425244a
12. Yang T, Ge B. miRNAs in immune responses to Mycobacterium tuberculosis infection. Cancer Lett. 2018;431:22–30. doi:10.1016/j.canlet.2018.05.028
13. Yang F, Yang Y, Chen Y, et al. MiR-21 is remotely governed by the commensal bacteria and impairs anti-TB immunity by down-regulating IFN-gamma. Front Microbiol. 2020;11:512581. doi:10.3389/fmicb.2020.512581
14. Zhu T, Liu H, Su L, et al. MicroRNA-18b-5p downregulation favors mycobacterium tuberculosis clearance in macrophages via HIF-1alpha by promoting an inflammatory response. ACS Infect Dis. 2021;7:800–810. doi:10.1021/acsinfecdis.0c00650
15. Chen YC, Lee CP, Hsiao CC, et al. MicroRNA-23a-3p down-regulation in active pulmonary tuberculosis patients with high bacterial burden inhibits mononuclear cell function and phagocytosis through TLR4/TNF-alpha/TGF-beta1/IL-10 signaling via targeting IRF1/SP1. Int J Mol Sci. 2020;21:8587. doi:10.3390/ijms21228587
16. Sinigaglia A, Peta E, Riccetti S, Venkateswaran S, Manganelli R, Barzon L. Tuberculosis-associated MicroRNAs: from pathogenesis to disease biomarkers. Cells. 2020;10:9. doi:10.3390/cells9102160
17. Zhu Y, Xiao Y, Kong D, et al. Down-Regulation of miR-378d Increased Rab10 expression to help clearance of mycobacterium tuberculosis in macrophages. Front Cell Infect Microbiol. 2020;10:108. doi:10.3389/fcimb.2020.00108
18. Yuan Q, Chen H, Yang Y, Fu Y, Yi Z. miR-18a promotes Mycobacterial survival in macrophages via inhibiting autophagy by down-regulation of ATM. J Cell Mol Med. 2020;24:2004–2012. doi:10.1111/jcmm.14899
19. Lytle JR, Yario TA, Steitz JA. Target mRNAs are repressed as efficiently by microRNA-binding sites in the 5’ UTR as in the 3’ UTR. Proc Natl Acad Sci U S A. 2007;104:9667–9672. doi:10.1073/pnas.0703820104
20. Wu M, Aung H, Hirsch CS, Toossi Z. Inhibition of Mycobacterium tuberculosis-induced signalling by transforming growth factor-beta in human mononuclear phagocytes. Scand J Immunol. 2012;75:301–304. doi:10.1111/j.1365-3083.2011.02668.x
21. Nalbandian A, Yan BS, Pichugin A, Bronson RT, Kramnik I. Lung carcinogenesis induced by chronic tuberculosis infection: the experimental model and genetic control. Oncogene. 2009;28:1928–1938. doi:10.1038/onc.2009.32
22. Alatas F, Alatas O, Metintas M, Ozarslan A, Erginel S, Yildirim H. Vascular endothelial growth factor levels in active pulmonary tuberculosis. Chest. 2004;125:2156–2159. doi:10.1378/chest.125.6.2156
23. Warsinske HC, Pienaar E, Linderman JJ, Mattila JT, Kirschner DE. Deletion of TGF-beta1 increases bacterial clearance by cytotoxic T cells in a tuberculosis granuloma model. Front Immunol. 2017;8:1843. doi:10.3389/fimmu.2017.01843
24. Wang H, Wu C, Kong D. miR-140-5p overexpression protects against lipopolysaccharide-induced necrotizing pneumonia via targeting toll-like receptor 4. Cell Mol Bioeng. 2021;14:339–348. doi:10.1007/s12195-021-00673-0
25. Yang Y, Liu D, Xi Y, Li J, Liu B, Li J. Upregulation of miRNA-140-5p inhibits inflammatory cytokines in acute lung injury through the MyD88/NF-kappaB signaling pathway by targeting TLR4. Exp Ther Med. 2018;16:3913–3920. doi:10.3892/etm.2018.6692
26. Zhuo E, Cai C, Liu W, Li K, Zhao W. Downregulated microRNA-140-5p expression regulates apoptosis, migration and invasion of lung cancer cells by targeting zinc finger protein 800. Oncol Lett. 2020;20:390. doi:10.3892/ol.2020.12253
27. Dong MN, Xiao Y, Li YF, et al. Amelioration of paraquat-induced pulmonary fibrosis in mice by regulating miR-140-5p expression with the fibrogenic inhibitor Xuebijing. Int J Immunopathol Pharmacol. 2020;34:2058738420923911. doi:10.1177/2058738420923911
28. Li X, Chen Y, Wang J, Jiang C, Huang Y. Lung cancer cell-derived exosomal let-7d-5p down-regulates OPRM1 to promote cancer-induced bone pain. Front Cell Dev Biol. 2021;9:666857. doi:10.3389/fcell.2021.666857
29. Min H, Ma D, Zou W, et al. FLCN-regulated miRNAs suppressed reparative response in cells and pulmonary lesions of Birt-Hogg-Dube syndrome. Thorax. 2020;75:476–485. doi:10.1136/thoraxjnl-2019-213225
30. Sun L, Sun M, Ma K, Liu J. Let-7d-5p suppresses inflammatory response in neonatal rats with necrotizing enterocolitis via LGALS3-mediated TLR4/NF-kappaB signaling pathway. Am J Physiol Cell Physiol. 2020;319:C967–C79. doi:10.1152/ajpcell.00571.2019
31. Ling HZ, Xu SZ, Leng RX, et al. Discovery of new serum biomarker panels for systemic lupus erythematosus diagnosis. Rheumatology. 2020;59:1416–1425. doi:10.1093/rheumatology/kez634
 © 2023 The Author(s). This work is published and licensed by Dove Medical Press Limited. The full terms of this license are available at https://www.dovepress.com/terms.php and incorporate the Creative Commons Attribution - Non Commercial (unported, v3.0) License.
By accessing the work you hereby accept the Terms. Non-commercial uses of the work are permitted without any further permission from Dove Medical Press Limited, provided the work is properly attributed. For permission for commercial use of this work, please see paragraphs 4.2 and 5 of our Terms.
© 2023 The Author(s). This work is published and licensed by Dove Medical Press Limited. The full terms of this license are available at https://www.dovepress.com/terms.php and incorporate the Creative Commons Attribution - Non Commercial (unported, v3.0) License.
By accessing the work you hereby accept the Terms. Non-commercial uses of the work are permitted without any further permission from Dove Medical Press Limited, provided the work is properly attributed. For permission for commercial use of this work, please see paragraphs 4.2 and 5 of our Terms.