Back to Journals » International Journal of General Medicine » Volume 9
Novel biomarker analysis of pleural effusion enhances differentiation of tuberculous from malignant pleural effusion
Authors Chen K, Feng P, Chang C, Chen T, Chuang H, Lee C, Su C, Lin L, Lee K
Received 10 November 2015
Accepted for publication 17 February 2016
Published 11 June 2016 Volume 2016:9 Pages 183—189
DOI https://doi.org/10.2147/IJGM.S100237
Checked for plagiarism Yes
Review by Single anonymous peer review
Peer reviewer comments 2
Editor who approved publication: Dr Scott Fraser
Kuan-Yuan Chen,1,2 Po-Hao Feng,1,2 Chih-Cheng Chang,1 Tzu-Tao Chen,1 Hsiao-Chi Chuang,1,3 Chun-Nin Lee,1,3 Chien-Ling Su,1,3 Lian-Yu Lin,4 Kang-Yun Lee,1,2
1Division of Pulmonary Medicine, Department of Internal Medicine, Shuang Ho Hospital, 2Department of Internal Medicine, School of Medicine, 3School of Respiratory Therapy, College of Medicine, Taipei Medical University, 4Division of Cardiology, Department of Internal Medicine, National Taiwan University Hospital, Taipei, Taiwan, Republic of China
Abstract: Lymphocytic pleurisy is commonly observed in tuberculosis and cancer. Noninvasive biomarkers are needed to distinguish tuberculous pleural effusion (TPE) from malignant pleural effusion (MPE) because current clinical diagnostic procedures are often invasive. We identified immune response biomarkers that can discriminate between TPE and MPE. Fourteen pleural effusion biomarkers were compared in 22 MPE patients and five TPE patients. Of the innate immunity biomarkers, the median levels of interleukin (IL)-1β and interferon-induced protein-10 (IP-10) were higher in TPE patients than in MPE patients (P<0.05 and P<0.01, respectively). Of the adaptive immunity biomarkers, the median levels of IL-13 and interferon-γ (IFN-γ) were higher in TPE patients than in MPE patients (P<0.05). In addition, the levels of basic fibroblast growth factor were higher in MPE patients than in TPE patients (P<0.05). Receiver operator characteristic analysis of these biomarkers was performed, resulting in the highest area under the curve (AUC) for IP-10 (AUC =0.95, 95% confidence interval, P<0.01), followed by IL-13 (AUC =0.86, 95% confidence interval, P<0.05). Our study shows that five biomarkers (IL-1β, IP-10, IFN-γ, IL-13, and basic fibroblast growth factor) have a potential diagnostic role in differentiating TPE from MPE, particularly in lung cancer-related MPE.
Keywords: biomarkers, tuberculous pleural effusion, lung cancer, malignant pleural effusion
Introduction
Pleural effusions (PEs) that stem from a wide range of recognized etiologies are commonly observed in clinical practice. A PE develops when there is too much production or too little absorption of fluid in the pleural space or an increase in permeability of vessels in pleura. It is the clinicians’ objective to establish the cause of effusion, whether it is heart failure, infection, or malignancy.1 Examination of pleural fluid is useful in determining the cause of a PE.2
Conventionally, the first step in pleural fluid analysis is determining if the effusion is a transudate or an exudate, according to the criteria of Light et al.3 The second step is to analyze the fluid using standard routine laboratory tests, including biochemistry, nucleated cells, microbiology, and nonroutine markers (eg, adenosine deaminase [ADA]),4 to identify the most likely etiology. However, a diagnostic challenge that is often confronted is lymphocytic pleural exudates. Tuberculosis (TB) and malignancy are the two most frequent causes of exudative PEs, with lymphocytes predominantly found in pleural fluid.5,6 During TB and malignancy, T lymphocytes with a helper/inducer phenotype form the major lymphocyte population in the pleural fluid,7 but different subpopulations, activation states, and subsequent immune responses are observed in both diseases.8 Unfortunately, the immunophenotypic profile of pleural fluid cannot be used to differentiate these two diseases.
To diagnose tuberculous pleural effusion (TPE) and malignant pleural effusion (MPE), further investigative tests are necessary. In the current clinical practice, isolation of Mycobacterium tuberculosis in the pleural fluid is difficult and can be negative in the acute setting.9,10 More invasive procedures (eg, a pleural biopsy) to identify caseating granuloma from the parietal pleura may be required. In contrast, a main obstacle in diagnosing malignant effusions is the presence of false-negative cytological results in ∼40% of cases.11 Surgical intervention by thoracoscopy is definitive for both TB and neoplasm but is invasive and not widely available.
Consequently, the development of noninvasive methods is important to differentially diagnose these two diseases, including clinical decision trees12 and nonroutine pleural fluid analysis (eg, ADA).13 Accordingly, various PE biomarkers released during the immune response triggered by the presence of mycobacterial antigens or tumors in the pleural space have been investigated, such as ADA and interferon-g (IFN-g), particularly as well-recognized biomarkers for TPE,14,15 but the diagnostic methods and performance seem to be variable. Thus, the objective of our study was to investigate PE biomarkers according to TB and cancer immunology to help distinguish these two common lymphocyte-predominant exudative PEs.
Patients and methods
Study population
A total of 92 patients (>20 years of age) with PEs received repeated thoracocentesis at the Department of Thoracic Medicine, Shuang Ho Hospital, Taipei Medical University, Taiwan, between June 2013 and May 2014, and were recruited in this study. Of the 92 patients, 32 (34.8%) were defined as having lymphocyte-predominant exudative PEs, with 27 (29.3%) finally enrolled.16 Lymphocyte-predominant exudative PE was defined based on the presence of >50% lymphocytes in the pleural fluid.17 Among the 32 patients with lymphocyte-predominant exudative PEs, five were excluded due to other causes, except for TPE or MPE (ie, four were related to cardiac failure and one was related to rheumatoid pleurisy).
Patients with any of the following criteria were excluded from the study: 1) treatment with antineoplasm or antituberculosis medication and previous treatment with glucocorticoids and nonsteroidal anti-inflammatory drugs or immunosuppressants; 2) an invasive pleural cavity procedure or chest trauma 3 months prior to thoracocentesis examination; and 3) unknown PE etiology.
The Ethics Committees of Taipei Medical University–Joint Institutional Review Board approved the study protocol. All subjects received written and oral information prior to inclusion and provided written informed consent.
Diagnostic criteria for PEs
Diagnosis of PEs defined as TPE met the following criteria: detection of Ziehl–Neelsen staining or Löwenstein–Jensen cultures upon PE examination and/or granuloma-like changes in pleural biopsy samples and exclusion of pleurisy from other causes.3 The diagnosis of MPE was done according to the following criteria: 1) pleural fluid cytology or pleural biopsy was positive for malignancy cells and 2) pathological diagnosis of a primary malignancy with radiological or clinical evidence of a PE and exclusion of pleurisy from other causes.
PE analysis
Pleural fluid samples obtained during thoracocentesis were collected into 5-mL sterile heparinized tubes for routine tests (chemistry, cytology [including total and differential cell count], and microbiology). Further assays for PE samples, including cytokines (interleukin [IL]-1β, IL-4, IL-6, IL-10, IL-12/23, IL-13, IL-17F, IL-21, and IFN-γ), chemokines (interferon-induced protein-10 [IP-10]), pattern recognition receptors (cluster of differentiation [CD]14), adhesion molecules (CD62L), CD154/CD40L, and basic fibroblast growth factor (bFGF), were performed using BD Cytometric Bead Array tests (BD Biosciences, San Jose, CA, USA) according to the manufacturer’s instructions. Bead and protein complexes labeled with phycoerythrin antibodies were acquired using a BD LSRFortessa™ cell analyzer (BD Biosciences).
Statistical analysis
Distribution of demographic characteristics and biomarker analysis was compared between the MPE and TPE patients. Categorical variables were compared using chi-square test, and continuous variables were compared using Student’s t-tests. Characteristics of pleural fluid and pleural cell counts were compared using the nonparametric Mann–Whitney U test. The accuracy of significant pleural biomarkers to distinguish TPE from MPE was calculated by receiver operating characteristic (ROC) analysis. Cut-off values were obtained from the maximum sum of sensitivity and specificity. All statistical analyses were performed using PRISM 5.0 software (GraphPad Software, Inc., La Jolla, CA, USA). The significance threshold was set at P<0.05.
Results
Demographic and clinical characteristics of the study population
A total of 92 patients received thoracocentesis for PEs, with routine and nonroutine biomarker analyses. Of these 92 patients, 27 (29.3%) with lymphocyte-predominant PEs were enrolled in the study and divided into two groups: 22 MPE patients (81.5%) and five TPE patients (18.5%). The demographic and clinical features of these two populations are listed in Table 1. There were no statistically significant differences in age, sex distribution, body mass index, personal behavior (smoking and drinking), and comorbidity. The diagnostic methods for confirmed MPE and TPE patients are listed in Table 2. The majority of MPE cases (14/22, 63.6%) were diagnosed by known malignant disease and exclusion of nonmalignant PE causes. In addition, six of 22 (27.3%) patients were diagnosed from the initial PE cytology study. Only two of 22 (9.1%) patients were diagnosed via a pleural biopsy, with lung cancer being the primary tumor in MPE patients. In TPE diagnosis, only one of five (20%) patients were recognized by first-time PE acid-fast stain and four of five (80%) were confirmed by a pleural biopsy, which is a more invasive method.
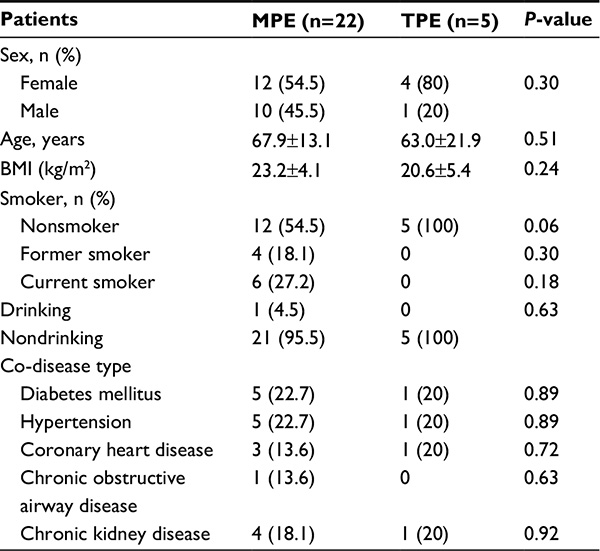 | Table 1 Demographic and clinical characteristics of MPE and TPE patients Note: Data are expressed as n (%) or mean ± SD. Abbreviations: MPE, malignant pleural effusion; TPE, tuberculous pleural effusion; BMI, body mass index; SD, standard deviation. |
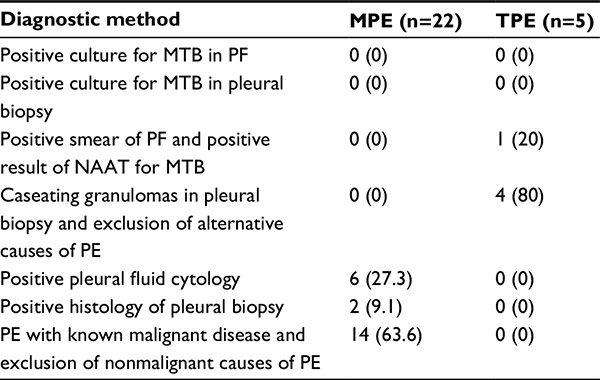 | Table 2 Diagnosis methods for proved MPE and TPE patients Note: Data are expressed as n (%). Abbreviations: MPE, malignant pleural effusion; TPE, tuberculous pleural effusion; MTB, Mycobacterium tuberculosis; PF, pleural fluid; NAAT, nucleic acid amplification test; PE, pleural effusion. |
PE analysis
Measurements for routine and biochemistry tests of PE are listed in Table 3. Effusion leukocyte counts were higher in the TPE group (1,919±1,165 cells/μL) than in the MPE group (858±700 cells/μL; P=0.02). There was no significant difference in differential cell counts (lymphocytes, neutrophils, eosinophils, mesothelial cells, and histocytes), pleural protein, lactate dehydrogenase (LDH), and glucose between the TPE and MPE groups.
 | Table 3 Laboratory characteristics of PE in MPE and TPE patients Notes: Data are expressed as median (range). *P<0.05. Abbreviations: PE, pleural effusion; MPE, malignant pleural effusion; TPE, tuberculous pleural effusion; M and H, mesothelial cells and histiocytes; LDH, lactate dehydrogenase. |
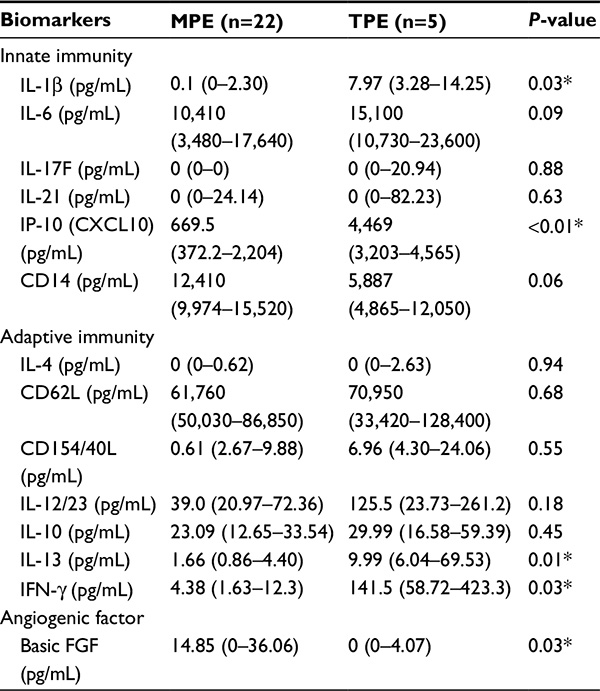
Biomarker measurements in PEs
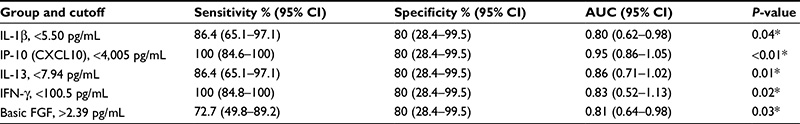
Biomarkers in the PE samples were examined, and the results are summarized in Table 4. Of the innate immunity biomarkers, the median levels of cytokine IL-1β and chemokine IP-10 were higher in the TPE group (7.97 pg/mL [3.28–14.25 pg/mL] and 4,469 pg/mL (3,203–4,565 pg/mL), respectively) than in the MPE group (0.1 pg/mL [0–2.30 pg/mL] and 669.5 pg/mL [372.2–2,204 pg/mL]; P<0.05 and P<0.01, respectively). Of the adaptive immunity biomarkers, the median levels of IL-13 and IFN-γ were higher in the TPE group (9.99 pg/mL [6.04–69.53 pg/mL] and 141.5 pg/mL [58.73–423.3 pg/mL], respectively) than in the MPE group (1.66 pg/mL [0.86–4.40 pg/mL] and 4.38 pg/mL [1.63–12.3 pg/mL], respectively; P<0.05). In addition, higher bFGF levels were found in MPE patients (14.85 pg/mL [0–36.06 pg/mL]) than in TPE patients (0 pg/mL [0–4.07 pg/mL]; P<0.05). There was no significant difference between TPE and MPE patients with respect to other biomarkers. ROC analysis of biomarkers identified as significant is presented in Table 5. The highest area under the curve (AUC) was observed for IP-10, which had a cutoff value of 4,005 pg/mL (AUC =0.95, 95% confidence interval [CI], P<0.01), followed by IL-13 with a cut-off value of 7.94 pg/mL (AUC =0.86, CI =95%, P<0.05). The other three biomarkers, IFN-γ, bFGF, and IL-1β, with cutoff values of 100.5 pg/mL, 2.39 pg/mL, and 5.50 pg/mL under CI =95% showed AUC of 0.83, 0.81, and 0.80 (P<0.05), respectively.
 | Table 4 Biomarkers (pg/mL) in PE Notes: Data are expressed as median (range). *P<0.05. Abbreviations: PE, pleural effusion; MPE, malignant pleural effusion; TPE, tuberculous pleural effusion; IL, interleukin; IP-10, interferon-induced protein-10; CXCL10, chemokine (C-X-C motif) ligand 10; CD, clusters of differentiation; L, ligand; IFN-γ, interferon-gamma; FGF, fibroblast growth factor. |
 | Table 5 Cutoff value, sensitivity, specificity, and AUC in classifying MPE and TPE cases Note: *P<0.05 Abbreviations: AUC, area under the curve; MPE, malignant pleural effusion; TPE, tuberculous pleural effusion; IL, interleukin; IP-10, interferon-induced protein-10; CXCL10, chemokine (C–X–C motif) ligand 10; IFN, interferon; FGF, fibroblast growth factor; CI, confidence interval. |
Discussion
In the present study, we showed higher levels of IL-1β and IP-10 (innate immunity biomarkers) and IFN-γ and IL-13 (adaptive immunity biomarkers) in TPE patients than in MPE patients. In contrast, higher levels of bFGF (an angiogenic factor) were detected in MPE patients. These significantly different five biomarkers (IL-1β, IP-10, IFN-γ, IL-13, and bFGF) are released into the pleural space during the immune response to TB and malignancy and subsequently may aid in distinguishing between TPE and MPE patients.
Our study population was similar in age and comorbidity between TPE and MPE groups. The method for definite diagnosis of lymphocyte-predominant effusions in our patients was dependent on an invasive procedure (20/27 patients, 74.1%), either a pleural biopsy or a primary tumor tissue identification (all identified to be primary lung cancers), and highlights the need to explore noninvasive biomarkers to diagnose these two common clinical diseases.
During routine PE analysis, we found that higher leukocyte count levels in pleural fluid represent the underlying mechanism of PE formation attributable to injury of the pleural membrane or vasculature, with a resultant increase in capillary permeability. TPE is usually an acute illness that is related to the rupture of subpleural TB foci into the pleural space, causing direct pleural membrane destruction, inducing a predominant leukocyte reaction.18 However, the cause of MPE is both increased capillary permeability (due to local inflammatory changes in response to tumor invasion)19 and transudative effusions (secondary to postobstructive atelectasis and/or low plasma oncotic pressure secondary to cachexia).20 The different mechanisms in the formation of these two classes of PEs may partially explain our result of higher leukocyte counts in TPE patients. Moreover, our result is similar to a previous study.12 With routine biochemical PE analysis (of pleural proteins and LDH), there was no significant difference between TPE and MPE patients in our study and in the study by Duysinx et al, but higher protein Light’s ratio and LDH Light’s ratio were reported in the study by Duysinx et al.21
Both microbes and tumors activate innate defenses, tissue repair, and adaptive immunity. TB and malignancy are among the main etiologies of pleural exudates, particularly in lymphocyte-predominant PEs. Pleural exudates are associated with immune cell migration to the pleural cavity.22 Our study further investigated relevant cytokines, chemokines, and angiogenic factors during the immune response to TB and tumors. In innate immunity to TB and tumors, previous studies found significantly higher levels of proinflammatory cytokines, such as tumor necrosis factor-a and IL-1β, in TB patients than in MPE patients,23,24 which were associated with an imbalance between plasminogen activator inhibitor-1 and tissue type plasminogen activator and subsequently led to fibrin deposition and residual pleural thickening.25,26 Our study is consistent with higher median IL-1β levels in TPE patients.
IFN-γ is the most studied cytokine and a useful marker for diagnosing TPE.27–30 Our result is comparable with a diagnostic role of IFN-γ in TPE patients. In addition, IP-10 is secreted by several cell types in response to IFN-γ. These cell types include monocytes, endothelial cells, and fibroblasts.31 Thus, it is not surprising that we found significantly elevated IP-10 levels in TB effusions compared with those in malignant effusions. A previous study by Dheda et al32 also found a similar result, suggesting that IP-10 may have a diagnostic role in TPE. Mycobacterial antigen entry into the pleural space induces an intense immune response, initially due to neutrophils and macrophages33,34 and subsequently followed by T-helper cell type 1 (Th1) lymphocytes.35,36 Our study shows a concordant polarized Th1 immune response in TPE, with higher levels of IFN-γ and IFN-γ-related protein, IP-10, to promote macrophage activation.
Interestingly, we found higher IL-13 levels in TPE patients than in MPE patients. IL-13 is a type 2 cytokine, and its involvement in TB is less clear. It is thought that local immune reactions to MPE favor T-helper type 2 (Th2) cells over the Th1 pathway.37,38 However, we found that Th2-associated IL-13 was significantly elevated in TPE. In recent years, IL-13 involvement in the caseous center of necrotized granuloma formation has been demonstrated and related to the extent of TB disease.39,40 In contrast to protective Th1 cell-mediated immunity,3 the role of an IL-4/IL-13-driven Th2 immune response for TB susceptibility needs further study.
Finally, in view of MPE, angiogenic cytokines, such as vascular endothelial growth factor and bFGF, are important for induction of PEs attributable to neovascularization, vascular permeability, and hemorrhage, both in the inflammatory process and tumor progression.41,42 bFGF is mitogenic for various cells, including fibroblasts, smooth muscles, and endothelial cells, and is also a known angiogenic factor.43 Previous investigations have demonstrated a critical role for bFGF in pleural fibrosis development in symptomatic MPE patients.44 In diagnostic applications, the results for MPE diagnosis42,45,46 and primary tumors encompassing thoracic and extrathoracic tumors are controversial. In our study, all MPE patients had primary lung cancer and contained significantly higher bFGF levels than effusions due to TB. Correlation between bFGF and lung cancer-related MPE may be performed in a larger study.
Limitations
Our study has some limitations. First, we performed multivariate analysis of five biomarkers significant in univariate ROC analysis by PASW 18.0 (SPSS Inc., Chicago, IL, USA), and three of these five biomarkers, IFN-γ, IL-13, and IP-10, showed significance (P<0.1). We then combined the three biomarkers with multivariate regression using PASW 18.0 and reported a sensitivity of 100% and specificity of 100% for differentiating TPE from MPE (data not shown). However, the number of cases is uneven and too small, particularly in the TPE group. Thus, firm conclusions cannot be made. Second, the immune response to TB and cancer is dynamic, according to disease progression, and the resulting cytokine release fluctuates. We could not measure cytokines under a similar disease status, thereby further limiting extrapolation. Finally, our study only aimed to distinguish between TPE and MPE (strictly lung cancer-related MPE). However, other causes of PEs, such as those secondary to pneumonia or congestive heart failure, are easily diagnosed in clinical practice.
Conclusion
Altogether, our data show that five biomarkers (IL-1β, IP-10, IL-13, IFN-γ, and bFGF) are released based on innate resistance, adaptive immunity, and angiogenesis during TB infection and cancer progression, which can differentiate TPE from MPE (particularly lung cancer-related MPE). Their application to clinical diagnosis may be performed in large-scale studies, with consideration to cost-effectiveness in the future.
Author contributions
All authors made substantial contributions to conception and design, acquisition of data, or analysis and interpretation of data; took part in either drafting the article or revising it critically for important intellectual content; gave final approval of the version to be published; and agree to be accountable for all aspects of the work.
Disclosure
The authors report no conflicts of interest in this work.
References
Yalcin NG, Choong CK, Eizenberg N. Anatomy and pathophysiology of the pleura and pleural space. Thorac Surg Clin. 2013;23(1):1–10,v. | ||
Light RW. Useful tests on the pleural fluid in the management of patients with pleural effusions. Curr Opin Pulm Med. 1999;5(4):245–249. | ||
Light RW, Macgregor MI, Luchsinger PC, Ball WC Jr. Pleural effusions: the diagnostic separation of transudates and exudates. Ann Intern Med. 1972;77(4):507–513. | ||
Ma YQ, Zhang YJ, Chao KT. QCD corrections to e+e- -->J/psi+gg at B factories. Phys Rev Lett. 2009;102(16):162002. | ||
Porcel-Pérez JM, Vives Soto M, Esquerda Serrano A, Jover Sáenz A. Puntos de corte de los parámetros bioquímicos del líquido pleural: su utilidad en el diagnosticdiferencial de 1.040 pacientes con derrame pleural [Cuttoff values of biochemical tests on pleural fluid: their usefulness in differential diagnosis of 1,040 patients with pleural effusion]. An Med Interna. 2004;21(3):113–117. Spanish. | ||
Villena V, López Encuentra A, Echave-Sustaeta J, Alvarez Martínez C, Martín Escribano P. Estudio prospectivo de 1.000 pacientes consecutivos con derrame pleural. Etiología del derrame y características de los pacientes [Prospective study of 1,000 consecutive patients with pleural effusion. Etiology of the effusion and characteristics of the patients]. Arch Bronconeumol. 2002;38(1):21–26. Spanish. | ||
Lucivero G, Pierucci G, Bonomo L. Lymphocyte subsets in peripheral blood and pleural fluid. Eur Respir J. 1988;1(4):337–340. | ||
Aguiar LM, Antonangelo L, Vargas FS, et al. Malignant and tuberculous pleural effusions: immunophenotypic cellular characterization. Clinics (Sao Paulo). 2008;63(5):637–644. | ||
McGrath EE, Warriner D, Anderson PB. Pleural fluid characteristics of tuberculous pleural effusions. Heart Lung. 2010;39(6):540–543. | ||
Valdés L, Alvarez D, San José E, et al. Tuberculous pleurisy: a study of 254 patients. Arch Intern Med. 1998;158(18):2017–2021. | ||
Maskell NA, Butland RJ, Pleural Diseases Group, Standards of Care Committee, British Thoracic Society. BTS guidelines for the investigation of a unilateral pleural effusion in adults. Thorax. 2003;58(suppl 2):ii8–ii17. | ||
Porcel JM, Alemán C, Bielsa S, Sarrapio J, Fernández de Sevilla T, Esquerda A. A decision tree for differentiating tuberculous from malignant pleural effusions. Respir Med. 2008;102(8):1159–1164. | ||
McGrath EE, Warriner D, Anderson PB. The use of non-routine pleural fluid analysis in the diagnosis of pleural effusion. Respir Med. 2010;104(8):1092–1100. | ||
Shu CC, Wang JY, Hsu CL, et al. Diagnostic role of inflammatory and anti-inflammatory cytokines and effector molecules of cytotoxic T lymphocytes in tuberculous pleural effusion. Respirology. 2015;20(1):147–154. | ||
Xuan WX, Zhang JC, Zhou Q, Yang WB, Ma LJ. IL-33 levels differentiate tuberculous pleurisy from malignant pleural effusions. Oncol Lett. 2014;8(1):449–453. | ||
Light RW. Clinical practice. Pleural effusion. N Engl J Med. 2002;346(25):1971–1977. | ||
Liang QL, Shi HZ, Wang K, Qin SM, Qin XJ. Diagnostic accuracy of adenosine deaminase in tuberculous pleurisy: a meta-analysis. Respir Med. 2008;102(5):744–754. | ||
Barnes PF, Mistry SD, Cooper CL, Pirmez C, Rea TH, Modlin RL. Compartmentalization of a CD4+ T lymphocyte subpopulation in tuberculous pleuritis. J Immunol. 1989;142(4):1114–1119. | ||
Andrews BS, Arora NS, Shadforth MF, Goldberg SK, Davis JS 4th. The role of immune complexes in the pathogenesis of pleural effusions. Am Rev Respir Dis. 1981;124(2):115–120. | ||
American Thoracic Society. Management of malignant pleural effusions. Am J Respir Crit Care Med. 2000;162(5):1987–2001. | ||
Duysinx BC, Corhay JL, Hubin L, Nguyen D, Henket M, Louis R. Diagnostic value of interleukine-6, transforming growth factor-beta 1 and vascular endothelial growth factor in malignant pleural effusions. Respir Med. 2008;102(12):1708–1714. | ||
Kroegel C, Antony VB. Immunobiology of pleural inflammation: potential implications for pathogenesis, diagnosis and therapy. Eur Respir J. 1997;10(10):2411–2418. | ||
Momi H, Matsuyama W, Inoue K, et al. Vascular endothelial growth factor and proinflammatory cytokines in pleural effusions. Respir Med. 2002;96(10):817–822. | ||
Orphanidou D, Gaga M, Rasidakis A, et al. Tumour necrosis factor, interleukin-1 and adenosine deaminase in tuberculous pleural effusion. Respir Med. 1996;90(2):95–98. | ||
de Pablo A, Villena V, Echave-Sustaeta J, Encuentra AL. Are pleural fluid parameters related to the development of residual pleural thickening in tuberculosis? Chest. 1997;112(5):1293–1297. | ||
Hua CC, Chang LC, Chen YC, Chang SC. Proinflammatory cytokines and fibrinolytic enzymes in tuberculous and malignant pleural effusions. Chest. 1999;116(5):1292–1296. | ||
Greco S, Girardi E, Masciangelo R, Capoccetta GB, Saltini C. Adenosine deaminase and interferon gamma measurements for the diagnosis of tuberculous pleurisy: a meta-analysis. Int J Tuberc Lung Dis. 2003;7(8):777–786. | ||
Jiang J, Shi HZ, Liang QL, Qin SM, Qin XJ. Diagnostic value of interferon-gamma in tuberculous pleurisy: a metaanalysis. Chest. 2007;131(4):1133–1141. | ||
Keng LT, Shu CC, Chen JY, et al. Evaluating pleural ADA, ADA2, IFN-gamma and IGRA for diagnosing tuberculous pleurisy. J Infect. 2013;67(4):294–302. | ||
Liu YC, Shin-Jung Lee S, Chen YS, Tu HZ, Chen BC, Huang TS. Differential diagnosis of tuberculous and malignant pleurisy using pleural fluid adenosine deaminase and interferon gamma in Taiwan. J Microbiol Immunol Infect. 2011;44(2):88–94. | ||
Luster AD, Unkeless JC, Ravetch JV. Gamma-interferon transcriptionally regulates an early-response gene containing homology to platelet proteins. Nature. 1985;315(6021):672–676. | ||
Dheda K, Van-Zyl Smit RN, Sechi LA, et al. Clinical diagnostic utility of IP-10 and LAM antigen levels for the diagnosis of tuberculous pleural effusions in a high burden setting. PLoS One. 2009;4(3):e4689. | ||
Antony VB, Repine JE, Harada RN, Good JT Jr, Sahn SA. Inflammatory responses in experimental tuberculosis pleurisy. Acta Cytol. 1983;27(3):355–361. | ||
Antony VB, Sahn SA, Antony AC, Repine JE. Bacillus Calmette-Guerin-stimulated neutrophils release chemotaxins for monocytes in rabbit pleural spaces and in vitro. J Clin Invest. 1985;76(4):1514–1521. | ||
Gopi A, Madhavan SM, Sharma SK, Sahn SA. Diagnosis and treatment of tuberculous pleural effusion in 2006. Chest. 2007;131(3):880–889. | ||
Mitra DK, Sharma SK, Dinda AK, Bindra MS, Madan B, Ghosh B. Polarized helper T cells in tubercular pleural effusion: phenotypic identity and selective recruitment. Eur J Immunol. 2005;35(8):2367–2375. | ||
Chen YM, Yang WK, Whang-Peng J, Kuo BI, Perng RP. Elevation of interleukin-10 levels in malignant pleural effusion. Chest. 1996;110(2):433–436. | ||
Nakamura Y, Ozaki T, Yanagawa H, Yasuoka S, Ogura T. Eosinophil colony-stimulating factor induced by administration of interleukin-2 into the pleural cavity of patients with malignant pleurisy. Am J Respir Cell Mol Biol. 1990;3(4):291–300. | ||
Heitmann L, Abad Dar M, Schreiber T, et al. The IL-13/IL-4Ralpha axis is involved in tuberculosis-associated pathology. J Pathol. 2014;234(3):338–350. | ||
Seah GT, Scott GM, Rook GA. Type 2 cytokine gene activation and its relationship to extent of disease in patients with tuberculosis. J Infect Dis. 2000;181(1):385–389. | ||
Hoshino M, Takahashi M, Aoike N. Expression of vascular endothelial growth factor, basic fibroblast growth factor, and angiogenin immunoreactivity in asthmatic airways and its relationship to angiogenesis. J Allergy Clin Immunol. 2001;107(2):295–301. | ||
Ruiz E, Alemán C, Alegre J, et al. Angiogenic factors and angiogenesis inhibitors in exudative pleural effusions. Lung. 2005;183(3):185–195. | ||
Bikfalvi A, Klein S, Pintucci G, Rifkin DB. Biological roles of fibroblast growth factor-2. Endocr Rev. 1997;18(1):26–45. | ||
Antony VB, Nasreen N, Mohammed KA, et al. Talc pleurodesis: basic fibroblast growth factor mediates pleural fibrosis. Chest. 2004;126(5):1522–1528. | ||
Economidou F, Antoniou KM, Tzanakis N, Sfiridaki K, Siafakas NM, Schiza SE. Angiogenic molecule Tie-2 and VEGF in the pathogenesis of pleural effusions. Respir Med. 2008;102(5):774–779. | ||
Konstantinovsky S, Nielsen S, Vyberg M, et al. Angiogenic molecule expression is downregulated in effusions from breast cancer patients. Breast Cancer Res Treat. 2005;94(1):71–80. |
 © 2016 The Author(s). This work is published and licensed by Dove Medical Press Limited. The
full terms of this license are available at https://www.dovepress.com/terms
and incorporate the Creative Commons Attribution
- Non Commercial (unported, 3.0) License.
By accessing the work you hereby accept the Terms. Non-commercial uses of the work are permitted
without any further permission from Dove Medical Press Limited, provided the work is properly
attributed. For permission for commercial use of this work, please see paragraphs 4.2 and 5 of our Terms.
© 2016 The Author(s). This work is published and licensed by Dove Medical Press Limited. The
full terms of this license are available at https://www.dovepress.com/terms
and incorporate the Creative Commons Attribution
- Non Commercial (unported, 3.0) License.
By accessing the work you hereby accept the Terms. Non-commercial uses of the work are permitted
without any further permission from Dove Medical Press Limited, provided the work is properly
attributed. For permission for commercial use of this work, please see paragraphs 4.2 and 5 of our Terms.