Back to Journals » International Journal of Chronic Obstructive Pulmonary Disease » Volume 14
Normal lung attenuation distribution and lung volume on computed tomography in a Chinese population
Authors Cheng T, Li Y ![]() , Pang S, Wan H
, Pang S, Wan H ![]() , Shi G, Cheng Q, Li Q
, Shi G, Cheng Q, Li Q ![]() , Pan Z, Huang S
, Pan Z, Huang S
Received 14 September 2018
Accepted for publication 10 May 2019
Published 24 July 2019 Volume 2019:14 Pages 1657—1668
DOI https://doi.org/10.2147/COPD.S187596
Checked for plagiarism Yes
Review by Single anonymous peer review
Peer reviewer comments 6
Editor who approved publication: Dr Chunxue Bai
Ting Cheng,1,2,* Yong Li,1,2,* Shuai Pang,1,2 HuanYing Wan,1,2 GuoChao Shi,2,3 QiJian Cheng,1,2 QingYun Li,2,3 ZiLai Pan,4 ShaoGuang Huang2,3
1Department of Respiratory Medicine, Ruijin Hospital North, Shanghai Jiaotong University School of Medicine, Shanghai, People’s Republic of China; 2Institute of Respiratory Diseases, Shanghai Jiaotong University School of Medicine, Shanghai, People’s Republic of China; 3Department of Respiratory Medicine, Ruijin Hospital, Shanghai Jiaotong University School of Medicine, Shanghai, People’s Republic of China; 4Department of Radiology, Ruijin Hospital North, Shanghai Jiaotong University School of Medicine, Shanghai, People’s Republic of China
*These authors contributed equally to this work
Backgroud and objectives: Although lung attenuation distribution and lung volume on computed tomography (CT) have been widely used in evaluating COPD and interstitial lung disease, there are only a few studies regarding the normal range of these indices, especially in Chinese subjects. We aimed to describe the normal range of lung attenuation distribution and lung volume based on CT.
Methods: Subjects with normal lung function and basically normal chest CT findings (derivation group) at Ruijin Hospital, Shanghai (from January 2010 to June 2014) were included according to inclusion and exclusion criteria. The range of the percentage of lung volume occupied by low attenuation areas (LAA%), percentile of the histogram of attenuation values (Perc n), and total lung volume were analyzed. Relationships of these measures with demographic variables were evaluated. Participants who underwent chest CT examination for disease screening and had basically normal CT findings served as an external validation group.
Results: The number of subjects in the derivation group and external validation groups were 564 and 1,787, respectively. Mean total lung volumes were 4,468±1,271 mL and 4,668±1,192 mL, and median LAA%(-950 HU) was 0.19 (0.03–0.43) and 0.17 (0.01–0.41), in the derivation and external validation groups, respectively. Reference equations for lung volume and attenuation distribution (LAA% using -1,000–210 HU, Perc 1 to Perc 98) were generated: Lung volume (mL) = -1.015 *10^4+605.3*Sex (1= male, 0= female)+92.61*Height (cm) –12.99*Weight (kg) ±1766; LAA% (-950 HU)=[0.2027+0.05926*Sex (1= male, 0= female) –4.111*10^-3*Weight (kg) +4.924*10^-3*Height (cm) +8.504*10^-4*Age]^7.341–0.05; Upper limit of normal range: [0.2027+0.05926*Sex-4.111*10^-3*Weight+4.924*10^-3*Height+8.504*10^-4*Age+0.1993]^7.341–0.05.
Conclusion: This large population-based retrospective study demonstrated the normal range of LAA%, Perc n, and total lung volume measured on CT scans among subjects with normal lung function and CT findings. Reference equations are provided.
Keywords: lung attenuation, emphysema, lung volumes, quantitative computed tomography, reference equations, normal range, densitometry
Introduction
Lung computed tomography (CT) examination has been widely used to provide indices reflecting regional density.1–3 Two main indices of emphysema visualized on CT – the percentage of lung volume occupied by low attenuation areas (LAA%) and percentile of the histogram of attenuation values (Perc n),4 have been correlated with the presence and extent of emphysema on macroscopic or microscopic morphometry,1,3,5,6 and are helpful for evaluating prognosis and lung function in patients with COPD,7–10 among smokers,11 and even in the general population.12
Lung attenuation distribution based on CT, such as measurement of the percentage of high attenuation areas (HAA%), which is generally calculated by 100%-LAA%, can be used to quantitatively evaluate interstitial lung disease (ILD),13–16 pulmonary infection,17 and acute respiratory distress syndrome (ARDS).18 For ILD, these quantitative indices show good correlation with visual scores, severity of dyspnea, lung function, and prognosis.13,14 Indices of extent of fibrosis include mean and median lung attenuation,19 and the proportion of the lung volume with attenuation of -700–200 HU, ie, HAA% (HAA%=100%-LAA%) using a threshold of -700 HU.14 Functional lung volume (FLV) can be measured as lung volume with attenuation from -950–700 HU. The ILD volume (ILDV) can be measured as lung volume with attenuation from -700–500 HU.15 The extent of ground-glass opacity can be measured as lung volume with attenuation from -800–500 HU.16 For ARDS, lung proportion with attenuation from -1,000–900 HU is defined as overdistended, lung proportion with attenuation from -900–500 HU is defined as normally aerated, and lung proportion with attenuation above -500 HU is defined as poorly aerated or non-aerated.18
CT examination can also provide indices regarding lung volume20 which makes it useful in differentiating among types of ventilatory defects. When FEV1 and FVC are concomitantly decreased, total lung capacity (TLC) in pulmonary function tests (PFT) is very important in differentiation of obstructive, restrictive, and mixed abnormalities.21,22 However, a single-breath (SB) test may systematically underestimate TLC, especially in the presence of severe airflow obstruction, which may increase the risk of misclassification of PFT abnormalities.22,23 Plethysmographic lung volume testing is expensive, and is ordinarily only available at specialized referral centers.24 A strong correlation has been reported between TLC measured by plethysmography and CT measurement of total lung volume.25,26 Therefore, lung volume from CT scans can be used in differential diagnosis of ventilatory defects.
To distinguish disease manifestations, the normal range of lung attenuation distribution and lung volume on CT is helpful. In a normal population, LAA% may vary due to altered stretch or compression of the lung related to gravity, height of the lung and support of the heart,2,27 variation in residual peripheral airway structures, and scatter effects.28 Several studies29–38 have reported the normal range of LAA%, Perc n, and lung volume for both smokers and non-smokers. However, only two studies with comparatively small sample sizes (22,436 and 8,033) included Asian participants, and neither of these studies is from People’s Republic of China. Only the normal range of LAA%(-960 HU),29 LAA%(-950 HU),29–31,34–39 LAA%(-912 HU),33 LAA%(-910 HU),36 Perc 15,29,35 and mean lung attenuation30,32,33,35,37 have been reported, and these indices are inadequate for differentiating ILD from poorly aerated normal lungs.
In this article, we described the normal range of lung attenuation distribution, and lung volume on CT based on a large sample of subjects with normal lung function and CT findings, and provided normal reference equations for the Chinese population.
Methods and materials
Study design
This retrospective study was performed in Ruijin Hospital, Shanghai, People’s Republic of China. Subjects who underwent chest CT examination with or without lung function tests in this hospital from January 2010 to June 2014 were retrospectively analyzed. The study was approved by the Institution Ethics Committee of Ruijin Hospital, and patient consent requirement was waived due to the retrospective nature of the study and the waiver of informed consent would not affect the health and rights of the subjects. Patient data confidentially was protected and complied with the declaration of Helsinki.
Study population
The derivation group consisted of subjects who had normal lung function and basically normal chest CT findings. The normal reference value of lung function was calculated by the default equation for Chinese in Jaeger® MasterScreen Body/Diff system (CareFusion Corporation, San Diego, CA, USA). Subjects in the derivation group needed to meet all inclusion criteria and none of the exclusion criteria. Participants in the external validation group were those who underwent chest CT examination for disease screening and had basically normal CT findings, and met second inclusion criterion and neither of the first two exclusion criteria.
Inclusion criteria were: i) subjects with normal spirometric values; ii) subjects underwent a chest CT examination that was reconstructed using a standard (or B26, I31, I41) algorithm and section thickness and intervals of 5 mm as described in the previous report.40 Exclusion criteria were: i) subjects who had undergone thoracic surgery; ii) subjects who had a CT finding of pneumothorax, pleural effusion, pneumonia, emphysema, ILD, chronic bronchitis, bronchiectasis, lung bullae, lung abscess, or lung mass, lung neoplasm; and iii) patients who had an abnormal rate of carbon monoxide (CO) uptake in the lungs.
CT scanning and analysis
Chest CT examination was performed following the standardized breathing instructions using one of five CT scanners: Discovery CT750 HD (GE Medical Systems, Milwaukee, WI, USA), LightSpeed VCT (GE Medical Systems), LightSpeed16 (GE Medical Systems), Perspective (Siemens Medical Solutions, Forchheim, Germany), and SOMATOM Definition Flash (Siemens Medical Solutions). In the derivation group, the following technical parameters were used: tube voltage, 100–140 kVp; tube current, 100–250 mA; and tube rotation time, 0.8 s. The algorithm and section thickness of reconstruction were described in the previous paragraph. In the external validation group, parameters were the same as those in the derivation group except for the tube current which was 28–120 mA. Scans were acquired at suspended full inspiration following coaching to inhale to TLC.
Lung volume and LAA% were calculated automatically using commercial software, Myrian® (Intrasense, Montpellier, France), under every threshold from -1,000–210 HU with an interval of 10 HU. Every Perc n was subsequently calculated (Perc 1 to Perc 98 with an interval of 1%). The volume with attenuation of -950–700 HU, expressed as V (-950–700 HU), and its ratio to lung volume, expressed as V% (-950–700 HU) were calculated as FLV and proportion. V (-700–500 HU) and V% (-700–500 HU) were calculated as ILDV and proportion.15 V (-800–500 HU) and V% (-800–500 HU) were calculated as ground-glass opacity volume and proportion.16 V (-1,000–900 HU) and V% (-1,000–900 HU) were calculated as overdistended lung. V (-900–500 HU) and V% (-900–500 HU) were calculated as normally aerated lung. V (above -500 HU) and V% (above -500 HU) were calculated as poorly aerated or non-aerated lung.18.
Lung function test
Lung function tests, including spirometry and SB determination of CO uptake, were performed using Jaeger® MasterScreen Body/Diff system according to the American Thoracic Society/European Respiratory guidelines.41,42
Statistical analysis
LAA%, Perc n, and lung volume were expressed as median, interquartile range, and 2.5th and 97.5th percentiles. BOXCOX transformation is proposed as a parametric power transformation technique, which deals with data that do not confirm normality and/or homogeneity of variance.43 Since LAA% and Perc n did not show a normal distribution, uniform distribution, or exponential distribution, the BOXCOX transformation and the optimal λ value (with three digits after the decimal point) were used (Figures S1 and S2).
Relationships between CT-based measures and demographic variables such as sex, age, height, and weight were examined using linear regression models. Variables were selected stepwise, with an entry criterion of p<0.05, and a removal criterion of p>0.10. Reference equations for CT-based measures were developed from the results of linear regressions. The normal range was calculated as follows: predicted value ±1.96* RSD, where RSD is the residual standard deviation. For indices for which 0 was in the normal range (shown as 2.5th percentile =0), the normal range was calculated as predicted value +1.645*RSD.
BOXCOX transformations were completed with STATA 11.0 (StataCorp LP, College Station, TX, USA). Descriptive statistics and linear regressions were performed using SPSS 17.0 (SPSS Inc., Chicago, IL, USA).
Results
A total of 5,139 chest CT scans with corresponding lung function tests were initially screened for the derivation group, and 564 subjects were included for analyses (Figure 1A). Similarly, 4,816 chest CT scans for the external validation group were screened and reviewed, and 1,787 subjects were regarded as eligible (Figure 1B).
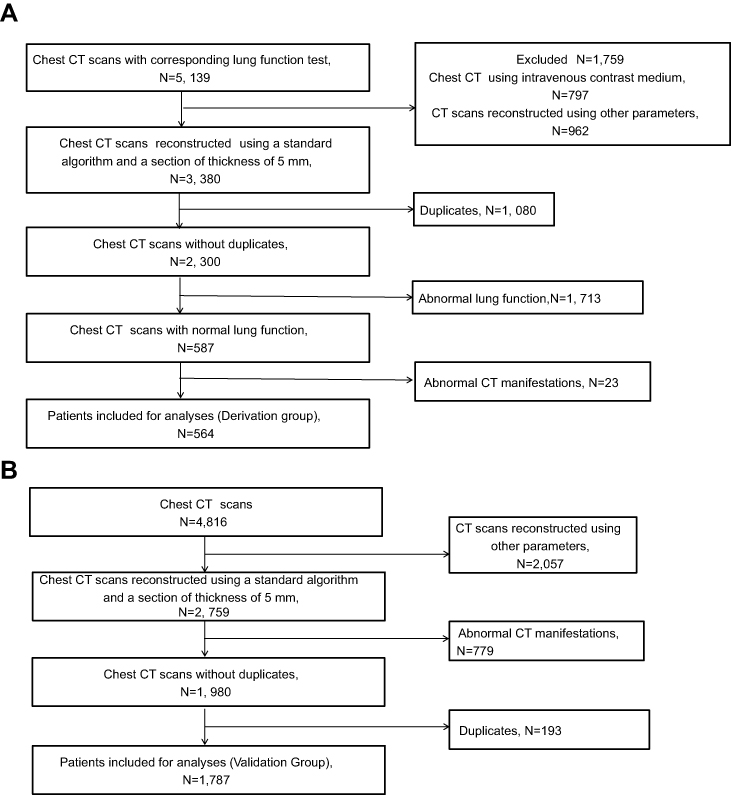 |
Figure 1 Flow chart for subject screening in the derivation group (A) and external validation group (B). |
The demographic characteristics of participants are provided in Table 1. Subjects in the derivation group had a median age of 58 years with an interquartile range of 48–64. Participants in the external validation group had a median age of 60 years with a range of 53–67.
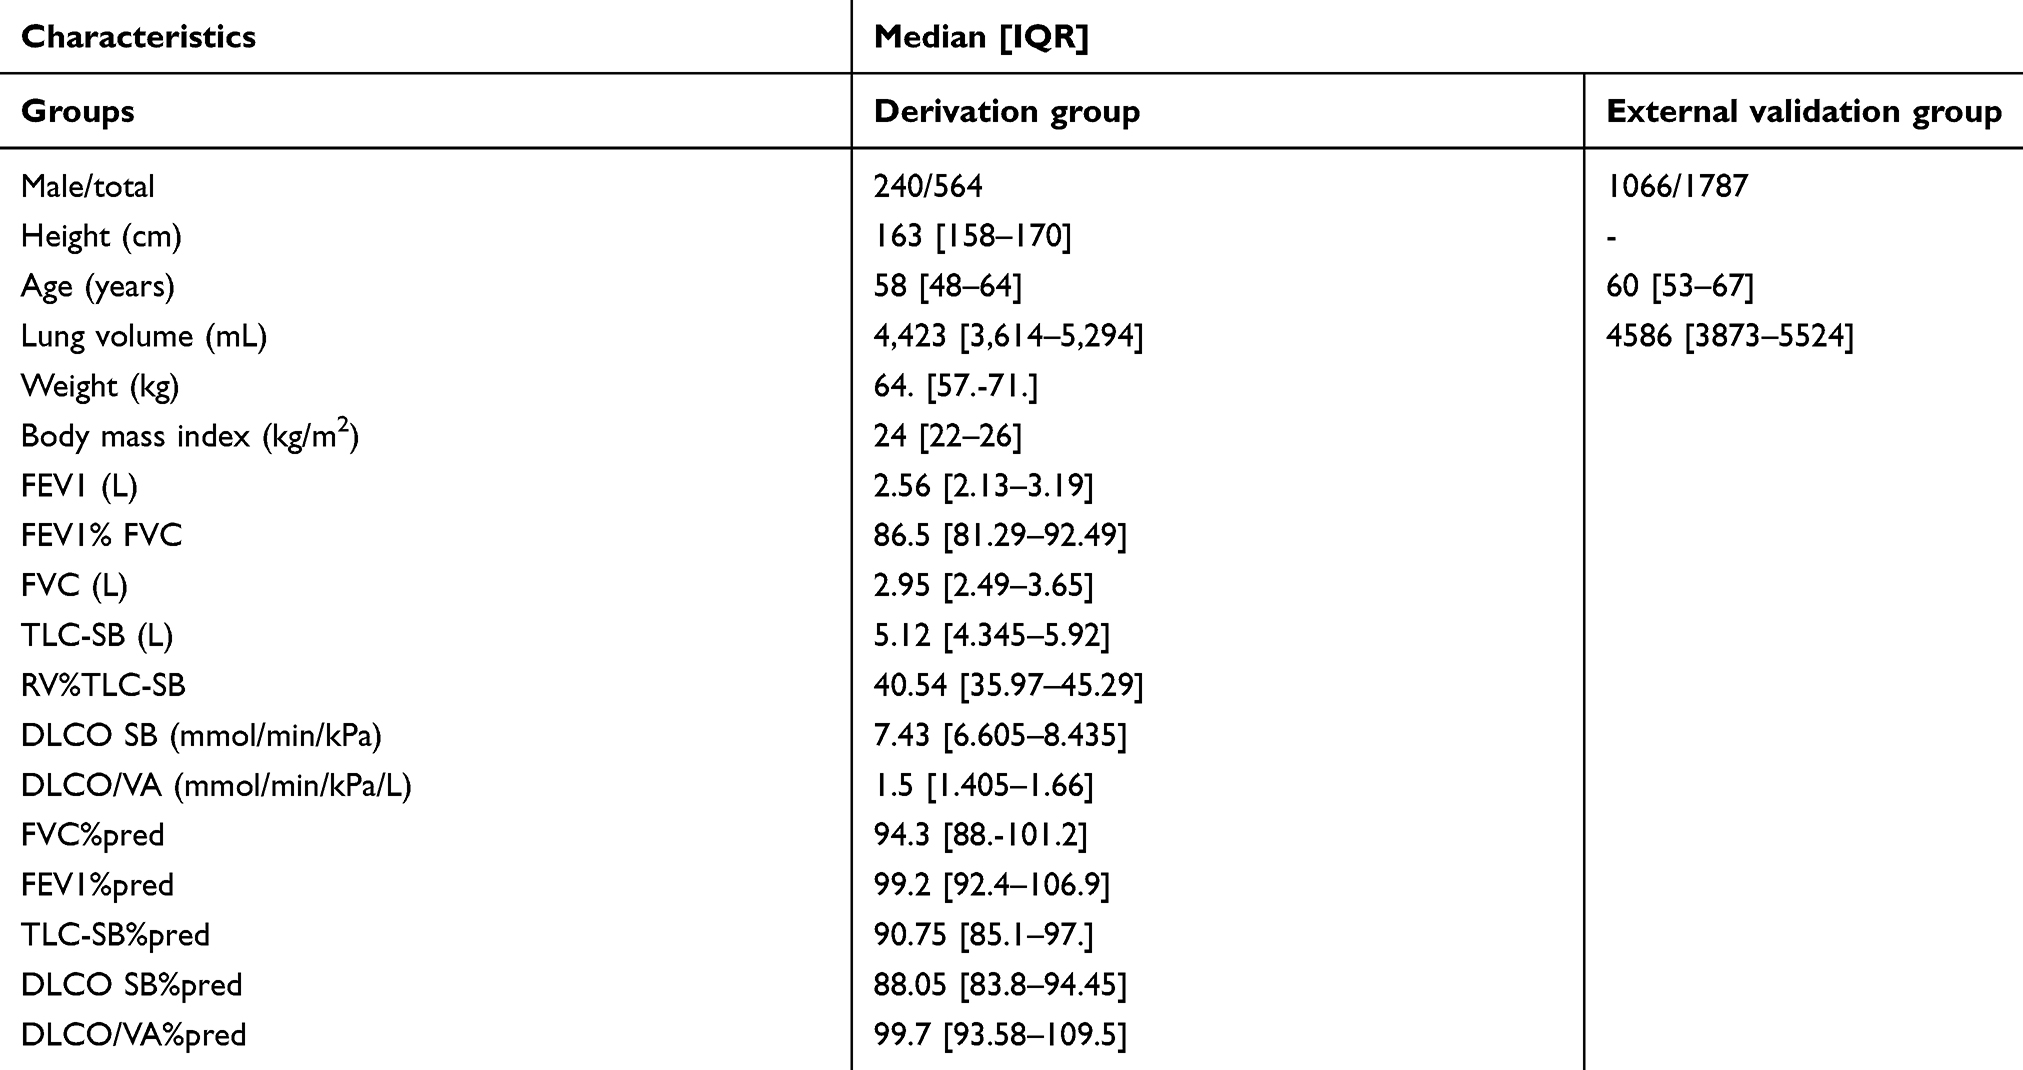 |
Table 1 Demographic characteristics of participants in the derivation and external validation groups |
Mean and median volume were 4,468±1,271 mL and 4,423 mL (3,614–5,294), respectively in the derivation group, and 4,668±1,192 mL and 4,586 mL (3,873–5,524) in the external validation group. Median LAA%(-950 HU) was 0.19 (0.03–0.43) in the derivation group and 0.17 (0.01–0.41) in the external validation group. Distributions of lung volume and main indices of LAA% and Perc n are shown in Table 2. The distributions of other indices are shown in Figure 2 and Table S1.
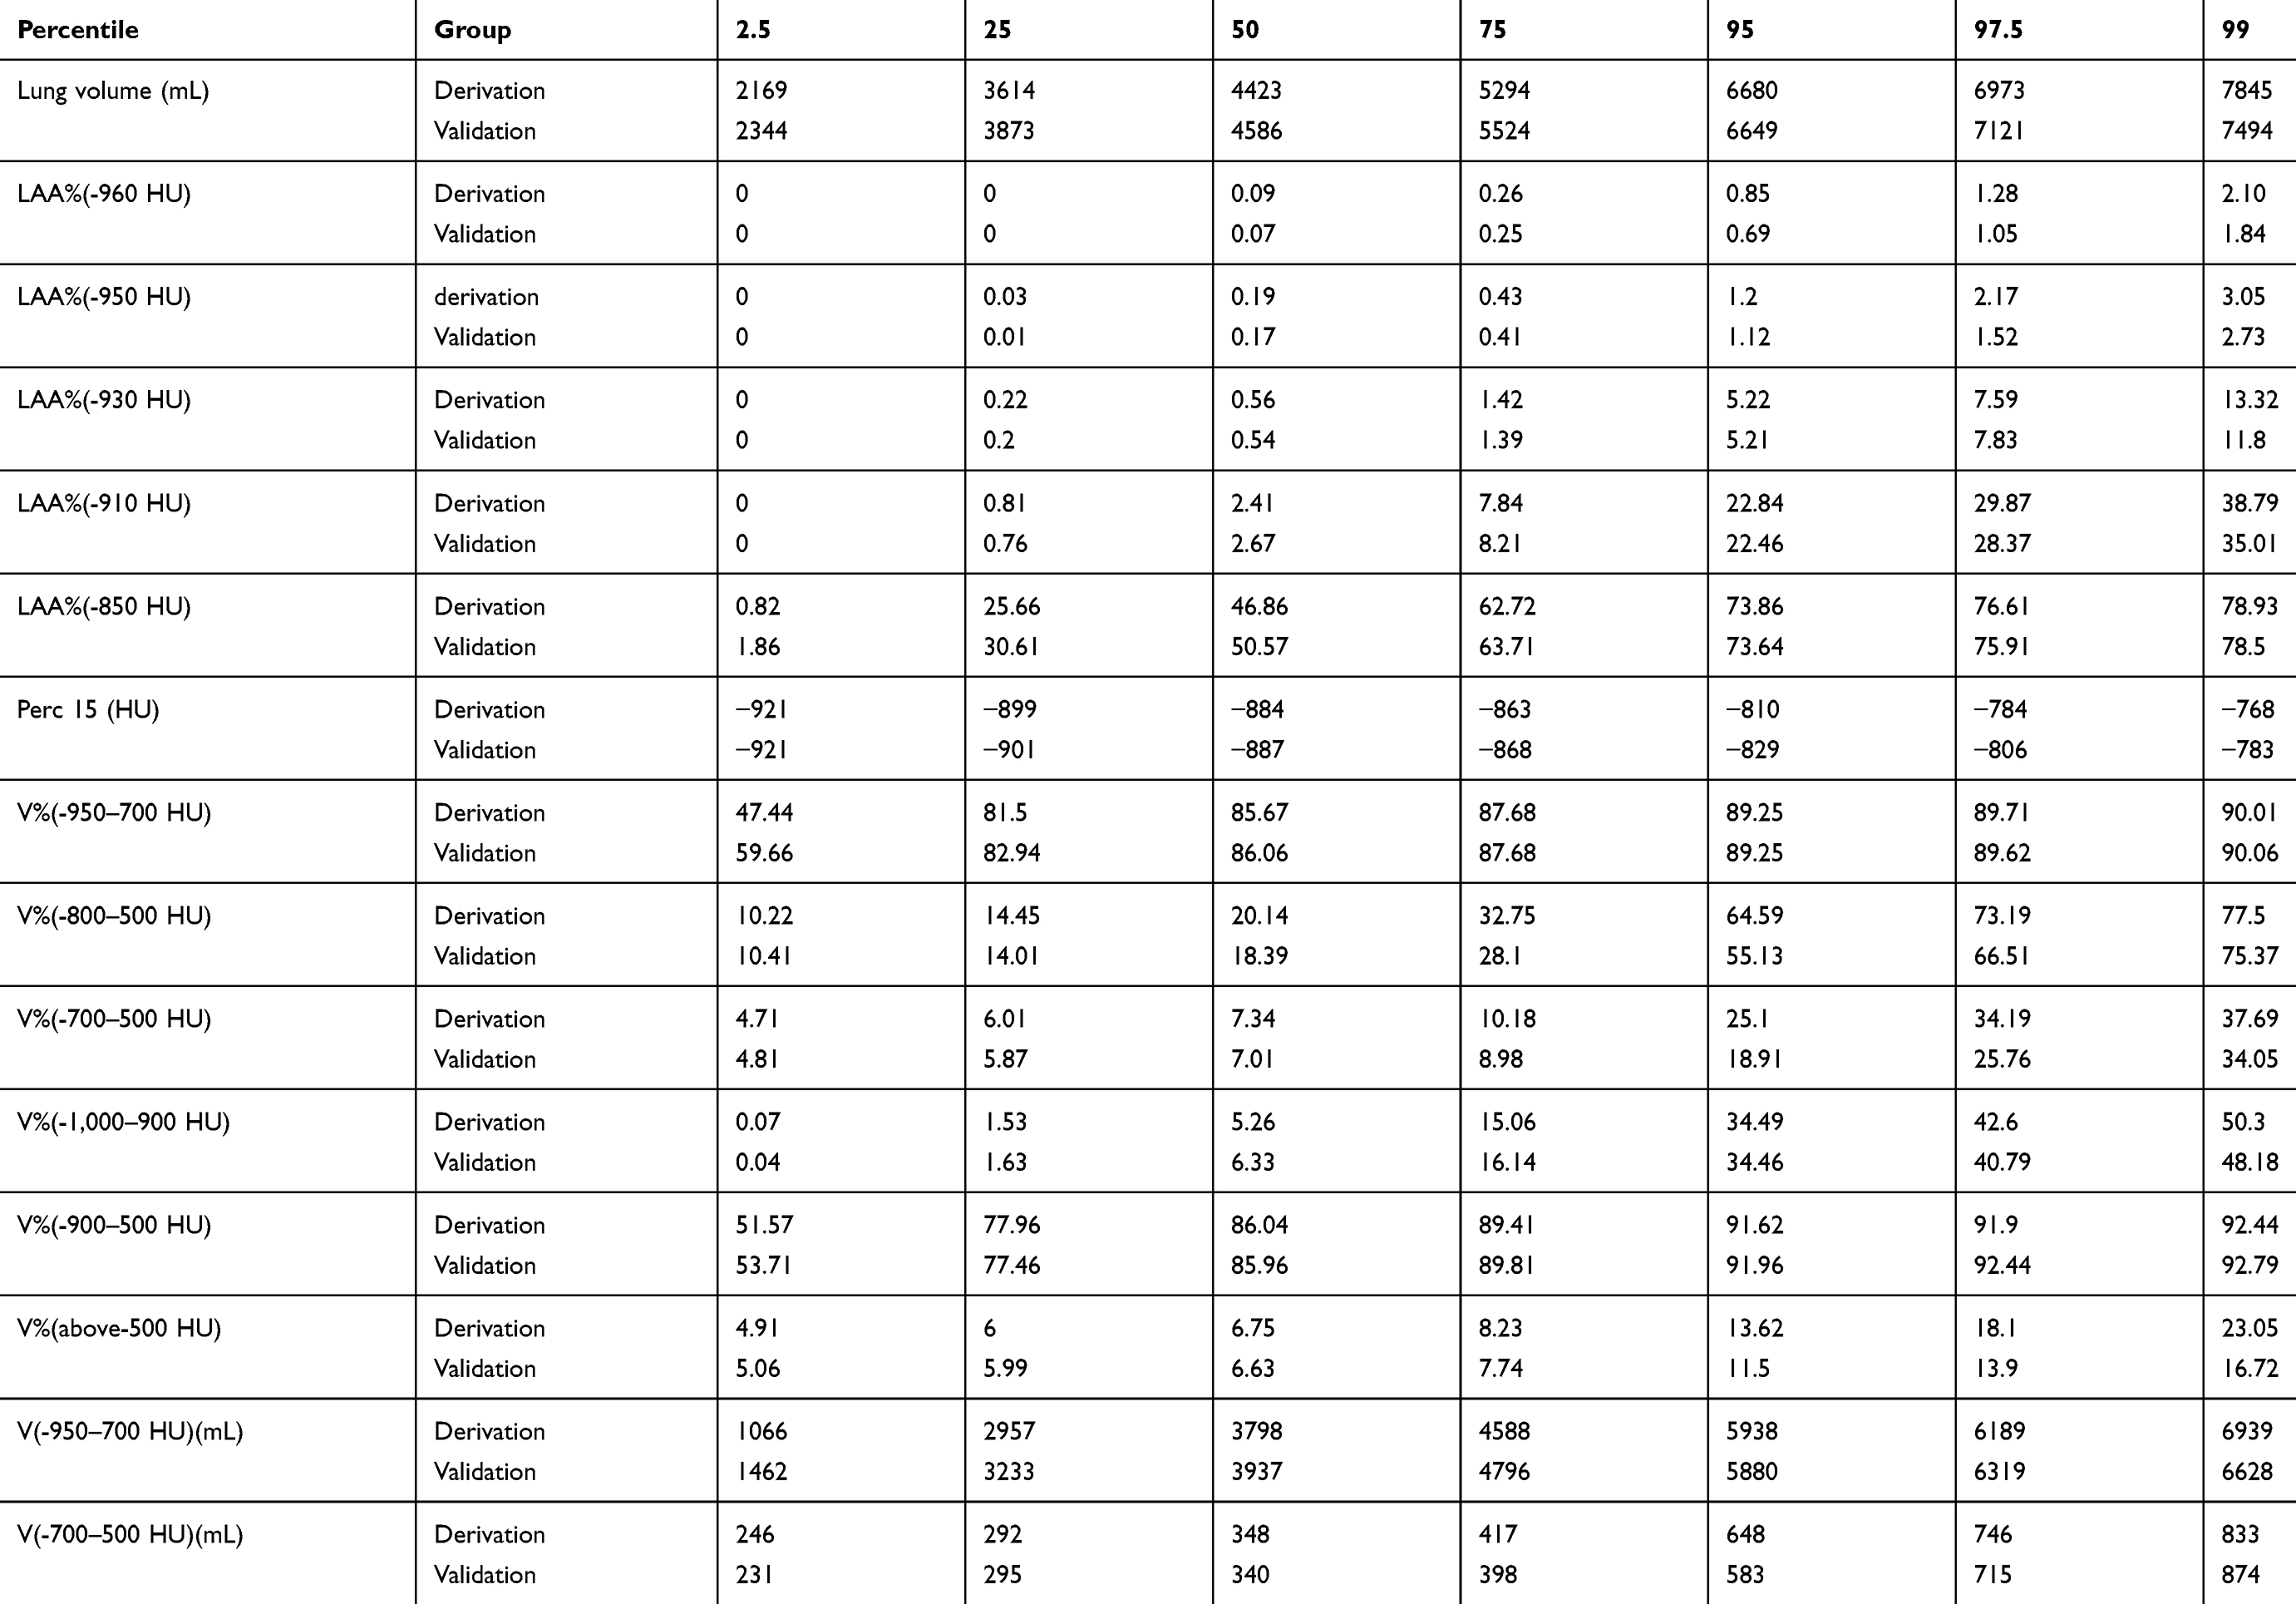 |
Table 2 Description of lung attenuation distribution and lung volume from computed tomography (CT) in the derivation and external validation groups |
 |
Figure 2 Distributions of LAA% and Perc n in subjects with normal lung function in males and females. Abbreviations: LAA%, percentage of lung volume occupied by low attenuation areas; Perc n, percentile of the histogram of attenuation values. |
No emphysema index (LAA% using -1,000–210 HU, Perc 1 to Perc 98) except for Perc 96 and Perc 97 followed a normal distribution. Normality obviously improved after BOXCOX transformation (Table S2). The scatter graph of LAA%(-950 HU) and lung volume vs demographic characteristics are shown in Figure S3. Reference equations and normal ranges were derived for lung volume, every LAA%, and Perc n and included terms of age, sex, height, weight and only age and sex. Main indices are shown in Table 3, and others are shown in Table S3.
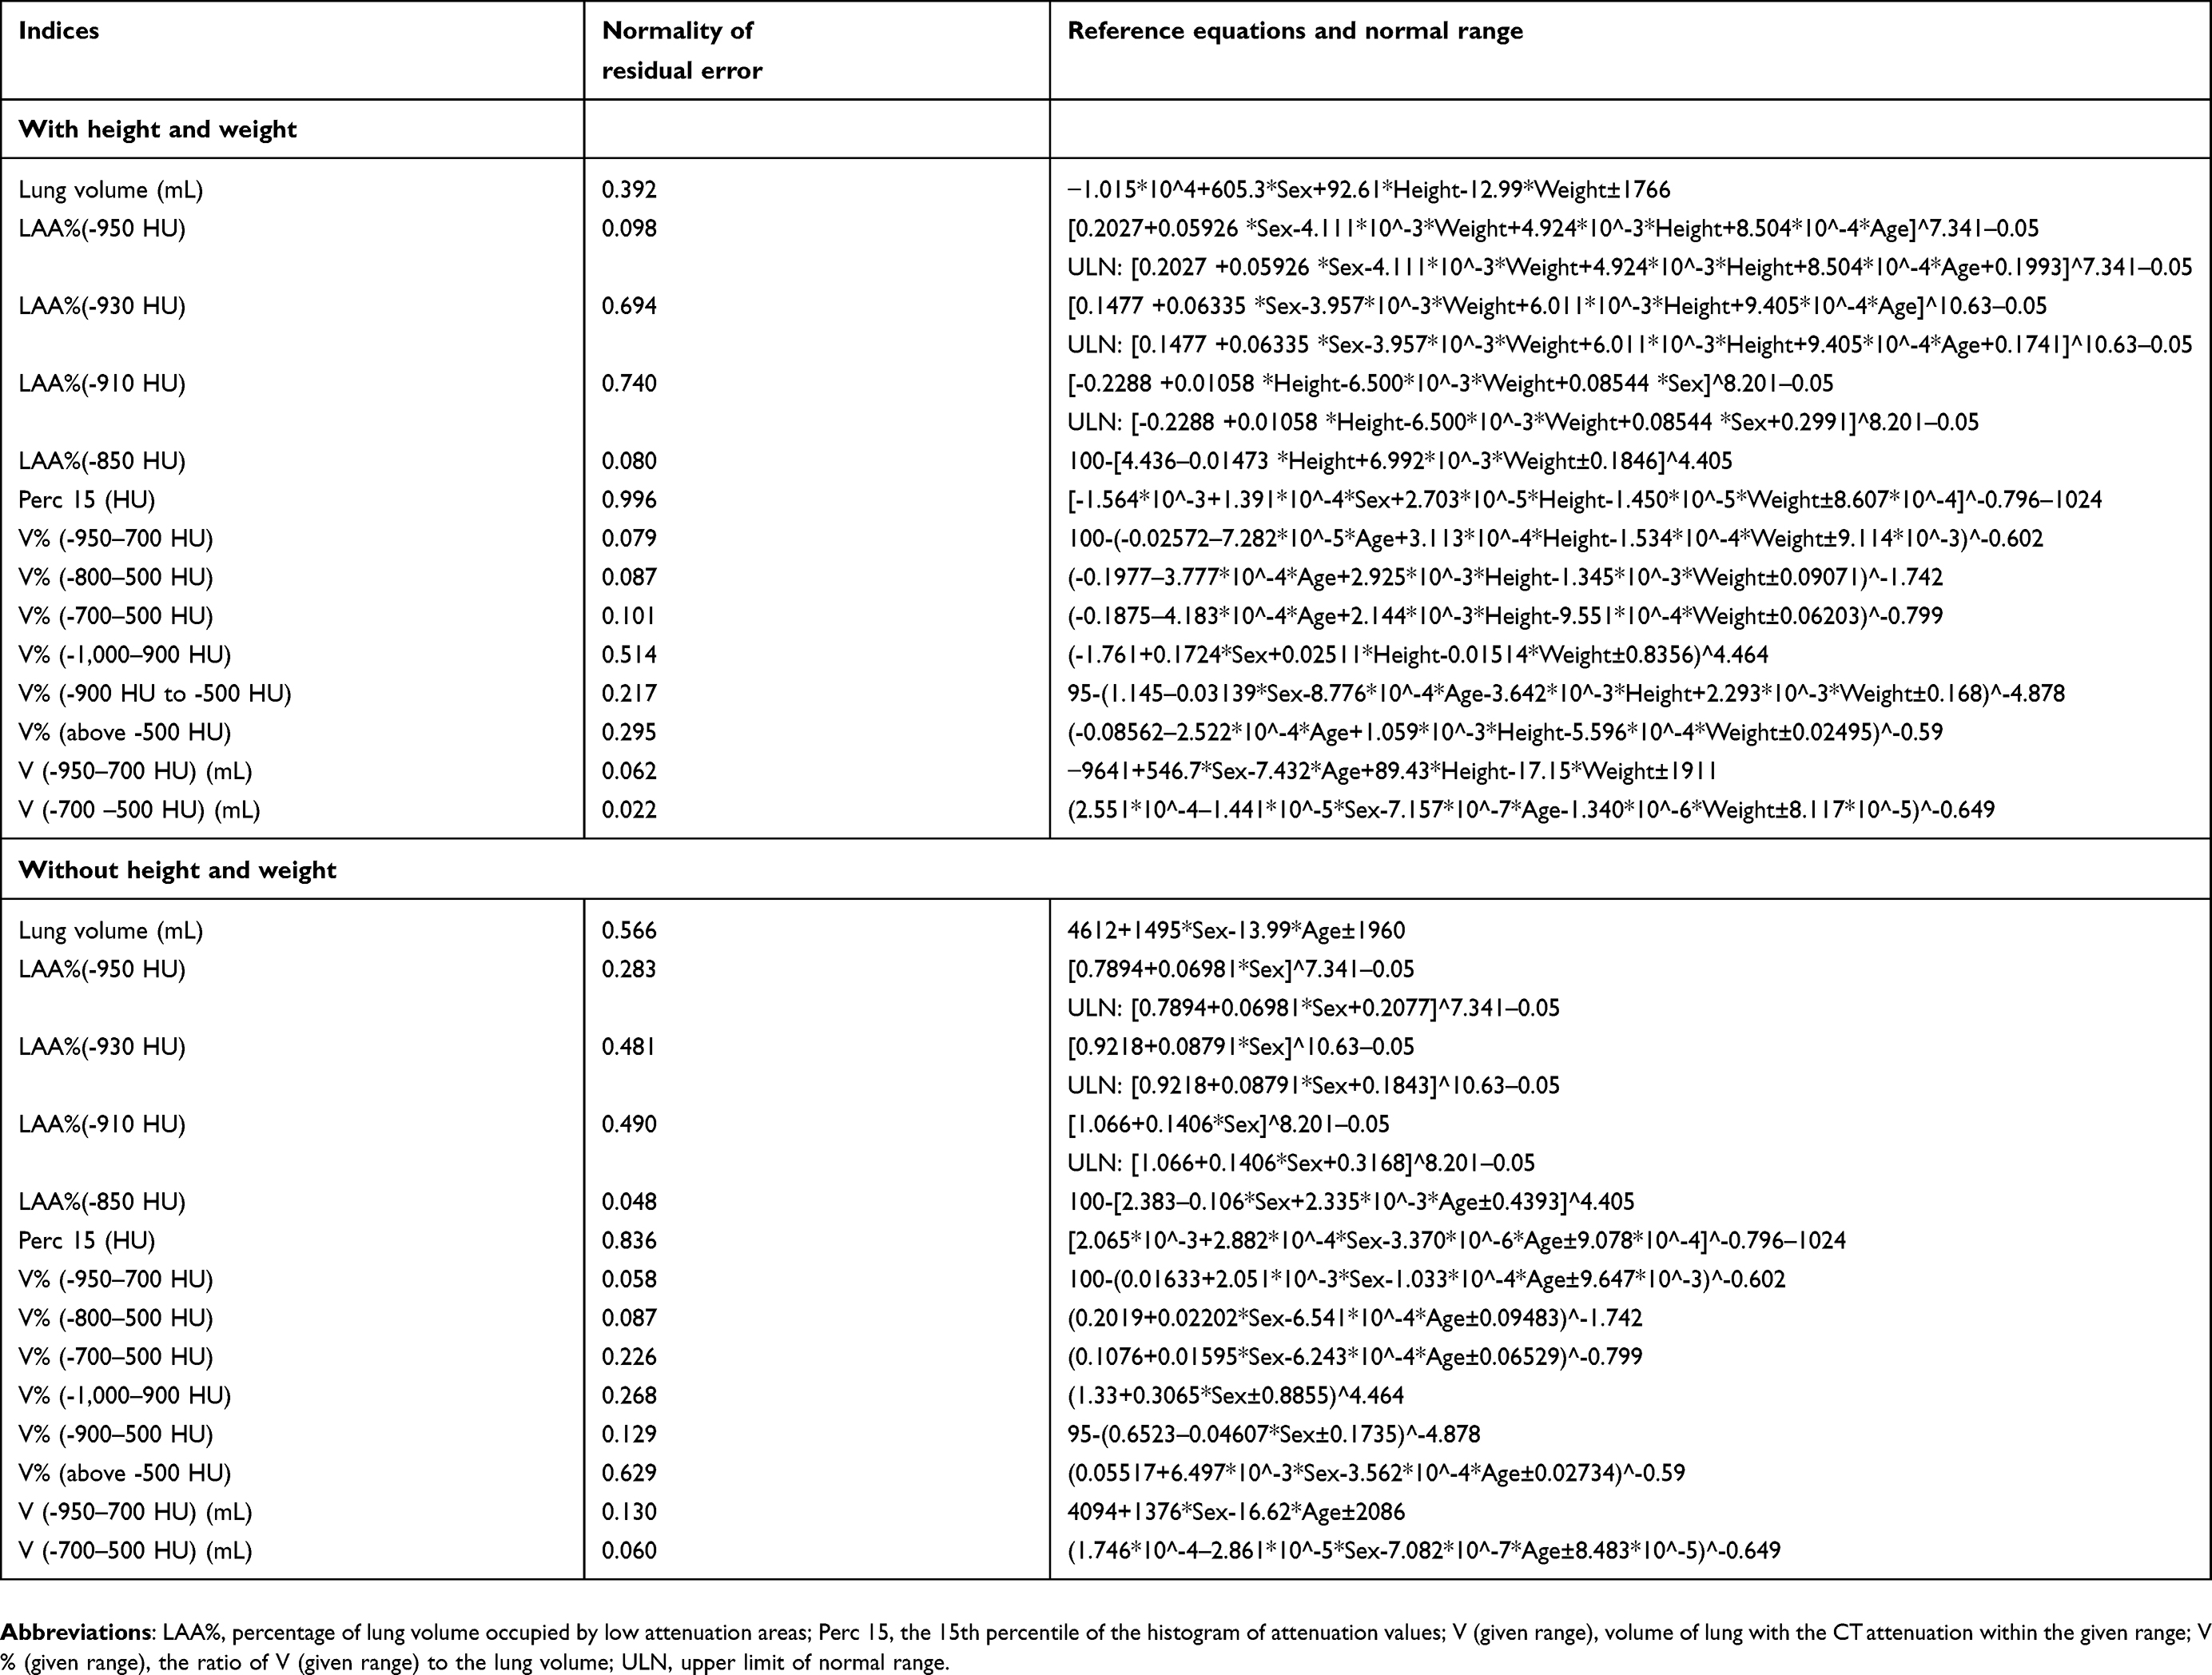 |
Table 3 Reference equations and normal ranges for lung attenuation distribution and lung volume from computed tomography (CT) scans based on data from the derivation group |
Lung volume (mL) =-1.015*10^4+605.3 * Sex (1= male, 0= female) +92.61 * Height (cm) - 12.99 * Weight (kg) ±1,766
LAA%(-950 HU) =[0.2027+0.05926 * Sex (1= male, 0= female) - 4.111*10^-3 * Weight (kg) +4.924*10^-3 * Height (cm) +8.504*10^-4 * Age] ^7.341–0.05
Upper limit of normal range: [0.2027+0.05926 * Sex - 4.111*10^-3* Weight +4.924*10^-3 * Height +8.504*10^-4 * Age +0.1993] ^7.341–0.05
We also found small but significant differences in LAA%(-950 HU), LAA%(-930 HU), and Perc 15 among different CT scanners even with similar reconstruction kernels and the same section thickness. Significant differences were not seen for total lung volume (Table 4).
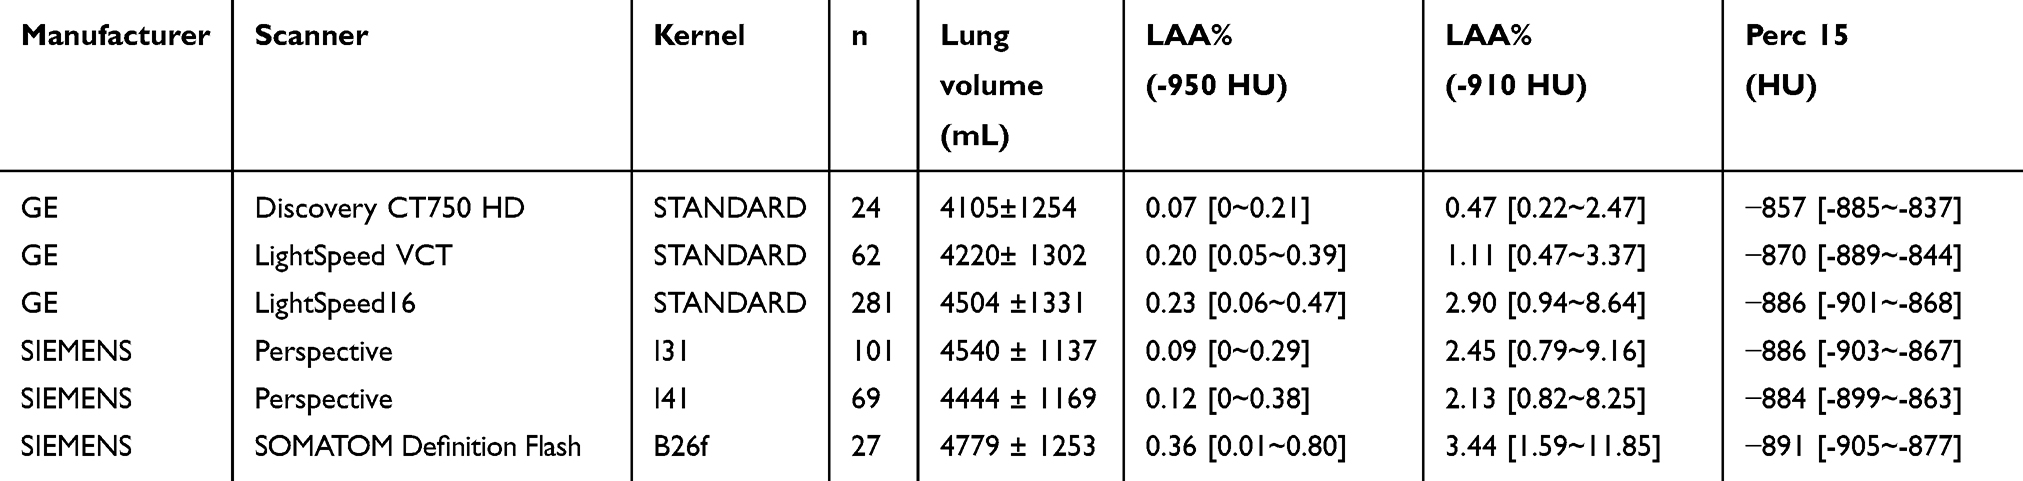 |
Table 4 Lung volume and attenuation distribution from different scanners and reconstruction kernels |
Table 5 shows differences between the observed values measured in the study subjects and values calculated from several available prediction equations. Aside from our equations, lung volumes were most closely consistent with the reference equation by Come et al31 for African Americans. Using a previous equation, Hoffman et al36 underestimated lung volume and overestimated LAA%(-950 HU), and Come et al31 overestimated lung volume. The differences between observed values and predicted values calculated from the present reference were similar in the derivation and external validation groups (Table S4).
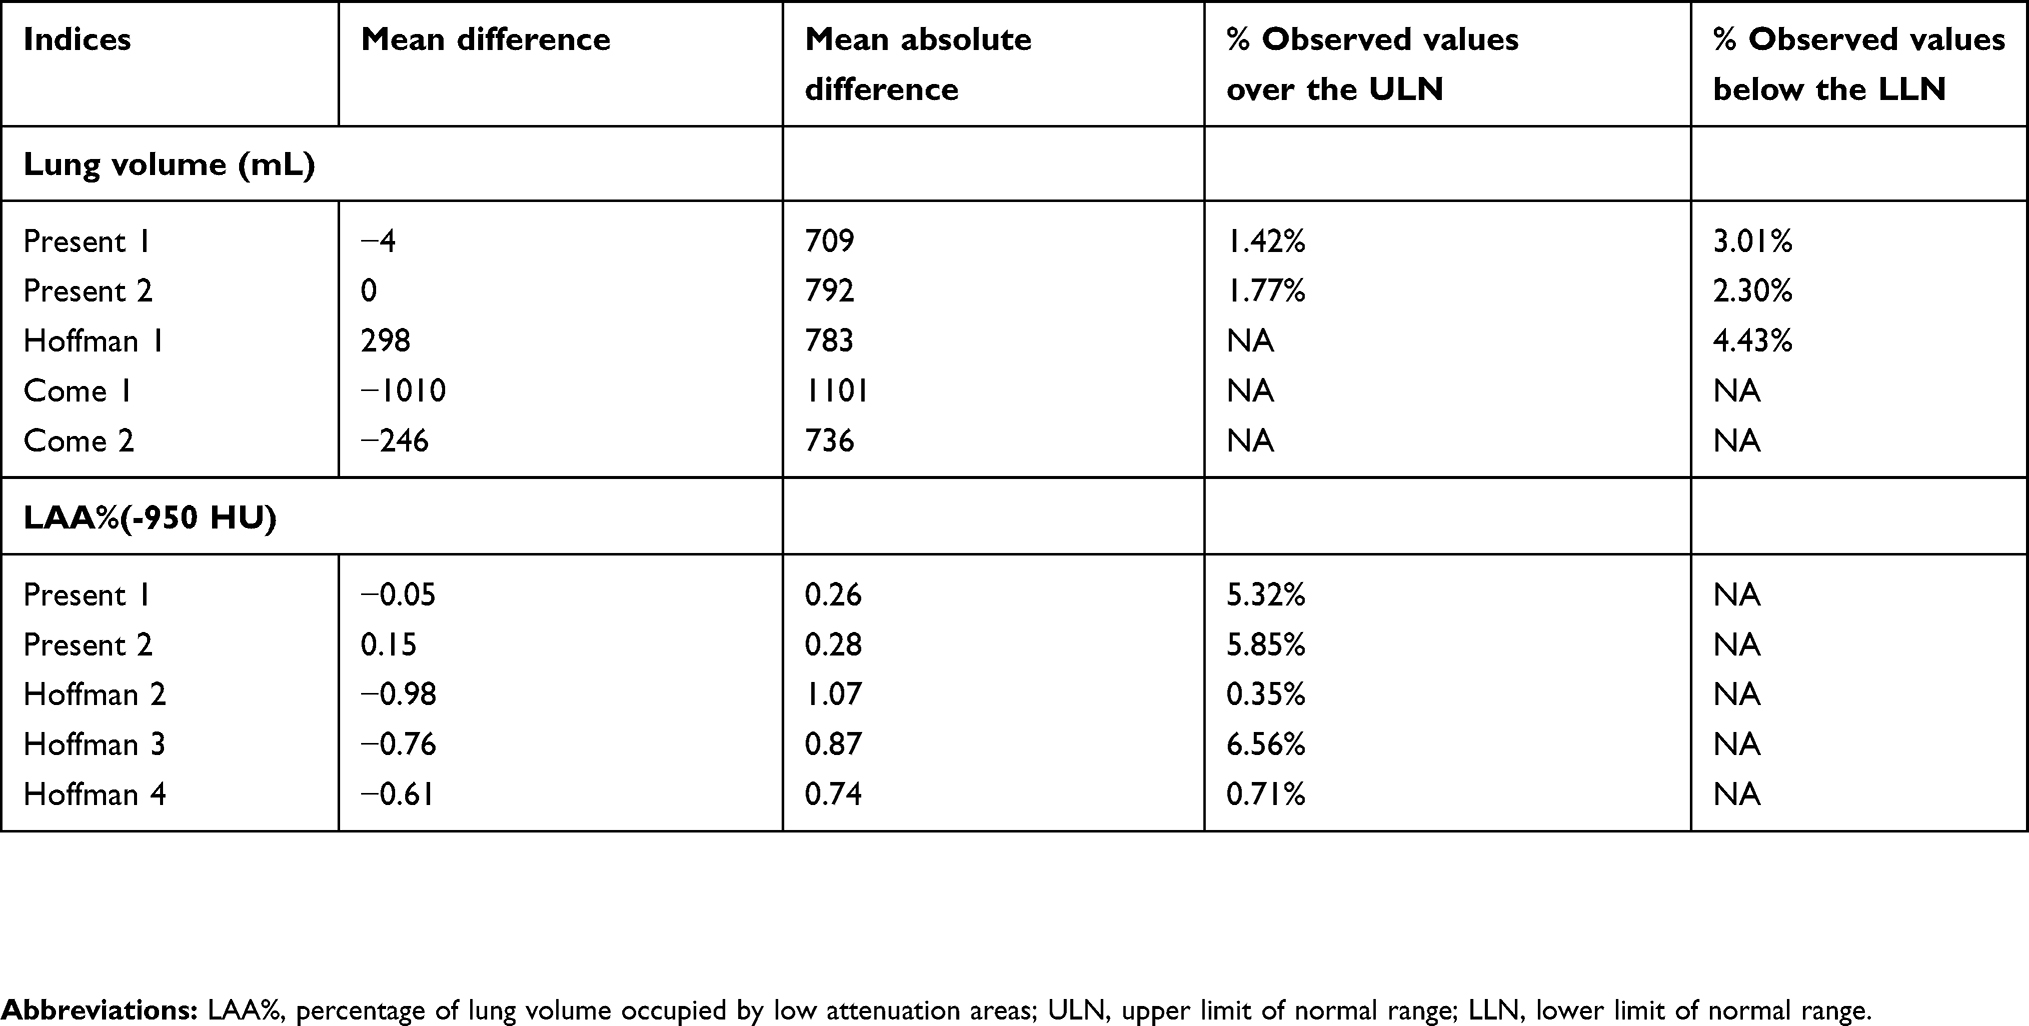 |
Table 5 Comparison between observed value of derivation group and the predicted value from different reference equations for lung volume and extent of emphysema |
The median lung volume measured by SB gas dilution method (TLC-SB) in derivation group was 5.12 L (4.345–5.92). The lung volume measured on CT was closely correlated with TLC-SB (r=0.814, p<0.001) (Figure 3A). However, there were still some differences between CT lung volume and SB lung volume. The mean difference was -339±777 mL. The difference seems to confirm normal distribution and was not correlated to other factors (eg, SB lung volume, age, sex, height, weight) (Figure 3B–F). However, the absolute deviations from mean of the difference between CT lung volume and SB lung volume seem positively correlated with age (r=0.150, p=0.061) (Figure 3D).
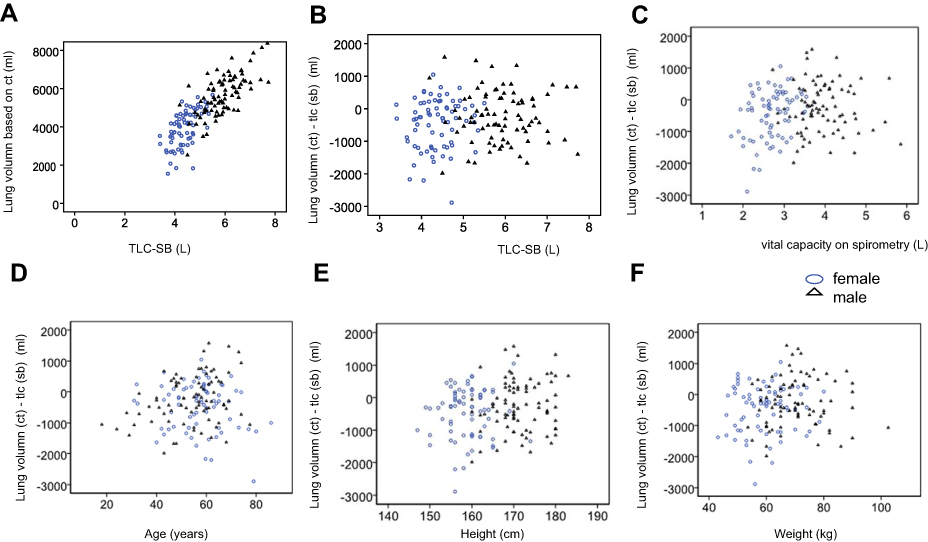 |
Figure 3 Consistency and difference between computed tomography (CT) lung volume vs single-breath (SB) lung volume. (A) Scatter plot between lung volume measured on CT and lung volume measured by SB gas dilution method (total lung capacity [TLC]-SB). (B) Scatter plot between lung volume (CT) - TLC (SB) and TLC (SB). (C) Scatter plot between lung volume (CT) - TLC (SB) and vital capacity on spirometry. (D) Scatter plot between lung volume (CT) - TLC (SB) and age. (E) Scatter plot between lung volume (CT) - TLC (SB) and height. (F) Scatter plot between lung volume (CT) - TLC (SB) and weight. |
Spearman’s correlation showed that LAA%(-950 HU), LAA%(-910 HU), and Perc 15 were not significantly correlated to X-ray tube current (r=0.017, -0.021, 0.030, respectively). Although there was a positive correlation between lung volume and tube current (r=0.115, p=0.006), the tube current was more closely correlated to height (r=0.676, p<0.001) and weight (r=0.360, p<0.001). Tube current was not an independent influencing factor of lung volume when other demographic characteristics (ie, height, weight, sex, age) were included in the multivariate regression.
Discussion
Results of the present study demonstrate significant variation in LAA%, Perc n, and total lung volume on CT scans due to demographic factors among Chinese subjects with normal lung function. We provided reference equations to account for normal variation and to more accurately define abnormal values of LAA%, Perc n, and total lung volume on CT scans.
Although CT characteristics in a normal population have been previously described in several studies,29,30,37,38 to the best of our knowledge, this study is the first to explore whole lung attenuation distribution from LAA%(-1,000 HU) to LAA%(-210 HU), and from Perc 1 to Perc 98, with a comparatively large sample size among Chinese subjects with normal lung function, using routine chest CT images reconstructed with 5 mm section thickness and the standard algorithm. Acquisition protocols were the same as protocols used in routine clinical practice. Reference equations were validated with an independent cohort, which strengthens the reliability of the study. Since routine CT scans do not include information about patients’ height and weight, we also generated reference equations using only age and sex. Hence, reference equations developed in our study are likely to be directly applicable to clinical practice.
Mean and median lung volumes were consistent with values reported in previous studies.32,35–37 Median LAA%(-950 HU) were lower than values in most previous studies.29–31,34–38 These results may be due to differences among races as well as differences in section thickness and reconstruction kernels. Previous studies showed that LAA%(-950 HU) in normal Asian participants was lower than LAA% for Caucasians.32 Median LAA%(-950 HU) in normal participants were 1%–2.5% with thin slice thickness and standard reconstruction,31,34,36,37 and 7.5%–15% with thin slice thickness and high resolution reconstruction.30,34,35 However, LAA%(-950 HU) was low (0.19%–0.59%) in young participants, even when reconstructed using high-frequency and 2 mm slice thickness.29,38
Median FLV, its ratio to lung volume (FLV%), ILDV, and ILDV% of patients with normal function and CT finding in previous studies fall between the 25th to 75th percentiles in the present study.15 Median FLV, FLV%, ILDV, ILDV% of patients with ILD in previous studies fall14,15 between the 2.5th and 25th or 75th and 97.5th percentiles in the present study. Overlaps of these indices are seen with ILD patients and normal participants.
In the present study, lung volume was found to be higher in males and tall and comparatively thin individuals, and was negatively related to age in the absence of height and weight information. This finding is consistent with most previous studies that also show higher lung volume in males31,36,37 and taller individuals.31,32,36 One study reported that lung volume was negatively correlated with body mass index,36 while another showed that lung volume was positively correlated with weight.32 Only one study36 indicated a negative correlation between age and lung volume; in other studies the correlations were not significant.31,37 The present study shows that LAA%(-950 HU) was higher in male, tall, thin, and elderly subjects. Previous studies reported that LAA% is higher in males.36,37 One study indicated that LAA% was higher in tall, thin, and elderly individuals,36 while another did not.37 Besides, we found that the lung volume measured on CT was lower than lung volume measured by SB gas dilution method. The differences between CT lung volume and SB lung volume may be caused by several factors. 1), the CT was performed at spine position and lung function test was performed at sitting position, while the lung volume at spine position was lower than that at sitting position. Therefore, the mean difference between CT lung volume and SB lung volume was negative. 2) The random error exists in every exam. 3) Some subjects, especially elders, may not cooperate with exams well. Therefore, the random error was larger in elders.
There are some limitations in this study. 1) The target population of this study was Chinese, healthy individuals. However, it is unethical to enroll healthy individuals to undergo chest CT. Therefore, we chose two different sample groups to ensure the representativeness. The derivation group included the patients with normal lung function and basically normal chest CT. The external validation group included the subjects who underwent chest CT examination for disease screening and had basically normal CT manifestations. In the derivation group, the patients underwent these examinations mainly as preoperative examination, or to find the causes of cough or chest tightness. 2) The information on symptoms and smoking status were not available. Smokers, asthmatic patients were not excluded. However, only individuals with normal lung function and chest CT were included. Currently, no evidence proves the differences in the lung volume and lung density distribution between asthmatic patients with normal spirometry results and healthy individuals. The healthy smokers without lung disease can also be regarded as a part of the normal, healthy population. Therefore, we considered that this group is at least representative of the population that presents to a hospital with a variety of conditions, but with normal lung structure and function. 3) The normal range and reference equation was not validated in an internal validation group with the same acceptance criteria. However, the comprehensive effect of the bias from overfitting and sample selection was evaluated by the external validation group. 4) In the present study, the tube current of external validation group was lower than the derivation group. Although some studies showed that CT scan measurements of low density lung structures were affected by radiation dose but are less sensitive to the lung volume,44 others showed there was no significant effect of tube current on emphysema extent measured on chest CT.5 In the present study, the X-ray tube current was not an independent influencing factor of LAA%(-950 HU), LAA%(-910 HU), Perc 15, and lung volume. Thus, we believed that this difference will not influence the results in this study.
In conclusion, herein we present a large population-based assessment of LAA%, Perc n, and total lung volume measured using CT scans from subjects with normal lung function and CT findings. We demonstrated significant differences in these measures based on sex, age, height, and weight, and we provided reference equations to account for these differences.
Acknowledgments
We kindly thank Jinhua Ni, Bei Cao, Professor Wei Deng, Zhou Fen, Jianfeng Shen, and Jilin Li for their help in this work. This work was supported by Scientific Research Projects of the Shanghai Municipal Health and Family Planning Commission for youths (Project No 20164Y0118), Research Foundation of Ruijin Hospital North and Shanghai Jiao Tong University School of Medicine (Project No 2015ZY04), and Shanghai Key Discipline for Respiratory Diseases (Project No 2017ZZ02014).
Disclosure
The authors report no conflicts of interest in this work.
References
1. Gevenois PA, De Maertelaer V, De Vuyst P, Zanen J, Yernault J-C. Comparison of computed density and macroscopic morphometry in pulmonary emphysema. Am J Respir Crit Care Med. 1995;152(2):653–657. doi:10.1164/ajrccm.152.2.7633722
2. Hoffman EA. Effect of body orientation on regional lung expansion: a computed tomographic approach. J Appl Physiol. 1985;59(2):468–480. doi:10.1152/jappl.1985.59.2.468
3. Coxson H, Mayo J, Behzad H, et al. Measurement of lung expansion with computed tomography and comparison with quantitative histology. J Appl Physiol. 1995;79(5):1525–1530. doi:10.1152/jappl.1995.79.5.1525
4. Litmanovich D, Boiselle PM, Bankier AA. Ct of pulmonary emphysema-current status, challenges, and future directions. Eur Radiol. 2009;19(3):537–551. doi:10.1007/s00330-008-1186-4
5. Madani A, De Maertelaer V, Zanen J, Gevenois PA. Pulmonary emphysema: radiation dose and section thickness at multidetector ct quantification—comparison with macroscopic and microscopic morphometry. Radiology. 2007;243(1):250–257. doi:10.1148/radiol.2431060194
6. Müller NL, Staples CA, Miller RR, Abboud RT. “Density mask”: an objective method to quantitate emphysema using computed tomography. Chest. 1988;94(4):782–787. doi:10.1378/chest.94.4.782
7. Haruna A, Muro S, Nakano Y, et al. Ct scan findings of emphysema predict mortality in copd. Chest J. 2010;138(3):635–640. doi:10.1378/chest.09-2836
8. Hoesein FAM, de Hoop B, Zanen P, et al. Ct-quantified emphysema in male heavy smokers: association with lung function decline. Thorax. 2011;66(9):782–787. doi:10.1136/thx.2010.145995
9. Johannessen A, Skorge TD, Bottai M, et al. Mortality by level of emphysema and airway wall thickness. Am J Respir Crit Care Med. 2013;187(6):602–608. doi:10.1164/rccm.201209-1722OC
10. Hoesein FAM, van Rikxoort E, van Ginneken B, et al. Computed tomography-quantified emphysema distribution is associated with lung function decline. Eur Respir J. 2012;40(4):844–850. doi:10.1183/09031936.00186311
11. McAllister DA, Ahmed FS, Austin JH, et al. Emphysema predicts hospitalisation and incident airflow obstruction among older smokers: a prospective cohort study. PLoS One. 2014;9(4):e93221. doi:10.1371/journal.pone.0093221
12. Tan W, Bourbeau J, Hernandez P, et al. Exacerbation-like respiratory symptoms in individuals without chronic obstructive pulmonary disease: results from a population-based study. Thorax. 2014;69(8):709–717. doi:10.1136/thoraxjnl-2013-205048
13. Lynch DA. Quantitative ct of fibrotic interstitial lung disease. Chest J. 2007;131(3):643–644. doi:10.1378/chest.06-2955
14. Salaffi F, Carotti M, Di Donato E, et al. Computer-aided tomographic analysis of interstitial lung disease (ild) in patients with systemic sclerosis (ssc). Correlation with pulmonary physiologic tests and patient-centred measures of perceived dyspnea and functional disability. PLoS One. 2016;11(3):e0149240. doi:10.1371/journal.pone.0149240
15. Shin KE, Chung MJ, Jung MP, Choe BK, Lee KS. Quantitative computed tomographic indexes in diffuse interstitial lung disease: correlation with physiologic tests and computed tomography visual scores. J Comput Assist Tomogr. 2011;35(2):266–271. doi:10.1097/RCT.0b013e31820ccf18
16. Yabuuchi H, Matsuo Y, Tsukamoto H, et al. Evaluation of the extent of ground-glass opacity on high-resolution ct in patients with interstitial pneumonia associated with systemic sclerosis: comparison between quantitative and qualitative analysis. Clin Radiol. 2014;69(7):758–764. doi:10.1016/j.crad.2014.03.008
17. Johri A, Schimel D, Noguchi A, Hsu LL. Semi-automated method to measure pneumonia severity in mice through computed tomography (ct) scan analysis. SPIE Med Imaging. 2010;
18. Gattinoni L, Caironi P, Pelosi P, Goodman LR. What has computed tomography taught us about the acute respiratory distress syndrome? Am J Respir Crit Care Med. 2001;164(9):1701–1711. doi:10.1164/ajrccm.164.9.2103121
19. Hartley PG, Galvin JR, Hunninghake GW, et al. High-resolution ct-derived measures of lung density are valid indexes of interstitial lung disease. J Appl Physiol. 1994;76(1):271–277. doi:10.1152/jappl.1994.76.1.271
20. Clausen J. Measurement of absolute lung volumes by imaging techniques. Eur Respir J. 1997;10(10):2427–2431. doi:10.1183/09031936.97.10102427
21. Pellegrino R, Viegi G, Brusasco V, et al. Interpretative strategies for lung function tests. Eur Respir J. 2005;26(5):948–968. doi:10.1183/09031936.05.00035205
22. Aaron SD, Dales RE, Cardinal P. How accurate is spirometry at predicting restrictive pulmonary impairment? Chest J. 1999;115(3):869–873. doi:10.1378/chest.115.3.869
23. Rodenstein DO, Stănescu DC, With the technical assistance of C, Pahulycz CP, Leemputten RV. Reassessment of lung volume measurement by helium dilution and by body plethysmography in chronic air-flow obstruction 1–3. Am Rev Respir Dis. 1982;126(6):1040–1044. doi:10.1164/arrd.1982.126.6.1040
24. Glady CA, Aaron SD, Lunau M, Clinch J, Dales RE. A spirometry-based algorithm to direct lung function testing in the pulmonary function laboratory. Chest J. 2003;123(6):1939–1946. doi:10.1378/chest.123.6.1939
25. Coxson H, Fauerbach PN, Storness-Bliss C, et al. Computed tomography assessment of lung volume changes after bronchial valve treatment. Eur Respir J. 2008;32(6):1443–1450. doi:10.1183/09031936.00056008
26. Zaporozhan J, Ley S, Eberhardt R, et al. Paired inspiratory/expiratory volumetric thin-slice ct scan for emphysema analysis: comparison of different quantitative evaluations and pulmonary function test. Chest J. 2005;128(5):3212–3220. doi:10.1378/chest.128.5.3212
27. Hoffman EA, Ritman EL. Heart-lung interaction: effect on regional lung air content and total heart volume. Ann Biomed Eng. 1987;15(3):241–257.
28. Mobberley SD, Fuld MK, Sieren JP, Primak AN, Hoffman EA. Scatter correction associated with dedicated dual-source ct hardware improves accuracy of lung air measures. Acad Radiol. 2013;20(11):1334–1343. doi:10.1016/j.acra.2013.04.018
29. Mets OM, van Hulst RA, Jacobs C, van Ginneken B, de Jong PA. Normal range of emphysema and air trapping on ct in young men. Am J Roentgenol. 2012;199(2):336–340. doi:10.2214/AJR.11.7808
30. Gevenois P-A, Scillia P, De Maertelaer V, Michils A, De Vuyst P, Yernault JC. The effects of age, sex, lung size, and hyperinflation on ct lung densitometry. Am J Roentgenol. 1996;167(5):1169–1173. doi:10.2214/ajr.167.5.8911175
31. Come CE, Diaz AA, Curran-Everett D, et al. Characterizing functional lung heterogeneity in copd using reference equations for ct scan-measured lobar volumes. Chest J. 2013;143(6):1607–1617. doi:10.1378/chest.12-1616
32. Cressoni M, Gallazzi E, Chiurazzi C, et al. Limits of normality of quantitative thoracic ct analysis. Crit Care. 2013;17(3):R93. doi:10.1186/cc12734
33. Soejima K, Yamaguchi K, Kohda E, et al. Longitudinal follow-up study of smoking-induced lung density changes by high-resolution computed tomography. Am J Respir Crit Care Med. 2000;161(4):1264–1273. doi:10.1164/ajrccm.161.4.9905040
34. Marsh S, Aldington S, Williams MV, et al. Utility of lung density measurements in the diagnosis of emphysema. Respir Med. 2007;101(7):1512–1520. doi:10.1016/j.rmed.2007.01.002
35. Heussel C, Herth F, Kappes J, et al. Fully automatic quantitative assessment of emphysema in computed tomography: comparison with pulmonary function testing and normal values. Eur Radiol. 2009;19(10):2391–2402. doi:10.1007/s00330-009-1437-z
36. Hoffman EA, Ahmed FS, Baumhauer H, et al. Variation in the percent of emphysema-like lung in a healthy, nonsmoking multiethnic sample. The mesa lung study. Ann Am Thorac Soc. 2014;11(6):898–907. doi:10.1513/AnnalsATS.201310-364OC
37. Zach JA, Newell JD
38. Irion KL, Marchiori E, Hochhegger B, et al. Ct quantification of emphysema in young subjects with no recognizable chest disease. Am J Roentgenol. 2009;192(3):W90–W96. doi:10.2214/AJR.07.3502
39. Yamashiro T, Matsuoka S, Rsj E, et al. Quantitative airway assessment on computed tomography in patients with α1-antitrypsin deficiency. Int J Chron Obstruct Pulmon Dis. 2009;6(6):468–477. doi:10.3109/15412550903341521
40. Crossley D, Renton M, Khan M, Low EV, Turner AM. Ct densitometry in emphysema: A systematic review of its clinical utility. Int J Chron Obstruct Pulmon Dis. 2018;13:547–563. doi:10.2147/COPD.S143066
41. Macintyre N, Crapo R, Viegi G, et al. Standardisation of the single-breath determination of carbon monoxide uptake in the lung. Eur Respir J. 2005;26(4):720–735. doi:10.1183/09031936.05.00034905
42. Miller MR, Hankinson J, Brusasco V, et al. Standardisation of spirometry. Eur Respir J. 2005;26(2):319–338. doi:10.1183/09031936.05.00034805
43. Osborne JW. Improving your data transformations: applying the box-cox transformation. Pract Assess Res Eval. 2010;15:9.
44. Yuan R, Mayo JR, Hogg JC, et al. The effects of radiation dose and ct manufacturer on measurements of lung densitometry. Chest. 2007;132(2):617–623. doi:10.1378/chest.06-2325
 © 2019 The Author(s). This work is published and licensed by Dove Medical Press Limited. The
full terms of this license are available at https://www.dovepress.com/terms
and incorporate the Creative Commons Attribution
- Non Commercial (unported, 3.0) License.
By accessing the work you hereby accept the Terms. Non-commercial uses of the work are permitted
without any further permission from Dove Medical Press Limited, provided the work is properly
attributed. For permission for commercial use of this work, please see paragraphs 4.2 and 5 of our Terms.
© 2019 The Author(s). This work is published and licensed by Dove Medical Press Limited. The
full terms of this license are available at https://www.dovepress.com/terms
and incorporate the Creative Commons Attribution
- Non Commercial (unported, 3.0) License.
By accessing the work you hereby accept the Terms. Non-commercial uses of the work are permitted
without any further permission from Dove Medical Press Limited, provided the work is properly
attributed. For permission for commercial use of this work, please see paragraphs 4.2 and 5 of our Terms.