")
Back to Journals » International Journal of General Medicine » Volume 14
Nonlinear Relationship Between AST-to-ALT Ratio and the Incidence of Type 2 Diabetes Mellitus: A Follow-Up Study
Received 5 October 2021
Accepted for publication 5 November 2021
Published 18 November 2021 Volume 2021:14 Pages 8373—8382
DOI https://doi.org/10.2147/IJGM.S341790
Checked for plagiarism Yes
Review by Single anonymous peer review
Peer reviewer comments 4
Editor who approved publication: Dr Scott Fraser
Hua Niu,1 Yinghua Zhou2
1Department of Ultrasound Medicine, Xidian Group Hospital, Xi’an, 710077, People’s Republic of China; 2Department of Ultrasound Medicine, Xi’an Gaoxin Hospital, Xi’an, 710075, People’s Republic of China
Correspondence: Yinghua Zhou
Department of Ultrasound Medicine, Xi’an Gaoxin Hospital, No. 16, Unity South Road, Xi’an, 710075, Shaanxi, People’s Republic of China
Tel +86 18991925530
Email [email protected]
Background: The aspartate aminotransferase (AST) to alanine aminotransferase (ALT) ratio has been demonstrated to be associated with insulin resistance and metabolic syndrome. However, few studies have directly explored the association between the AST/ALT ratio and the incidence of type 2 diabetes mellitus (T2DM). As such, the present study aimed to investigate the relationship between the AST/ALT ratio and incident T2DM during follow-up in a population-based cohort.
Methods: This retrospective cohort analysis included 15,464 Japanese males and females without DM at baseline between 2004 and 2015. The association between AST/ALT ratio and T2DM was retrospectively examined using the Cox proportional hazard model after adjusting for multiple potential confounders.
Results: After follow-up, 373 (2.41%) patients developed T2DM. A nonlinear relationship between the AST/ALT ratio and T2DM was observed after adjusting for potential confounders. The risk for developing T2DM decreased with AST/ALT ratio up to a threshold of 0.93 (adjusted hazard ratio [HR] 0.14 [95% confidence interval (CI) = 0.02– 0.90; P = 0.0385]). An AST/ALT ratio > 0.93 was not associated with the risk for developing T2DM (adjusted HR = 0.67, 95% CI = 0.17– 2.65; P = 0.5718).
Conclusion: The AST/ALT ratio was associated with a lower incidence of T2DM in a nonlinear pattern. The threshold AST/ALT ratio for developing T2DM was 0.93. AST/ALT levels were inversely correlated with the occurrence of T2DM when AST/ALT ratio ≤ 0.93.
Keywords: AST, ALT, diabetes mellitus, follow-up, nonlinear association
Introduction
Diabetes mellitus (DM) is a common chronic metabolic disorder and is one of the major public health concern worldwide.1 Type 2 DM (T2DM) accounts for almost 90% of DM cases,2 and can affect an individual’s quality of life, multiple organs, and physiological systems, resulting in numerous morbidities and even premature death.3
The etiology of T2DM involves insulin resistance and β-cell dysfunction, as well as complex interactions between genetic and environmental factors. High-density lipoprotein cholesterol (HDL-c), triglycerides, fasting blood glucose, alanine aminotransferase (ALT), aspartate aminotransferase (AST), and glycosylated hemoglobin (HbA1c) are clinical risk variables usually used to identify individuals at higher risk for developing T2DM.4 The physiological roles of AST and ALT are diverse and have long been identified as biomarkers of liver injury.5 The AST/ALT ratio was first introduced in 1957,6 and since then, it has been used to interpret the status of several chronic liver diseases, such as cardiovascular disease (CVD),7 metabolic syndrome,8 nonalcoholic fatty liver disease (NAFLD),9 hyperinsulinemia and insulin resistance.10 However, the clinical utility of the AST/ALT ratio in predicting the likelihood of future development of T2DM remains unclear. As such, this study aimed to explore the relationship between the AST/ALT ratio and incident T2DM during follow-up in a population-based cohort.
Materials and Methods
Study Population
The Dryad Digital Repository (https://datadryad.org/) is a curated resource that enables researchers to freely download and cite original study data. Data pertaining to 15,464 participants without DM at baseline were downloaded from the Dryad data repository (dataset: 10.5061/dryad.8q0p192). This study was a secondary investigation of a medical examination program with public data from the NAGALA database (NAFLD in Gifu Area, Longitudinal Analysis).11 Data collection and participant exclusion criteria have been described in a previous study. Briefly, this program extracted data pertaining to individuals who underwent repeated examinations. Fatty liver was diagnosed according to abdominal ultrasonography results based on previous criteria.12
Inclusion and Exclusion Criteria
Individuals with viral hepatitis, alcoholic fatty liver disease, medication use, and DM at baseline examination were excluded (Figure 1). A standardized self-administered questionnaire was utilized to collect medical history and multiple other factors of all individuals. The present study used the following variables in the analysis: age; sex (male, female); waist circumference (WC); body mass index (BMI); smoking status (never, past, current); alcohol consumption (none: <40 g/week; light: 40–140 g/week; moderate: 140–280 g/week; and heavy: >280 g/week); systolic blood pressure (SBP); diastolic blood pressure (DBP); fasting plasma glucose; γ-glutamyl transpeptidase (GGT); ALT; AST; AST/ALT ratio; high-density lipoprotein cholesterol (HDL-c); total cholesterol; exercise (yes, no); fatty liver (yes, no); habit of exercise (yes, no); triglyceride; HbA1c; incident T2DM (yes, no); and follow-up duration. T2DM was defined as self-reported HbA1c ≥ 6.5% or fasting plasma glucose level ≥7 mmol/L.11 The study complied with the Dryad publication guidelines; thus, approval from the institutional ethics committee was not required.
 |
Figure 1 Flowchart of the research procedure in present study. |
Statistical Methods
Data are expressed as mean ± standard deviation for continuous variables with normal distribution, and skewed distribution with median (25 percentile, 75 percentile), and n (%) for categorical variables. Because the data distributions for GGT, ALT, and AST were clearly skewed, the data are expressed as median (25 percentile, 75 percentile). The chi-squared test, one-way analysis of variance, or Kruskal–Wallis test were used to explore statistical differences between groups stratified according to AST/ALT ratio quartiles. The AST/ALT ratio was divided into four groups defined by the following quartiles Q1 < 1.455; 1.455 ≤ Q2 < 1.927; 1.927 < Q3 ≤ 2.4; and Q4 ≥ 2.4. Cumulative event rates were predicted using Kaplan–Meier survival curves, and probability values were measured using the Log rank test. Furthermore, the Cox proportional hazards regression model with cubic spline functions was used to explore the nonlinear relationship between the AST/ALT ratio and T2DM. Threshold effects E analysis was performed through smooth curve fitting to determine the presence of a piecewise linear relationship(s). Hazard ratio (HR) and corresponding 95% CI were estimated using multivariable Cox proportional hazards regression to examine the associations between the AST/ALT ratio and incident T2DM. Three regression models were used to determine the association between AST/ALT ratio and T2DM. Model 1 was an unadjusted model; model 2 was adjusted for age, sex, BMI, regular exerciser, waist circumference, smoking, and alcohol consumption, and model 3 was the same as model 2 with additional adjustment for GGT, HDL-c, total cholesterol, triglycerides, HbA1C, fasting plasma glucose, SBP, DBP, fatty liver, AST and ALT. Undoubtedly, unmeasured confounding is a common problem in observational epidemiological studies. As such, efforts are made to collect data on and control for as many variables as possible that are related to the exposure and outcome of interest. Thus, E-values were calculated, which were defined as the minimum strength of association that an unmeasured factor would need to have with both the exposure and the outcome to completely explain the observed associations between any unmeasured confounder: AST/ALT ratio (exposure) and T2DM (outcome).13 E-values range from 1 to infinity, and an increased value indicates the need for a higher degree of unmeasured confounding to eliminate the influence of the exposure. Statistical analyses were performed using R version 3.6.1 (http://www.R-project.org/), Empower (R) (www.empowerstats.com, X&Y solutions, Inc, Boston, MA, USA), and STATA (version 14.0; Stata Corporation, College Station, TX, USA). For all tests, differences with P < 0.05 were considered to be statistically significant.
Results
Population Characteristics
A total of 15,464 participants free of DM at baseline were included in the study. The clinical characteristics of the participants, grouped into four quartiles of AST/ALT ratio (ie, Q1–Q4), are summarized in Table 1. The mean age of the participants was 43 years (range, 18–79 years), and 45.5% were female. With an increase in the AST/ALT ratio, participants tended to be older and have a lower BMI and WC, lower levels of ALT and GGT, lower SBP and DBP, and lower proportion of smoking and alcohol consumption (P < 0.001). In terms of other risk factors, the proportion of fatty liver and regular exerciser tended to increase with the AST/ALT ratio (P < 0.001 for all). During up to 12.9 years of follow-up (median, 5.38 years), 373 (2.41%) patients developed T2DM. The individuals were divided into four categories according to quartiles of AST/ALT ratio. Kaplan–Meier analysis for the cumulative incidence of T2DM stratified according to AST/ALT ratio quartiles is shown in Figure 2. Participants with the lowest AST/ALT ratio (<1.455) demonstrated a significantly higher risk for T2DM during the follow-up period (P < 0.001 [log rank]).
 |
Table 1 Baseline Characteristics Stratified by AST/ALT Quartiles |
 |
Figure 2 Kaplan–Meier estimation cumulative hazard of the occurrence of T2DM by quartiles of ASL/ALT ratio among participants free of DM at baseline. |
The AST/ALT Ratio for Predicting Incident T2DM
The effectiveness of the AST/ALT ratio in predicting incident T2DM was explored using univariate and multivariate Cox regression models (Table 2). In the unadjusted model, when the ASL/ALT ratio was treated as a continuous variable, it was inversely associated with the risk for T2DM (HR 0.21 [95% CI 0.08–0.53]; P = 0.001), and when the ASL/ALT ratio was used as a quartile, such an association still persisted (Q2 versus [vs] Q1, HR 0.65 [95% CI 0.46–0.94]; P = 0.0201). However, in adjusted models 1 and 2, the AST/ALT ratio and ASL/ALT ratio quartiles were not associated with a decreased HR for the occurrence of T2DM (P > 0.05).
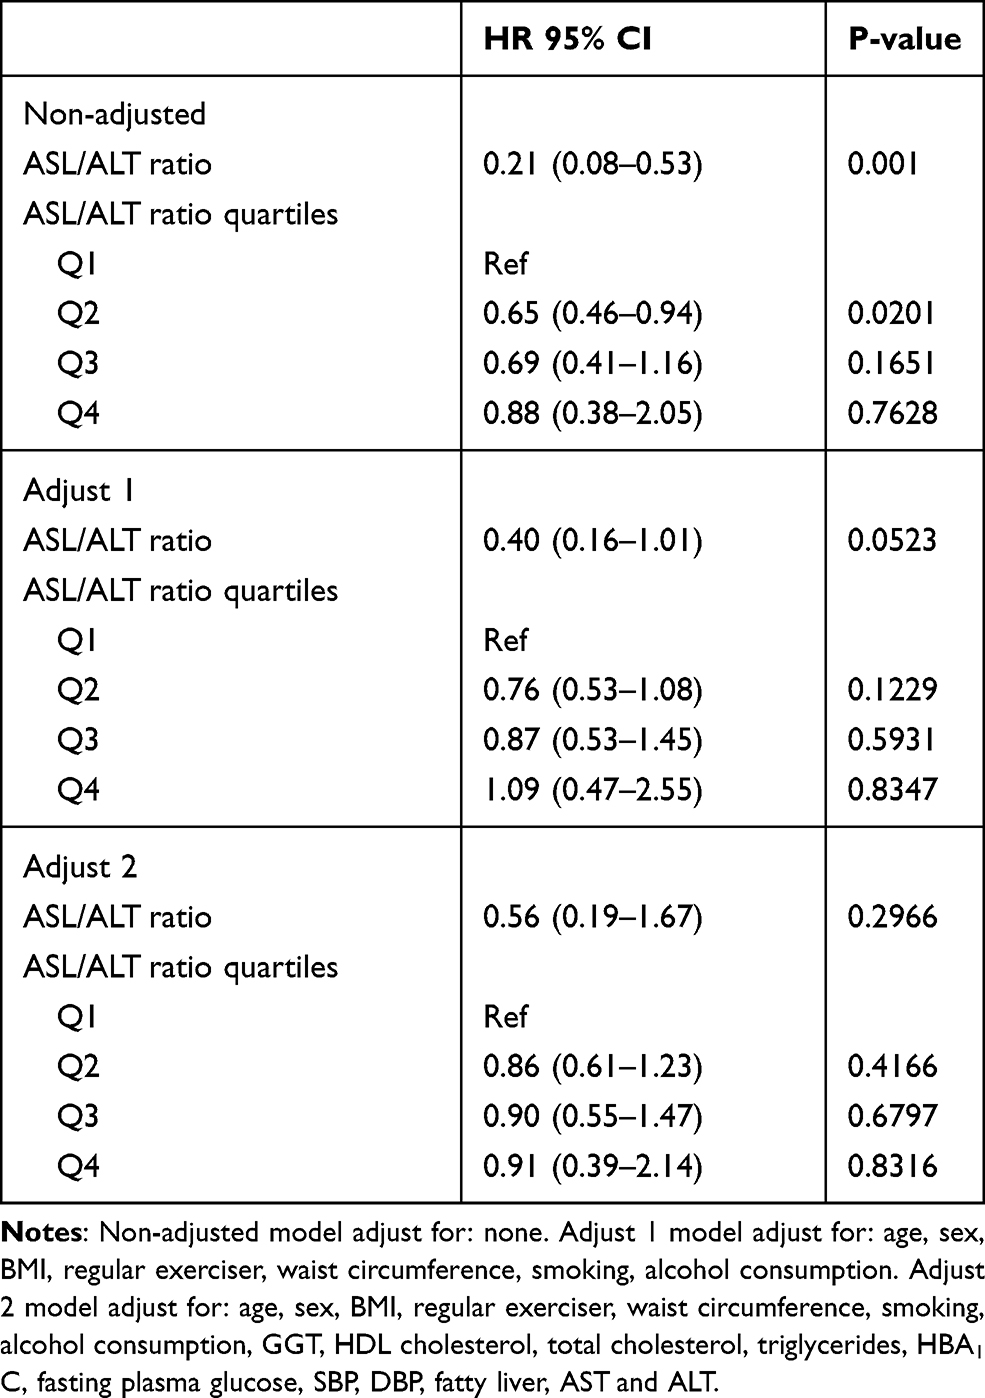 |
Table 2 The Unadjusted and Adjusted Association Between ASL/ALT Ratio and the Incidence of T2DM During Follow-Up |
Threshold Effect Analysis
Threshold effect analysis was used to determine the linear/nonlinear relationship between the ASL/ALT ratio and the occurrence of T2DM. The threshold level was computed using trial and error. Next, we performed a log-likelihood ratio test comparing the one-line linear regression model with a two-piecewise linear model and measured the before and after HRs. Then, the bootstrap resampling method was applied to identify the 95% credible interval of the threshold.
Threshold effect analysis revealed that the ASL/ALT ratio inflection point value was 0.93 (Figure 3). There were nonlinear relationships between the AST/ALT ratio and the occurrence of T2DM (Pfor nonlinear = 0.023). When the AST/ALT ratio was <0.93, the risk for T2DM decreased sharply with the AST/ALT ratio in the unadjusted model (odds ratio [OR] 0.05 [95% CI 0.02–0.11]; P < 0.0001). The correlation between AST/ALT ratio ≤0.93 and the probability of T2DM tended to be more stable in adjusted model 1 (adjusted for age, sex, BMI, regular exercise, WC, smoking, and alcohol consumption: OR 0.12 [95% CI 0.05–0.31; P < 0.0001]) and in adjusted model 2 (adjusted for age, sex, BMI, regular exercise, WC, smoking, alcohol consumption, GGT, HDL-c, total cholesterol, triglycerides, HBA1C, fasting plasma glucose, SBP, DBP, fatty liver, AST, and ALT: OR 0.14 [95% CI 0.02–0.90; P = 0.0385]). However, when the ASL/ALT ratio was >0.93, the probability of T2DM was not statistically significant in any model (P > 0.05) (Table 3).
 |
Table 3 Threshold Effect Analysis of ASL/ALT Ratio on the Incidence of T2DM During Follow-up Using Piece-wise Linear Regression |
 |
Figure 3 Association of ASL/ALT ratio with the occurrence of T2DM performed by restricted cubic spline analysis. |
Sensitivity Analyses Using E-Value
The E-value is an alternative method to sensitivity analyses for unmeasured confounding in observational studies. In this study, E-value sensitivity analysis was performed to measure the robustness of the association to unmeasured confounding factors. The potential for unmeasured confounding between the ASL/ALT ratio and the occurrence of T2DM was explored by calculating E-values. The E-value for the association between ASL/ALT ratio and the occurrence of T2DM was 13.77 (lower limit of its 95% CI, 1.46). For unmeasured confounders associated with ASL/ALT ratio and T2DM during follow-up, the E-value equation yielded an E value of 13.77 (Figure 4). This result could be interpreted as an unmeasured confounder that was associated with both the ASL/ALT ratio and T2DM incidence with an HR of 13.77-fold each, above and beyond the measured confounders; in contrast, weaker confounding would not do so. E-value analysis suggested robustness to unmeasured confounding factors.
 |
Figure 4 E-value for the lower 95% CI and point estimate in the occurrence of T2DM. |
Discussion
In this large prospective cohort study based on a sample of the Japanese population, we found that the AST/ALT ratio was associated with a lower incidence of T2DM in a nonlinear pattern. We further revealed a threshold effect based on the AST/ALT ratio. To the best of our knowledge, this is the first study to provide clear evidence of a nonlinear association between AST/ALT ratio and the occurrence of T2DM. The threshold AST/ALT ratio for developing T2DM was 0.93. When the AST/ALT ratio was below the inflection point (ie, 0.93), the HR for T2DM decreased with an increase in AST/ALT.
Clinically, AST and ALT have been used as biochemical markers for liver damage, given that they are released from hepatocytes in response to cellular damage; nevertheless, their function in carbohydrate and protein metabolism positions them as a potential measure of insulin resistance.14 In insulin resistance, cells cannot respond to insulin properly, leading to lower cellular glucose uptake and transposition to produce glucose via gluconeogenesis. In such a catabolic state, AST and ALT are responsible for transferring amino acid groups to produce essential intermediate products in the gluconeogenesis pathway, thus preparing the body with a source of glucose under insulin resistance conditions.15,16 Therefore, it is reasonable that disorders in glucose metabolism, such as insulin resistance, are strongly related to liver enzyme abnormalities. However, the relationship between AST/ALT ratio and insulin resistance is contradictory. Increased ALT level and low AST/ALT ratios have been reported to be associated with insulin resistance.17–19 However, several previous studies have demonstrated an inverse association between the AST/ALT ratio and the risk of insulin resistance, CVD, and NAFLD.20–24 These studies, however, adopted wide ranges of ALT and AST levels, which may not have captured all individuals with subclinical liver disease. Metabolic syndrome refers to the composition of multiple cardiovascular risk factors, including hyperglycemia, obesity, high blood pressure, hypertriglyceridemia, and low HDL-c levels.25 In addition to these well-known metabolic syndrome components, hyperuricemia and NAFLD have also been identified as non-traditional components.26 Previous studies have confirmed that metabolic syndrome increases the risk of T2DM and CVD.27,28 The ALT/AST ratio has been described as a surrogate measure of insulin resistance and hyperinsulinemia.26 The reduced ALT/AST ratio is strongly suggestive of non-alcoholic steatohepatitis.9 Recent studies have announced that an increased AST/ALT ratio is inversely associated with the future development of metabolic syndrome.8,24,29 Therefore, it is reasonable to assume that AST/ALT is inversely associated with the occurrence of T2DM when the AST/ALT ratio was <0.93.
The exact mechanism of the link between AST/ALT ratio and DM remains unclear; however, there are several possible explanations. NAFLD is strongly associated with insulin resistance. In a previous animal NAFLD model, the ability of insulin to inhibit hepatic glucose production was weakened, even if there was no obvious change in weight and muscle insulin resistance.30 AST and ALT have been widely used as noninvasive surrogate markers of liver damage in numerous epidemiological studies. Some studies have proposed a potential mechanism for the association between AST/ALT ratio and metabolic syndrome involving elevated hepatic fat content,31 which adversely affects every component of the metabolic syndrome. Another possible mechanism may involve an inflammatory effect in the liver that impairs insulin signaling, resulting in failure to inhibit glucose production and, eventually, the development of hyperglycemia.32 ALT is the liver enzyme most reflective of liver fat accumulation, and has been used as an indicator of NAFLD.33 Previous evidence has demonstrated that NAFLD is closely associated with an approximately two-fold higher risk for developing T2DM, regardless of obesity and other conventional metabolic risk factors.34
A recent cross-sectional study of the National Health and Nutrition Examination Survey (NHANES), 2011–2016, found an inverse association between the AST/ALT ratio and insulin resistance in a representative sample of the United States population with healthy-range ALT levels and the absence of other evidence of liver dysfunction, especially in those with elevated BMI.19 Furthermore, a higher AST/ALT ratio (comparing the fourth quartile to the first quartile of the AST/ALT ratio) was correlated with a consistent reduction in the onset of metabolic syndrome and demonstrated incremental predictive value for incident metabolic syndrome.24 Moreover, the AST/ALT ratio has been confirmed to be associated with the occurrence and progression of multiple diseases. In a longitudinal cohort study, including 3494 community-checked individuals with a high AST/ALT ratio, AST/ALT ratio was an independent predictor of cardiovascular and all-cause mortality.35 The AST/ALT ratio at discharge may indicate malnutrition, frailty, or cachexia, and be associated with adverse clinical outcomes in individuals with acute heart failure. An investigation of the relationship between AST/ALT and all-cause and cardiovascular mortality in individuals with T2DM revealed that AST/ALT ratio was associated with an 83% increased risk for all-cause death and a 160% increased risk for CVD mortality.36 The AST/ALT ratio is a widely used liver fibrosis marker and is an established predictive marker of liver fibrosis severity in patients with liver disease.37 Therefore, these findings, together with our findings, indicate that the AST/ALT ratio not only reflects liver damage but also systemic disorders.
A possible mechanism for the association between AST/ALT ratio and T2DM has not been established; however, there are several possible explanations. It has been reported that an inflammatory effect in the liver weakens insulin signaling, resulting in a failure to inhibit glucose production and eventually hyperglycemia.24,32 In patients with systemic insulin resistance, tissues such as the liver are especially affected since insulin plays a significant role in regulation and metabolism.38 When insulin-resistant tissues fail to accelerate glucose uptake, extra glucose returns to the liver, where it may suppress gluconeogenesis and boost lipogenesis.15,38,39 This leads to fatty accumulation, inflammation-related distortion, and injury to the liver architecture, increasing.40 This is consistent with the threshold value (ie, 0.93) found in our study.
An important potential source of bias in observational epidemiology analysis is residual confounding. The higher the E-value, the stronger the confounder association must be to explain the exposure and outcome away. We used E-value sensitivity analysis to quantify the potential implications of unmeasured confounders and revealed that an unmeasured confounder was unlikely to explain the entire ASL/ALT ratio. Thus, calculating the E value supports the robustness of the main findings.
However, there were potential limitations to this study. First, owing to the nature of secondary analysis of a retrospective cohort, some important variables were not available, such as family history of DM and education. Second, the study only included Japanese patients; as such, the results may not be generalizable to other ethnic groups. Third, because laboratory data were obtained only at the initial examination, ALT and AST levels and fluctuation of other covariates could have changed over time. Moreover, according to the Japanese criteria, a high HbA1c level (≥6.5%) alone is not sufficient for the diagnosis of T2DM. In epidemiological studies, however, “diabetes mellitus” can be substituted for the determination of diabetes type from a single examination.41
Conclusion
AST/ALT ratio was associated with a lower incidence of T2DM in a nonlinear pattern. The threshold AST/ALT ratio for the development of T2DM was 0.93. AST/ALT levels were inversely correlated with the occurrence of T2DM when the AST/ALT ratio was <0.93.
Data Sharing Statement
All data used are available at http://www.Datadryad.org/, which allows authors to freely download.
Ethics Approval and Consent to Participate
Informed consent is not essential as the data were all obtained from a public database, which was deemed exempt from review by the Ethics Committee of the Xidian Group Hospital. The authors are accountable for all aspects of the work in ensuring that questions related to the accuracy or integrity of any part of the work are appropriately investigated and resolved.
Acknowledgments
The authors thank the Dryad Digital Repository (https://datadryad.org/) provide the data for this study.
Disclosure
The authors report no conflicts of interest in this work.
References
1. Seid MA, Akalu Y, Gela YY, et al. Microvascular complications and its predictors among type 2 diabetes mellitus patients at Dessie town hospitals, Ethiopia. Diabetol Metab Syndr. 2021;13(1):86. doi:10.1186/s13098-021-00704-w
2. Holman N, Young B, Gadsby R. Current prevalence of type 1 and type 2 diabetes in adults and children in the UK. Diabet Med. 2015;32(9):1119–1120. doi:10.1111/dme.12791
3. Mauricio D, Alonso N, Gratacòs M. Chronic diabetes complications: the need to move beyond classical concepts. Trends Endocrinol Metab. 2020;31(4):287–295. doi:10.1016/j.tem.2020.01.007
4. Meigs JB. Multiple biomarker prediction of type 2 diabetes. Diabetes Care. 2009;32(7):1346–1348. doi:10.2337/dc09-0754
5. Sookoian S, Pirola CJ. Liver enzymes, metabolomics and genome-wide association studies: from systems biology to the personalized medicine. World J Gastroenterol. 2015;21(3):711–725. doi:10.3748/wjg.v21.i3.711
6. De Ritis F, Coltorti M, Giusti G. An enzymic test for the diagnosis of viral hepatitis; the transaminase serum activities. Clin Chim Acta. 1957;2(1):70–74. doi:10.1016/0009-8981(57)90027-x
7. Weng SF, Kai J, Guha IN, Qureshi N. The value of aspartate aminotransferase and alanine aminotransferase in cardiovascular disease risk assessment. Open Heart. 2015;2(1):e000272. doi:10.1136/openhrt-2015-000272
8. Lee K, Yang JH. Which liver enzymes are better indicators of metabolic syndrome in adolescents: the Fifth Korea National Health and Nutrition Examination Survey, 2010. Metab Syndr Relat Disord. 2013;11(4):229–235. doi:10.1089/met.2012.0153
9. Sorbi D, Boynton J, Lindor KD. The ratio of aspartate aminotransferase to alanine aminotransferase: potential value in differentiating nonalcoholic steatohepatitis from alcoholic liver disease. Am J Gastroenterol. 1999;94(4):1018–1022. doi:10.1111/j.1572-0241.1999.01006.x
10. Cortez-Pinto H, Camilo ME, Baptista A, De Oliveira AG, De Moura MC. Non-alcoholic fatty liver: another feature of the metabolic syndrome? Clin Nutr. 1999;18(6):353–358. doi:10.1016/s0261-5614(99)80015-6
11. Okamura T, Hashimoto Y, Hamaguchi M, Obora A, Kojima T, Fukui M. Ectopic fat obesity presents the greatest risk for incident type 2 diabetes: a population-based longitudinal study. Int J Obes (Lond). 2019;43(1):139–148. doi:10.1038/s41366-018-0076-3
12. Hamaguchi M, Kojima T, Itoh Y, et al. The severity of ultrasonographic findings in nonalcoholic fatty liver disease reflects the metabolic syndrome and visceral fat accumulation. Am J Gastroenterol. 2007;102(12):2708–2715. doi:10.1111/j.1572-0241.2007.01526.x
13. VanderWeele TJ, Ding P. Sensitivity analysis in observational research: introducing the E-value. Ann Intern Med. 2017;167(4):268–274. doi:10.7326/m16-2607
14. Huang X-J, Choi Y-K, Im H-S, Yarimaga O, Yoon E, Kim H-S. Aspartate aminotransferase (AST/GOT) and alanine aminotransferase (ALT/GPT) detection techniques. Sensors. 2006;6(7):756–782.
15. Han HS, Kang G, Kim JS, Choi BH, Koo SH. Regulation of glucose metabolism from a liver-centric perspective. Exp Mol Med. 2016;48(3):e218. doi:10.1038/emm.2015.122
16. Adeva-Andany MM, Pérez-Felpete N, Fernández-Fernández C, Donapetry-García C, Pazos-García C. Liver glucose metabolism in humans. Biosci Rep. 2016;36(6). doi:10.1042/bsr20160385
17. Simental-Mendía LE, Rodríguez-Morán M, Gómez-Díaz R, Wacher NH, Rodríguez-Hernández H, Guerrero-Romero F. Insulin resistance is associated with elevated transaminases and low aspartate aminotransferase/alanine aminotransferase ratio in young adults with normal weight. Eur J Gastroenterol Hepatol. 2017;29(4):435–440. doi:10.1097/meg.0000000000000811
18. Hanley AJ, Wagenknecht LE, Festa A, D’Agostino RB, Haffner SM. Alanine aminotransferase and directly measured insulin sensitivity in a multiethnic cohort: the Insulin Resistance Atherosclerosis Study. Diabetes Care. 2007;30(7):1819–1827. doi:10.2337/dc07-0086
19. Visaria A, Pai S, Cheung M, Ahlawat S. Association between aspartate aminotransferase-to-alanine aminotransferase ratio and insulin resistance among US adults. Eur J Gastroenterol Hepatol. 2021;Publish Ahead of Print. doi:10.1097/meg.0000000000002215.
20. Homsanit M, Sanguankeo A, Upala S, Udol K. Abnormal liver enzymes in Thai patients with metabolic syndromes. J Med Assoc Thai. 2012;95(3):444–451.
21. Lin S, Tang L, Jiang R, Chen Y. The relationship between aspartate aminotransferase to alanine aminotransferase ratio and metabolic syndrome in adolescents in Northeast China. Diabetes Metabol Syndr Obes: Targets Ther. 2019;12:2387–2394. doi:10.2147/dmso.s217127
22. Zhao L, Cheng J, Chen Y, et al. Serum alanine aminotransferase/aspartate aminotransferase ratio is one of the best markers of insulin resistance in the Chinese population. Nutr Metab (Lond). 2017;14:64. doi:10.1186/s12986-017-0219-x
23. Goessling W, Massaro JM, Vasan RS, D’Agostino RB, Ellison RC, Fox CS. Aminotransferase levels and 20-year risk of metabolic syndrome, diabetes, and cardiovascular disease. Gastroenterology. 2008;135(6):1935–44, 1944.e1. doi:10.1053/j.gastro.2008.09.018
24. Yadav D, Choi E. Incremental predictive value of serum AST-to-ALT ratio for incident metabolic syndrome: the ARIRANG study. PLoS One. 2016;11(8):e0161304. doi:10.1371/journal.pone.0161304
25. Grundy SM, Brewer HB, Cleeman JI, Smith SC, Lenfant C. Definition of metabolic syndrome: report of the National Heart, Lung, and Blood Institute/American Heart Association conference on scientific issues related to definition. Circulation. 2004;109(3):433–438. doi:10.1161/01.cir.0000111245.75752.c6
26. Marchesini G, Brizi M, Bianchi G, et al. Nonalcoholic fatty liver disease: a feature of the metabolic syndrome. Diabetes. 2001;50(8):1844–1850. doi:10.2337/diabetes.50.8.1844
27. Isomaa B, Almgren P, Tuomi T, et al. Cardiovascular morbidity and mortality associated with the metabolic syndrome. Diabetes Care. 2001;24(4):683–689. doi:10.2337/diacare.24.4.683
28. Lorenzo C, Okoloise M, Williams K, Stern MP, Haffner SM. The metabolic syndrome as predictor of type 2 diabetes: the San Antonio heart study. Diabetes Care. 2003;26(11):3153–3159. doi:10.2337/diacare.26.11.3153
29. Perera S, Lohsoonthorn V, Jiamjarasrangsi W, Lertmaharit S, Williams MA. Association between elevated liver enzymes and metabolic syndrome among Thai adults. Diabetes Metab Syndr. 2008;2(3):171–178. doi:10.1016/j.dsx.2008.04.012
30. Zhao L, Cang Z, Sun H, Nie X, Wang N, Lu Y. Berberine improves glucogenesis and lipid metabolism in nonalcoholic fatty liver disease. BMC Endocr Disord. 2017;17(1):13. doi:10.1186/s12902-017-0165-7
31. Browning JD, Szczepaniak LS, Dobbins R, et al. Prevalence of hepatic steatosis in an urban population in the United States: impact of ethnicity. Hepatology. 2004;40(6):1387–1395. doi:10.1002/hep.20466
32. Hsueh WA, Quiñones MJ. Role of endothelial dysfunction in insulin resistance. Am J Cardiol. 2003;92(4):10j–17j. doi:10.1016/s0002-9149(03)00611-8
33. Mahran HN, Saber LM, Alghaithy AA, Elareefy AA. The role of elevated alanine aminotransferase (ALT), FasL and atherogenic dyslipidemia in type II diabetes mellitus. J Taibah Univ Med Sci. 2017;12(1):8–13. doi:10.1016/j.jtumed.2016.10.002
34. Targher G, Corey KE, Byrne CD, Roden M. The complex link between NAFLD and type 2 diabetes mellitus–mechanisms and treatments. Nat Rev Gastroenterol Hepatol. 2021;18(9):599–612. doi:10.1038/s41575-021-00448-y
35. Feng X, Wen Y, Peng FF, Wang N, Zhan X, Wu: X. Association between aminotransferase/alanine aminotransferase ratio and cardiovascular disease mortality in patients on peritoneal dialysis: a multi-center retrospective study. BMC Nephrol. 2020;21(1):209. doi:10.1186/s12882-020-01840-7
36. Zoppini G, Cacciatori V, Negri C, et al. The aspartate aminotransferase-to-alanine aminotransferase ratio predicts all-cause and cardiovascular mortality in patients with type 2 diabetes. Medicine (Baltimore). 2016;95(43):e4821. doi:10.1097/md.0000000000004821
37. McPherson S, Stewart SF, Henderson E, Burt AD, Day CP. Simple non-invasive fibrosis scoring systems can reliably exclude advanced fibrosis in patients with non-alcoholic fatty liver disease. Gut. 2010;59(9):1265–1269. doi:10.1136/gut.2010.216077
38. Abel ED, O’Shea KM, Ramasamy R. Insulin resistance: metabolic mechanisms and consequences in the heart. Arterioscler Thromb Vasc Biol. 2012;32(9):2068–2076. doi:10.1161/atvbaha.111.241984
39. Kahn BB, Flier JS. Obesity and insulin resistance. J Clin Invest. 2000;106(4):473–481. doi:10.1172/jci10842
40. Ye J. Mechanisms of insulin resistance in obesity. Front Med. 2013;7(1):14–24. doi:10.1007/s11684-013-0262-6
41. Seino Y, Nanjo K, Tajima N, et al. Report of the committee on the classification and diagnostic criteria of diabetes mellitus. J Diabetes Investig. 2010;1(5):212–228. doi:10.1111/j.2040-1124.2010.00074.x
 © 2021 The Author(s). This work is published and licensed by Dove Medical Press Limited. The full terms of this license are available at https://www.dovepress.com/terms.php and incorporate the Creative Commons Attribution - Non Commercial (unported, v3.0) License.
By accessing the work you hereby accept the Terms. Non-commercial uses of the work are permitted without any further permission from Dove Medical Press Limited, provided the work is properly attributed. For permission for commercial use of this work, please see paragraphs 4.2 and 5 of our Terms.
© 2021 The Author(s). This work is published and licensed by Dove Medical Press Limited. The full terms of this license are available at https://www.dovepress.com/terms.php and incorporate the Creative Commons Attribution - Non Commercial (unported, v3.0) License.
By accessing the work you hereby accept the Terms. Non-commercial uses of the work are permitted without any further permission from Dove Medical Press Limited, provided the work is properly attributed. For permission for commercial use of this work, please see paragraphs 4.2 and 5 of our Terms.