Back to Journals » Journal of Hepatocellular Carcinoma » Volume 9
Noninvasive Imaging Evaluation Based on Computed Tomography of the Efficacy of Initial Transarterial Chemoembolization to Predict Outcome in Patients with Hepatocellular Carcinoma
Authors Dai Y, Jiang H, Feng ST, Xia Y, Li J, Zhao S, Wang D, Zeng X, Chen Y, Xin Y, Liu D
Received 1 December 2021
Accepted for publication 18 March 2022
Published 5 April 2022 Volume 2022:9 Pages 273—288
DOI https://doi.org/10.2147/JHC.S351077
Checked for plagiarism Yes
Review by Single anonymous peer review
Peer reviewer comments 3
Editor who approved publication: Professor Tim Meyer
Yanmei Dai,1 Huijie Jiang,1 Shi-Ting Feng,2 Yuwei Xia,3 Jinping Li,1 Sheng Zhao,1 Dandan Wang,1 Xu Zeng,1 Yusi Chen,1 Yanjie Xin,1 Dongmin Liu1
1Department of Radiology, The Second Affiliated Hospital of Harbin Medical University, Harbin, Heilongjiang Province, 150086, People’s Republic of China; 2Department of Radiology, The First Affiliated Hospital, Sun Yat-sen University, Guangzhou, Guangdong Province, 510030, People’s Republic of China; 3Huiying Medical Technology Co., Ltd, Beijing City, 100192, People’s Republic of China
Correspondence: Huijie Jiang; Shi-Ting Feng, Tel +86 86605576, Email [email protected]; [email protected]
Purpose: This study aims to develop a new model to more comprehensively and accurately predict the survival of patients with HCC after initial TACE.
Patients and Methods: The whole cohort (n = 102) was randomly divided into a training cohort and a validation cohort in the ratio of 8:2. The optimal radiomics signatures were screened using the least absolute shrinkage and selection operator algorithm (LASSO) regression for constructing the radscore to predict overall survival (OS). The C-index (95% confidence interval, CI), calibration curve, and decision curve analysis (DCA) were used to evaluate the performance of the models. The independent risk factors (hazard ratio, HR) for predicting OS were stratified by Kaplan–Meier (K-M) analysis and the Log rank test.
Results: The median OS was 439 days (95% CI: 215.795– 662.205) in whole cohort, and in the training cohort and validation cohort, the median OS was 552 days (95% CI: 171.172– 932.828), 395 days (95% CI: 309.415– 480.585), respectively (P = 0.889). After multivariate cox regression, the combined radscore-clinical model was consisted of radscore (HR: 2.065, 95% CI: 1.285– 3.316; P = 0.0029) and post-response (HR: 1.880, 95% CI: 1.310– 2.697; P = 0.0007), both of which were independent risk factors for the OS. In the validation cohort, the efficacy of both the radscore (C-index: 0.769, 95% CI: 0.496– 1.000) and combined model (C-index: 0.770, 95% CI: 0.581– 0.806) were higher than that of the clinical model (C-index: 0.655, 95% CI: 0.508– 0.802). The calibration curve of the combined model for predicting OS presented good consistency between observations and predictions in both the training cohort and validation cohort.
Conclusion: Noninvasive imaging has a good prediction performance of survival after initial TACE in patients with HCC. The combined model consisting of post-response and radscore may be able to better predict outcome.
Keywords: computed tomography, hepatocellular carcinoma, overall survival, radiomics, transarterial chemoembolization
Graphical Abstract:

Introduction
Hepatocellular carcinoma (HCC) is one of the most common malignant tumors with high morbidity and mortality.1 Major risk factors for HCC include chronic alcohol consumption, diabetes, and hepatitis B or C virus infection.2 HCC was divided into five stages in Barcelona Clinic Liver Cancer (BCLC) staging system depending on disease extension, liver function, and performance status: very early stage (BCLC 0), early-stage (BCLC A), intermediate stage (BCLC B), advanced stage (BCLC C), and terminal stage (BCLC D).2 In terms of BCLC stage 0 and stage A, surgical therapies are preferred, supplemented by locoregional therapies. In terms of BCLC stage B, locoregional therapies are adopted preferentially, and the combination of other treatments or switching to systemic therapy will be applied when there are ineffective or resistant;3 as for BCLC stage C and stage D, systemic therapy and best supportive care are recommended, respectively. Individualized treatment is often chosen according to BCLC stages and the personal experience of doctors. The American Association for the Study of Liver Diseases (AASLD) guidelines state that transarterial chemoembolization (TACE) is the only recommended standard treatment for patients of HCC with BCLC stage B or intermediate stage.4 TACE can induce tumor ischemic necrosis via embolizing the supply artery of the tumor, and cause cytotoxicity in the tumor tissue at the same time,5 so as to prolong the overall survival of patients to a certain extent.
In recent years, the development and application of radiomics in the liver have become more widespread and in-depth, such as lesion segmentation, microvascular invasion, diagnosis tumor grade, classification, treatment planification, prognosis assessment, et al.6 In particular, radiomics are increasingly used for response assessment and survival prediction after locoregional therapies in patients with HCC, commonly based on computed tomography (CT) and magnetic resonance (MR), to build predictive models using preoperative noninvasive markers and to stratify the risk of disease, which can be of great advantage in guiding clinical treatment and benefiting patients.7–9 However, these previous studies were limited to the analysis of preoperative variables without clinical characteristics after TACE or postoperative radiological response, and the accuracy and completeness of their prediction remain a controversial issue. Han et al10 suggested that the response after the therapy may be helpful in survival prediction.
Through constructing survival prediction models, patients who have the best benefit after TACE can be selected out, and the risk factors can also be identified. If patients without the better benefit predicted by the models, they will be recommended to transfer to other locoregional or systemic therapies. In our study, we aim to develop a new model to more comprehensively and accurately predict the survival of patients with HCC after TACE.
Patients and Methods
Patients
The ethics committee approval of the First Affiliated Hospital of Sun Yat-sen University was obtained for this study, and informed consent was waived due to the retrospective nature of this study. This unicentric retrospective study enrolled 102 patients with HCC who were initially treated with TACE from the First Affiliated Hospital of Sun Yat-sen University between January 2013 to December 2019. All patients were randomly divided into training and validation cohort in the ratio of 8:2. The inclusion criteria were: a) HCC was diagnosed by histological or noninvasive radiologic criteria;11 b) patients were received initial TACE; c) patients were accepted CT enhancement both in pre-TACE and post-TACE; d) patients underwent laboratory tests after initial TACE; e) after the initial TACE, repeat TACE or other local treatment was chosen depending on the patient’s condition and the clinician’s experience. The exclusion criteria were: a) patient has a history of other cancers in addition to HCC; b) patients received other invasive treatments in initial pre-TACE or post-TACE, such as radiofrequency ablation (RFA), surgery, radiotherapy, et al; c) poor quality of CT images that might affect analysis; d) patients had incomplete clinical and laboratory data. The detailed selection flow chart is shown in Figure 1.
 |
Figure 1 Flowchart of patients’ enrollment. |
Treatment Procedure and Follow-Up
The treatment included the conventional TACE and TACE with blank or drug-loaded microspheres. All procedures via a traditional femoral artery approach, with the introduction of a 5F catheter and then a 5F YASHIRO catheter. Under the guidance of the guidewire, selective catheterization was performed to the abdominal trunk, and high-pressure syringes were used for angiography. According to the angiographic findings, a 2.7F microcatheter was used to enter the tumor supply branch with super-selective intubation guided by the guidewire followed by injection of embolization drugs and chemotherapy drugs. The embolization drugs include mixed suspension (2 mL - 20 mL) both with lipiodol (2 mL - 20 mL) and epirubicin (20 mg - 40 mg) or microspheres (100 um - 300 um) followed by injection of 350–560um gelatin sponge, which volume of the emulsion was determined based on the tumor volume. The chemotherapy drugs include epirubicin (10 mg - 80 mg), raltitrexed (4 mg - 5 mg), irinotecan (240 mg), nedaplatin (40 mg), and oxaliplatin (200 mg - 400 mg). When the lipiodol deposition can be seen in the re-imaging and the blood supply to the tumor is obviously reduced, the operation is completed. The dose of embolization drugs and chemotherapeutic drugs was based on tumor burden and patients’ characteristics.
Contrast-enhanced CT was performed within 4–6 weeks after the operation to check the embolization of the tumor and determine whether there was complete necrosis or “viable tumor”.12 According to the modified Response Evaluation Criteria in Solid Tumors (mRECIST),13 the postoperative radiological responses of tumors were divided into four categories: complete response (CR), partial response (PR), stable disease (SD), and progressive disease (PD). Radiological responses were independently assessed by two radiologists with 5–10 years of experience and were blinded to clinical information. After the disease stabilized, patients were followed up with contrast-enhanced CT every 8–12 weeks. All included patients were followed up by telephone or medical record system for overall survival (OS). OS was defined as the time interval between initial TACE and death from a cause related to this study. Data from patients who were lost to follow-up or survived at the last follow-up (June 16, 2021) were considered censored data.
Image Acquisition and Segmentation
All patients underwent contrast-enhanced CT both pre-TACE and post-TACE using a 64-slice spiral CT scanner (Aquilion 64; Canon Medical Systems). The tube current is 250mA, the tube voltage is 120Kv; the layer thickness is 5mm, and all the thin layer reconstruction (1mm) is performed. The contrast agent (Ultravist, Bayer, Germany) was injected via a high-pressure syringe through the antecubital vein at a rate of 3.0 mL/s, while 40 mL of saline was injected at the same rate, and CT images of the arterial phase and venous phase were obtained at 35s and 65s, respectively.
Firstly, images of all patients were transmitted into the radiomics platform (Huiying Medical Technology Co., Ltd). Secondly, the outline of the region of interest (ROI) was chosen to be sketched on 1 mm thickness images on the arterial phase independently by two reviewers with more than 5 years of abdominal imaging experience, both of whom were blinded to the clinical and laboratory information. Thirdly, the ROI is outlined as close to the tumor margin as possible, excluding normal liver tissue, bile ducts, and larger blood vessels. The volume of interest (VOI) was attained after continuous outlining of ROI on all layers of the lesion, and the first and last layer sections were excluded due to the presence of partial volume effects. The detailed outline details are shown in Figure 2.
 |
Figure 2 Overview of radiomics analysis in this study. The volume of interest (VOI) was formed after region of interest (ROI) outlining on the arterial phase of CT enhancement. Features were extracted from the VOI and selected using least absolute shrinkage and selection operator (LASSO) regression. A combined radscore-clinical model was developed to predict overall survival (OS) in patients with hepatocellular carcinoma (HCC) after transarterial chemoembolization (TACE), and a Kaplan–Meier (K-M) stratification analysis of risk factors for predicting OS was performed. |
Radiomics Feature Extraction and Selection
To decrease the variability of radiomics features, the image data is normalized using a z-score. A total of 1409 quantitative radiomics features were extracted from the VOI. The first-order statistics comprised 18 features that reflected the quantitative depiction of the distribution of voxel intensity in CT images. The shape-based features comprised 14 features that reflected the shape and size of the region. The texture features comprised 24 gray level co-occurrence matrix features, 16 gray level run length matrix features, 16 gray level size zone matrix features, 5 neighboring gray tone difference matrix features, and 14 gray level dependent matrix features, which can quantify regional heterogeneity differences. Additionally, we applied higher-order filter features—logarithm, exponential, gradient, square, square root, local binary pattern (LBP), and wavelet filters—to images and then extracted first-order statistics and texture features based on the filtered image (1302 filter features). The interpretations of these radiomics features are displayed in the Pyradiomics file (Ver. 2.2.0) at https://pyradiomics.readthedocs.io/.
The inter-class correlation coefficient (ICC) was calculated for evaluation of the consistency of the ROI sketching by the two readers. Reader 1 and Reader 2 randomly selected the ROIs of 30 CT images from the whole cohort, and Reader 1 repeated these operations two weeks later. If a patient’s ICC value is greater than 0.8, the manual tracing is considered to be in good compliance, and subsequently, the images depicted by Reader1 will be used in the model construction. The intra-class correlation coefficient (ICC) was calculated to ensure the stability and reproducibility of each radiomic signature. When ICC is greater than 0.8 it indicated good consistency and reproducibility of feature extraction and is retained for further radiomics evaluation, while other features are excluded.
Construction of the Radiomics Signature
To prevent overfitting of the radiomics signature, we obtained the optimal radiomics features using the least absolute shrinkage and selection operator algorithm (LASSO) in the training cohort in Anaconda 3 platform (https://www.anaconda.com) with scikit-learn (https://scikit-learn.org/) and matplotlib packages (https://matplotlib.org/). Additionally, the Spearman correlation was used to evaluate the mutual correlation among the initially selected features. When the value is less than 0.9, it is considered that there is no correlation between the initially selected features.14 Then, the selected features with nonzero coefficients were applied to construct a radiomics signature. Each patient’s radiomics score (radscore) was calculated by a linear combination of selected features, weighted by their respective LASSO coefficients.
Statistical Analysis
Statistical tests were performed using SPSS (version 25.0, IBM) and R statistical software (version 3). Categorical variables were summarized as number (percent), and continuous variables were summarized as mean (standard deviation, Sd) or median (interquartile range, IQR) based on the underlying distribution of the data. The Chi-square test or Fisher’s exact test was used for categorical variables, and the t-test was used for continuous variables. Independent risk factors for predicting OS using univariate and multivariate cox regression analysis in the training cohort, including basic clinical characteristics, CT images features, and radscore. Then, nomograms for individualized prediction of survival probability were established based on the radscore, clinical model, and radscore-clinical (combined) model, respectively.
Harrell’s consistency index (C-index) was used to quantify the discriminatory performance of the models with values ranging from 0.5–1. When the value is 0.5, it means that the model has no predictive effect; when the value is 1, it means that the predicted results of the model are in perfect agreement with the observed results. The calibration curve was conducted to evaluate the consistency (goodness of fit) of the model between the actual and predicted mortality risks. The decision curve analysis (DCA) was performed to quantify the clinical utility of radiomic features from the training cohort and validation cohort to assess the ability of derived radiomic features. Survival curves were estimated using the Kaplan-Meier (K-M) method, and Log rank tests were used to compare. K-M analysis and Log rank test were used to stratify the different risk groups to assess disease progression, and hazard ratio (HR) and 95% confidence interval (CI) were used to measure patient survival differences. A two-sided P < 0.05 was considered that the differences were statistically significant.
Results
Patient Characteristics
A total of 102 patients with HCC were enrolled in our retrospective study (Figure 1). The mean age for the whole cohort was 54.88 ± 11.20 years, and males accounted for the majority (n = 91, 89.2%). Most patients were evaluated as BCLC-stage B (n = 58, 56.9%), and Child-Pugh class A (n = 76, 74.5%). The whole cohort was proportionally divided into a training cohort (n = 81) and a validation cohort (n = 21), and the mean age was 54.78 ± 11.43 years, 55.29 ± 10.85 years, respectively, and males accounted for the majority similarly (n = 71, 87.7%; n = 20, 95.2%, respectively). After statistical analysis, we found that the two cohorts were comparable in terms of basic clinical characteristics and CT images features (P > 0.05), except for etiology (P = 0.021). Details were shown in Table 1.
 |
Table 1 Characteristics of Patients in the Training and Validation Cohorts |
Feature Selection, and Radiomics Signature Building
Noninvasive imaging was used to identify features for characterizing the survival of patients with HCC treated with initial TACE. A total of 1409 features were extracted from the VOI of each patient, the 1248 features (88%) had satisfactory intra-observer and inter-observer reproducibility (ICC > 0.8). Subsequently, using the regularized regression with the penalty (α is denoted as the weight of penalty term), the number of features was reduced to 9 (Figure 3). The result of Spearman correlation showed that coefficients between these selected features were less than 0.9 (Figure S1). Finally, the radscore was constructed by the 9 wavelet features, including 2 first-order features, 1 GLCM feature, 1 GLRLM feature, and 5 GLSZM features (Table 2). The radscore was calculated using the following formula:
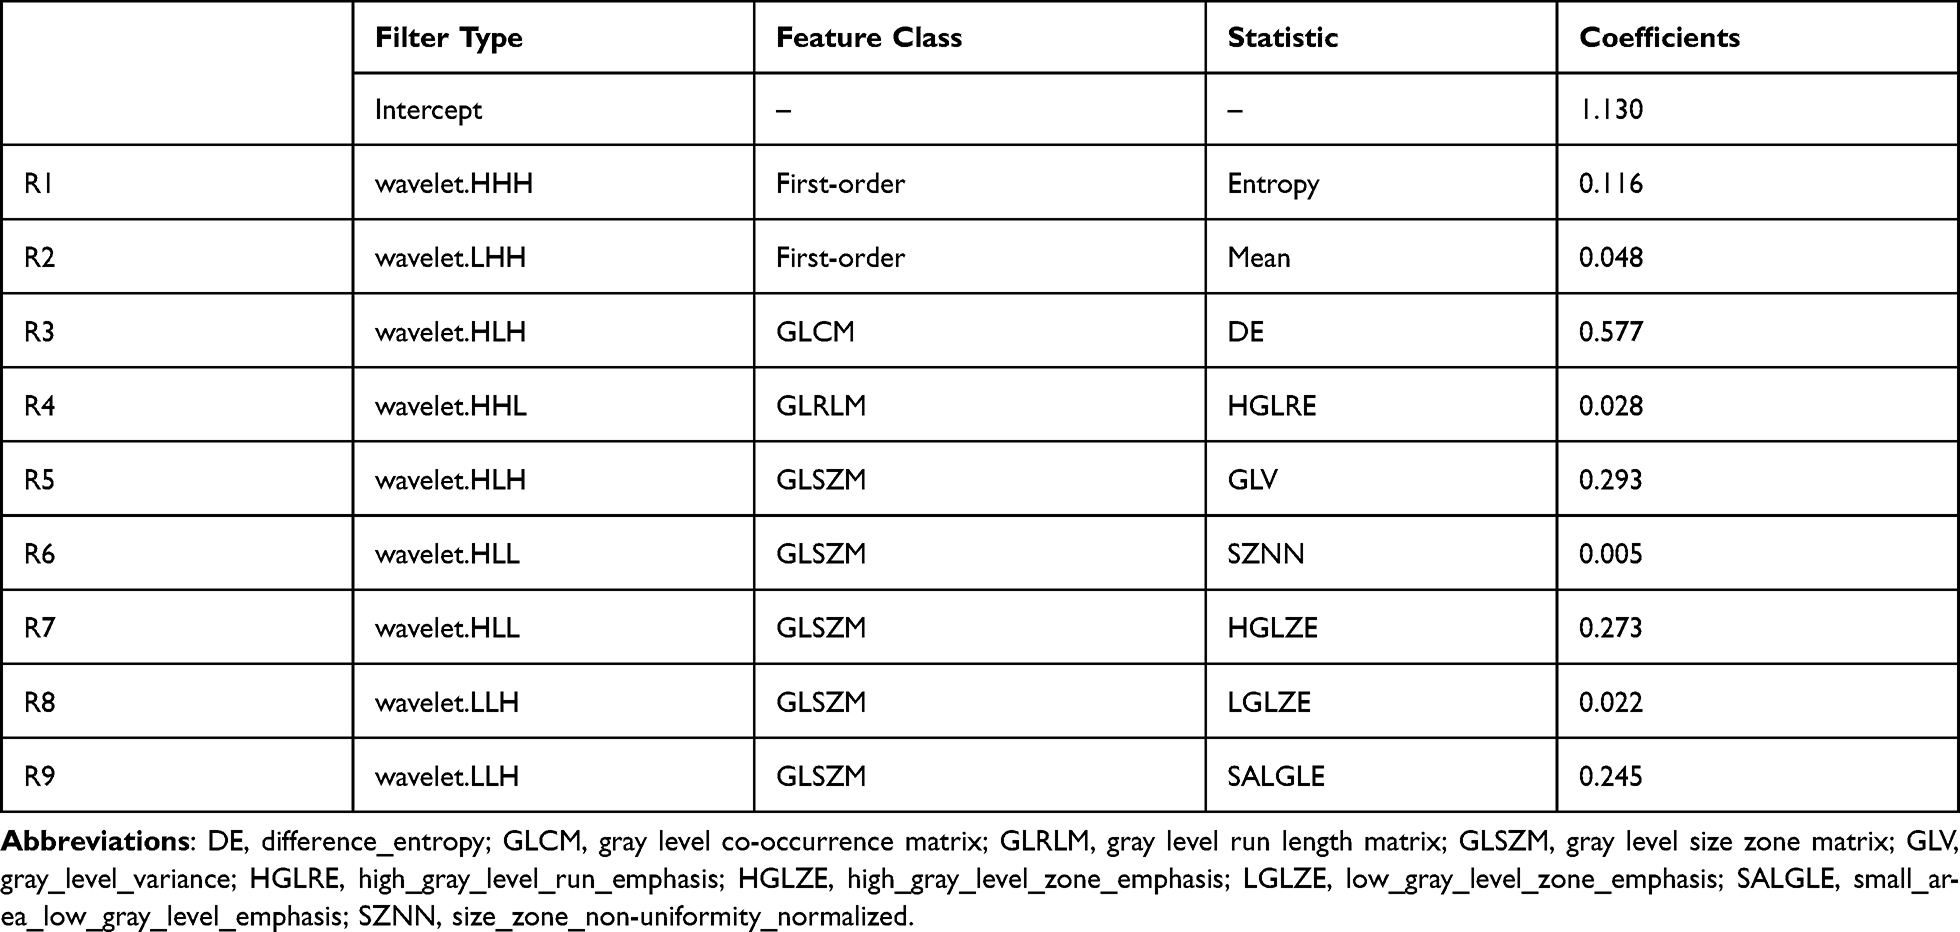 |
Table 2 Characteristics of Each Radiomics Feature Extracted and Corresponding Coefficients for Predicting Overall Survival (N = 102) |
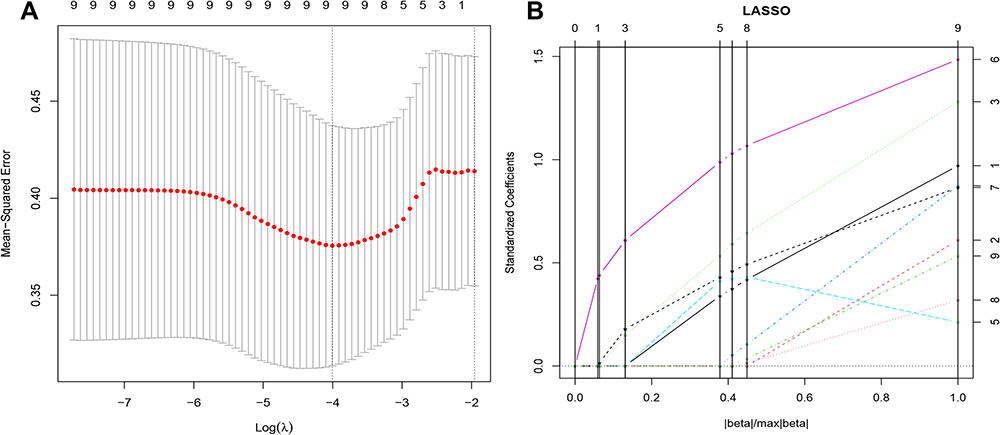 |
Figure 3 The results of least absolute shrinkage and selection operator (LASSO) regression. (A) Mean squared error (MSE) path. (B) Lasso path, 9 optimal radiomics features were selected to calculate the radscore. |
radscore = 1.130430763 + (wavelet.LHH_First-order_Mean × 0.047667017) + (wavelet.HLL_GLSZM_Size Zone Non-Uniformity Normalized × 0.004595354) + (wavelet.HLL_GLSZM_High Gray Level Zone Emphasis × 0.272802634) + (wavelet.LLH_GLSZM_Low Gray Level Zone Emphasis × 0.022080334) + (wavelet.LLH_GLSZM_Small Area Low Gray Level Emphasis × 0.244658219) + (wavelet.HLH_GLCM_Difference Entropy × 0.577169645) + (wavelet.HLH_GLSZM_Gray Level Variance × 0.292887147) + (wavelet.HHH_First-order_Entropy × 0.116398082) + (wavelet.HHL_GLRLM_High Gray Level Run Emphasis × 0.027502833).
Development and Validating of the Models in Survival Prediction
By univariate cox regression analysis, of all the baseline characteristics and radscore, 8 features were risk factors for predicting OS, including BCLC-stage, Child-Pugh class, longest diameter, pre-vascularization,15 pre-thrombus, pre-AFP, post-response, and radscore. Then, after multivariate cox regression analysis, we found that post-response (HR: 1.880, 95% CI: 1.310–2.697; P = 0.0007) and radscore (HR: 2.065, 95% CI: 1.285–3.316; P = 0.0029) were independent risk factors for predicting OS (Table 3). Subsequently, in the training cohort, according to the two independent risk factors, we built the radscore, clinical model, and combined model, respectively.
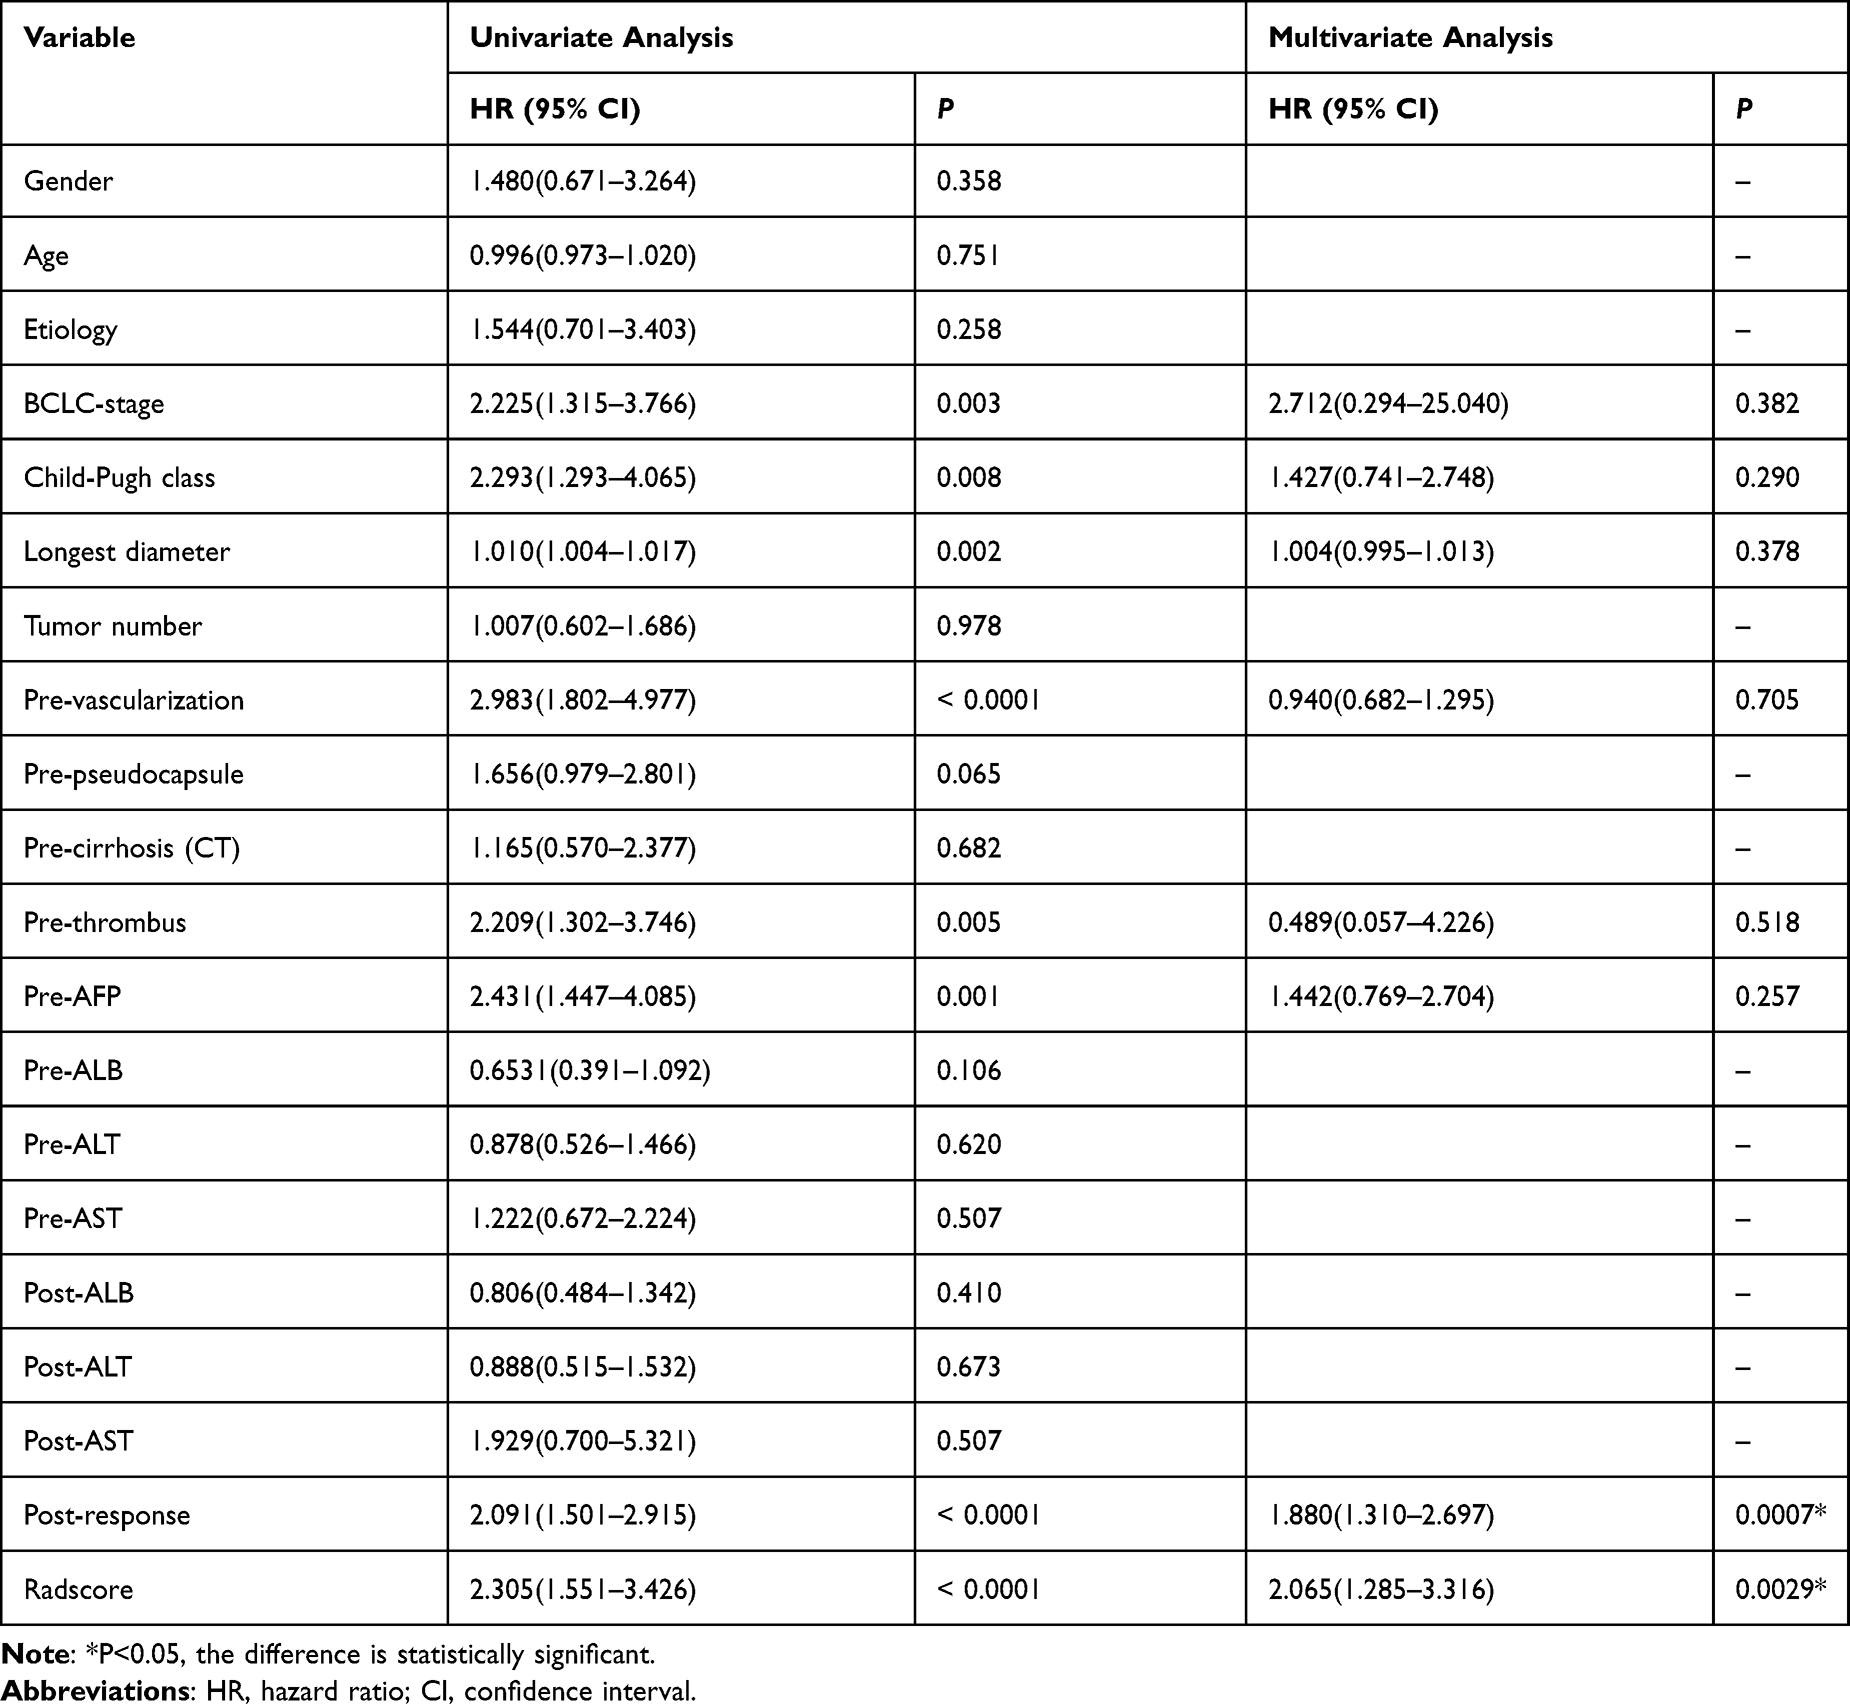 |
Table 3 Univariate and Multivariate Cox Regression Analysis for Predicting Overall Survival in Hepatocellular Carcinoma Treated by Transarterial Chemoembolization in the Training Cohort |
In the radscore and clinical model, the C-index was 0.834 (95% CI: 0.711–0.958), 0.694 (95% CI: 0.675–0.755), respectively, with the latter being significantly less effective than the radscore (Figure S2A and B). The efficacy of the combined model still showed a better result with a C-index of 0.806 (95% CI: 0.697–0.953) (Figure 4A), which was slightly lower than that of radscore. In the validation cohort, the results displayed that the efficacy of the radscore was also significantly higher than that of the clinical model, with a C-index of 0.769 (95% CI: 0.496–1.000), 0.655 (95% CI: 0.508–0.802), respectively. Notably, the efficacy of the combined model was higher than that of the radscore, with a C-index of 0.770 (95% CI: 0.581–0.806) (Table 4). The calibration curve of the combined model for predicting OS presented good consistency between observations and predictions in both the training and validation cohorts (Figure 4B and C). The DCA in the training cohort showed that the radscore and combined model had higher overall net benefit than the clinical model (Figure 5).
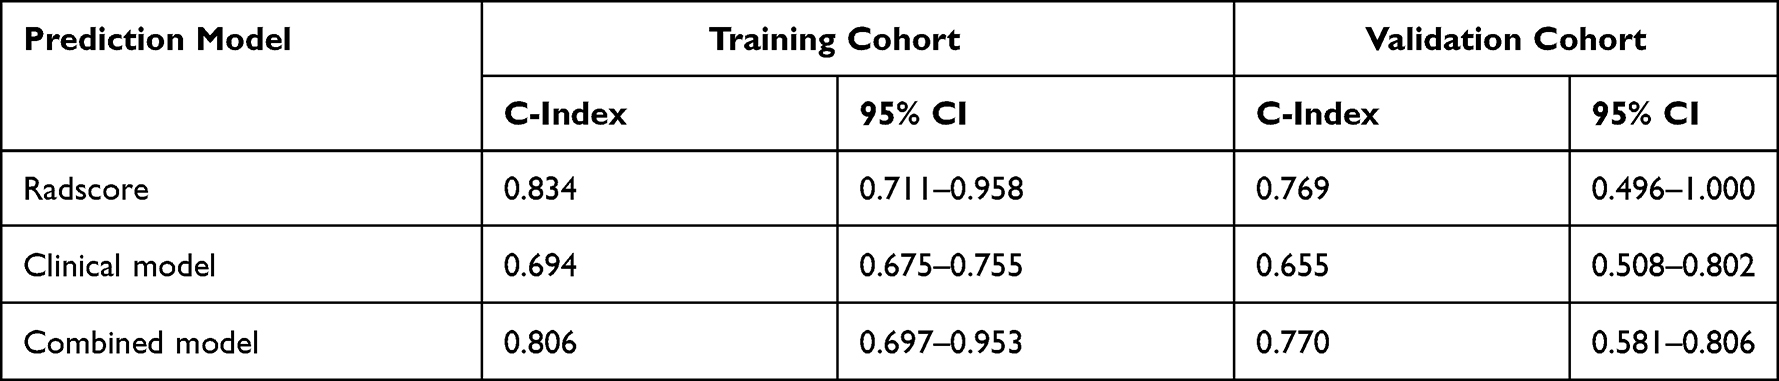 |
Table 4 Predictive Performance of the Survival Models |
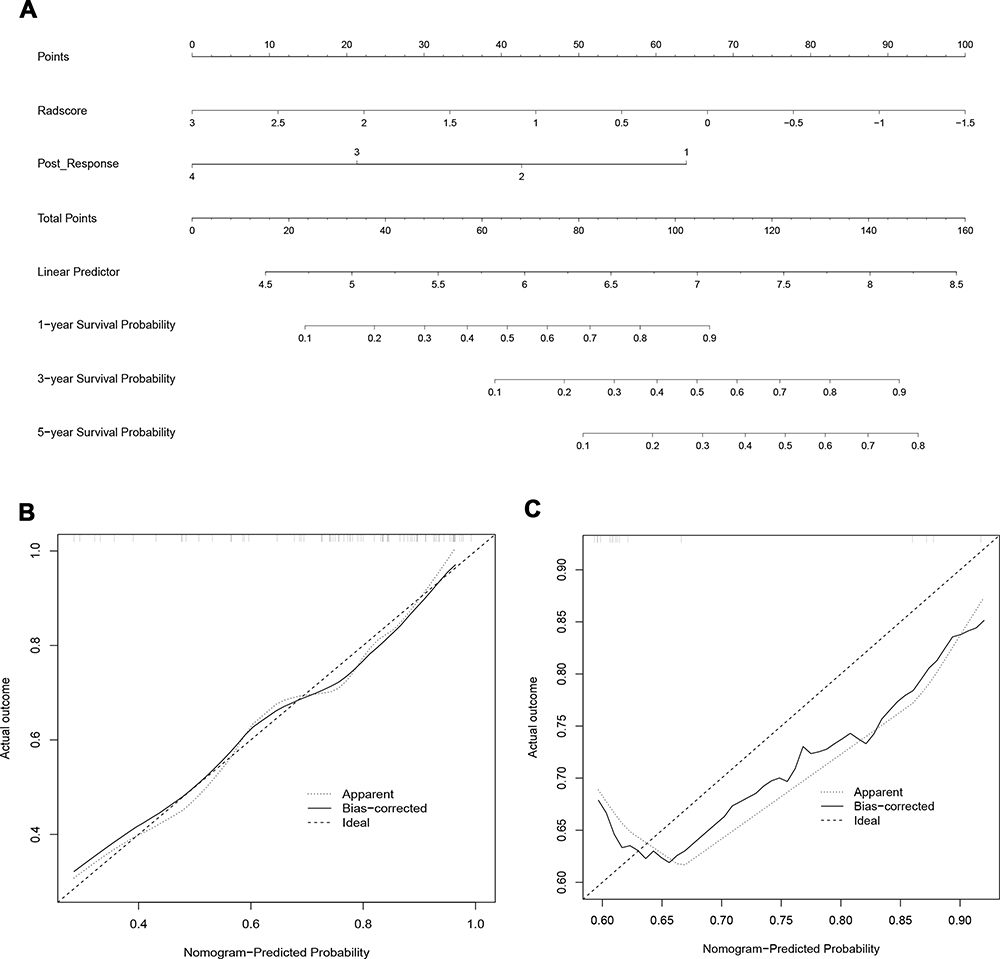 |
Figure 4 Development and validation of the model. (A) The nomogram of combined model for predicting overall survival (OS) was consisting of post-response (1= complete response, 2 = partial response, 3 = stable disease, 4 = progressive disease) and radscore, with a C-index of 0.806 (95% CI: 0.697–0.953) in the training cohort. The calibration curve demonstrating predictions from the model to the actual observed probability in the training cohort (B) and validation cohort (C). |
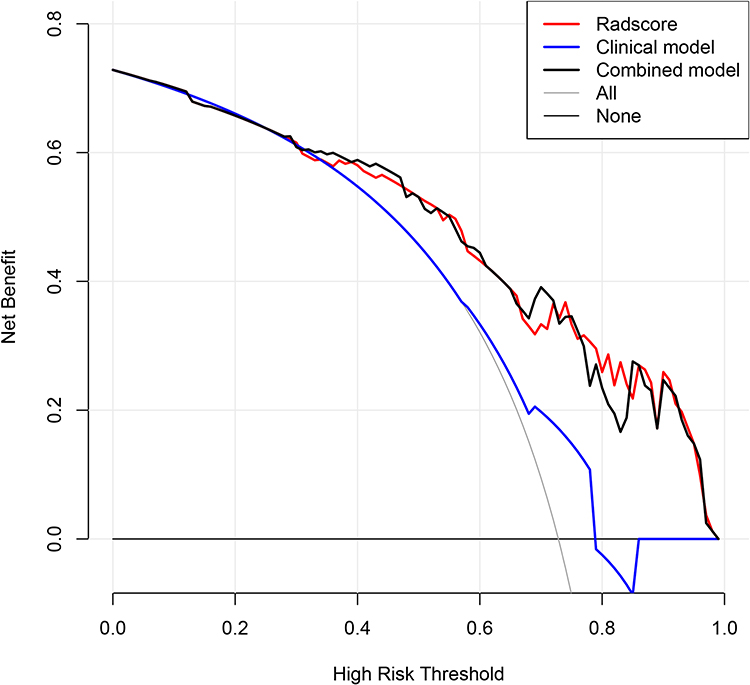 |
Figure 5 Decision curve analysis of the models. The net benefit of both the radscore and combined model are higher than that of clinical model. |
Survival Prediction
A total of 74 patients in our whole cohort had been completed follow-up for OS. In addition, left-censored data occurred in 12 cases due to transfer to another hospital, death from other causes, and loss to follow-up, and right-censored data occurred in 16 cases due to survival at the end of follow-up. The median OS was 439 days (95% CI: 215.795–662.205) in the whole cohort, and in the training cohort and validation cohort, the median OS was 552 days (95% CI: 171.172–932.828), 395 days (95% CI: 309.415–480.585), respectively (P = 0.889) (Figure 6A).
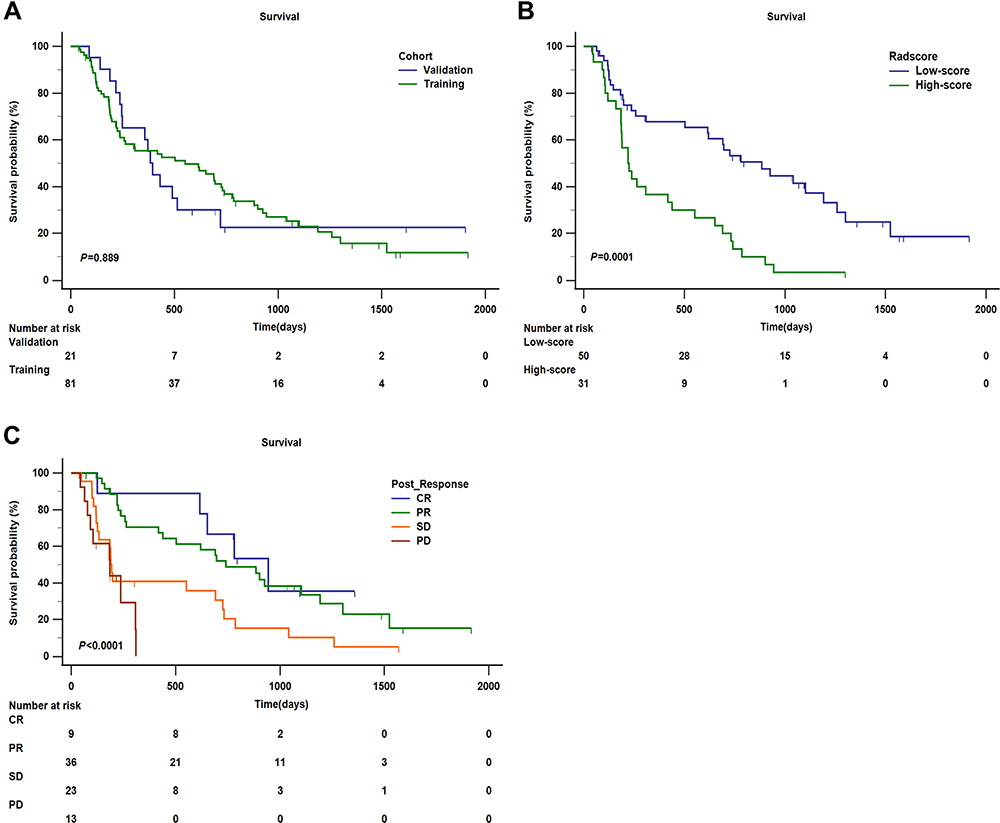 |
Figure 6 Kaplan–Meier analysis of overall survival (OS). (A) Kaplan–Meier analysis of OS between training cohort and validation cohort (P = 0.889). (B) Kaplan–Meier analysis of OS of radscore (low-score and high-score) divided by the cut-off value (1.36) in the training cohort (P = 0.0001). (C) Kaplan–Meier analysis of OS of post-response evaluated by mRECIST (CR, PR, SD, and PD) in the training cohort (P < 0.0001). |
Furthermore, we stratified two independent risk factors for predicting OS selected in the training cohort. To facilitate the analysis of clinical practice, we determined the cut-off value (1.36) of radscore by using maximally selected log-rank statistics and classified it as the low-score subgroup and high-score subgroup (Figure S3). In the training cohort, the median OS was 885 days (95% CI: 568.839–1201.161) in the low-score subgroup, and the median OS was 220 days (95% CI: 155.588–284.412) in the high-score subgroup, which was significantly lower than that in the low-score subgroup (HR: 3.296, 95% CI: 1.825–5.954; P = 0.0001). In addition, the mortality rate of the high-score subgroup is explicitly higher than that of the low-score subgroup, with values of 93.55% and 60.00%, respectively. In terms of post-response, we divided the four subgroups: CR, PR, SD, and PD. The result demonstrated that the median OS in the four subgroups was 944 days (95% CI: 602.734–1285.266), 741 days (95% CI: 468.055–1013.945), 190 days (95% CI: 175.061–204.939), and 185 days (95% CI: 57.845–312.155), respectively, with statistically significant differences among the four subgroups (P < 0.0001). Firstly, taking CR as the reference, the HR of OS in PR, SD, and PD were 1.308 (95% CI: 0.631–2.712), 2.881 (95% CI: 1.235–6.724), and 5.647 (95% CI: 1.597–19.976), respectively. Secondly, taking PR as the reference, the HR of OS both in SD and PD were 2.202 (95% CI: 1.157–4.1912) and 4.316 (95% CI: 1.385–13.453), correspondingly. Thirdly, in the PD subgroup, there is still a higher risk of death than that in the SD subgroup (HR:1.960, 95% CI: 0.581–6.614). Furthermore, the mortality rates of CR and PR were significantly lower than those of SD and PD, with values of 55.56%, 66.67%, 86.96%, and 76.92%, respectively. Survival curves according to radscore and post-response were shown in (Figure 6B and C).
Discussion
Although noninvasive imaging has been proved to be important in survival prediction, there is still no better model to accurately predict survival in patients with HCC undergoing TACE for the first time. In our study, we developed the new, more comprehensive combined model to predict OS (C-index = 0.806), including radscore consisted of nine radiomics signatures and a clinical model composed of one characteristics of post-response. Furthermore, we discovered that in addition to radscore in the pre-TACE, radiological response in the post-TACE was also proven to be an independent risk factor for predicting OS. Moreover, to avoid overfitting and optimize the models, we combined the radscore with the clinical model. The result showed that the efficacy of the combined model was slightly higher than that of the radscore in the validation cohort, both of whom were significantly better than the clinical model.
Recently, most studies have attempted to use artificial intelligence (AI) to assess the efficacy and predict the survival of patients with HCC treated with different modalities in order to help patients choose the optimal treatment modality for the best clinical benefit. Machine learning, as a branch of AI, includes support vector machines (SVMs), artificial neural networks (ANNs), regression trees, and deep learning, which is a new machine learning model using technologies such as convolutional neural networks (CNNs) to develop multilayer neural network algorithms.6,16 Although both the European Association for the Study of the Liver (EASL) and AASLD guidelines recommend that the treatments of HCC are selected according to the BCLC staging system, the actual clinical treatment has not been adopted strictly in accordance with the recommendations, which may be related to the experience of doctors and the systemic condition of patients. Choi et al17 developed a machine learning-based clinical decision support system for recommending initial treatment options and predicting OS for HCC, aiming to overcome the complexity of treatment decisions and obtain the survival prediction curves for each patient based on the chosen survival models. This finding could provide personalized reference options for clinicians to develop treatment plans, which may be a direction for further research in the future. Zhang et al18 built models based on machine learning to predict OS of HCC after surgical resection and indicated that radiomic signature could predict OS well (C-index = 0.88), and the prediction performance can be further improved by combining clinical-radiological features (C-index = 0.92). Similarly, Wu et al19 and Kim et al20 explored the importance of radiomic signature and clinical characteristics in predicting survival of patients with HCC, who were treated with stereotactic body radiation therapy or TACE, and both of them showed that the combined model outperformed the clinical characteristics model alone in predicting survival. It is worth acknowledging that machine learning has considerable value in the field of diagnosis and treatment in patients with HCC, especially in the efficacy assessment and survival prediction of TACE because of the relatively large amount of TACE data available in the clinic.
In previous studies,9,20,21 for predicting survival of HCC treated with TACE, the categories and number of features in the models were diversified, mainly including tumor size, tumor number, BCLC-stage, Child-Pugh class, AFP, irregular tumor margin, and rad score. Similarly, our model differs from the models developed in previous studies, but there has some overlapping features. Firstly, in terms of radscore, which is essential feature for predicting survival, the number and type vary in each radscore model as reported in previous studies. In the study of Niu et al,21 radscore consisted of eight features (including two volumetric texture features and six wavelet texture features) that were screened using LASSO regression analysis. In our study, 9 wavelet transform features were filtered to form the radscore by the same method. It has been suggested that wavelet-based features can be used for disease diagnosis and treatment response prediction22,23. GLCM, GLRLM, and GLSZM are all matrix-based features: GLCM describes the pairwise arrangement of voxels with the same gray value and is used to highlight local heterogeneity information; GLRLM_HGLRE is used to measure the distribution of high gray values, and the HGRE value is expected to be larger for images with higher gray values.24 A study25 comparing the differences in radiomics features in normal liver, cirrhosis, and hepatocellular carcinoma parenchyma pointed out that first-order, GLCM, GLRLM, and GLSZM had low variation, and the values of two radiomics signatures (first-order entropy and GLCM-sum entropy) were consistently larger, and the value of GLCM inverse variance consistently decreased from healthy liver to cirrhosis and HCC. Entropy reflects the degree of randomness of a region, and the larger its value, the higher the image complexity. Furthermore, we performed a high-low risk subgroup analysis of the radscore based on the cut-off value and found a statistically significant difference in median OS (885 days vs 220 days, P = 0.0001). Our radscore is similar to that of Niu et al, including three GLSZM features (gray level variance, size zone non-uniformity normalized, and low gray level zone emphasis). The C-index of radscore was 0.834 and 0.769 in the training and validation cohort, respectively, which the prediction performance may be better than that of Niu et al (0.723, 0.734, correspondingly). Meng et al9 filtered six features (one Log.sigma.1.0.mm and five wavelet texture features) to construct the radscore, with a C-index of 0.68 in the training cohort, which is lower than our model. However, there were no overlapping features with our radscore. Moreover, Kim et al20 screened five radiomics signatures to build the radscore, which had no features overlapping with ours as well. Since Kim et al’s study did not use the C-index as a quantitative indicator of the model, it was not possible to compare the predictive performance.
From the above discussion, we summarize several reasons that can be reasonably explained. First, both in our study and in Niu et al’s study, the timing of image acquisition was obtained in the arterial phase and venous phase at 35s, 65s, respectively. Second, in terms of scanning devices and parameters, both ours and Niu et al's study involved only 1 device (64-row CT) and the same tube voltage of 120Kv, whereas the other two studies involved 2 and more scanning devices and the tube voltage was not constant. Nonetheless, a recent systematic review26 noted that no two studies can be directly compared with each other because proprietary feature extraction tools generate thousands of quantitative variables that have no meaning outside the context of individual studies, and suggested that standardization of protocols and outcome measures, sharing of algorithms and analysis methods, and external validation are necessary to avoid model heterogeneity.
However, radscore is characteristic based on pre-TACE, which may not be comprehensive enough for survival prediction. Subsequently, we analyzed the characteristics in the post-TACE as well and found that post-response was also an independent predictor of OS (P = 0.0007). Previously, the importance of post-response for predicting survival has rarely been discussed in previous studies. Before that, Han et al10 developed a pre-TACE model consisting of baseline clinical characteristics, and a post-TACE model including response after TACE. Then, they compared their models with the current hepatocellular artery embolization prognosis (HAP) score and its modified version (including tumor size, tumor number, AFP, bilirubin, and albumin), and emphasized that the post-TACE model had the best predictive performance (C-index = 0. 723). Likewise, the post-response after initial TACE was an independent risk factor for predicting the survival in our study. A study27 pointed that GLCM moment based on pre-TACE dynamic CT texture is one of the significant predictors of CR after TACE. Currently, mRECIST is an accurate, and convenient criteria for assessing radiological response. Previous studies28,29 pointed out that the mRECIST and EASL criteria were more accurate than the RECIST 1.1 criteria in predicting the rate of response and overall survival, and the mRECIST and EASL criteria are highly consistent and predictable. Furthermore, the liver function indicators of pre-TACE and post-TACE included in our study were not found to be predictive of survival. Similarly, in most previous studies laboratory indicators of liver function besides AFP were not found to be significant. In terms of the preoperative pattern of tumor vascularization, Hasdemir et al30 indicated that the pattern of vascularization of the largest tumor could predict survival after TACE (P = 0.012). Nevertheless, in our study, this result was not be found. The possible reason is that the study by Hasdemir et al included all intermediate stage HCC and the efficacy assessment criteria was RECIST1.1, whereas we included patients with BCLC-stage B and C and used the mRECIST criteria.
Some studies suggested31,32 that TACE is a good option for unresectable HCC before moving to the next step of treatment, such as surgical resection and liver transplantation. Because TACE can reduce tumor volume, control cancer thrombus as well as improve tumor microenvironment to some extent, providing transformation opportunities and enhancing overall survival.33,34 Furthermore, TACE treated before RFA can provide better clinical benefit and allow RFA to cause a larger area of necrosis due to embolization of the blood vessels surrounding the tumor to reduce arterial and venous blood flow.35
There are some limitations in our study. Firstly, only CT images were analyzed, and iodine oil deposition after TACE may be able to interfere with the assessment of post-response. However, CT images are more commonly and inexpensively compared with MR images and can be provided sufficient samples for analysis. Secondly, in terms of treatment modality, we did not distinguish whether conventional TACE and drug-loaded TACE would have an impact on survival due to the small sample size. However, the two therapies had similar results in the treatment of HCC and can be used interchangeably.36 Thirdly, although many studies (including ours) have now shown that radiomic models can predict survival very well in patients with HCC after TACE, these models are not completely consistent, which may be related to the standardization of imaging data, the way of features extraction, and the underlying conditions of patients and ethnic differences. There is still no better explanation for that, and comprehensive analyses such as systematic evaluation or meta-analysis are urgently needed to explain the reasons and try to find the best model. Finally, due to the small amount of data meeting the inclusion criteria, this study was no external validation cohort and was a single-center study. This will be addressed in the future with further expansion of data collection.
Conclusion
Noninvasive imaging methods offer significant advantages in predicting survival of patients with HCC after initial TACE. By combining clinical characteristics including pre-TACE and post-TACE, we constructed a novel, reliable model to predict outcome, including radscore and post-response.
Abbreviations
AASLD, American Association for the Study of Liver Diseases; AFP, alpha-fetoprotein; AI: artificial intelligence; ALB, albumin; ALT, alanine aminotransferase; ANN, artificial neural network; AST, aspartate aminotransferase; BCLC, Barcelona Clinic Liver Cancer; CI, confidence interval; C-index, consistency index; CNN, convolutional neural network; CR, complete response; CT, computed tomography; DCA, decision curve analysis; EASL, European Association for the Study of the Liver; GLCM, gray level co-occurrence matrix; GLRLM, gray level run length matrix; GLSZM, gray level size zone matrix; HAP, hepatocellular artery embolization prognosis; HCC, hepatocellular carcinoma; HGLRE, high_gray_level_run_emphasis; HR, hazard ratio; ICC, inter/intra-class correlation coefficient; IQR, interquartile range; K-M, Kaplan–Meier; LASSO, least absolute shrinkage and selection operator algorithm; LBP, local binary pattern; MR, magnetic resonance; mRECIST, modified response evaluation criteria in solid tumor; OS, overall survival; PD, progressive disease; PR, partial response; RFA, radiofrequency ablation; ROI, region of interest; SD, stable disease; Sd, standard deviation; SVM, support vector machine; TACE, transarterial chemoembolization; VOI, volume of interest.
Data Sharing Statement
The raw data for this study is available upon request to the corresponding author by e-mail.
Ethics Approval and Statement
The ethics committee approval of the First Affiliated Hospital of Sun Yat-sen University was obtained for this study, and informed consent was waived due to the retrospective nature of this study. We state that we will keep patient data confidentiality and obey the Declaration of Helsinki.
Author Contributions
All authors made a significant contribution to the work reported, whether that is in the conception, study design, execution, acquisition of data, analysis and interpretation, or in all these areas; made a significant contribution to the manuscript and critically revised or reviewed the article; agreed that this manuscript be submitted to the Journal of Hepatocellular Carcinoma; reviewed and agreed on all versions of the article before submission, during revision, the final version accepted for publication, any significant changes introduced at the proofing stage, gave final approval of the version to be published; and agree to take responsibility and be accountable for the contents of the article and all aspects of this work.
Funding
This study was supported by grants from the National Key Research and Development Program of China (2019YFC0118100) and National Natural Science Foundation of China (81873910 and 62171167).
Disclosure
The authors report no conflicts of interest in this work.
References
1. McGlynn KA, Petrick JL, El-Serag HB. Epidemiology of Hepatocellular Carcinoma. Hepatology. 2021;73(Suppl 1):4–13. doi:10.1002/hep.31288
2. Llovet JM, Kelley RK, Villanueva A, et al. Hepatocellular carcinoma. Nat Rev Dis Primers. 2021;7(1):6. doi:10.1038/s41572-020-00240-3
3. Ogasawara S, Ooka Y, Itokawa N, et al. Sequential therapy with sorafenib and regorafenib for advanced hepatocellular carcinoma: a multicenter retrospective study in Japan. Invest New Drugs. 2020;38(1):172–180. doi:10.1007/s10637-019-00801-8
4. Ogasawara S, Chiba T, Ooka Y, et al. Efficacy of sorafenib in intermediate-stage hepatocellular carcinoma patients refractory to transarterial chemoembolization. Oncology. 2014;87(6):330–341. doi:10.1159/000365993
5. Raoul JL, Forner A, Bolondi L, et al. Updated use of TACE for hepatocellular carcinoma treatment: how and when to use it based on clinical evidence. Cancer Treat Rev. 2019;72:28–36. doi:10.1016/j.ctrv.2018.11.002
6. Jimenez Perez M, Grande RG. Application of artificial intelligence in the diagnosis and treatment of hepatocellular carcinoma: a review. World J Gastroenterol. 2020;26(37):5617–5628. doi:10.3748/wjg.v26.i37.5617
7. Kuang Y, Li R, Jia P, et al. MRI-based radiomics: nomograms predicting the short-term response after transcatheter arterial chemoembolization (TACE) in hepatocellular carcinoma patients with diameter less than 5 cm. Abdom Radiol (NY). 2021;46(8):3772–3789. doi:10.1007/s00261-021-02992-2
8. Li L, Kan X, Zhao Y, et al. Radiomics signature: a potential biomarker for the prediction of survival in advanced hepatocellular carcinoma. Int J Med Sci. 2021;18(11):2276–2284. doi:10.7150/ijms.55510
9. Meng XP, Wang YC, Ju S, et al. Radiomics analysis on multiphase contrast-enhanced CT: a survival prediction tool in patients with hepatocellular carcinoma undergoing transarterial chemoembolization. Front Oncol. 2020;10:1196. doi:10.3389/fonc.2020.01196
10. Han G, Berhane S, Toyoda H, et al. Prediction of survival among patients receiving transarterial chemoembolization for hepatocellular carcinoma: a response-based approach. Hepatology. 2020;72(1):198–212. doi:10.1002/hep.31022
11. Heimbach JK, Kulik LM, Finn RS, et al. AASLD guidelines for the treatment of hepatocellular carcinoma. Hepatology. 2018;67(1):358–380. doi:10.1002/hep.29086
12. Lencioni R, Llovet JM. Modified RECIST (mRECIST) assessment for hepatocellular carcinoma. Semin Liver Dis. 2010;30(1):52–60. doi:10.1055/s-0030-1247132
13. Llovet JM, Lencioni R. mRECIST for HCC: performance and novel refinements. J Hepatol. 2020;72(2):288–306. doi:10.1016/j.jhep.2019.09.026
14. Buvat I, Orlhac F, Soussan M. Tumor texture analysis in PET: where do we stand? J Nucl Med. 2015;56(11):1642–1644. doi:10.2967/jnumed.115.163469
15. Kawamura Y, Ikeda K, Hirakawa M, et al. New classification of dynamic computed tomography images predictive of malignant characteristics of hepatocellular carcinoma. Hepatol Res. 2010;40(10):1006–1014. doi:10.1111/j.1872-034X.2010.00703.x
16. Kaul V, Enslin S, Gross SA. History of artificial intelligence in medicine. Gastrointest Endosc. 2020;92(4):807–812. doi:10.1016/j.gie.2020.06.040
17. Choi GH, Yun J, Choi J, et al. Development of machine learning-based clinical decision support system for hepatocellular carcinoma. Sci Rep. 2020;10(1):14855. doi:10.1038/s41598-020-71796-z
18. Zhang Z, Chen J, Jiang H, et al. Gadoxetic acid-enhanced MRI radiomics signature: prediction of clinical outcome in hepatocellular carcinoma after surgical resection. Ann Transl Med. 2020;8(14):870. doi:10.21037/atm-20-3041
19. Wu K, Shui Y, Sun W, et al. Utility of radiomics for predicting patient survival in hepatocellular carcinoma with portal vein tumor thrombosis treated with stereotactic body radiotherapy. Front Oncol. 2020;10:569435. doi:10.3389/fonc.2020.569435
20. Kim J, Choi SJ, Lee SH, et al. Predicting survival using pretreatment CT for patients with hepatocellular carcinoma treated with transarterial chemoembolization: comparison of models using radiomics. AJR Am J Roentgenol. 2018;211(5):1026–1034. doi:10.2214/AJR.18.19507
21. Niu XK, He XF. Development of a computed tomography-based radiomics nomogram for prediction of transarterial chemoembolization refractoriness in hepatocellular carcinoma. World J Gastroenterol. 2021;27(2):189–207. doi:10.3748/wjg.v27.i2.189
22. Chun SH, Suh YJ, Han K, et al. Differentiation of left atrial appendage thrombus from circulatory stasis using cardiac CT radiomics in patients with valvular heart disease. Eur Radiol. 2021;31(2):1130–1139. doi:10.1007/s00330-020-07173-1
23. Zhou J, Lu J, Gao C, et al. Predicting the response to neoadjuvant chemotherapy for breast cancer: wavelet transforming radiomics in MRI. BMC Cancer. 2020;20(1):100. doi:10.1186/s12885-020-6523-2
24. Mahmood U, Apte AP, Deasy JO, et al. Investigating the robustness neighborhood gray tone difference matrix and gray level co-occurrence matrix radiomic features on clinical computed tomography systems using anthropomorphic phantoms: evidence from a multivendor study. J Comput Assist Tomogr. 2017;41(6):995–1001. doi:10.1097/RCT.0000000000000632
25. Duan J, Hu C, Qiu Q, et al. Characterization of microvessels and parenchyma in in-line phase contrast imaging CT: healthy liver, cirrhosis and hepatocellular carcinoma. Quant Imaging Med Surg. 2019;9(6):1037–1046. doi:10.21037/qims.2019.06.12
26. Harding-Theobald E, Louissaint J, Maraj B, et al. Systematic review: radiomics for the diagnosis and prognosis of hepatocellular carcinoma. Aliment Pharmacol Ther. 2021;54(7):890–901. doi:10.1111/apt.16563
27. Park HJ, Kim JH, Choi SY, et al. Prediction of therapeutic response of hepatocellular carcinoma to transcatheter arterial chemoembolization based on pretherapeutic dynamic CT and textural findings. AJR Am J Roentgenol. 2017;209(4):W211–W220. doi:10.2214/AJR.16.17398
28. Kim CJ, Kim HJ, Park JH, et al. Radiologic response to transcatheter hepatic arterial chemoembolization and clinical outcomes in patients with hepatocellular carcinoma. Liver Int. 2014;34(2):305–312. doi:10.1111/liv.12270
29. Lee JS, Choi HJ, Kim BK, et al. The Modified Response Evaluation Criteria in Solid Tumors (RECIST) yield a more accurate prognoses than the RECIST 1.1 in hepatocellular carcinoma treated with transarterial radioembolization. Gut Liver. 2020;14(6):765–774. doi:10.5009/gnl19197
30. Hasdemir DB, Davila LA, Schweitzer N, et al. Evaluation of CT vascularization patterns for survival prognosis in patients with hepatocellular carcinoma treated by conventional TACE. Diagn Interv Radiol. 2017;23(3):217–222. doi:10.5152/dir.2016.16006
31. Kim Y, Stahl CC, Makramalla A, et al. Downstaging therapy followed by liver transplantation for hepatocellular carcinoma beyond Milan criteria. Surgery. 2017;162(6):1250–1258. doi:10.1016/j.surg.2017.08.007
32. Orlacchio A, Chegai F, Merolla S, et al. Downstaging disease in patients with hepatocellular carcinoma outside up-to-seven criteria: strategies using degradable starch microspheres transcatheter arterial chemo-embolization. World J Hepatol. 2015;7(12):1694–1700. doi:10.4254/wjh.v7.i12.1694
33. Montasser A, Beaufrère A, Cauchy F, et al. Transarterial chemoembolisation enhances programmed death-1 and programmed death-ligand 1 expression in hepatocellular carcinoma. Histopathology. 2021;79(1):36–46. doi:10.1111/his.14317
34. Toso C, Mentha G, Kneteman NM, et al. The place of downstaging for hepatocellular carcinoma. J Hepatol. 2010;52(6):930–936. doi:10.1016/j.jhep.2009.12.032
35. Peng ZW, Zhang YJ, Chen MS, et al. Radiofrequency ablation with or without transcatheter arterial chemoembolization in the treatment of hepatocellular carcinoma: a prospective randomized trial. J Clin Oncol. 2013;31(4):426–432. doi:10.1200/JCO.2012.42.9936
36. Song JE, Kim DY. Conventional vs drug-eluting beads transarterial chemoembolization for hepatocellular carcinoma. World J Hepatol. 2017;9(18):808–814. doi:10.4254/wjh.v9.i18.808
37. Tu R, Zhang YD, Wu BZ, et al. Study of CT grading of liver cirrhosis. Radiol Pract. 2003;18(9):621–623.
 © 2022 The Author(s). This work is published and licensed by Dove Medical Press Limited. The
full terms of this license are available at https://www.dovepress.com/terms
and incorporate the Creative Commons Attribution
- Non Commercial (unported, 3.0) License.
By accessing the work you hereby accept the Terms. Non-commercial uses of the work are permitted
without any further permission from Dove Medical Press Limited, provided the work is properly
attributed. For permission for commercial use of this work, please see paragraphs 4.2 and 5 of our Terms.
© 2022 The Author(s). This work is published and licensed by Dove Medical Press Limited. The
full terms of this license are available at https://www.dovepress.com/terms
and incorporate the Creative Commons Attribution
- Non Commercial (unported, 3.0) License.
By accessing the work you hereby accept the Terms. Non-commercial uses of the work are permitted
without any further permission from Dove Medical Press Limited, provided the work is properly
attributed. For permission for commercial use of this work, please see paragraphs 4.2 and 5 of our Terms.