Back to Journals » Journal of Inflammation Research » Volume 16
Noninvasive Evaluation of Lupus Nephritis Activity Using a Radiomics Machine Learning Model Based on Ultrasound
Authors Qin X, Xia L, Zhu C, Hu X, Xiao W ![]() , Xie X
, Xie X ![]() , Zhang C
, Zhang C
Received 23 November 2022
Accepted for publication 27 January 2023
Published 3 February 2023 Volume 2023:16 Pages 433—441
DOI https://doi.org/10.2147/JIR.S398399
Checked for plagiarism Yes
Review by Single anonymous peer review
Peer reviewer comments 3
Editor who approved publication: Professor Ning Quan
Xiachuan Qin,1,2,* Linlin Xia,1,* Chao Zhu,3 Xiaomin Hu,2 Weihan Xiao,2 Xisheng Xie,4 Chaoxue Zhang1
1Department of Ultrasound, The First Affiliated Hospital of Anhui Medical University, Hefei, Anhui, People’s Republic of China; 2Department of Ultrasound, Nanchong Central Hospital, The Second Clinical Medical College, North Sichuan Medical College (University), Nan Chong, Sichuan, People’s Republic of China; 3Department of Radiology, The First Affiliated Hospital of Anhui Medical university, Hefei, Anhui, People’s Republic of China; 4Department of Nephrology, Nanchong Central Hospital, The Second Clinical Medical College, North Sichuan Medical College (University), Nan Chong, Sichuan, People’s Republic of China
*These authors contributed equally to this work
Correspondence: Chaoxue Zhang, Department of Ultrasound, The First Affiliated Hospital of Anhui Medical University, Hefei, Anhui, People’s Republic of China, Email [email protected] Xisheng Xie, Department of Nephrology, Nanchong Central Hospital, The Second Clinical Medical College, North Sichuan Medical College (University), Nan Chong, Sichuan, People’s Republic of China, Email [email protected]
Introduction: To explore whether ultrasonic radiomics extracted by machine learning method can noninvasively evaluate lupus nephritis (LN) activity.
Materials and Methods: This retrospective study included 149 patients with LN diagnosed by renal biopsy. They were divided into a training cohort (n=104) and a test cohort (n=45). Ultrasonic radiomics features were extracted from the ultrasound images, and the radiomics features were constructed. Furthermore, five machine learning algorithms were compared to evaluate LN activity. The performance of the binary classification model was evaluated by the area under the receiver operating characteristic curve (AUC), accuracy, sensitivity, specificity, positive predictive value (PPV), and negative predictive value (NPV).
Results: The average AUC of the five machine learning models was 79.4, of which the MLP model was the best. The AUC of the training group was 89.1, with an accuracy of 81.7%, a sensitivity of 83%, a specificity of 80.7%, a negative predictive value of 85.2%, and a positive predictive value of 78%. The AUC of the test group was 82.2, the accuracy was 73.3%, the sensitivity was 78.9%, the specificity was 69.2%, the negative predictive value was 81.8%, and the positive predictive value was 65.2%.
Conclusion: Machine learning classifier based on ultrasonic radiomics has high accuracy for LN activity. The model can be used to noninvasively detect the activity of LN and can be an effective tool to assist the clinical decision-making process.
Keywords: systemic lupus erythematosus, lupus nephritis, activity, ultrasound, machine learning
Introduction
Lupus nephritis (LN) is a common complication of systemic lupus erythematosus (SLE). The severity of renal damage is closely related to the prognosis of SLE. Renal involvement and progressive renal dysfunction are one of the main causes of death in SLE.1,2 LN causes renal damage by deposition of circulating or in situ immune complexes.3 The goal of LN treatment is to eliminate active inflammation and achieve renal remission and disease quiescence.4 Currently, renal biopsy is the gold standard for diagnosis and treatment of LN.5 It is also the only way to judge disease activity.6,7 When the treatment of LN is inadequate or if LN relapses, it is often necessary to repeat renal biopsy to accurately judge pathological changes and formulate corresponding treatment plans.8 However, renal biopsy is an invasive diagnosis with the risk of bleeding. Repeated renal biopsy is difficult to be accepted by patients. Therefore, a noninvasive method is urgently needed to accurately determine the activity of LN.
Ultrasound is the most commonly used imaging method to understand the renal morphology, and the ultrasonic performance reflects the chronic pathological changes of the kidney.9 However, as LN tends to be more normal in the ultrasonic graphic performance, there is no study to evaluate the activity of LN by imaging examination currently. We assume that changes in LN activity can be detected by advanced computing technologies (such as radiomics). Radiomics obtains multiple quantitative features from single or multiple medical imaging modes, highlighting image features that are not visible to the naked eye.10 Machine learning technology (ML) shows the ability of high sensitivity, high-dimensional information mining and high-throughput computing, and has more important value in differential diagnosis, the ML part is used to predict the results in the subsequent steps. These biomarkers are combined with various ML techniques to identify imaging features of subtle but complex tissue changes.11 In recent years, ultrasound radiomics has been developed to assess the glomerular lesions or changes in renal function in nephropathy.12,13 Our aim was to use the ML model based on ultrasound radiomics to noninvasively evaluate LN activity.
Method
This study protocol conformed to the ethical guidelines of the Declaration of Helsinki and was approved by the institutional review committee of the First Affiliated Hospital of Anhui Medical University (PJ2022-11-29). Written informed consent was not required due to the retrospective nature of this study. The personal information of patients was strictly protected. We included 149 LN patients who underwent renal biopsy from the First Affiliated Hospital of Anhui Medical University and Nanchong Central Hospital from January 2019 to June 2022. The inclusion criteria include: 1. LN confirmed by renal biopsy; 2. There were more than 10 glomeruli in the light microscope specimens; 3. Age of more than 18 years old; 4. Those who underwent ultrasound less than three days before renal biopsy. The exclusion criteria were: 1. Acute renal damage and heart valve disease; 2. Renal artery stenosis14 or urinary tract obstruction; 3. The patients with associated diseases either immune or non-immune.4. There was cyst or tumor in the kidney; 5. Ultrasonic image missing and poor ultrasound image quality. The enrolled patients were randomly divided into training cohort (n=104) and test cohort (n=45) at a ratio of 7:3. The research flow chart is shown in Figure 1.
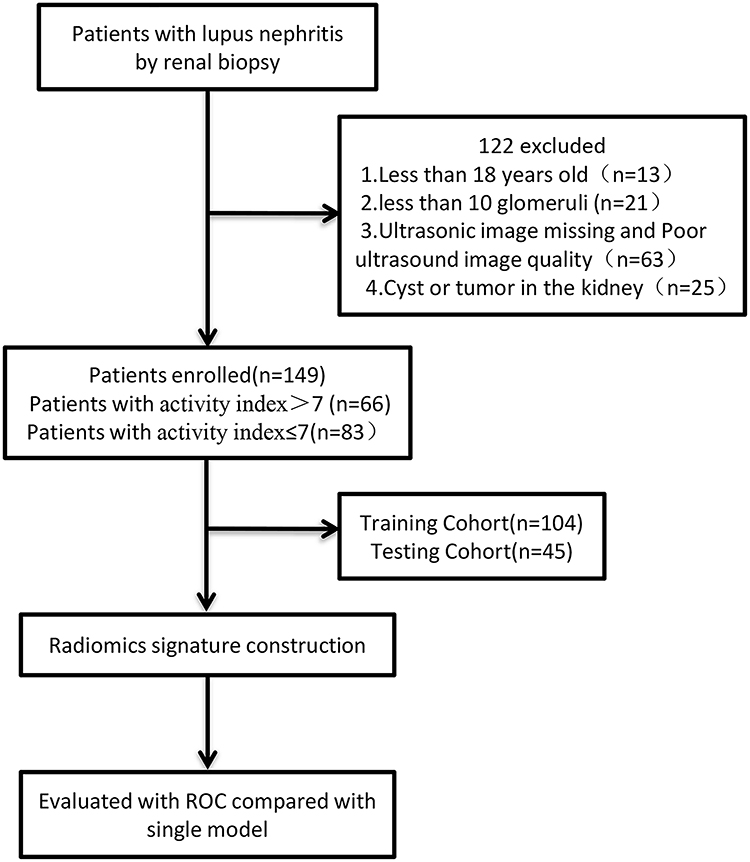 |
Figure 1 The flow diagram of the study. |
Renal biopsy was performed within three days after renal ultrasound examination by two experienced nephrologists. The right kidney was selected for renal biopsy. LN was classified according to the 2003 International Society of Nephrology/Society of renal pathology (ISN/RPS) standard.15 Specific histological features (glomerular cell proliferation, glomerular leukocyte exudation, nuclear rupture and cellulose like necrosis, cell crescent, hyaline deposits, interstitial inflammation, glomerulosclerosis, fibrous papule score, tubular atrophy, and interstitial fibrosis) were graded semi-quantitatively as described previously (0 to 3 +, indicating no, mild, moderate, or severe). The sum of the scores of individual active lesions indicate the activity index. The activity index was divided into active and inactive according to a factor >7 and ≤7, respectively.16,17
Ultrasonic Image Acquisition
Ultrasonography was performed by four sonographers with 5, 6, 8, and 10 years of experience in renal ultrasound examination. The patients underwent ultrasound examination and image acquisition within three days before renal biopsy. The US instruments employed to acquire the images used in this study includes: GE vid E9 (General Electric Co., USA) and Mindray Resona 7 (Shenzhen Mindray Biomedical Electronics Co., Ltd., China) which used a multi frequency (2–5MHZ) convex array probe (C5-2). All measurements were performed during supine position and apnea at the end of inspiration. The ultrasound probe is gently positioned in the right abdomen by oblique projection, and the kidney is visualized as a longitudinal image to obtain the maximum coronal section of the right kidney. The parameter configuration in the acquisition process is based on the optimal display setting of the ultrasound image.
Image Segmentation and Feature Extraction of Ultrasonomics
The region of interest (ROI) of renal was manually segmented using ITK software (3.8.0., http://www.itksnap.org/pmwiki/pmwiki.php?n=Downloads.SNAP3). The ROI segmentation was performed by Reader 1 (with 9 years of renal ultrasound imaging experience) and Reader 2 (with 7 years of renal ultrasound imaging experience). The renal ultrasound images of the 50 patients were randomly selected, and the ROI was separately delineated by Reader 1 and Reader 2. Lastly, the consistency test between groups was performed. Two weeks later, the ultrasound images of 50 patients were randomly selected, and Reader 1 performed the ROI delineation step again, and the intra-group consistency test of the characteristics was performed. When the ICC (intra-class correlation coefficient) values of the inter group and intra group consistency tests are greater than 0.75, it indicates that the extracted features have good consistency. Then, the remaining image segmentation is performed by Reader 1 alone. Only features with good consistency were retained in subsequent analysis.
Construction of Ultrasonomics Features
Radiomics feature extraction is performed using Pyrodiomics (v3.0.1, https://github.com/AIM-Harvard/pyradiomics). It can extract ultrasonic radiomics features and use many engineering hard coded feature algorithms to extract features from ultrasonic images. As shown in Figure 2, the steps of selecting sonomics features and signature construction were as follows: First, the feature of ICC > 0.75 in the training cohort was retained. Second, univariate analysis U-test was used to screen out the characteristics of significant distribution difference between the active group and the inactive group in the training cohort (P < 0.05). Third, the most valuable features were selected using the lasso feature selection algorithm (least absolute shrinkage and selection operator).
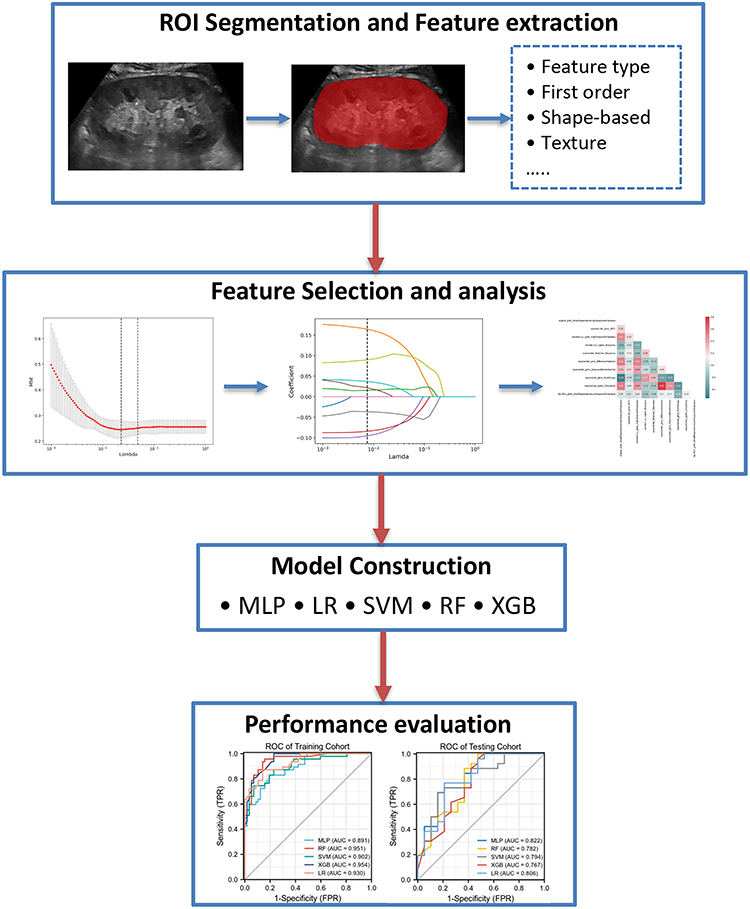 |
Figure 2 The radiomics flow chart of the study. |
As the alpha increases, the mean square error (MSE) of the LASSO model decreases first and then increases. Take the lowest alpha of MSE as the best alpha value, and the non-zero coefficient feature is the selected feature. As the alpha value increases, the coefficient of the feature gradually converges, and the characteristic graph shows the change of the characteristic coefficient with the increase of the alpha value. Under the best alpha value, the Spearman correlation analysis is performed between the selected features, display the correlation coefficient between features through thermal diagram (Figure 2).
Then, five machine learning models were trained based on the selected the best features, including logistic regression (LR), multilayer perceptron (MLP), support vector machine (SVM), random forest (RF), and extreme gradient lifting tree (XGBOOST). The radiological characteristics are verified by five-fold cross validation, and the training is repeated five times on the training set. The model AUC of each time is calculated separately, and the average value of five times is taken to obtain the best parameter configuration for training. Details of ML algorithms are presented in the Supplementary Material. The hyperparameters of the above machine learning algorithm are adjusted by grid search CV and 5-fold cross validation in the training data set. In each cycle of the five-fold cross validation, the hyperparameters with the best AUC in the validation data set are retained, and the entire training data set is used for the establishment of the final model. Patients in the test dataset were used to evaluate model performance. For each round of model training, each patient will obtain the predicted probability value of the corresponding prediction tag. Details of adjusting the hyperparameters of different machine learning algorithms are presented in the Supplementary Material.
Statistics
All statistical analyses were performed using SPSS 25.0 (IBM Corp., Armonk, NY, USA) and Python 2.7 (Python software foundation, Beaverton, or, USA) software. Quantitative data with normal distribution are expressed as mean ± standard deviation, while quantitative data with non-normal distribution are expressed as median ± interquartile range. Meanwhile, categorical variables are expressed in numbers and percentages. Chi-square test, independent sample t-test, and Mann Whitney U-test were used for univariate analysis. The area under the receiver operating characteristic curve (AUC) of the five models was compared with sensitivity, specificity, positive predictive value and negative predictive value calculated. Two-sided P values <0.05 were considered to be statistically significant.
Result
A total of 149 patients with LN confirmed by renal biopsy were included in this study, 32 of whom were male participants, while the other 117 were female. Their average age was 37.2 ±12.4 (18–73). Among them, 66 were active, while 83 were inactive. The baseline characteristics of the patients are shown in Table 1.
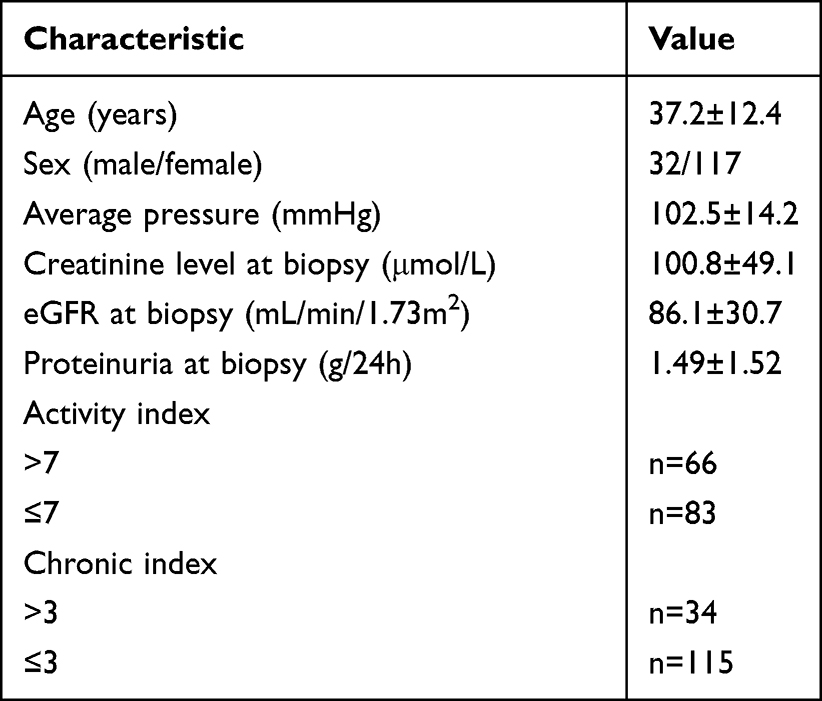 |
Table 1 The Baseline Characteristics of the Patients |
Feature Extraction, Selection, and Ultrasonic Radiomic Feature Construction
A total of 1550 radiomic features were extracted from ultrasound images. After inter- and intra-observer consistency tests and univariate analysis, 208 radiomic characteristics were found to be significantly different between the two groups. These features were imported into the lasso feature selection algorithm to obtain the most valuable features and to generate 10 useful features (Figure 3). Finally, ultrasonic radiomic features were established using these 10 features.
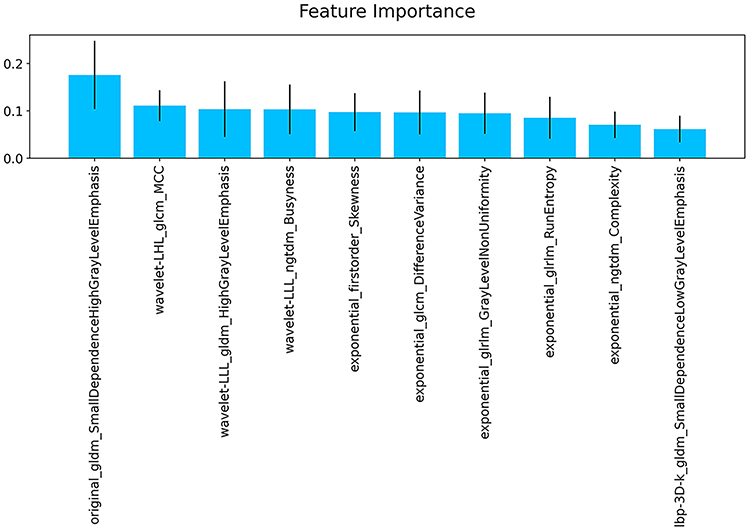 |
Figure 3 Ten features were used to establish the radiomic features. |
Based on a five-fold cross-validation strategy, we constructed different machine models using different algorithms. The diagnostic efficacy of these models is presented in Table 2. The receiver operating characteristic (ROC) curves of the five models based on the training cohort and the test cohort is shown in Figure 4. For judging the activity of LN, the average AUC of the models was 0.79, of which the MLP model was the best. The MLP ‘AUC of the training group was 0.89, with an accuracy of 81.7%, sensitivity of 83%, specificity of 80.7%, negative predictive value of 85.2%, and positive predictive value of 78%. The AUC, accuracy, sensitivity, specificity, negative predictive value, and positive predictive value in testing group were 0.82, 73.3%, 78.9%, 69.2%, 81.8%, and 65.2%, respectively. As described as Figure 5, the number of the predicted patients of two categories was 39(+) and 46(-) in the training set (Figure 5A), and 15(+) and 18(-) in the testing set (Figure 5B).
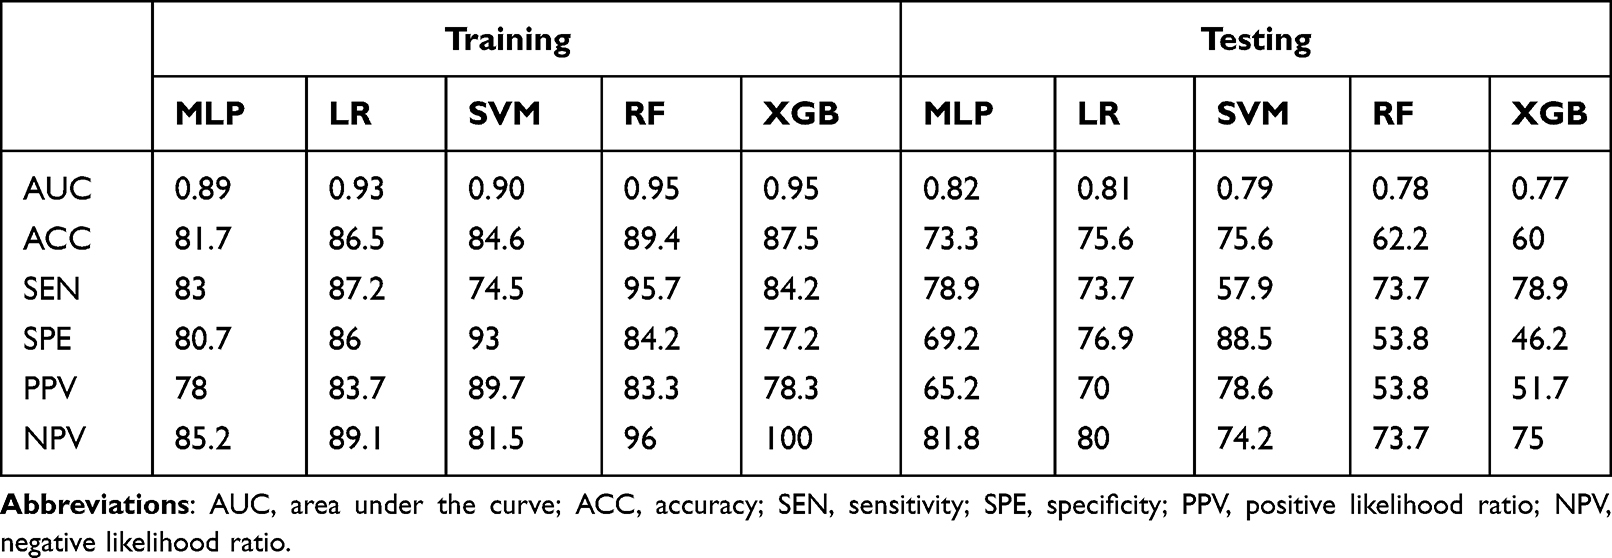 |
Table 2 Performance of the Five Model in the Training and Testing Cohorts |
 |
Figure 4 The receiver operating characteristic (ROC) curves of the five models. (A) five model ROC curves in the training cohort. (B) five model ROC curves in the testing cohort. |
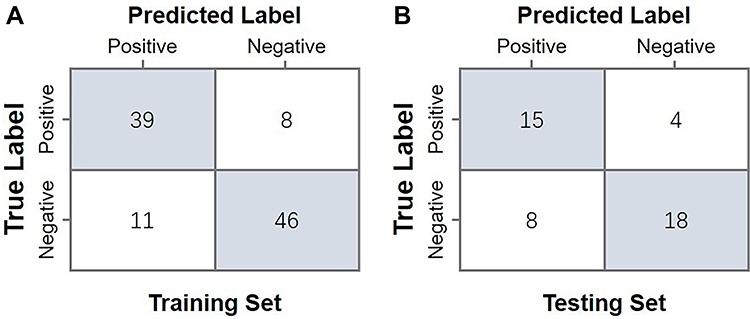 |
Figure 5 The confusion matrix of MLP model in the training (A) and testing cohorts (B). |
Discussion
The individual histological features of LN activity, such as cell crescent and cellulose-like necrosis, are positively correlated with renal failure.16,17 Uncontrolled LN activity accelerates the loss of nephrons, increases the risk of early end-stage renal disease and death, accurately judges the activity performance of LN, and guides clinicians in formulating effective treatment plans.18 However, it is difficult to understand LN activity without renal biopsy.19 Renal biopsy is an invasive examination that results in both physical and emotional pain to patients. Although there are clinical measures that can be used to assess disease activity and treatment response by measuring the renal function and proteinuria, the clinical measurement of renal function and proteinuria is not a reliable biomarker for histological activity. Therefore, clinicians are looking for new non-invasive biomarkers that can be used to assess LN activity.8 We developed five ML models based on the radiomics of ultrasound images to distinguish the LN activity of LN. Among the five ML models, MLP exhibited the best evaluation performance, with an AUC of 0.82 and accuracy of 73.3% in the test set. This model can be used to non-invasively assess LN activity in the clinic. To the best of our knowledge, this is also the first study that applied the ML model analysis of ultrasonic radiomic features in distinguishing LN activity.
Renal ultrasound is a routine method in the outpatient follow-up of renal changes. It is mainly used to detect renal morphological changes, including renal size, parenchymal echogenicity, and cortical differentiation;20–22 however, the information that can be obtained from the kidney by the human eye is limited, and many details in the image cannot be recognized by the naked eye. Radiomics can automatically extract the microscopic characteristics of ROI in medical images, save the digital encrypted medical images related to tumour pathophysiology, and convert them into high-dimensional data that can be mined to reflect the microscopic structure and biological tissue information of tumours.23 Since this information can be utilized through quantitative image analysis, the potential of radiomics to improve clinical decision support systems overcomes doubt.24
In recent years, some studies attempted to apply ultrasound radiomics in clinching the diagnosis of nephrotic diseases. For instance, Zhang et al used radiomics based on ultrasound imaging to classify diffuse glomerular lesions. Quantitative characterisation of ultrasound images can be effective for IgA nephropathy and membranous nephropathy. The area under the ROC curve (AUC) of random forest was 0.7639.25 On the other hand, Zhu et al extracted the radiomic features of ultrasound images to distinguish PTRF through different machine learning methods and obtained the highest ROC value of 0.839. They think that radiomics based on ultrasound images can be used to detect pathological changes that cannot be directly observed in conventional ultrasound images.13 Furthermore, Bandara et al extracted 10 radiomic features based on a wavelet transform to establish a model. The random forest model can effectively identify health and CKD.12 At present, there have been no reports on the non-invasive evaluation of LN activity using ultrasound imaging omics. Therefore, the identification of LN activity using ultrasound imaging omics is worth studying.
Our study hypotheses are as follows: (1) the spatial heterogeneity of LN varies between tissue activities and (2) the spatial heterogeneity can be quantified using ultrasonic radiomics. We used 50% cross-validation to train the model in the training set. After the U-test, Spearman, and lasso feature selection, we selected 10 ultrasonic radiomic features to evaluate the activity of LN. These radiomic features were used to build prediction models using various classical classification algorithms (LR, MLP, SVM, RF, and XGBOOST). In our study, the MLP classifier had the best comprehensive performance in the noninvasive diagnosis of LN activity, with an AUC of 0.891 and 0.822 in the training and test groups, respectively. This result indicates that the ultrasound imaging omics model has a strong processing ability for high-throughput data and can identify biomarkers of subclinical changes based on ultrasonic images. In addition, the model we trained had a good diagnostic performance. In particular, the AUC ranges between 0.767 and 0.822 in the test set, indicating that the screened image omics features were also stable for constructing machine learning models.
This study has several limitations. First, the sample size was relatively small. Thus, prospective clinical studies with larger sample sizes are required in the future. Second, multimodal renal ultrasound and basic clinical information might have predicted the LN activity more accurately. This is the direction of our future research.
In conclusion, we extracted the imaging features of LN. The ML classifier based on ultrasound radiomics has a high recognition accuracy for LN activity, which can accurately and noninvasively detect LN activity and can be used as an effective tool in assisting the clinical decision-making process.
Disclosure
The authors report no conflicts of interest in this work.
References
1. Hanly JG, O’Keeffe AG, Su L, et al. The frequency and outcome of lupus nephritis: results from an international inception cohort study. Rheumatology. 2016;55:252–262. doi:10.1093/rheumatology/kev311
2. Parikh SV, Almaani S, Brodsky S, Rovin BH. Update on lupus nephritis: core curriculum 2020. Am J Kidney Dis. 2020;76:265–281. doi:10.1053/j.ajkd.2019.10.017
3. Pan BP, Feng ZJ, Li XL, et al. An analysis of the correlation between clinical indexes and pathological classifications in 202 patients with lupus nephritis. J Inflamm Res. 2021;14:6917–6927. doi:10.2147/JIR.S339744
4. Alforaih N, Whittall-Garcia L, Touma Z. A review of lupus nephritis. J Appl Lab Med. 2022;7(6):1450–1467. doi:10.1093/jalm/jfac036
5. Gatto M, Radice F, Saccon F, et al. Clinical and histological findings at second but not at first kidney biopsy predict end-stage kidney disease in a large multicentric cohort of patients with active lupus nephritis. Lupus Sci Med. 2022;9:e000689.
6. De Rosa M, Rocha AS, De Rosa G, Dubinsky D, Almaani SJ, Rovin BH. Low-grade proteinuria does not exclude significant kidney injury in lupus nephritis. Kidney Int Rep. 2020;5:1066–1068. doi:10.1016/j.ekir.2020.04.005
7. Aljaberi N, Wenderfer SE, Mathur A, et al. Clinical measurement of lupus nephritis activity is inferior to biomarker-based activity assessment using the renal activity index for lupus nephritis in childhood-onset systemic lupus erythematosus. Lupus Sci Med. 2022;9:e000631.
8. Anders HJ, Rovin B. A pathophysiology-based approach to the diagnosis and treatment of lupus nephritis. Kidney Int. 2016;90:493–501. doi:10.1016/j.kint.2016.05.017
9. Singla RK, Kadatz M, Rohling R, Nguan C. Kidney ultrasound for nephrologists: a review. Kidney Med. 2022;4:100464. doi:10.1016/j.xkme.2022.100464
10. Conti A, Duggento A, Indovina I, Guerrisi M, Toschi N. Radiomics in breast cancer classification and prediction. Semin Cancer Biol. 2021;72:238–250. doi:10.1016/j.semcancer.2020.04.002
11. Mukherjee S, Patra A, Khasawneh H, et al. Radiomics-based machine-learning models can detect pancreatic cancer on prediagnostic CTs at a substantial lead time prior to clinical diagnosis. Gastroenterology. 2022;163(5):1435–1446.e3. doi:10.1053/j.gastro.2022.06.066
12. Bandara MS, Gurunayaka B, Lakraj G, Pallewatte A, Siribaddana S, Wansapura J. Ultrasound based radiomics features of chronic kidney disease. Acad Radiol. 2022;29:229–235. doi:10.1016/j.acra.2021.01.006
13. Zhu L, Huang R, Li M, et al. Machine learning-based ultrasound radiomics for evaluating the function of transplanted kidneys. Ultrasound Med Biol. 2022;48:1441–1452. doi:10.1016/j.ultrasmedbio.2022.03.007
14. Kliewer MA, Tupler RH, Carroll BA, et al. Renal artery stenosis: analysis of Doppler waveform parameters and tardus-parvus pattern. Radiology. 1993;189:779–787. doi:10.1148/radiology.189.3.8234704
15. Weening JJ, D’Agati VD, Schwartz MM, et al. The classification of glomerulonephritis in systemic lupus erythematosus revisited. Kidney Int. 2004;65:521–530. doi:10.1111/j.1523-1755.2004.00443.x
16. Austin HA, Boumpas DT, Vaughan EM, Balow JE. Predicting renal outcomes in severe lupus nephritis: contributions of clinical and histologic data. Kidney Int. 1994;45:544–550. doi:10.1038/ki.1994.70
17. Austin HA, Muenz LR, Joyce KM, et al. Prognostic factors in lupus nephritis. Contribution of renal histologic data. Am J Med. 1983;75:382–391. doi:10.1016/0002-9343(83)90338-8
18. Anders HJ, Jayne DR, Rovin BH. Hurdles to the introduction of new therapies for immune-mediated kidney diseases. Nat Rev Nephrol. 2016;12:205–216. doi:10.1038/nrneph.2015.206
19. Moroni G, Porata G, Raffiotta F, et al. Beyond ISN/RPS lupus nephritis classification: adding chronicity index to clinical variables predicts kidney survival. Kidney. 2022;(3):122–132. doi:10.34067/KID.0005512021
20. Petrucci I, Clementi A, Sessa C, Torrisi I, Meola M. Ultrasound and color Doppler applications in chronic kidney disease. J Nephrol. 2018;31:863–879. doi:10.1007/s40620-018-0531-1
21. Page JE, Morgan SH, Eastwood JB, et al. Ultrasound findings in renal parenchymal disease: comparison with histological appearances. Clin Radiol. 1994;49:867–870. doi:10.1016/S0009-9260(05)82877-6
22. Nakazato T, Ikehira H, Imasawa T. Determinants of renal shape in chronic kidney disease patients. Clin Exp Nephrol. 2016;20:748–756. doi:10.1007/s10157-015-1220-1
23. Gillies RJ, Kinahan PE, Hricak H. Radiomics: images are more than pictures, they are data. Radiology. 2016;278:563–577. doi:10.1148/radiol.2015151169
24. Lambin P, Leijenaar RTH, Deist TM, et al. Radiomics: the bridge between medical imaging and personalized medicine. Nat Rev Clin Oncol. 2017;14:749–762. doi:10.1038/nrclinonc.2017.141
25. Zhang L, Chen Z, Feng L, et al. Preliminary study on the application of renal ultrasonography radiomics in the classification of glomerulopathy. BMC Med Imaging. 2021;21:115. doi:10.1186/s12880-021-00647-8
 © 2023 The Author(s). This work is published and licensed by Dove Medical Press Limited. The
full terms of this license are available at https://www.dovepress.com/terms
and incorporate the Creative Commons Attribution
- Non Commercial (unported, 3.0) License.
By accessing the work you hereby accept the Terms. Non-commercial uses of the work are permitted
without any further permission from Dove Medical Press Limited, provided the work is properly
attributed. For permission for commercial use of this work, please see paragraphs 4.2 and 5 of our Terms.
© 2023 The Author(s). This work is published and licensed by Dove Medical Press Limited. The
full terms of this license are available at https://www.dovepress.com/terms
and incorporate the Creative Commons Attribution
- Non Commercial (unported, 3.0) License.
By accessing the work you hereby accept the Terms. Non-commercial uses of the work are permitted
without any further permission from Dove Medical Press Limited, provided the work is properly
attributed. For permission for commercial use of this work, please see paragraphs 4.2 and 5 of our Terms.