")
Back to Journals » Journal of Hepatocellular Carcinoma » Volume 10
Non-Invasive Imaging Biomarkers to Predict the Hepatopulmonary Shunt Fraction Before Transarterial Radioembolization in Patients with Hepatocellular Carcinoma
Authors Hamm CA, Busch F , Pöhlmann A, Shewarega A, He Y, Schmidt R , Xu H, Wieners G, Gebauer B, Savic LJ
Received 29 September 2022
Accepted for publication 20 December 2022
Published 12 January 2023 Volume 2023:10 Pages 27—42
DOI https://doi.org/10.2147/JHC.S391537
Checked for plagiarism Yes
Review by Single anonymous peer review
Peer reviewer comments 2
Editor who approved publication: Dr Ahmed Kaseb
Charlie Alexander Hamm,1,2,* Felix Busch,1,3,* Anna Pöhlmann,4 Annabella Shewarega,5 Yubei He,1 Robin Schmidt,1 Han Xu,1 Gero Wieners,1 Bernhard Gebauer,1 Lynn Jeanette Savic1,2
1Department of Radiology, Campus Virchow-Klinikum, Charité – Universitätsmedizin Berlin, Corporate Member of Freie Universität Berlin and Humboldt Universität Zu Berlin, Berlin, Germany; 2Berlin Institute of Health at Charité – Universitätsmedizin Berlin, Berlin, Germany; 3Department of Anesthesiology, Division of Operative Intensive Care Medicine, Campus Virchow-Klinikum, Charité – Universitätsmedizin Berlin, Corporate Member of Freie Universität Berlin and Humboldt Universität zu Berlin, Berlin, Germany; 4Institute of Biometry and Clinical Epidemiology, Charité – Universitätsmedizin Berlin, Humboldt-Universität Zu Berlin, and Berlin Institute of Health, Berlin, Germany; 5Department of Radiology and Biomedical Imaging, Yale School of Medicine, New Haven, CT, USA
*These authors contributed equally to this work
Correspondence: Lynn Jeanette Savic, Department of Radiology, Campus Virchow-Klinikum, Charité – Universitätsmedizin Berlin, Corporate Member of Freie Universität Berlin and Humboldt Universität zu Berlin, Augustenburger Platz 1, Berlin, 13353, Germany, Email [email protected]
Purpose: To identify disease-specific profiles comprising patient characteristics and imaging biomarkers on contrast-enhanced (CE)-computed tomography (CT) that enable the non-invasive prediction of the hepatopulmonary shunt fraction (HPSF) in patients with hepatocellular carcinoma (HCC) before resin-based transarterial radioembolization (TARE).
Patients and Methods: This institutional review board-approved (EA2/071/19) retrospective study included 56 patients with HCC recommended for TARE. All patients received tri-phasic CE-CT within 6 weeks prior to an angiographic TARE evaluation study using technetium-99m macroaggregated albumin. Imaging biomarkers representative of tumor extent, morphology, and perfusion, as well as disease-specific clinical parameters, were used to perform data-driven variable selection with backward elimination to generate multivariable linear regression models predictive of HPSF. Results were used to create clinically applicable risk scores for patients scheduled for TARE. Additionally, Cox regression was used to identify independent risk factors for poor overall survival (OS).
Results: Mean HPSF was 13.11% ± 7.6% (range: 2.8– 35.97%). Index tumor diameter (p = 0.014) or volume (p = 0.034) in combination with index tumor non-rim arterial phase enhancement (APHE) (p < 0.001) and washout (p < 0.001) were identified as significant non-invasive predictors of HPSF on CE-CT. Specifically, the prediction models revealed that the HPSF increased with index lesion diameter or volume and showed higher HPSF if non-rim APHE was present. In contrast, index tumor washout was associated with decreased HPSF levels. Independent risk factors of poorer OS were radiogenomic venous invasion and ascites at baseline.
Conclusion: The featured prediction models can be used for the initial non-invasive estimation of HPSF in patients with HCC before TARE to assist in clinical treatment evaluation while potentially sparing ineligible patients from the angiographic shunt evaluation study.
Keywords: HCC, TARE, SIRT, liver cancer, contrast-enhanced computed tomography
Introduction
Hepatocellular carcinoma (HCC) is the sixth most common malignancy and the third leading cause of cancer-related deaths worldwide, with over 830,000 deaths per year.1 Among patients with HCC, approximately 70% are diagnosed at an intermediate to advanced disease stage when curative resection, ablation, or transplant are no treatment options anymore.2 In this context, Yttrium-90 transarterial radioembolization (Y90-TARE) has become widely used for the treatment of advanced HCC (Barcelona Clinic Liver Cancer (BCLC) stage B and C disease). Additionally, it has proven to be as effective as transarterial chemoembolization (TACE) in BCLC stage 0 patients.3,4 The rationale of TARE is based on the effects of locally delivered high doses of radiation to the treated liver lobe while limiting systemic toxicity. However, given the small size and the severe radiation potency of Y90-microspheres, adverse events following unintended extrahepatic deployment can lead to major complications, including the development of gastroduodenal ulcers or pneumonitis.5–8
Tumor extent and vascular supply are usually assessed on contrast-enhanced (CE)-computed tomography (CT) or magnetic resonance imaging (MRI) prior to treatment. With increasing tumor size, there is an isochronous demand for additional blood supply, resulting in tumor-induced, disorganized tumoral angiogenesis. The median diameter of Y90 particles is 32.5 μm (range: 20–60 μm). Therefore, they typically cannot pass-through capillaries (diameter: 8–10 μm). However, in the disorganized angiogenesis of tumor growth, these particles may pass through intratumoral arteriovenous shunts, enter the systemic venous circulation via the hepatic vein, and lodge in the capillaries of the lung. This phenomenon is termed hepatopulmonary shunting (HPS).9
Hence, all patients must be subjected to a TARE evaluation study, including an angiography and single-photon emission computed tomography (SPECT) using9 Technetium macro-agglutinated albumin (99mTc-MAA) to I) quantify the HPS fraction (HPSF), II) foretell the spread of 90Y microspheres/identify non-target depositions, and III) possibly embolize extrahepatic vessels at risk for non-target microsphere administration.10–14
HPSF of up to 10% is generally considered as not substantially increased or absence of pathologic shunting, whereas shunting of 10–20% increases the risk of adverse events, and thus, dose reduction may be required.15 HPSF elevation is observed in up to 30% of HCCs, and up to 5% of Y90-TARE candidates require activity reduction or therapy deferment.16,17 Elevation of the HPSF to greater than 20% or to a level that causes non-target lung radiation doses greater than 30 Gy in a single Y90-TARE procedure or more than 50 Gy in multiple Y90-TARE sessions represent contraindications to resin- and glass-microsphere TARE, respectively.18,19
However, the TARE evaluation study requires invasive angiography, is costly, involves additional radiation exposure, and may result in treatment delay. Thus, there is an unmet clinical need for a non-invasive, faster method for predicting HPSF to ultimately reduce the total time between diagnosis and treatment and protect ineligible patients from unnecessary interventions. In this context, preprocedural CE-CT imaging could be exploited to identify noninvasive imaging biomarkers, that not only enable the diagnosis of HCC but also correlate with arteriovenous shunting and subsequently higher HPSF.
Therefore, this study aimed to explore the ability of CE-CT imaging biomarkers and disease-related clinical patient parameters to predict the HPSF in patients with HCC before Y90-TARE and to investigate the relationship between those characteristics and patient survival.
Materials and Methods
This study protocol was reviewed and approved by the institutional review board of the Charité – Universitätsmedizin Berlin (approval number: EA2/071/19), and written informed consent was waived given the retrospective study design. The study was conducted in compliance with the Declaration of Helsinki and honors the herein defined data confidentiality of research subjects. Prediction of the HPSF and OS following Y90-TARE was defined as primary and secondary endpoints, respectively.
Study Cohort and Inclusion/Exclusion Criteria
In total, 71 patients with HCC recommended for Y90-TARE by the institution’s multidisciplinary tumor board were identified in our internal database between 2008 and 2013. Patients were considered eligible for Y90-TARE with an initial Eastern Cooperative Oncology Group performance (ECOG) status ≤2, serum bilirubin <2 mg/dL, and tumor burden <70%. Exclusion criteria comprised additionally reported primary malignancies, missing CE-CT within 6 weeks prior to Y90-TARE, or insufficient imaging quality of CE-CT, such as interfering artifacts or missing sequences.
Computed Tomography Imaging Protocol
All patients received CE-CT within 6 weeks prior to the TARE evaluation study. Liver CT examinations were performed on a GE VCT 64 scanner (GeneralElectric, Fairfield, Connecticut, USA) after the intravenous injection of iodinated contrast medium (Xenetix 350, Guerbet, Villepinte, France). A triphasic liver CT protocol was employed, including the arterial (20 s), portal venous (70 s), and delayed phase (180 s) after contrast administration. The arterial phase scan was triggered with a 5 s delay after a threshold of 250 HU was observed at the level of the upper abdominal aorta. The portal venous and venous phases were triggered with delays of 35 s and 75 s, respectively.
Computed Tomography Image Analysis and Identification of Imaging Markers
CE-CT image analysis comprised the assessment of HCC perfusion characteristics on contrast-enhanced phases, including the Liver Imaging Reporting And Data System (LI-RADS) features non-rim arterial phase enhancement (APHE), non-peripheral washout, and tumor capsule, as well as rim APHE, peri-tumoral enhancement, and radiogenomic venous invasion (RVI).20 The RVI status was calculated with a three-trait decision tree, including the imaging biomarkers internal arteries, hypodense halo, and tumor-liver difference on venous phase CE-CT, according to Banerjee et al.21 Internal arteries were additionally assessed on the arterial phase. HCC characteristics were reported for the lesion with the largest diameter on axial arterial phase CT images (index lesion). Additionally, portal vein occlusion, thrombosis, or compression were reported and classified as central right, left, or segmental, respectively. The number of intrahepatic HCC lesions was counted and patients were divided into groups with 1, 2, 3, 4, 5, 6–10, >10–20, >20–30, or >30 lesions, respectively. The tumor growth pattern was classified as infiltrative/ill-delineated, nodular/delineated, or cirrhotomimetic according to the tumor presentation and enhancement characteristics of the index lesion.22 Examples of different HCC growth patterns and imaging markers evaluated in this study are shown in Figure 1. The overall 2-dimensional (2D) liver tumor extent was also assessed, considering the sum of maximum diameter of up to five lesions measured on axial arterial phase CT images. If more than five lesions were present, the five largest lesions were considered for further analysis. Also, extrahepatic tumor manifestations, such as lymph node metastases, were reported.
 |
Figure 1 Contrast-enhanced axial CT images of the liver in (A–C) display arterial and venous sequences of patients with different growth patterns and imaging biomarkers of hepatocellular carcinoma (HCC): non-rim arterial phase enhancement (arrow), washout with tumor-liver difference (dotted arrow), internal tumor arteries (arrowheads), tumor capsule (*), hypodense halo (†), peri-tumoral enhancement (‡), and index tumor (dotted circle). |
Besides 2D analyses, lesion volumes on CE-CT were assessed by 3D lesion segmentation using the Medical Imaging Interaction Toolkit (MITK; v. 2021.10, German Cancer Research Center, Division of Medical Image Computing, Heidelberg, Germany) and 3D Slicer (v. 4.10.2) in consensus readings of two radiologists with five (CAH) and eight years (LJS) experience in abdominal imaging, respectively. Specifically, the five largest lesions were segmented on arterial, portal venous, and venous CE-CT sequences (see Figure 2). For every lesion, the average of the generated tumor volumes across all three CE-CT sequences was calculated to determine the index lesion volume and the total 3D liver tumor burden (sum of volumes of the five largest lesions).
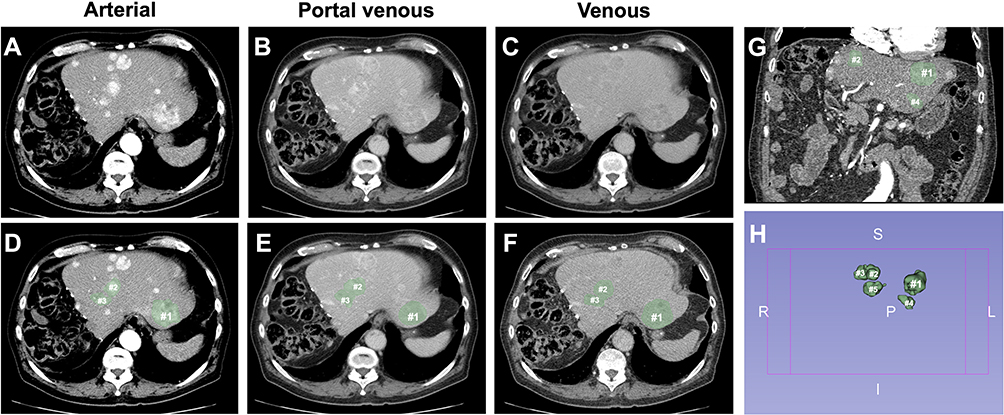 |
Figure 2 Overview of the segmentation process in a 79-year-old patient with multiple cirrhotomimetic hepatocellular carcinoma liver lesions (>30 in total). The five largest lesions in diameter (#; index lesion marked as #1) were segmented to analyze the volume. (A–C) display axial arterial, portal venous, and venous CE-CT sequences without tumor masks, while (D–F) include the generated tumor segmentations (green masks). Finally, (G) shows the coronal view of the liver with tumor masks of three of the largest HCC lesions, while (H) shows the 3D tumor masks of the five largest HCC lesions (abbreviations in (H): R = right, L = left, S = superior, I = inferior). |
Basic and Disease-Specific Patient Characteristics
Patient and disease-specific characteristics and treatment protocols assessed in this study are detailed in Table 1. Disease-specific non-imaging patient characteristics included BCLC stage, Child–Pugh class, ECOG status, underlying disease, extrahepatic disease, and α-fetoprotein level.
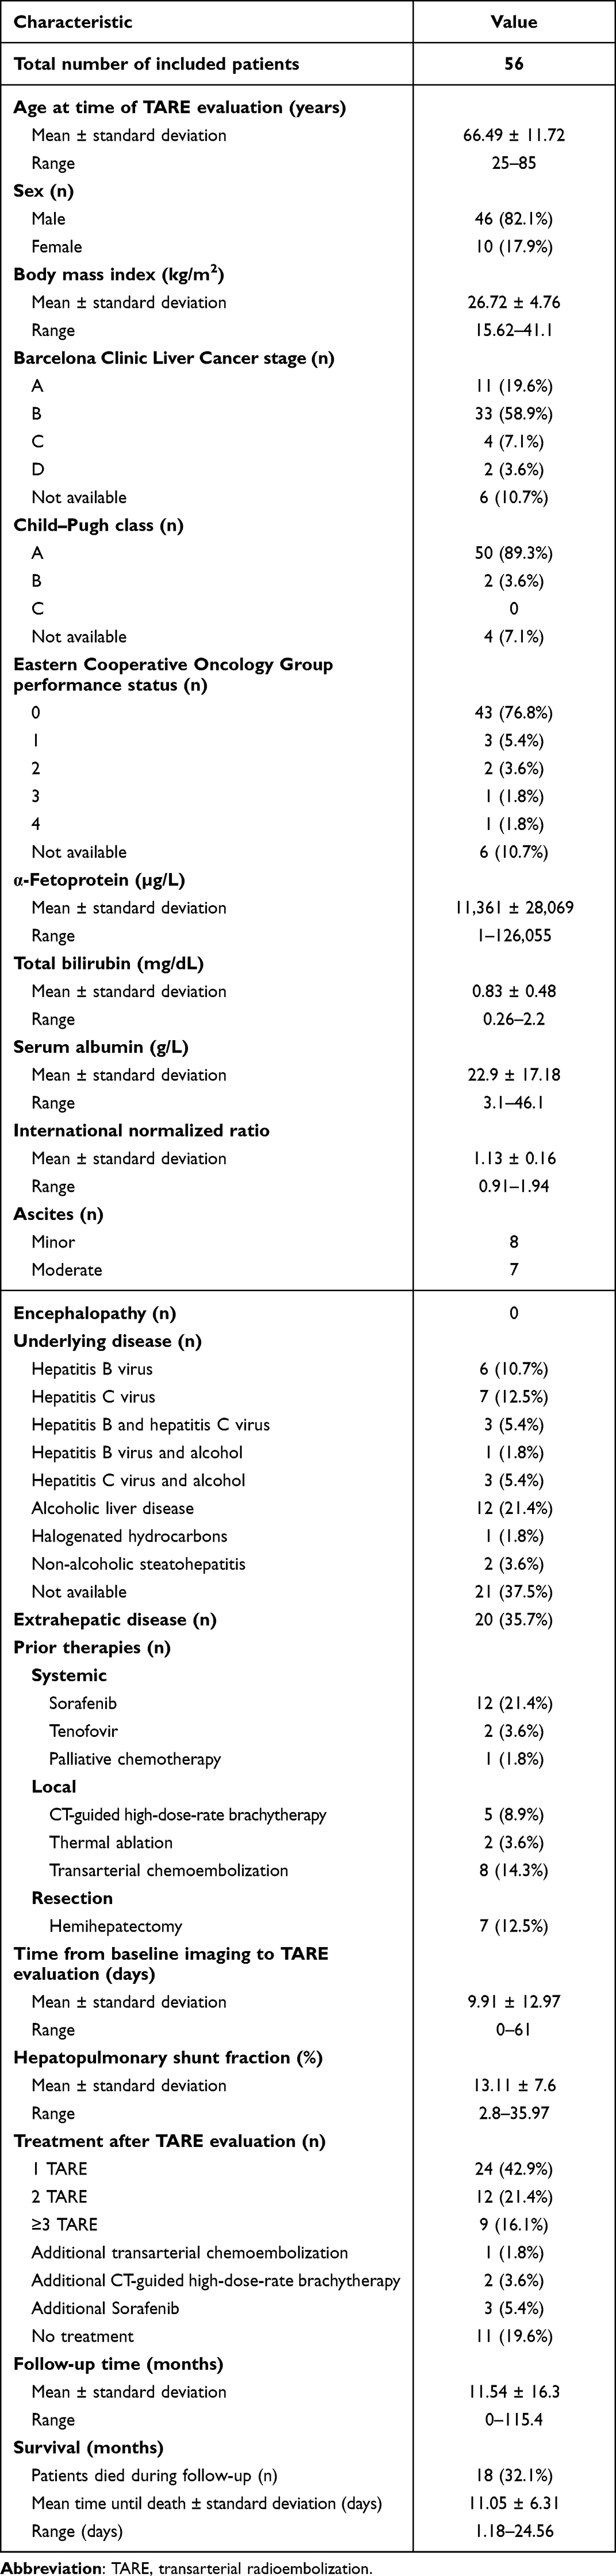 |
Table 1 Patient and Disease-Specific Characteristics and Treatment Data |
Transarterial Embolization Evaluation Study
Angiography
Patients were evaluated by angiography, performed on a flat-panel angiography system (Allura XPER FD20, Philips, Best, Netherlands) via transfemoral access. After a 4F catheter was placed in the coeliac trunk, a 2.5F microcatheter was inserted via a guidewire. If necessary, embolization of the right gastric artery or gastroduodenal artery was performed with coils. The administration of technetium-99m macroaggregated albumin (Tc-99m MAA; Draximage® MAA, Jubilant Draximage Inc., Kirkland, Canada) with an activity of approximately 150–175 MBq was performed via the microcatheter into the left and right hepatic artery as well as the segment IV artery if exclusive. Finally, the catheter was removed. Bleeding from the puncture site was prevented by manual compression and a pressure dressing for 24 hours.
Single-Photon Emission Computed Tomography Imaging
Immediately after angiography, whole-body single-photon emission computed tomography (SPECT) imaging (Symbia T6, Siemens, Munich, Germany) was performed. Intrahepatic and extrahepatic tracer dispersion was assessed and reported. To calculate the percentage of HPS, regions of interest were drawn around the liver and both lungs, and geometric means were obtained. According to the manufacturer’s guidelines (Sirtex Medical Limited, Woburn, MA, USA), the HPSF was calculated by dividing the geometric mean of the net counts from the lungs by the sum of the geometric means of the net counts from the lungs and liver:

Statistical Analysis
Mean, standard deviation, and range were utilized to describe continuous variables. Frequency and percentages were reported for nominal/categorical data.
All imaging markers and disease-specific patient characteristics obtained were considered in the prediction of HPSF. Multicollinearity between variables was investigated using Pearson’s correlation coefficient. Variables were modified or analyzed in separate regression models if a very strong correlation of r ≥0.8/≤-0.8 occurred.25 A data-driven variable selection using backward elimination was performed to identify multivariable linear regression models predictive of HPSF. Variables with a P-value of ≥0.1 were excluded at each stage of multivariable analysis. Furthermore, to identify independent risk factors of OS, univariable/multivariable backward Cox regression was performed. Variables were included for multivariable Cox regression if the P-value was <0.01 in univariable analysis. Receiver operating characteristic (ROC) curve analysis with Youden’s Index was used to identify HPSF cut-off values for OS. Kaplan–Meier survival analysis and logrank test were performed to compare OS in patients with HPSF values of ≥10% with <10%. A two-sided asymptotic P-value of <0.05 was deemed significant. Statistical analysis was conducted with SPSS Statistics 25 (IBM, Armonk, New York, USA).
Results
Study Population
Fifteen patients were excluded from analysis due to missing CE-CT sequences (venous phase (N=4), portal venous phase (N=1), arterial phase (N=1), and all phases (N=9)). Accordingly, 56 patients were included with a mean HPSF of 13.11% ± 7.6% (range: 2.8–35.97%). Forty-five patients received at least one Y90-TARE after evaluation, while 11 patients did not undergo treatment due to progressive liver failure or pathological HPSF. Patients who did not undergo Y90-TARE had a mean HPSF of 22.39% ± 9.48% (range: 4.4–35.97%) versus 10.84% ± 5% (range: 2.8–29.5%) in patients who received Y90-TARE treatment. On pre-treatment CE-CT, patients had 1 (N=15), 2 (N=1), 3 (N=12), 4/5 (N=2 each), 6–10 (N=9), >10–20 (N=4), >20–30 (N=8), or >30 (N=3) HCC lesions. Twenty patients had extrahepatic tumor manifestations, including lymph node metastases (N=17), lung metastases (N=3), and one case with additional metastases to the right adrenal gland. The mean diameter of the index tumor was 9.67 cm ± 4.41 cm, with an average tumor volume of 404.05 cm3 ± 464.24 cm3. When considering up to five largest lesions, mean diameter was 16.81 cm ± 7.55 cm and mean volume 461.05 cm3 ± 518.09 cm3. Most patients presented a BCLC B (N=33) and Child–Pugh A (N=50) stage disease, while data were missing for six and four patients, respectively, because ECOG status (N=6) or serum albumin level (N=4) were not available. Furthermore, alcoholic liver disease was the most common cause of HCC (N=12, 21.4%), while the underlying disease was not available for 21 patients. Please refer to Tables 1 and 2 to view all obtained patient and disease-specific characteristics, as well as treatment and imaging data.
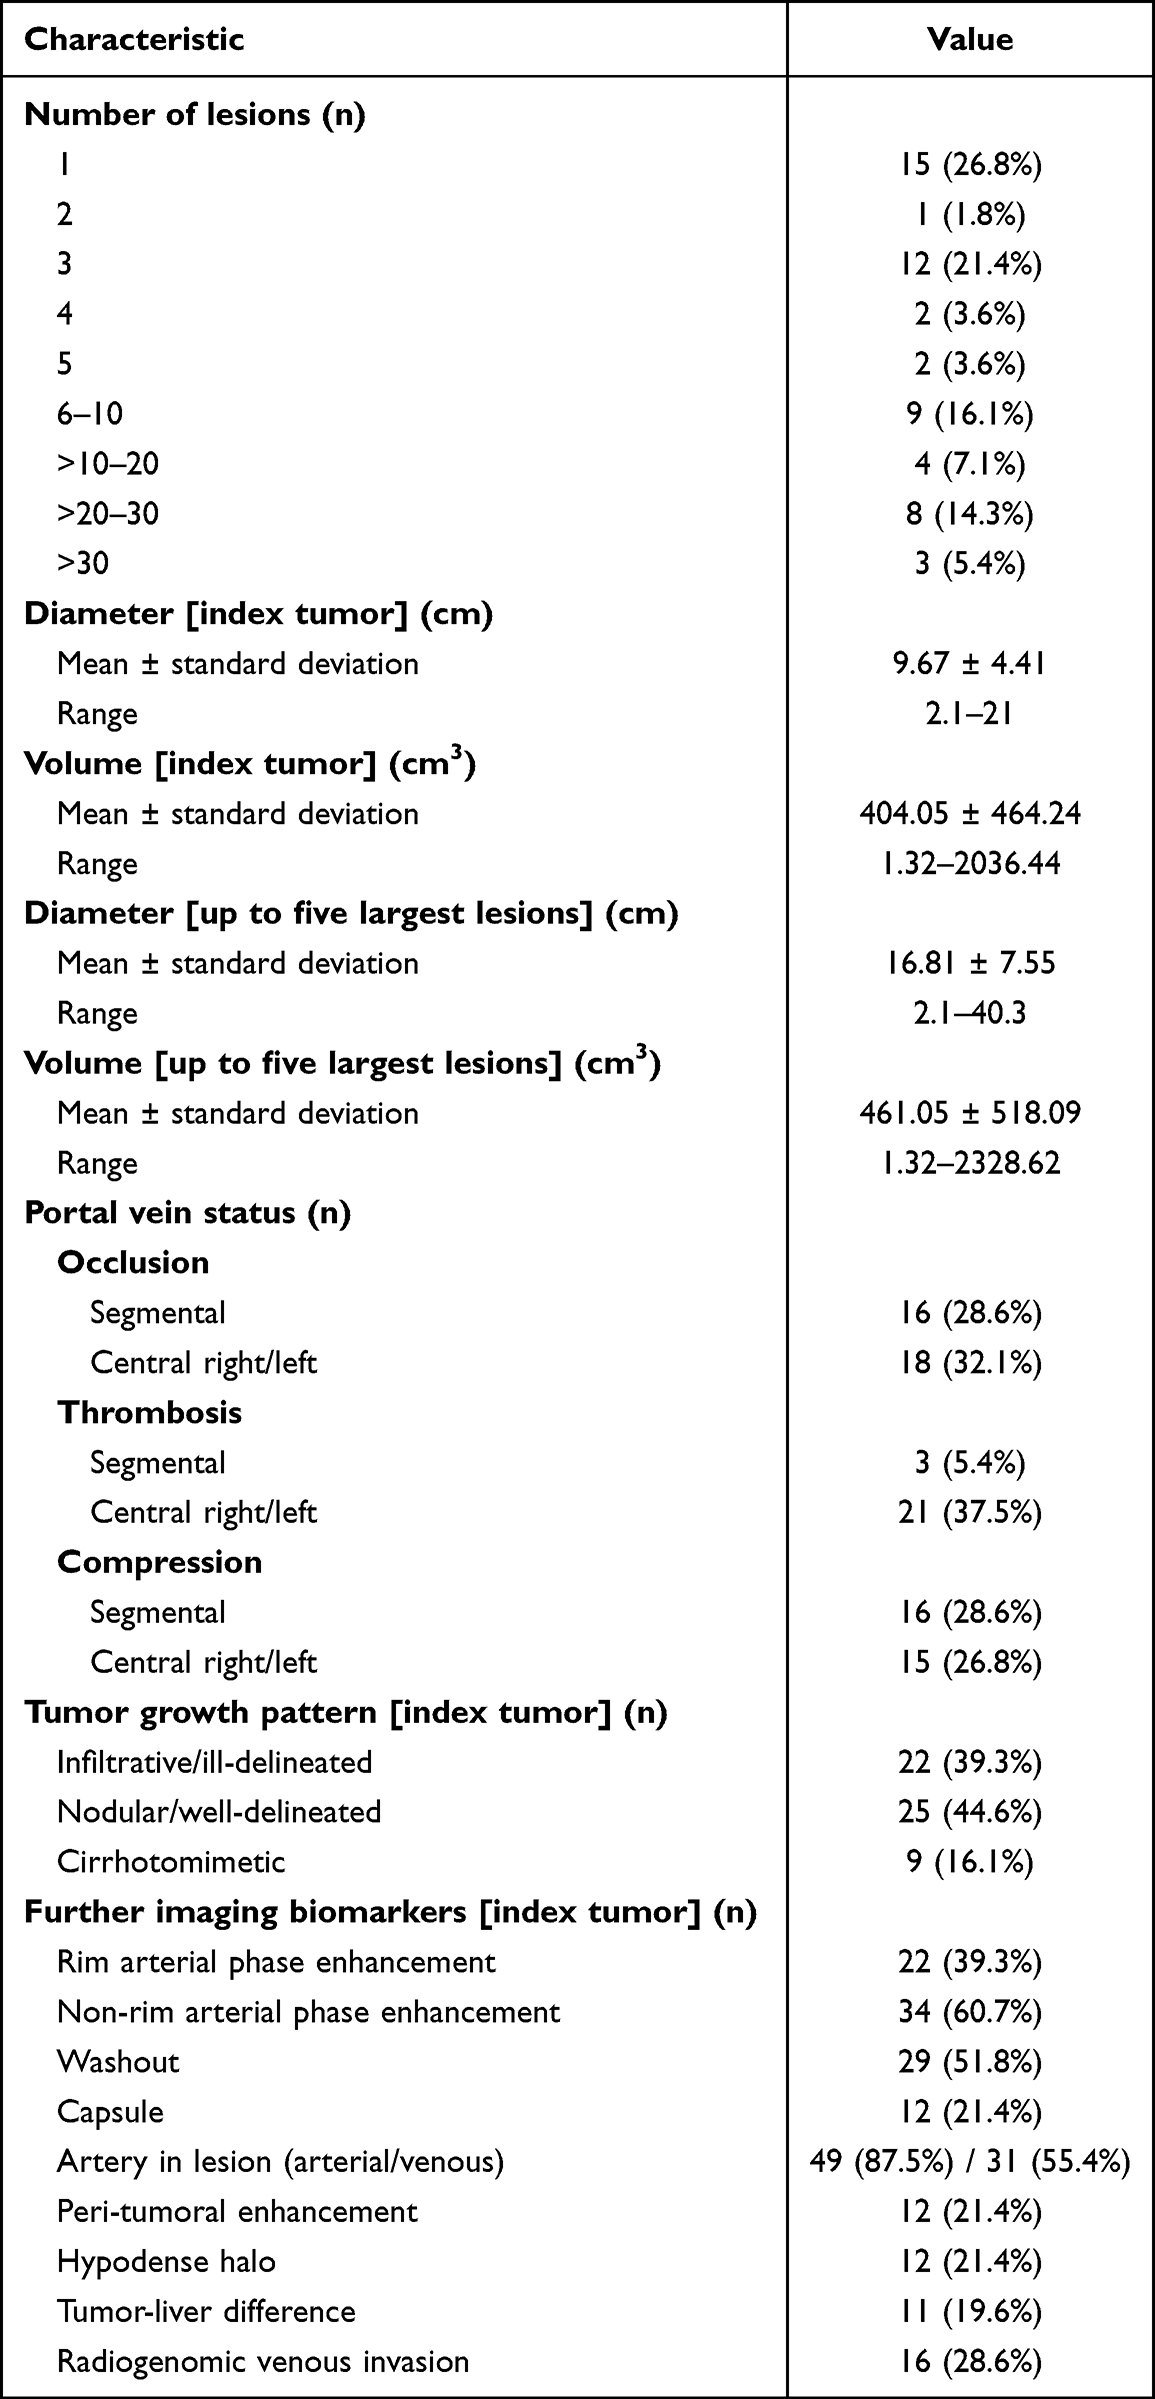 |
Table 2 Imaging Biomarkers and Tumor Characteristics on Tri-Phasic Contrast-Enhanced CT within six Weeks Before Hepatopulmonary Shunt Evaluation Study |
Models to Predict the Hepatopulmonary Shunt Fraction
Model Development and Variable Preparation
Multicollinearity was identified between portal vein thrombosis/portal vein occlusion (r=0.828, p<0.001), rim APHE/non-rim APHE (r=0.821, p<0.001), and volume of index tumor/volume of up to five largest lesions (r=0.957, p<0.001). Therefore, portal vein occlusion/thrombosis/compression was summarized into one nominal variable (portal vein patency affected yes/no), where no portal vein patency corresponds to an impairment of physiological blood flow due to compression, thrombosis, or occlusion. Tumor rim APHE as no major LI-RADS criteria of HCC was excluded for analysis. To investigate if the segmentation of tumor volume is necessary or whether measuring the diameter of the index tumor or five largest lesions is already sufficient for predicting the HPSF, diameter and volume of the index tumor/five largest lesions were analyzed in different regression models despite the absence of multicollinearity. To keep the prediction models as simple as possible, diameter or volume of the index lesion rather than diameter or volume of the five largest lesions were considered first for analysis.
Prediction Models
Please refer to Table 3 to view the statistical summary of all regression models.
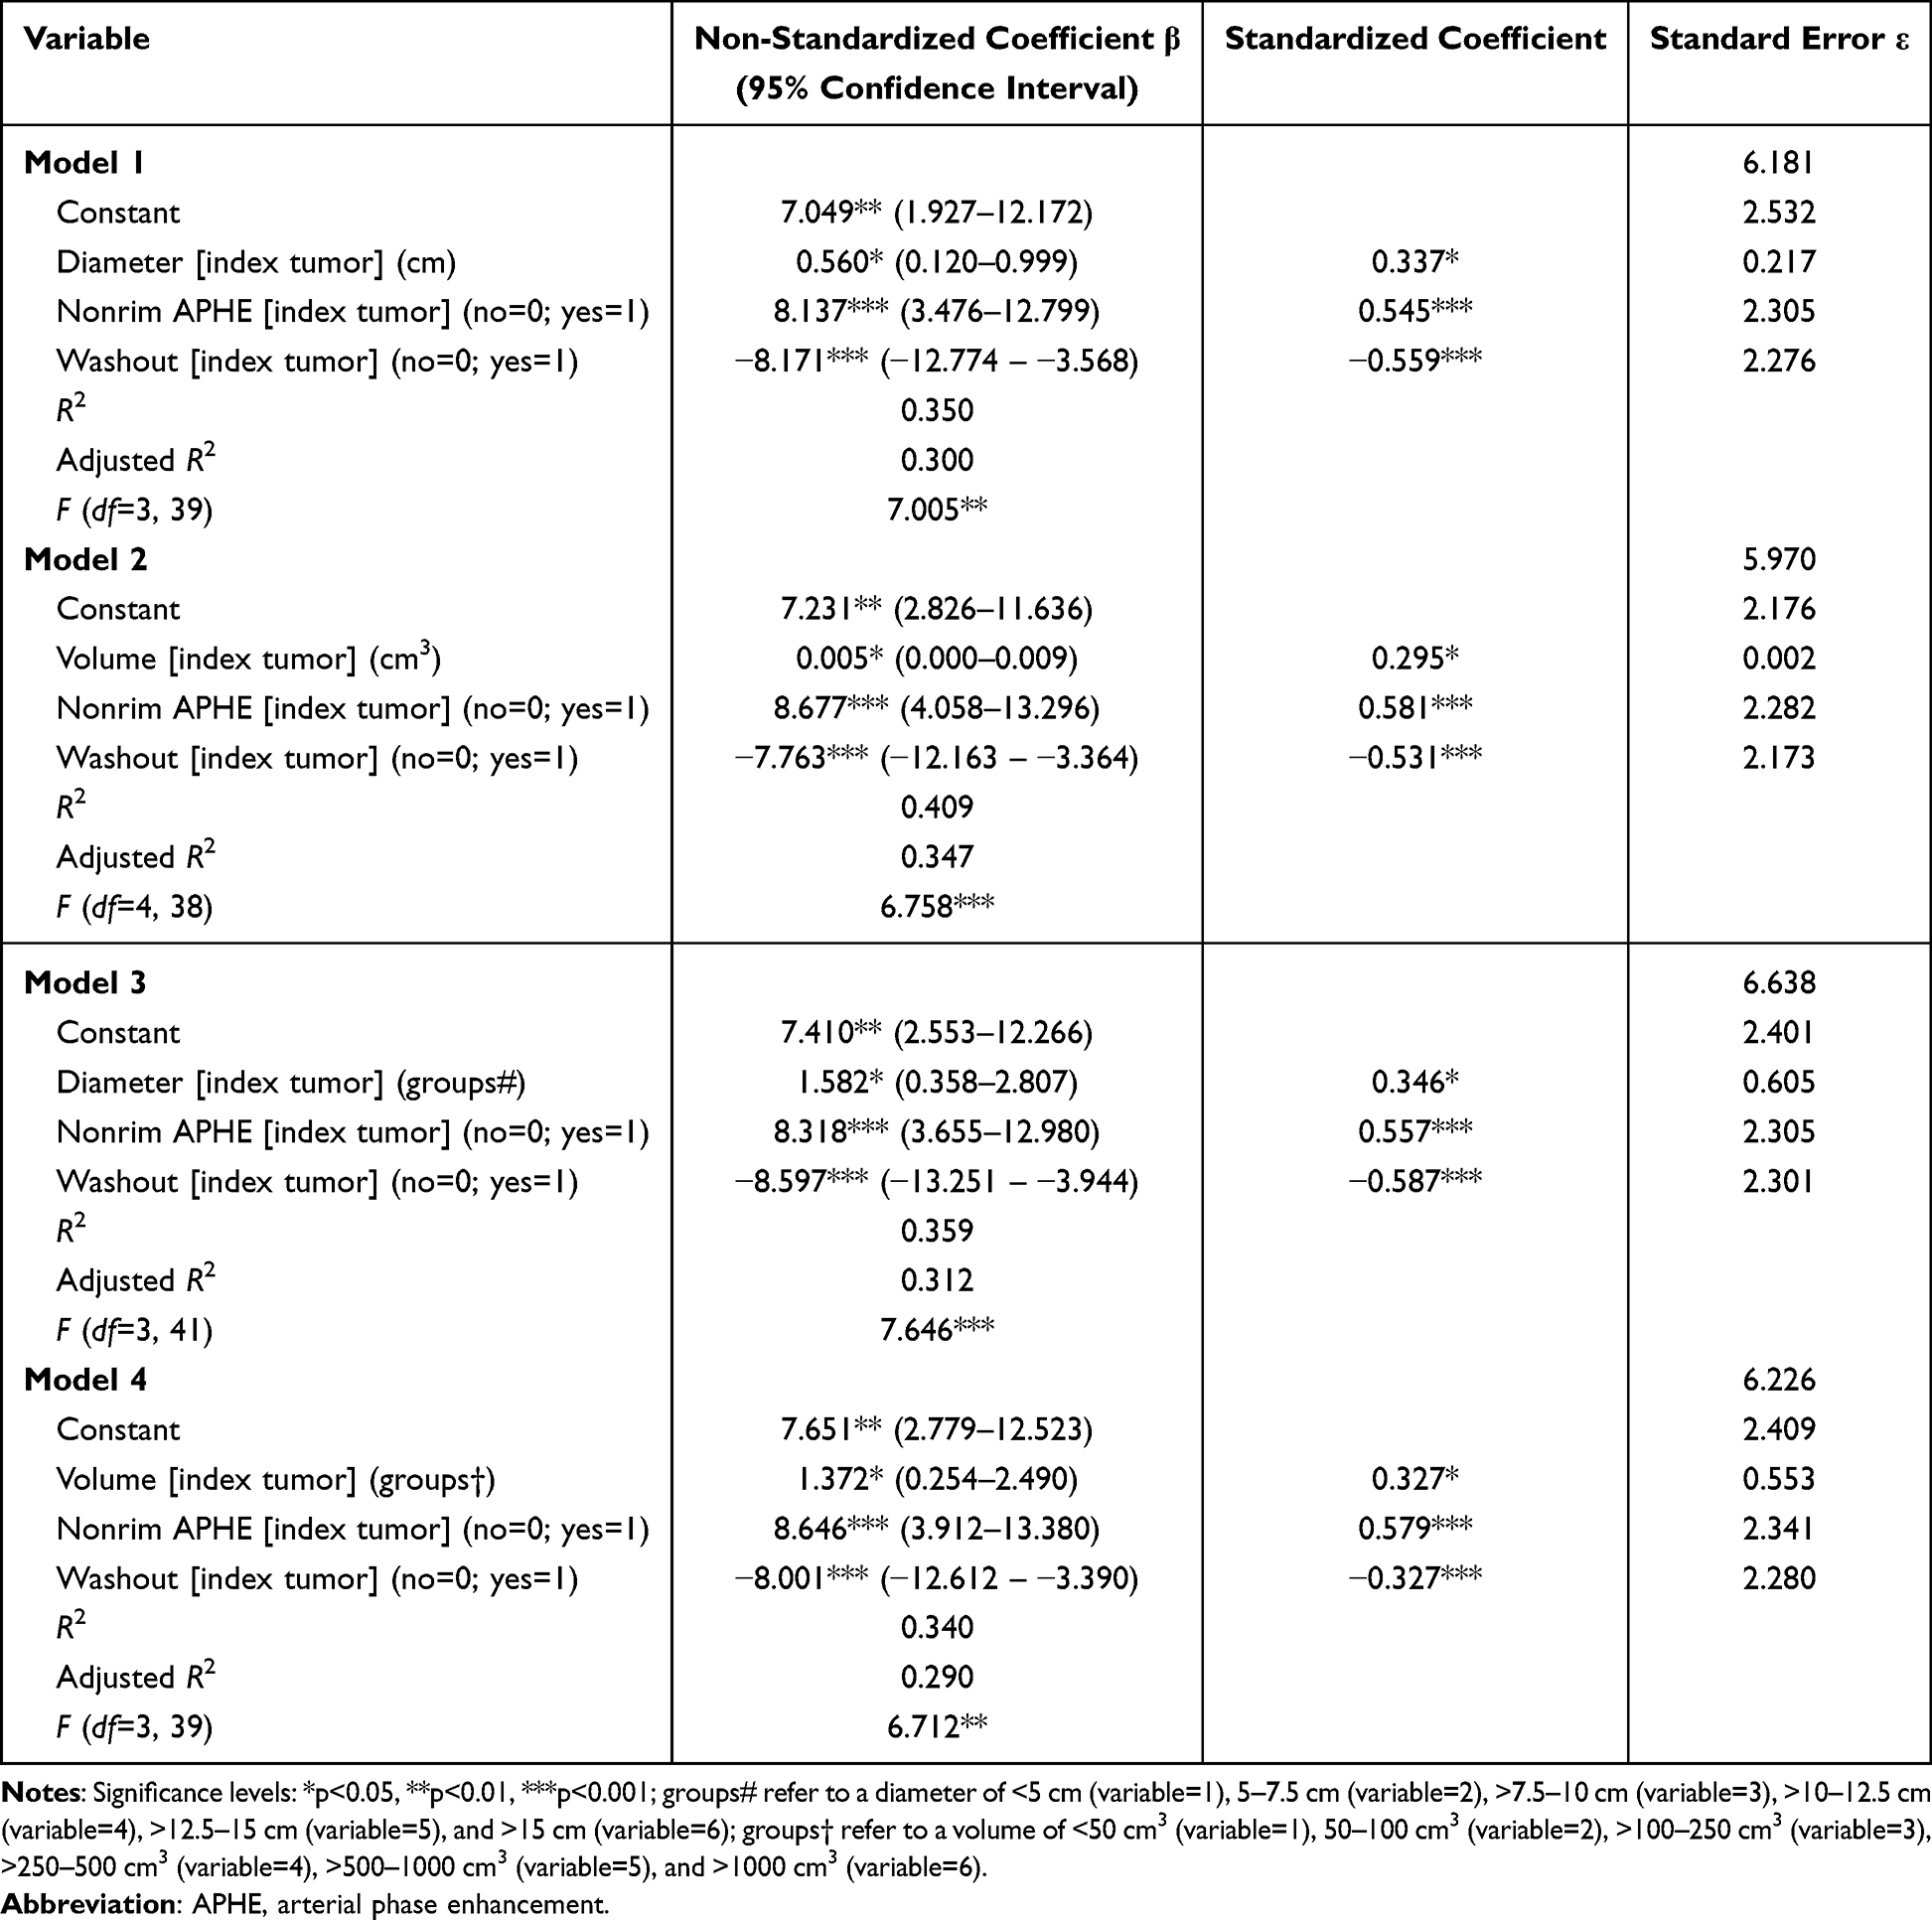 |
Table 3 Summary of Regression Models to Predict the Hepatopulmonary Shunt Fraction Including Constants, Significant Variables, Non-Standardized Coefficients, Standardized Coefficients, Standard Error, R2, Adjusted R2, and F-Statistics |
Using 1) diameter or 2) volume of the index lesion as specifications revealed the following models to predict HPSF:
Model 1: Diameter of index tumor (β1 = 0.560 (95% confidence interval (CI), 0.120–0.999); p=0.014), non-rim APHE (β2 = 8.137 (95% CI, 3.476–12.779); p<0.001), and washout (β3 =−8.171 (95% CI, −12.774 – −3.568); p<0.001) were identified as variables to predict the HPSF in patient i:

Model 2: Volume of index tumor (β1 = 0.005 (95% CI, 0.000–0.009); p=0.034), non-rim APHE (β2 = 8.677 (95% CI, 4.058–13.296); p<0.001), and washout (β3 = −7.763 (95% CI, −12.16 – −3.364); p<0.001) were identified as variables to predict the HPSF in patient i:

Development of a Clinically Applicable Risk Score
Aiming to develop a clinically applicable risk score to predict the HPSF before Y90-TARE non-invasively, index tumor diameter and volume were stratified into groups. Index tumor diameter was categorized as <5 cm (N=10), 5–7.5 cm (N=12), >7.5–10 cm (N=6), >10–12.5 cm (N=15), >12.5–15 cm (N=7), and >15 cm (N=6) (see Table 3, model 3). For index tumor volume, patients were stratified into groups of <50 cm3 (N=13), >50–100 cm3 (N=7), >100–250 cm3 (N=9), >250–500 cm3 (N=9), >500–1000 cm3 (N=12), and >1000cm3 (N=6) (see Table 3, model 4). Analogous to models 1) and 2), the index tumor diameter or volume group stratification together with non-rim APHE and washout were significant predictors of the HPSF. Finally, the HPSF prediction models developed were converted into clinically applicable risk scores to assess the need for dose adjustments or the presence of a contraindication to Y90-TARE according to the manufacturer Sirtex Medical Limited/S1-Guideline selective intra-arterial radiotherapy (SIRT) of malignant liver tumors of the German Society for Nuclear Medicine (Figures 3 and 4).15
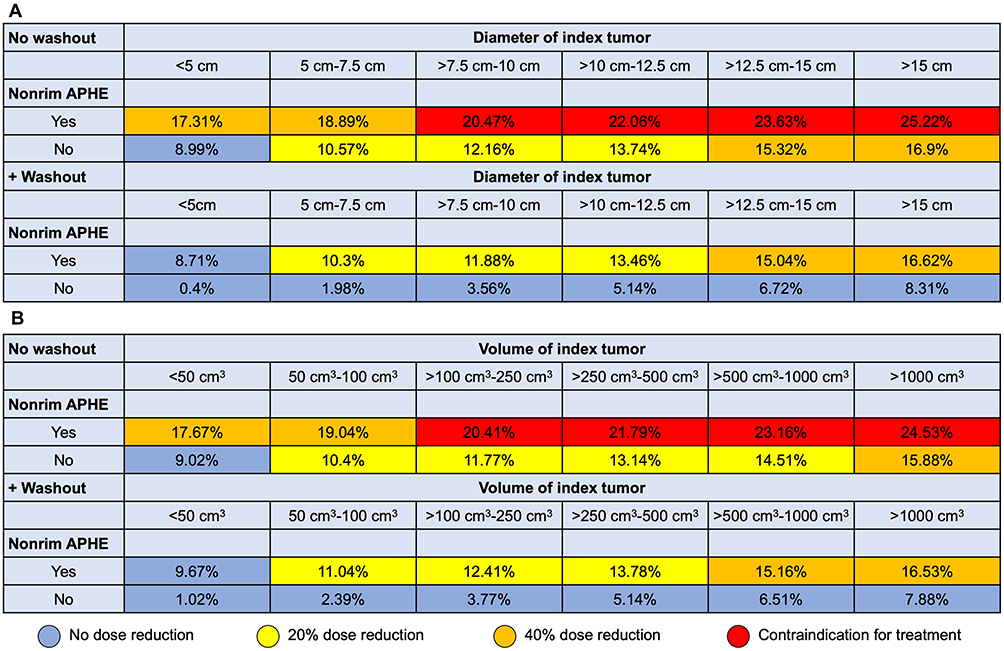 |
Figure 3 Risk scores illustrating the predicted hepatopulmonary shunt fraction using non-invasive biomarkers on contrast-enhanced CT. Models included diameter of index tumor (A) or volume of index tumor (B), index tumor non-rim arterial phase enhancement (APHE), and washout. Recommendations regarding dose reduction and contraindications for the administration of yttrium-90 microspheres are based on the recommendations of the manufacturer Sirtex Medical Limited/S1-Guideline selective intra-arterial radiotherapy (SIRT) of malignant liver tumors of the German Society for Nuclear Medicine.15 |
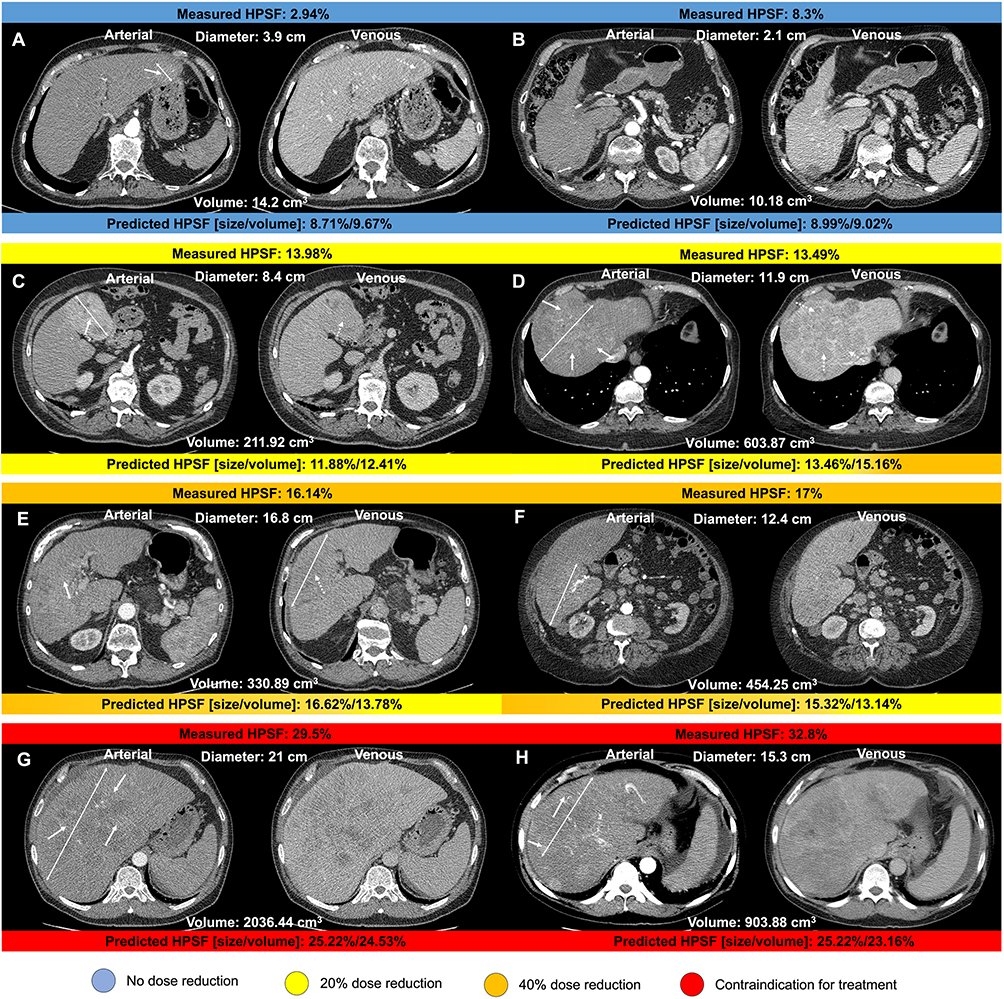 |
Figure 4 Arterial and venous axial contrast-enhanced CT images displaying hepatocellular carcinoma lesions (two-sided arrows indicate the maximum diameter of the index lesion) of patients recommended for transarterial radioembolization. Hepatopulmonary shunt fraction (HPSF) measured following angiography is shown above each image. Predicted HPSF using the predictive model based on imaging and clinical disease-specific parameters are shown below each image. Examples of non-rim arterial phase enhancement and washout are indicated by solid and dotted arrows, respectively. Recommendations for dose reduction and contraindications for yttrium-90 microspheres administration are color-coded. HPSF displayed in (A and B) resulted in no dose reduction; HPSF displayed in (C and D) resulted in 20% dose reduction; HPSF displayed in (E and F) resulted in 40% dose reduction; HPSF displayed in (G and H) were interpreted as a contraindication for treatment.15 |
Overall Survival Analysis
In univariable Cox regression, HPSF (hazard ratio (HR), 1.05 (95% CI, 1.00–1.1); p=0.036), RVI (HR, 2.68 (95% CI, 1.34–5.39); p=0.005), portal vein thrombosis (HR, 1.45 (95% CI, 1.04–2.04); p=0.031), ascites grade (HR, 3.17 (95% CI, 1.91–5.25); p<0.001), volume of index tumor (HR, 1.00 (95% CI, 1.00–1.00); p=0.012), and volume of five largest lesions (HR, 1.00 (95% CI, 1.00–1.00); p=0.008) were identified as risk factors for reduced OS. Multivariable Cox regression, including HPSF, RVI, portal vein thrombosis, ascites grade, volume of index tumor (model A) or volume of five largest lesions (model B), revealed RVI (HR, 2.11 (95% CI, 1.01–4.43); p=0.048 in both models) and ascites grade (HR, 2.86 (95% CI, 1.70–4.83); p<0.001 in both models) as the only significant independent risk factors of poorer OS.
The HPSF was not significantly associated with reduced OS (model A: HR, 1.00 (95% CI, 0.95–1.05); p=0.947; model B: HR, 1.00 (95% CI, 0.95–1.05); p=0.950). Furthermore, no significant HPSF cut-off value could be identified in ROC analysis to predict OS (area under curve, 0.64 (95% CI, 0.49–0.79); p=0.096). Additionally, using 10% as an empirical cut-off value for HPSF, we compared patients with abnormal HPSF values of ≥10% (N=30; mean OS: 25.55 months (95% CI, 7.57–43.52)) versus patients with <10% HPSF (N=26; mean OS: 16.15 months (95% CI, 10.43–21.86)), which also resulted in no significant difference in OS (p=0.333).
Discussion
This study utilized multivariable linear regression models to develop two clinical risk scores using CE-CT imaging biomarkers that enable the non-invasive prediction of the HPSF in patients with HCC prior to Y90-TARE. Among all imaging and clinical patient characteristics, diameter or volume of the index lesion in combination with index tumor non-rim APHE and washout were identified as predictors of the HPSF. Specifically, HPSF increased with index tumor diameter and volume, respectively, and the presence of index tumor non-rim APHE, while tumor washout was associated with reduced shunting. Additional survival analysis revealed ascites grade and RVI at baseline as independent risk factors for poorer OS, but not HPSF.
The higher degree of pulmonary shunting in some patients with liver malignancies is primarily attributed to direct vessel invasion and peritumoral arteriovenous communications.26,27 As tumors grow and remodel the local vasculature, arteriovenous anastomoses would theoretically accumulate over time, and thus more advanced tumors would tend to have greater HPSF. Indeed, associations between HPSF and advanced/aggressive disease have been previously reported.6,28 Furthermore, it may be speculated that peritumoral arteriovenous anastomoses function as conduits for the hematogenous dissemination of micrometastases in these advanced cases, as EpCAM-positive circulating tumor cells have been identified in HCC patients with microscopic vascular invasion.29 However, in our study, the presence of extrahepatic disease could not predict a higher HPSF.
Besides tumor aggressiveness, HPS is likely affected by tumor volume, tumor type, and vascular invasiveness,10,11 which has been previously reported.28,30–32 However, due to heterogeneous data in previous literature, no clinically applicable predictors of HPSF proved feasible for patient selection.32 Therefore, this study aimed to develop clinically applicable risk scores that take tumor extent, morphology, and perfusion as assessed on pre-treatment imaging into account.
Firstly, tumor diameter and volume of HCC and other liver malignancies were shown to be associated with the median HPSF and increased the risk for HPSF >10%, supporting the selection of tumor diameter or tumor volume as one of the three key parameters used in the here presented prediction models.31 Moreover, significantly higher median HPSF levels were previously described in the case of multifocal vs solitary tumors for both HCC (p=0.03) and non-HCC tumors (p=0.01).33 However, the number of HCC lesions did not benefit HPSF prediction in our study. Furthermore, portal venous invasion was reported as an indicator of high HPSF, although it was not predictive of HPSF in our cohort.28,34 Overall, tumor hypervascularity appeared to be the most potent predictor of HPSF in literature, which was confirmed in this study, with index tumor non-rim APHE and washout being significant independent predictors of HPSF. Arterial enhancement indicative of tumor hypervascularity is known to be a key characteristic for the diagnosis and response assessment of HCC and represents a visual explanation for the observation that HCCs have a higher HPSF compared to most non-HCC tumors on average.10,28,35
Studies investigating the impact of HPSF on survival after Y90-TARE are limited, yet, the HPSF has been reported as an independent prognostic factor of poorer OS in patients with liver metastases from pancreatic or carcinoid neuroendocrine tumors after Y90-TARE with a cut-off value of 10%.36,37 Also, HPSF values of ≥10% were significantly associated with poorer OS in patients with colorectal liver metastases (6.9 vs 4.5 months) or HCC (13.5 vs 16.4 months).33,38 Although the univariable analysis in this study revealed a significant association between the HPSF and OS, HPSF was no independent risk factor in multivariable analysis, and no significant cut-off could be determined. Specifically, the direct comparison of patients with HPSF of ≥10% revealed a longer, albeit not significant, OS compared to patients with HPSF <10% (≥10%: 25.55 months; <10%: 16.15 months; p=0.333). Different results compared to the literature may stem from study-specific cohort characteristics and performed treatments during follow-up, including additional TARE, TACE, or Sorafenib treatments. In addition, patients with HPSF of ≥10% or <10% were not matched for baseline, treatment, or tumor characteristics, making a valid comparison impeded.
The indication for Y90-TARE has been extended over the past decade from lobar treatment for advanced HCC to targeted high-dose radioresection for solitary HCC manifestations.34,39,40 Thus, an efficient and accurate patient stratification tool is urgently needed, as a substantial increase in patient referrals for Y90-TARE can be expected. The herein developed predictors for HPSF using CE-CT tumor imaging biomarkers allow for the prediction of low or high HPSF, yet it would be clinically prudent to refrain from performing a 99mTc-MAA shunt study before performing TARE, as it is also required to exclude extrahepatic spread of 90Y microspheres and to possibly embolize extrahepatic vessels at risk for non-target microsphere administration.
However, as 5–14% of the patients considered for TARE are excluded because of an elevated HPSF, non-invasive clinical risk scores, such as those introduced in our study, could spare ineligible patients an invasive shunt examination and radiation exposure while enabling earlier treatment adjustment or recommendations for more appropriate therapies.28 Using CE-CT imaging biomarkers as a pre-assessment method for the HPSF also contributes to the idea of a one-stop-shop concept, which stipulates planning angiography with administration of 99mTc-MAA and TARE as a single session in order to decrease the time between initial clinical assessment and radioembolization, thereby minimizing costs and improving treatment efficacy.41 Patients with a predicted high HPSF could be prioritized for alternative liver-targeted therapies, such as TACE, thereby avoiding the risk associated with a presumably unnecessary TARE-shunt study and potential treatment delay. Moreover, estimation of a fairly high HPSF using biomarkers from preprocedural CE-CT could be used to preemptively highlight the need for attempts to reduce the HPSF during the TARE evaluation study, which may include arterioportal shunt closure.42
While the results are promising, several limitations to this study should be addressed. As a single-center retrospective investigation, only a limited number of patients and imaging studies were available, resulting in a rather small but consecutive study cohort. Although the included data were obtained relatively long ago, the primary endpoint of this study is unlikely to have been compromised, whereas the patient survival data may not be comparable to more recent studies with newer treatment protocols. Furthermore, although the developed models showed significant predictive power, a standard error of 6.638% and 6.226% was observed for each model using index tumor diameter and volume score, respectively. Further, backward elimination based on p-values for variable selection can lead to biased results since important confounders might be dropped due to their insignificance. Prior tumor treatment, including locoregional and systemic therapies, may lead to changes in viable tumor biomarkers. However, the study analysis is based on tumor appearance at the time of Y90-TARE, making the impact on initial tumor appearance negligible if the observed imaging features are predictive of HPSF. Also, lesions with lipiodol deposition from previous TACE treatment were omitted from the analysis. Finally, while the presented study demonstrates feasibility of the HPSF prediction model based on a single-center cohort of a tertiary care center, larger multicenter samples including subgroups of patients undergoing lobar and segmental TARE are needed to validate the approach.
Conclusion
In summary, the developed HPSF risk scores using imaging biomarkers on pre-treatment CE-CT enable reliable and accurate HPSF prediction in patients with HCC recommended for Y90-TARE. Furthermore, using major LI-RADS imaging biomarkers in the presented HPSF prediction models should facilitate clinical applicability with presumably high inter-reader agreement. Finally, the proposed HPSF prediction model could help select HCC patients for Y90-TARE who are most likely to be eligible while sparing other treatment delays and complications, eventually improving patient care.
Data Sharing Statement
All data generated or analyzed during this study are included in this article. Further enquiries can be directed to the corresponding author.
Ethics Approval and Informed Consent
This study protocol was reviewed and approved by the institutional review board of the Charité – Universitätsmedizin Berlin (approval number: EA2/071/19), and written informed consent was waived given the retrospective study design. The study was conducted in compliance with the Declaration of Helsinki and honors the herein defined data confidentiality of research subjects. The retrospective study design, methodology, and outcomes did not pose a risk to the health, privacy, rights, or welfare of study participants.
Author Contributions
All authors made a significant contribution to the work reported, whether that is in the conception, study design, execution, acquisition of data, analysis and interpretation, or in all these areas; took part in drafting, revising or critically reviewing the article; gave final approval of the version to be published; have agreed on the journal to which the article has been submitted; and agree to be accountable for all aspects of the work.
Disclosure
CAH and LJS are fellows of the BIH Charité (Junior Digital) Clinician Scientist Program funded by the Charité– Universitätsmedizin Berlin and the Berlin Institute of Health. Outside the submitted work, LJS receives research grants from the Berliner Krebsgesellschaft e.V., the Collaborative Research Center (CRC) 1340 “Matrix in Vision” funded by the Deutsche Forschungsgemeinschaft (DFG), and Guerbet. BG reports honoraria and travel support in the last 10 years from Parexel/CALYX, C.R. BARD/BD, SIRTex Medical, St. Jude Medical, COOK, AngioDynamics, Pharmcept, Guerbet, Ewimed, Terumo, Roche, Merck, 3M, Beacon Bioscience/ICON, IPSEN, Bayer, Pfizer, Eisai, MSD, and INARI. The author reports no other conflicts of interest in this work.
References
1. Sung H, Ferlay J, Siegel RL, et al. Global cancer statistics 2020: GLOBOCAN estimates of incidence and mortality worldwide for 36 cancers in 185 countries. CA. 2021;71(3):209–249. doi:10.3322/caac.21660
2. Bruix J, Sherman M; Practice Guidelines Committee AAftSoLD. Management of hepatocellular carcinoma. Hepatology. 2005;42(5):1208–1236. doi:10.1002/hep.20933
3. Reig M, Forner A, Rimola J, et al. BCLC strategy for prognosis prediction and treatment recommendation: the 2022 update. J Hepatol. 2021;2021:1.
4. Salem R, Johnson GE, Kim E, et al. Yttrium‐90 radioembolization for the treatment of solitary, unresectable HCC: the LEGACY study. Hepatology. 2021;74(5):2342–2352. doi:10.1002/hep.31819
5. Leung TW, Lau WY, Ho SK, et al. Radiation pneumonitis after selective internal radiation treatment with intraarterial 90yttrium-microspheres for inoperable hepatic tumors. Int J Radiat Oncol Biol Phys. 1995;33(4):919–924. doi:10.1016/0360-3016(95)00039-3
6. Salem R, Parikh P, Atassi B, et al. Incidence of radiation pneumonitis after hepatic intra-arterial radiotherapy with yttrium-90 microspheres assuming uniform lung distribution. Am J Clin Oncol. 2008;31(5):431–438. doi:10.1097/COC.0b013e318168ef65
7. Konda A, Savin MA, Cappell MS, Duffy MC. Radiation microsphere-induced GI ulcers after selective internal radiation therapy for hepatic tumors: an underrecognized clinical entity. Gastrointest Endosc. 2009;70(3):561–567. doi:10.1016/j.gie.2009.03.015
8. Wright CL, Werner JD, Tran JM, et al. Radiation pneumonitis following yttrium-90 radioembolization: case report and literature review. J Vasc Interv Radiol. 2012;23(5):669–674. doi:10.1016/j.jvir.2012.01.059
9. Narsinh KH, Van Buskirk M, Kennedy AS, et al. Hepatopulmonary shunting: a prognostic indicator of survival in patients with metastatic colorectal adenocarcinoma treated with 90Y radioembolization. Radiology. 2017;282(1):281–288. doi:10.1148/radiol.2016152100
10. Leung WT, Lau WY, Ho SK, et al. Measuring lung shunting in hepatocellular carcinoma with intrahepatic-arterial technetium-99m macroaggregated albumin. J Nucl Med. 1994;35(1):70–73.
11. Salem R, Lewandowski RJ, Sato KT, et al. Technical aspects of radioembolization with 90Y microspheres. Tech Vasc Interv Radiol. 2007;10(1):12–29. doi:10.1053/j.tvir.2007.08.001
12. Hoffmann RT, Paprottka PM, Schön A, et al. Transarterial hepatic yttrium-90 radioembolization in patients with unresectable intrahepatic cholangiocarcinoma: factors associated with prolonged survival. Cardiovasc Intervent Radiol. 2012;35(1):105–116. doi:10.1007/s00270-011-0142-x
13. Powerski MJ, Scheurig-Munkler C, Banzer J, Schnapauff D, Hamm B, Gebauer B. Clinical practice in radioembolization of hepatic malignancies: a survey among interventional centers in Europe. Eur J Radiol. 2012;81(7):e804–11. doi:10.1016/j.ejrad.2012.04.004
14. Rodríguez-Lago I, Carretero C, Herráiz M, et al. Long-term follow-up study of gastroduodenal lesions after radioembolization of hepatic tumors. World J Gastroenterol. 2013;19(19):2935–2940. doi:10.3748/wjg.v19.i19.2935
15. Müller SP, Antoch G, Lauenstein T, Amthauer H, Haug AR, Bockisch A. DGN Handlungsempfehlung (S1-Leitlinie): Selektive Intraarterielle Radiotherapie (SIRT) Maligner Lebertumoren. Deutsche Gesellschaft für Nuklearmedizin e.V.; 2014.
16. Ngan H, Peh WC. Arteriovenous shunting in hepatocellular carcinoma: its prevalence and clinical significance. Clin Radiol. 1997;52(1):36–40. doi:10.1016/S0009-9260(97)80303-0
17. Bester L, Salem R. Reduction of arteriohepatovenous shunting by temporary balloon occlusion in patients undergoing radioembolization. J Vasc Interv Radiol. 2007;18(10):1310–1314. doi:10.1016/j.jvir.2007.07.003
18. Murthy R, Nunez R, Szklaruk J, et al. Yttrium-90 microsphere therapy for hepatic malignancy: devices, indications, technical considerations, and potential complications. Radiographics. 2005;25(Suppl 1):S41–55. doi:10.1148/rg.25si055515
19. Loke KS, Padhy AK, Ng DC, Goh AS, Divgi C. Dosimetric considerations in radioimmunotherapy and systemic radionuclide therapies: a review. World J Nucl Med. 2011;10(2):122–138. doi:10.4103/1450-1147.89780
20. Tang A, Bashir MR, Corwin MT, et al. Evidence supporting LI-RADS major features for CT- and MR imaging-based diagnosis of hepatocellular carcinoma: a systematic review. Radiology. 2018;286(1):29–48. doi:10.1148/radiol.2017170554
21. Banerjee S, Wang DS, Kim HJ, et al. A computed tomography radiogenomic biomarker predicts microvascular invasion and clinical outcomes in hepatocellular carcinoma. Hepatology. 2015;62(3):792–800. doi:10.1002/hep.27877
22. Jang JY, Lee JS, Kim H-J, et al. The general rules for the study of primary liver cancer. J Liver Cancer. 2017;17(1):19–44. doi:10.17998/jlc.17.1.19
23. Inc S-STSM. Package insert; 2011.
24. Ho S, Lau W, Leung T, Chan M, Johnson P, Li A. Clinical evaluation of the partition model for estimating radiation doses from yttrium-90 microspheres in the treatment of hepatic cancer. Eur J Nucl Med. 1997;24(3):293–298. doi:10.1007/BF01728766
25. Chan Y. Biostatistics 104: correlational analysis. Singapore Med J. 2003;44(12):614–619.
26. Ziessman HA, Thrall JH, Gyves JW, et al. Quantitative hepatic arterial perfusion scintigraphy and starch microspheres in cancer chemotherapy. J Nucl Med. 1983;24(10):871–875.
27. Mei Q, Li Y. Transcatheter arterial embolization of hepatic arteriovenous shunts in patients with hepatocellular carcinoma. Semin Intervent Radiol. 2012;29(3):237–240. doi:10.1055/s-0032-1326935
28. Gaba RC, Zivin SP, Dikopf MS, et al. Characteristics of primary and secondary hepatic malignancies associated with hepatopulmonary shunting. Radiology. 2014;271(2):602–612. doi:10.1148/radiol.14131969
29. Schulze K, Gasch C, Staufer K, et al. Presence of EpCAM-positive circulating tumor cells as biomarker for systemic disease strongly correlates to survival in patients with hepatocellular carcinoma. Int J Cancer. 2013;133(9):2165–2171. doi:10.1002/ijc.28230
30. Olorunsola OG, Kohi MP, Behr SC, et al. Imaging predictors of elevated lung shunt fraction in patients being considered for Yttrium-90 radioembolization. J Vasc Interv Radiol. 2015;26(10):1472–1478. doi:10.1016/j.jvir.2015.07.009
31. Yerubandi V, Ronald J, Howard BA, et al. Patient and tumor characteristics predictive of an elevated hepatopulmonary shunt fraction before radioembolization of hepatic tumors. Nucl Med Commun. 2016;37(9):939–946. doi:10.1097/MNM.0000000000000528
32. Kallini JR, Gabr A, Hickey R, et al. Indicators of lung shunt fraction determined by Technetium-99 m macroaggregated albumin in patients with hepatocellular carcinoma. Cardiovasc Intervent Radiol. 2017;40(8):1213–1222. doi:10.1007/s00270-017-1619-z
33. Xing M, Lahti S, Kokabi N, Schuster DM, Camacho JC, Kim HS. 90Y radioembolization lung shunt fraction in primary and metastatic liver cancer as a biomarker for survival. Clin Nucl Med. 2016;41(1):21–27. doi:10.1097/RLU.0000000000000915
34. Powerski MJ, Erxleben C, Scheurig-Münkler C, et al. Hepatopulmonary shunting in patients with primary and secondary liver tumors scheduled for radioembolization. Eur J Radiol. 2015;84(2):201–207. doi:10.1016/j.ejrad.2014.11.004
35. Lüdemann W, Kahn J, Pustelnik D, et al. Yttrium-90 radioembolization for unresectable hepatocellular carcinoma: predictive modeling strategies to anticipate tumor response and improve patient selection. Eur Radiol. 2022;2022:1–12. doi:10.1007/s00330-022-08585-x
36. Deipolyi AR, Iafrate AJ, Zhu AX, Ergul EA, Ganguli S, Oklu R. High lung shunt fraction in colorectal liver tumors is associated with distant metastasis and decreased survival. J Vasc Interv Radiol. 2014;25(10):1604–1608. doi:10.1016/j.jvir.2014.06.019
37. Schobert I, Chapiro J, Nezami N, et al. Quantitative imaging biomarkers for 90 Y distribution on bremsstrahlung SPECT after resin-based radioembolization. J Nucl Med. 2019;60:1066–1072. doi:10.2967/jnumed.118.219691
38. Ludwig JM, Ambinder EM, Ghodadra A, Xing M, Prajapati HJ, Kim HS. Lung shunt fraction prior to yttrium-90 radioembolization predicts survival in patients with neuroendocrine liver metastases: single-center prospective analysis. Cardiovasc Intervent Radiol. 2016;39(7):1007–1014. doi:10.1007/s00270-016-1323-4
39. Vilgrain V, Pereira H, Assenat E, et al. Efficacy and safety of selective internal radiotherapy with yttrium-90 resin microspheres compared with sorafenib in locally advanced and inoperable hepatocellular carcinoma (SARAH): an open-label randomised controlled Phase 3 trial. Lancet Oncol. 2017;18(12):1624–1636. doi:10.1016/S1470-2045(17)30683-6
40. Garin E, Tselikas L, Guiu B, et al. Personalised versus standard dosimetry approach of selective internal radiation therapy in patients with locally advanced hepatocellular carcinoma (DOSISPHERE-01): a randomised, multicentre, open-label Phase 2 trial. Lancet Gastroenterol Hepatol. 2021;6(1):17–29. doi:10.1016/S2468-1253(20)30290-9
41. Gates VL, Marshall KG, Salzig K, Williams M, Lewandowski RJ, Salem R. Outpatient single-session yttrium-90 glass microsphere radioembolization. J Vasc Interv Radiol. 2014;25(2):266–270. doi:10.1016/j.jvir.2013.11.005
42. Gaba RC, Vanmiddlesworth KA. Chemoembolic hepatopulmonary shunt reduction to allow safe yttrium-90 radioembolization lobectomy of hepatocellular carcinoma. Cardiovasc Intervent Radiol. 2012;35(6):1505–1511. doi:10.1007/s00270-012-0371-7
 © 2023 The Author(s). This work is published and licensed by Dove Medical Press Limited. The full terms of this license are available at https://www.dovepress.com/terms.php and incorporate the Creative Commons Attribution - Non Commercial (unported, v3.0) License.
By accessing the work you hereby accept the Terms. Non-commercial uses of the work are permitted without any further permission from Dove Medical Press Limited, provided the work is properly attributed. For permission for commercial use of this work, please see paragraphs 4.2 and 5 of our Terms.
© 2023 The Author(s). This work is published and licensed by Dove Medical Press Limited. The full terms of this license are available at https://www.dovepress.com/terms.php and incorporate the Creative Commons Attribution - Non Commercial (unported, v3.0) License.
By accessing the work you hereby accept the Terms. Non-commercial uses of the work are permitted without any further permission from Dove Medical Press Limited, provided the work is properly attributed. For permission for commercial use of this work, please see paragraphs 4.2 and 5 of our Terms.