")
Back to Journals » OncoTargets and Therapy » Volume 11
Nomograms for predicting long-term overall survival and disease-specific survival of patients with clear cell renal cell carcinoma
Authors Zhang GH, Wu Y, Zhang JS , Fang ZQ, Liu ZX, Xu ZH, Fan YD
Received 21 April 2018
Accepted for publication 9 August 2018
Published 6 September 2018 Volume 2018:11 Pages 5535—5544
DOI https://doi.org/10.2147/OTT.S171881
Checked for plagiarism Yes
Review by Single anonymous peer review
Peer reviewer comments 3
Editor who approved publication: Dr Jianmin Xu
Guanghao Zhang,1,* Yun Wu,2,* Jiashu Zhang,3 Zhiqing Fang,4 Zhaoxu Liu,4 Zhonghua Xu,4 Yidong Fan4
1Department of Financial Mathematics and Financial Engineering, School of Ecomonics, Shandong University, Jinan, Shandong, People’s Republic of China; 2Department of Medical Oncology, National Cancer Center/Cancer Hospital, Chinese Academy of Medical Sciences, Peking Union Medical College, Beijing, People’s Republic of China; 3Department of Breast Surgery, Qilu Hospital of Shandong University, Jinan, Shandong, People’s Republic of China; 4Department of Urology, Qilu Hospital of Shandong University, Jinan, Shandong, People’s Republic of China
*These authors contributed equally to this work
Objectives: The aim of this study was to establish comprehensive and practical nomograms, based on significant clinicopathological parameters, for predicting the overall survival (OS) and the disease-specific survival (DSS) of patients with clear cell renal cell carcinoma (ccRCC).
Patients and methods: The data of 35,151 ccRCC patients, diagnosed between 2004 and 2014, were obtained from the database of the Surveillance, Epidemiology, and End Results (SEER) program. The Kaplan–Meier method and Cox proportional hazards regression model were used to evaluate the prognostic effects of multiple clinicopathological variables on survival. Based on Cox models, a nomogram was constructed to predict the probabilities of OS and DSS for an individual patient. The predictive performance of nomograms was evaluated using the concordance index (C-index) and calibration curves.
Results: According to univariate and multivariate analyses, age at diagnosis, sex, race, marital status, surgical approach, tumor node metastasis (TNM) stage, and Fuhrman grade significantly correlated with the survival outcomes. These characteristics were used to establish nomograms. The nomograms showed good accuracy in predicting 3-, 5-, and 10-year OS and DSS, with a C-index of 0.79 (95% CI, 0.79–0.80) for OS and 0.87 (95% CI, 0.86–0.88) for DSS. All calibration curves revealed excellent consistency between predicted and actual survival.
Conclusion: Nomograms were developed to predict death from ccRCC treated with nephrectomy. These new prognostic tools could aid in improving the predictive accuracy of survival outcomes, thus leading to reasonable individualized treatment.
Keywords: clear cell renal cell carcinoma, prognosis, nomogram, survival analysis
Introduction
Renal cell carcinoma (RCC) is one of the most common tumors worldwide, which accounted for >140,000 deaths per year.1 The incidence of renal cancer and the overall survival (OS) have continued to increase over the past 3 decades in the world.2 Patients with RCC usually have unfavorable prognosis, which makes RCC a serious problem for public health.3,4
It has been well established that RCC is an extremely heterogeneous type of disease with different genetic and molecular alterations, resulting in many histological subtypes such as clear-cell, papillary (types 1 and 2), and chromophobe RCC.5 The most common type of RCC, characterized by compact nests of tumor cells with clear cytoplasm, is known as clear cell RCC (ccRCC) and represents ~70% of all cases.6 In a recent study, Leibovich et al7 found that ccRCC subtype was an independent predictor of cancer-specific death and metastasis compared with papillary and chromophobe carcinoma after adjusting for other clinicopathological features. Considering the higher incidence rate and worse prognosis of ccRCC than other kinds of RCC, we focused on ccRCC in this study.8–11
The tumor node metastasis (TNM) classification system derived from the American Joint Committee on Cancer (AJCC) represents the gold standard staging scheme after nephrectomy for RCC.12 This system is most widely used for prognostic estimates and clinical treatments in patients with cancer. However, some researchers have reported that other clinicopathological factors such as race, sex, age, tumor size, and mode of presentation may also influence the RCC patients’ outcomes.13–15 No single factor can account for the wide variability of outcomes observed in individual patients. Neglecting these significantly prognostic parameters may reduce the accuracy of survival predictions. Therefore, a comprehensive prognostic evaluation system that includes clinicopathological and demographic variables is needed in clinical practice.
A nomogram is a convenient graphical representation of a mathematical model, in which various important factors are combined to predict a specific endpoint.11 By integrating those clinical and pathological factors, a nomogram can provide individualized estimates of the probability of an event over time, such as a patient’s individual probability of disease recurrence and death. Therefore, these algorithms might be used as a reliable tool for predicting the clinical outcomes and guiding decisions regarding surgery, surveillance, and adjuvant therapies.
To date, several postoperative nomograms have been generated for predicting the probability of RCC recurrence and survival.16 Kattan et al11 published the first nomogram in 2001, which was designed to calculate the likelihood of recurrence after surgery for RCC. The Kattan nomogram is currently known to be the most accurate nomogram, although there are other kinds of nomograms that have been used, including University of California, Los Angeles, Integrated Staging System (UISS) from the University of Los Angeles and Stage, Size, Grade and Necrosis (SSIGN) score from the Mayo Clinic.17,18 Based on the data obtained from long follow-ups, nomogram could present a graphical predictive model to integrate multiple variables, which make nomogram outstanding from many prognostic models. However, there is no prediction model to estimate the OS for ccRCC patients. The purpose of this study was to develop a prognostic nomogram for estimating the survival of ccRCC patients.
Patients and methods
Patient selection
In this study, all data were acquired from the National Cancer Institute’s Surveillance, Epidemiology, and End Results (SEER) cancer database. From 20 cancer registries that cover ~28% of the population of the United States, the SEER program collects and publishes data including cancer incidence and mortality. Only patients diagnosed between 2004 and 2014 with ccRCC were considered. Patients diagnosed before 2004 were excluded since TNM stage information was not recorded in the SEER database until 2004. Additionally, to ensure adequate follow-up time, patients diagnosed after 2014 were not included. From the SEER database, we identified a cohort of 35,151 patients according to the following inclusion criteria: age at diagnosis between 18 and 80 years, known Fuhrman grade, positive histology, active follow-up, known race, known marital status at diagnosis, and surgical treatment with either partial or radical nephrectomy (RN). Patients whose race was recorded as American Indian/Alaskan Native or Asian/Pacific Islander in SEER were assigned to an “others” race category for analysis. Moreover, patients with T0/TX/NX/MX stage were excluded.
Construction of the nomograms
The variables analyzed in this study were race, sex, Fuhrman grade, pathological stage (T/N/M, derived AJCC, sixth edition), surgical treatment, age at diagnosis, and marital status. Some of the variables were grouped in the analysis: the surgical treatment variable was grouped into partial nephrectomy (RX Summ-Surg Prim Site code: 10-30) and RN (RX Summ-Surg Prim Site code: 40-90), while AJCC T stage was grouped into T1 (T1/T1a/T1b/T1 not otherwise specified), T2, T3 (T3/T3a/T3b/T3c/T3NOS), and T4. Frequency and proportion were reported for each variable analyzed in this study.
The univariable and multivariable Cox regression analyses were used to calculate the effect of variables on OS and disease-specific survival (DSS). The measure of the effect of each variable on OS and DSS was presented as a hazard ratio (HR). Nomograms in this study were created using information obtained from the Cox regression analysis.
Validation of the nomograms
Validation of this nomogram was performed with repeated sampling (bootstrapping) of our data. Marginal estimates and model-average prediction probabilities were used to create calibration curves. To decrease the overfit bias, the nomograms were subjected to 1,000 bootstrap resamples for internal validation in the validation cohort. In a perfectly calibrated model, the predictions should fall on the diagonal 45° line of the calibration plot. Predictive performance was assessed using the concordance index (C-index), which resembles the area under the curve (AUC) but appears to be better suited for censored data.19 The value of the C-index statistic ranged from 0.5 (no discrimination) to 1 (perfect discrimination), and higher C-index values indicated a better prognostic model.
Statistical analyses
The Cox regression analysis was performed by the IBM SPSS Statistics for statistical computing and graphics (Version 24.0.0), and the nomogram was graphed by the R software (Version 3.3.0). All statistical tests were considered statistically significant at P<0.05, and estimates were considered significant at a CI of 95%.
Results
Clinicopathological characteristics of the patients
According to the inclusion criteria, a total of 35,151 patients were analyzed in this study. Descriptive analysis of the clinicopathological characteristics is shown in Table 1. Generally, most patients were male (21,692; 61.71%), older than 50 years (27,264; 77.56%), married (23,433; 66.66%), and Caucasian (30,226; 85.99%). Moreover, most patients underwent RN (24,280; 69.07%).
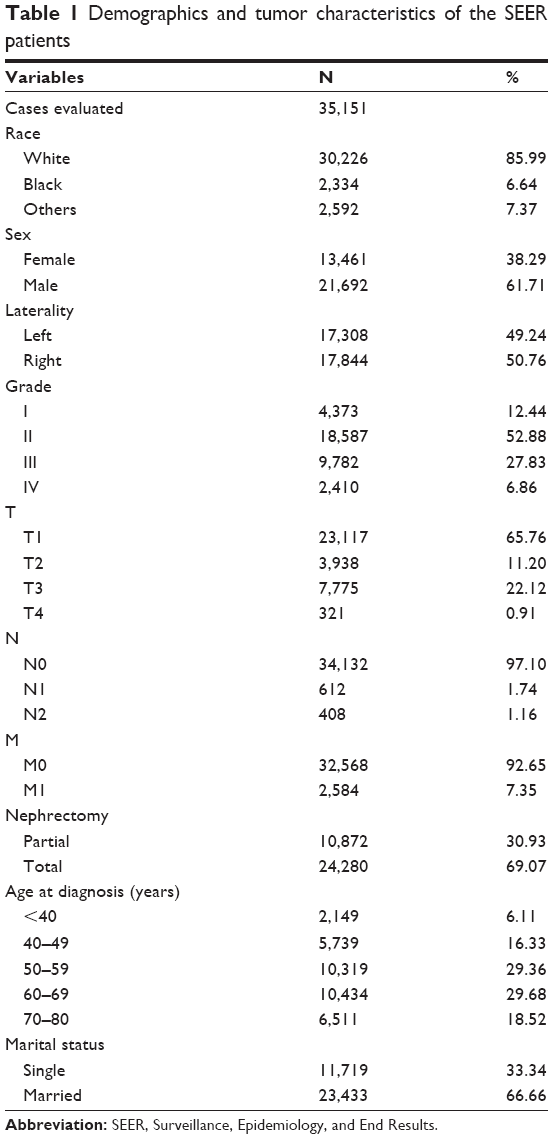 | Table 1 Demographics and tumor characteristics of the SEER patients |
Independent prognostic factors in the cohort
The univariable and multivariable Cox regression analyses were used for the analysis of variables that influence OS and DSS, and we use HR to quantify the effect of each variable on OS and DSS. The following variables are selected to be analyzed in Cox regression analysis: race, sex, Fuhrman grade, pathological stage (T/N/M, AJCC, sixth edition), surgical treatment, age at diagnosis, and marital status; the results are shown in Table 2. In the univariable Cox regression analysis for DSS, all variables except race reached statistical significance, while all variables but race and sex reached statistical significance in the multivariable Cox regression analysis for DSS. All variables have statistical significance both in the univariable and multivariable Cox regression analyses for OS.
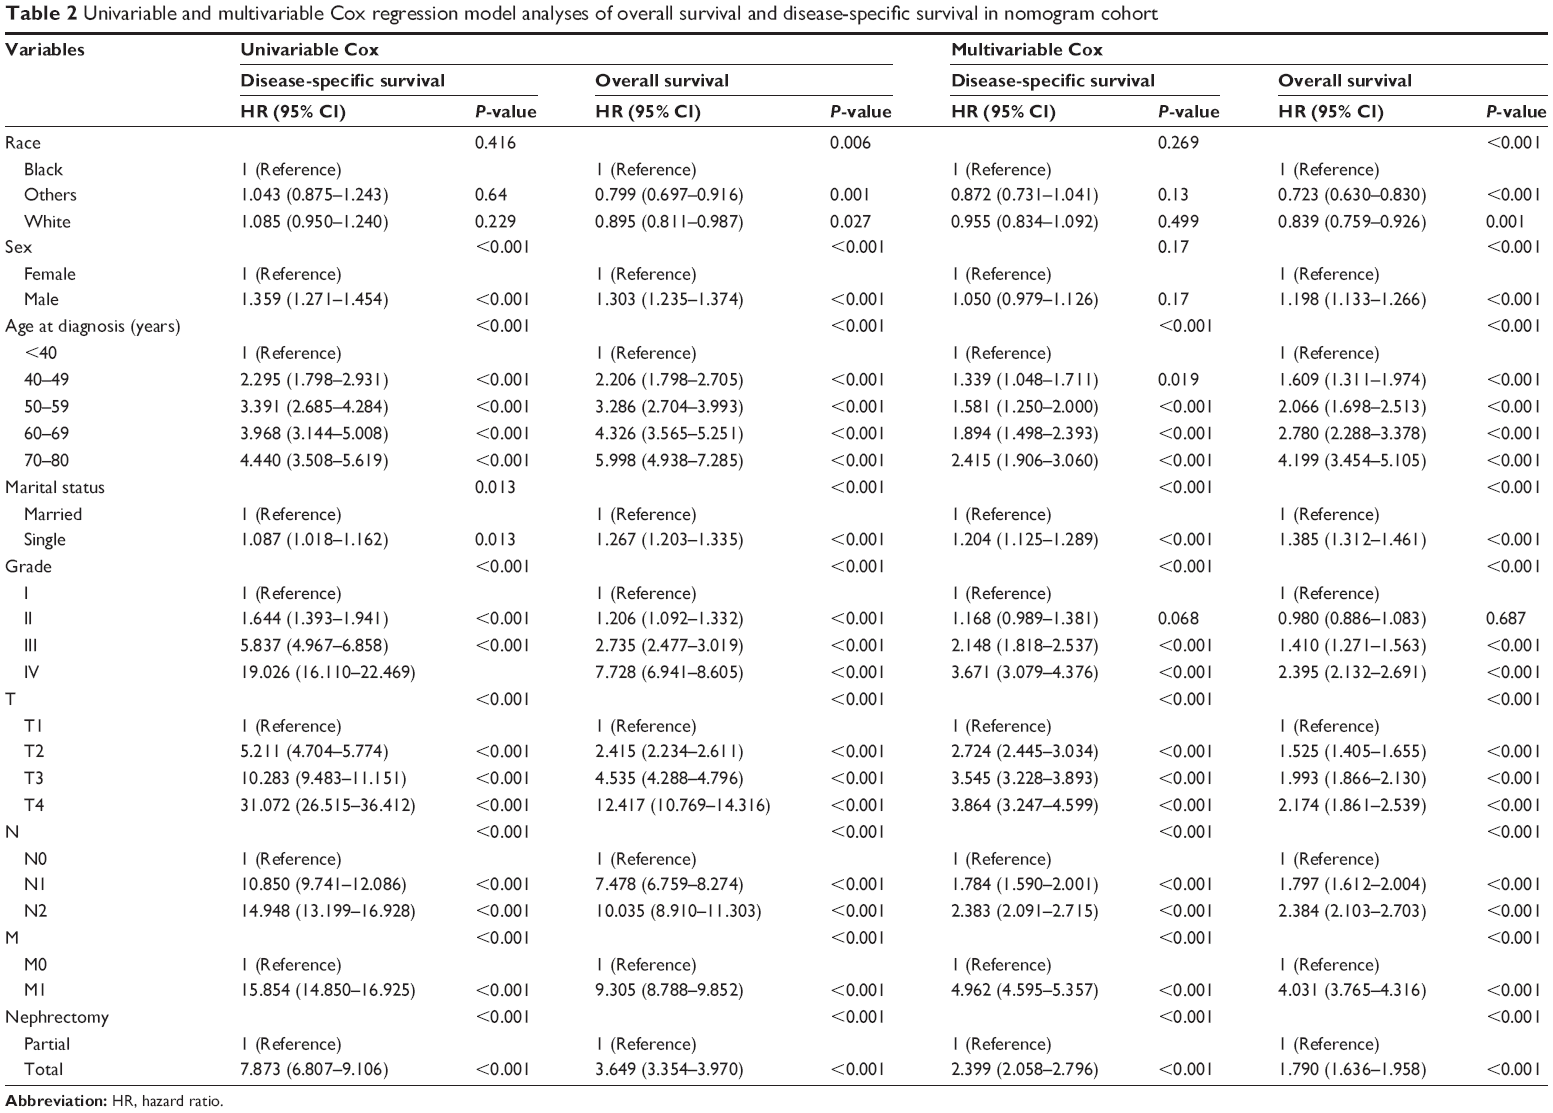 | Table 2 Univariable and multivariable Cox regression model analyses of overall survival and disease-specific survival in nomogram cohort |
Based on results in Table 2, it is possible to evaluate the risk of death faced by patients. For example, older patients are more likely to experience worse DSS outcome. In addition, single patients are more likely to have poor prognosis than married patients. With higher Fuhrman grade and higher T/N/M stage, patients have lower probability of survival due to cancer progression. Moreover, patients with RN have higher HR than those with partial nephrectomy.
Prognostic nomograms for OS and DSS
Considering outcomes of multivariable Cox regression analysis for OS and DSS, all of the variables are included to create the nomogram for OS and DSS. The prognostic nomogram for 3-, 5-, and 10-year OS is shown in Figure 1. The prognostic nomogram for 3-, 5-, and 10-year DSS is shown in Figure 2. By adding up the scores associated with each variable, and projecting total scores to the bottom scale, probabilities can be estimated for 3-, 5-, and 10-year OS and DSS.
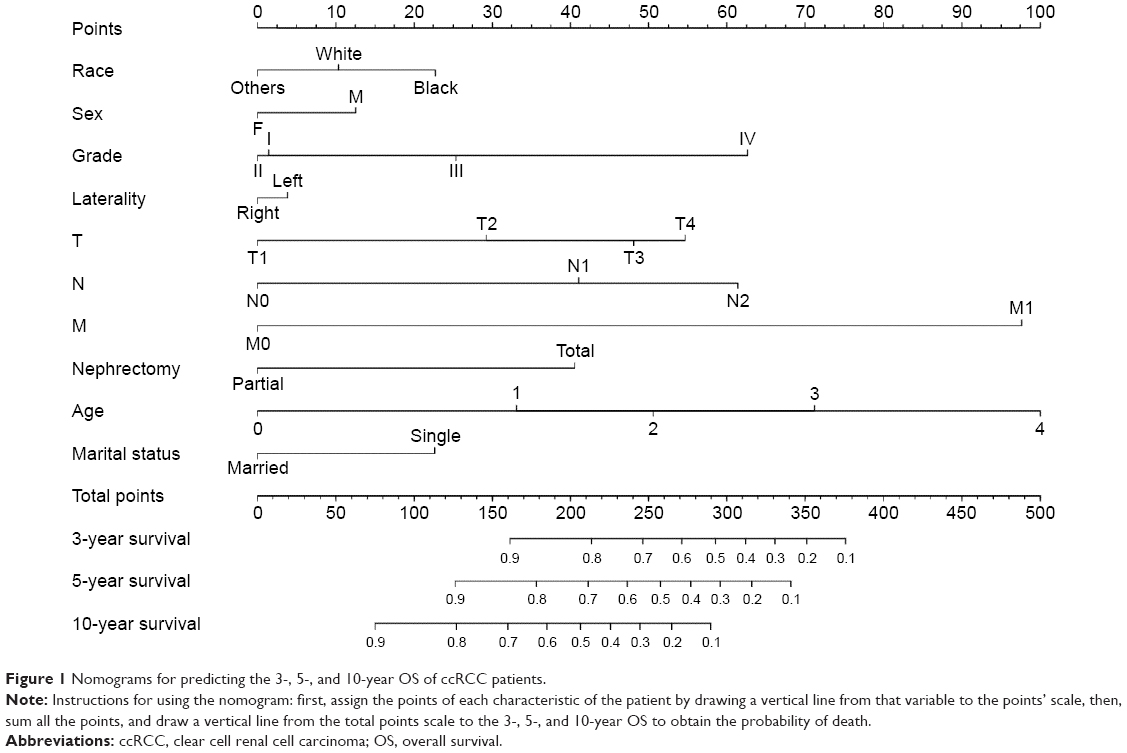 | Figure 1 Nomograms for predicting the 3-, 5-, and 10-year OS of ccRCC patients. |
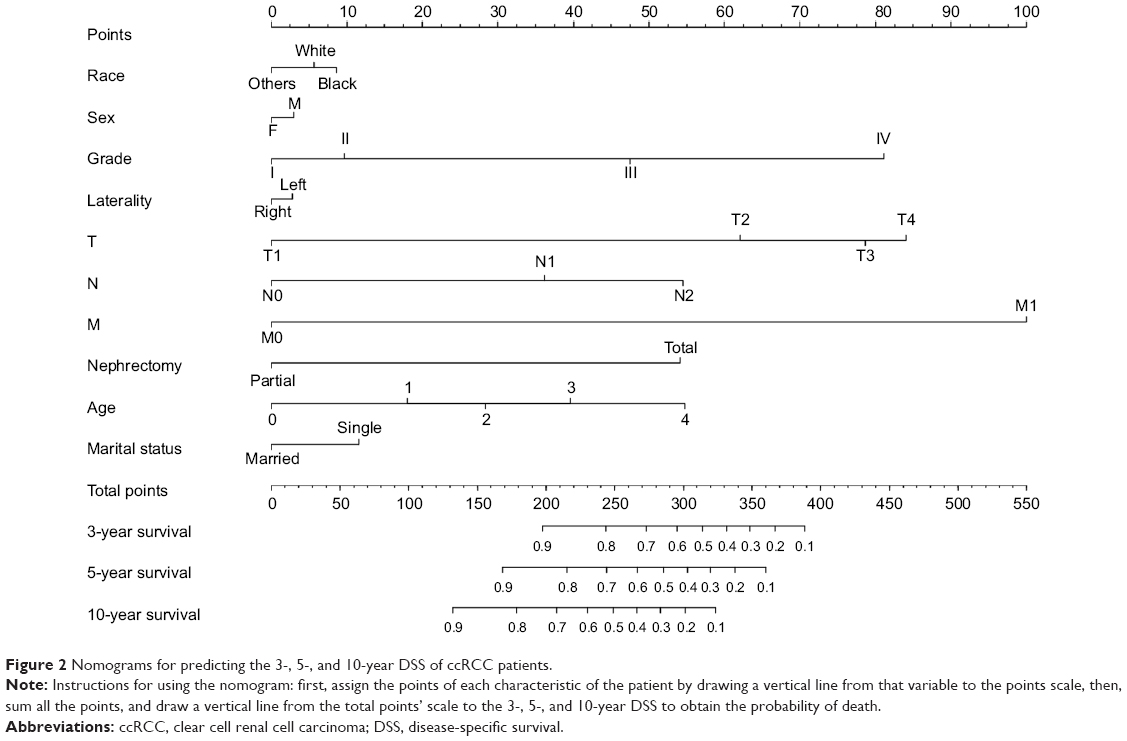 | Figure 2 Nomograms for predicting the 3-, 5-, and 10-year DSS of ccRCC patients. |
To clarify, we can take two ccRCC patients for examples. A 55-year-old single male patient with Fuhrman grade II, T2N1M1 stage who underwent RN would score >300 points, which means that the patient has ~50% probability of survival at the third year. However, for a 76-year-old single male patient with Fuhrman grade IV, T4N2M1 stage who underwent RN, the total score would be 450 points; thus, the patient’s probability of survival in the third year would be far <10%.
Validation of the nomograms
In the nomogram, each variable will be cleared based on the status of patient; thus, each variable could provide a point value, which will be found on the top line of the nomogram. Then, the points of each variable should be added up to get a total point, by which we could find the probability of survival at 3, 5, or 10 years. Validation of the nomogram was processed internally. The C-indexes for the nomograms to predict OS and DSS were 0.79 (95% CI, 0.79–0.80) and 0.87 (95% CI, 0.86–0.88), respectively. This finding implied that these models were reasonably accurate. The internal calibration plots of the OS and DSS are presented in Figure 3, revealing an excellent correlation in OS and DSS between the nomogram and observed outcome.
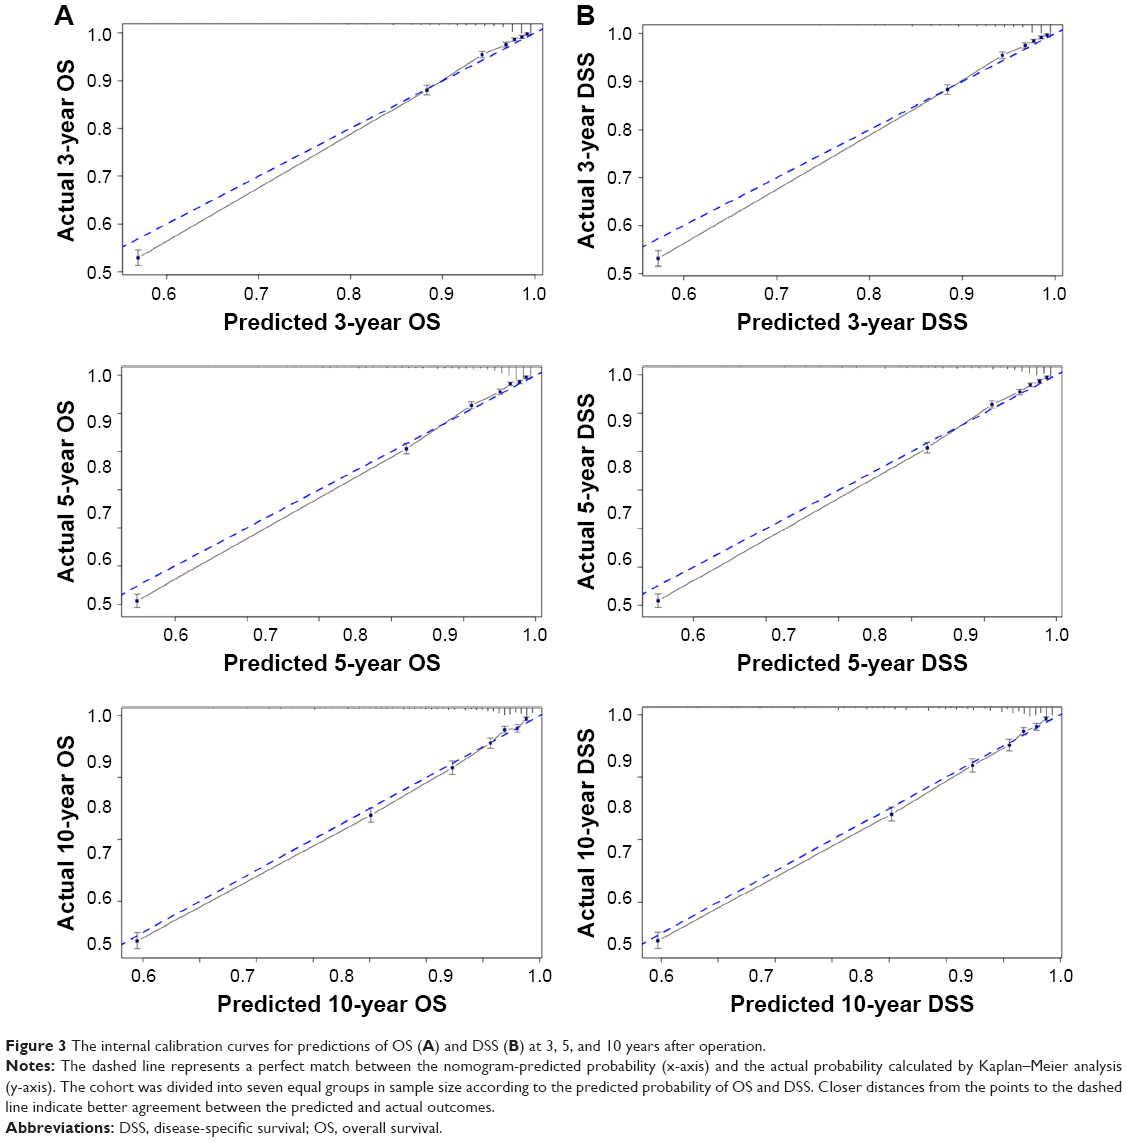 | Figure 3 The internal calibration curves for predictions of OS (A) and DSS (B) at 3, 5, and 10 years after operation. |
Discussion
RCC is the most common kidney malignancy in adults, accounting for 2%–3% of all malignant diseases in adults. RCC is a heterogeneous group of malignancies that vary histologically, genetically, and molecularly. Clear cell subtype represents >70% of all RCC patients and is the most aggressive subtype.20–22 The remaining 30% of RCC subtypes are generally indolent such as chromophobe and papillary RCC.23,24 In light of the high incidence and the relative unfavorable prognosis of ccRCC, a brief nomogram based on long-term follow-up of a population-based cohort that predicts long-term OS and DSS should be quite useful and practical for clinicians.
The nomogram is a graphic depiction of a prediction model that combines multiple biological and clinical variables to determine the probabilities of clinical events.11,25 Given that many prognostic factors of patients with ccRCC are available for physicians in practice, no single factor can account for the wide variability in outcomes observed in individual patients. And compared to the current tumor staging system (TNM), the nomogram showed better prediction accuracy and prognostic value.26,27 Hence, a more comprehensive and precise prognostic model is needed.
To date, there is no comprehensive nomogram containing the demographic and clinicopathological variables for ccRCC. Using the SEER database, we developed novel nomograms based on 35,151 cases predicting the 3-, 5-, and 10-year OS and DSS rates of ccRCC patients based on univariable and multivariable Cox regression analyses. The predictive performance of the nomograms was evaluated using an internal bootstrap resampling method. The C-index demonstrated the accuracy of nomograms to predict the 3-, 5-, and 10-year OS and DSS rates of ccRCC patients. With these nomograms, clinicians can classify patients into different risk groups, thus rendering individualized treatment and surveillance possible.
The TNM classification is the most widely used system for prognostic estimates of patients with cancer. Notably, our nomogram also showed that the T/N/M categories are making the largest contribution to prognosis. As the enlargement of tumor size, the increasing number of metastatic lymph nodes and the presence of distant organ metastasis, the risk of mortality increased remarkably.28 Improvements in imaging techniques and biologic makers may help identify patients with minimal metastatic disease, thus improving the prognosis of ccRCC patients apparently. In this study, we found that patients who received partial nephrectomy showed a better OS and DSS than those with RN. Many retrospective reports have suggested a benefit in OS for patients treated with nephron-sparing surgery (NSS) relative to RN.29,30 On one hand, current guidelines recommend NSS as the standard surgical treatment for clinical T1a (tumor size ≤4 cm) renal tumors.31 As for RN, it is utilized for many cT1b (4≤7 cm) tumors and it is the recommended treatment for T2a (7≤10 cm) and lager tumors.32,33 Mir et al’s34 study confirmed that patients undergoing PN were younger and had smaller masses, which might partially account for better OS for NSS. On the other hand, patients with solitary RCC that has been surgically treated usually have long-term cancer survival time (85%–96% cancer-specific survival 10 years after surgery), so renal functional outcomes are important.35 A decrease in renal function is associated with higher risk of severe cardiovascular disease and all-cause mortality.36 In a meta-analysis of 34 comparative studies, Kim et al37 calculated a cumulative 61% reduction in the risk of severe chronic kidney disease, as well as a 19% risk reduction for all-cause mortality for those undergoing NSS. Thereby, NSS has been used increasingly in patients with small renal mass due to the additional benefit of renal function preservation and the reduced risk for cardiovascular events and other adverse effects (eg, new-onset hypertension, diabetes, and cerebrovascular disease).38
As shown in the nomograms that we have presented, age at diagnosis and Fuhrman grade had a great prognostic value on OS and DSS. Several studies have found that younger patients with ccRCC have better prognosis than older patients, which might be related to a lower grade and stage at diagnosis. Jung et al14 proved that young age was associated with lower grade and stage and was an independent predictor of survival among patients with ccRCC. A study of over 1,000 cases demonstrated that young patients defined as age <45 years were more likely to have lower stage and grade and had a higher 5-year cancer-specific survival than older patients.39 Fuhrman grade has been demonstrated to be a significant prognostic factor for clear cell tumors in multiple studies as well.40,41 Fuhrman system distinguishes grade 1–4 based on nuclear size, morphology, and nucleolar prominence and correlates greatly with tumor size, stage, and the presence of metastasis.42,43
There are several prognostic models that have been developed to predict disease recurrence and survival after nephrectomy for RCC, using different variables, tools (nomograms or prognostic categories), and endpoints previously. In 2001, Kattan et al11 reported a nomogram that can be used to predict the 5-year probability of treatment failure among patients with newly diagnosed RCC. The four factors included in this nomogram were the presence of symptoms, histological subtype, tumor size, and standard TNM stage according to the 1997 version. The bootstrapping estimate of the internally predictive accuracy of the nomogram was ~0.74. When applied to external populations in Europe, the Kattan nomogram has shown variable prognostic accuracy ranging from 61 to 71%.44,45 In the same year, Zisman et al17 reported the UISS for patients with RCC, based on 661 patients undergoing nephrectomy at the University of California, Los Angeles, between 1989 and 1999. The UISS integrated stage, grade, and Eastern Cooperative Oncology Group (ECOG) performance status to predict OS following partial or RN. This system has been validated in a cohort of >4,000 external patients, and the predictive accuracy was found to be 81% for patients with localized RCC.46 In the next year, researchers in the Mayo Clinic reported SSIGN for patients with ccRCC treated with RN, based on 1,801 patients who underwent RN between 1970 and 1988.18 The C-index from an SSIGN model that contained the ccRCC score was 0.84. Subsequently, European and Japanese studies have confirmed the prognostic accuracy of the SSIGN algorithm ranging from 81 to 88%.47–49 Finally, in 2007, Karakiewicz et al35 developed the model included >2,500 patients with RCC incorporated TNM stage, tumor size, histological subtype, age, sex, and symptoms at presentation in order to predict cancer-specific mortality among patients with RCC. The internally validated accuracy of this nomogram was 86%. In the same study, an external validation of this nomogram yielded a predictive accuracy of ~86.7%. From the above, our results indicate that the discriminant properties of our model (79% for OS and 87% for DSS) are comparable to other models that addressed similar end points. Nevertheless, external validation on large population and multicenter datasets is needed to compare the discriminating accuracy of those prognostic models with our models more precisely.
However, all of these models have defects more or less. Nomogram created by Kattan et al did not include tumor grade, which is a strong predictor that has been shown to be significant by other investigators.9,21,50 Histological subtype is not illustrated in the UISS. As for SSIGN, this model is based on limited scale of data and its applicability for nationwide patients remains to be confirmed. And the model created by Karakiewicz was devoid of demographic variables, which may influence the predictive accuracy. To the best of our knowledge, this is the first large-population-based study to construct a nomogram to predict the OS and CSS for patients with ccRCC. One merit of our nomogram over that of previous studies resides in our large sample size and long follow-up. With a median follow-up of 65.5 months, our nomogram cohort (n=35,151) is the largest and covered almost thousands of hospitals, allowing the nomograms to be used widely for decision making in clinical practice. Besides, our study first took some demographic variables into account, such as race, sex, and marital status, which are likely to improve nomogram accuracy. In this study, White married females have a better OS and DSS than Black single males. Racial disparities could be attributed to lower socioeconomic status, poor health coverage, no or less access to medical care for undergoing ultrasound and CT scans, and later stage at cancer diagnosis among African American patients.51,52 Many findings suggest that marriage may have a protective effect on RCC patients, which related to the support from spouses, such as receiving medical assistance, assisting in activities of daily living, and medication reminders.53,54 Women with RCC had significantly better OS rates than men, and its sex-specific differences have previously been reported.55–58 The reason may be associated with genetic and social environmental factors. Sex-specific mutation of genes such as BAP1, is evident in ccRCC, which may affect the OS of the patient.55 Furthermore, women had a significantly higher proportion of incidentally detected RCC and lower grade and smaller size of the tumors at presentation, which may be related to more extensive use of the health care system and more likely to have incidental detection of tumors during imaging for abdominal or pelvic pathology than men.58–60 Finally, our cohorts are the most updated version compared with those previous models. Accurate outcome prediction for patients with ccRCC treated with nephrectomy is critically important for postoperative management.
Moreover, our study has several limitations. First, the SEER database is devoid of variables such as ECOG prognostic scores, mode of presentation, and detailed histological information such as tumor necrosis, which have proven to be predictive of survival.61 Additionally, it has been widely accepted that treatment details regarding surgery and other adjuvant therapy such as chemotherapy, radiation therapy, and targeted therapy were important prognostic factors for ccRCC. However, that information except for surgical treatment was not available in the SEER database and cannot be incorporated in our analysis. Furthermore, due to the retrospective nature of our study, these nomograms must be further validated in a prospective cohort or a clinical trial before being applied to clinical use. Finally, despite having achieved accuracy that exceeded that of other existing models, our nomogram is not perfect. Indeed, 21% of predictions will be made incorrectly. This flaw is shared with virtually all predictive models, given that 100% correct predictions virtually are never achieved.
The present study showed that age, sex, race, marital status, surgical approach, TNM stage, and Fuhrman grade were independent risk factors for survival in patients with ccRCC. Nomograms were developed to accurately predict the 3-, 5-, and 10-year OS and DSS rates of these patients, based on patient-specific characteristics. These predictive tools could help clinicians identify high-risk patients, tailor therapeutic and follow-up strategies as well as make individualized predictions of patient survival.
Data sharing statement
All data are fully available upon request to the correspondence author, Zhiqing Fang.
Acknowledgments
The authors would like to thank the SEER program for providing open access to the database. This study was supported by the Key Project of Research and Development Plan in Shandong Province (no 2016GSF201172) and the Scientific Research Foundation of Shandong Province for Outstanding Young Scientist Award (no BS2014YY036). None of the funding bodies had any part in the design of the study and collection, analysis, interpretation of data, and manuscript writing.
Author contributions
ZF contributed to the conception and design. GZ and YW contributed to the collection of patient information and drafting of the article. ZF interpreted the data. JZ, GZ, ZL, ZX, and YF helped revising the manuscript. All authors contributed toward data analysis, drafting and critically revising the paper and agree to be accountable for all aspects of the work.
Disclosure
The authors report no conflicts of interest in this work.
References
Ferlay J, Soerjomataram I, Dikshit R, et al. Cancer incidence and mortality worldwide: sources, methods and major patterns in GLOBOCAN 2012. Int J Cancer. 2015;136(5):E359–E386. | ||
Chow WH, Devesa SS. Contemporary epidemiology of renal cell cancer. Cancer J. 2008;14(5):288–301. | ||
Rini BI, Campbell SC, Escudier B. Renal cell carcinoma. Lancet. 2009;373(9669):1119–1132. | ||
Gupta K, Miller JD, Li JZ, Russell MW, Charbonneau C. Epidemiologic and socioeconomic burden of metastatic renal cell carcinoma (mRCC): a literature review. Cancer Treat Rev. 2008;34(3):193–205. | ||
Shuch B, Amin A, Armstrong AJ, et al. Understanding pathologic variants of renal cell carcinoma: distilling therapeutic opportunities from biologic complexity. Eur Urol. 2015;67(1):85–97. | ||
Rini BI, Campbell SC, Escudier B. Renal cell carcinoma. 2009;373(9669):1119–1132. Available from: https://www.sciencedirect.com/science/article/pii/S0140673609602294. Accessed August 28, 2018. | ||
Leibovich BC, Lohse CM, Crispen PL, et al. Histological subtype is an independent predictor of outcome for patients with renal cell carcinoma. J Urol. 2010;183(4):1309–1316. | ||
King TC. Pathology Elsevier’s Integrated. Chapter 12 – Renal and Urinary Tract. Philadelphia: Elsevier; 2007. | ||
Amin MB, Amin MB, Tamboli P, et al. Prognostic impact of histologic subtyping of adult renal epithelial neoplasms: an experience of 405 cases. Am J Surg Pathol. 2002;26(3):281–291. | ||
Cheville JC, Lohse CM, Zincke H, Weaver AL, Blute ML. Comparisons of outcome and prognostic features among histologic subtypes of renal cell carcinoma. Am J Surg Pathol. 2003;27(5):612–624. | ||
Kattan MW, Reuter V, Motzer RJ, Katz J, Russo P. A postoperative prognostic nomogram for renal cell carcinoma. J Urol. 2001;166(1):63–67. | ||
Gettman MT, Blute ML, Spotts B, Bryant SC, Zincke H. Pathologic staging of renal cell carcinoma: significance of tumor classification with the 1997 TNM staging system. Cancer. 2001;91(2):354–361. | ||
Lee CT, Katz J, Fearn PA, Russo P. Mode of presentation of renal cell carcinoma provides prognostic information. Urol Oncol. 2002;7(4):135–140. | ||
Jung EJ, Lee HJ, Kwak C, Ku JH, Moon KC. Young age is independent prognostic factor for cancer-specific survival of low-stage clear cell renal cell carcinoma. Urology. 2009;73(1):137–141. | ||
Wu J, Zhang P, Zhang G, et al. Renal cell carcinoma histological subtype distribution differs by age, gender, and tumor size in coastal Chinese patients. Oncotarget. 2017;8(42):71797–71804. | ||
Sorbellini M, Kattan MW, Snyder ME, et al. A postoperative prognostic nomogram predicting recurrence for patients with conventional clear cell renal cell carcinoma. J Urol. 2005;173(1):48–51. | ||
Zisman A, Pantuck AJ, Dorey F, et al. Improved prognostication of renal cell carcinoma using an integrated staging system. J Clin Oncol. 2001;19(6):1649–1657. | ||
Frank I, Blute ML, Cheville JC, Lohse CM, Weaver AL, Zincke H. An outcome prediction model for patients with clear cell renal cell carcinoma treated with radical nephrectomy based on tumor stage, size, grade and necrosis: the SSIGN score. J Urol. 2002;168(6):2395–2400. | ||
Harrell FE, Lee KL, Mark DB. Multivariable prognostic models: issues in developing models, evaluating assumptions and adequacy, and measuring and reducing errors. Stat Med. 1996;15(4):361–387. | ||
Patard JJ, Leray E, Rioux-Leclercq N, et al. Prognostic value of histologic subtypes in renal cell carcinoma: a multicenter experience. J Clin Oncol. 2005;23(12):2763–2771. | ||
Moch H, Gasser T, Amin MB, Torhorst J, Sauter G, Mihatsch MJ. Prognostic utility of the recently recommended histologic classification and revised TNM staging system of renal cell carcinoma: a Swiss experience with 588 tumors. Cancer. 2000;89(3):604–614. | ||
Delahunt B, Bethwaite PB, Nacey JN. Outcome prediction for renal cell carcinoma: evaluation of prognostic factors for tumours divided according to histological subtype. Pathology. 2007;39(5):459–465. | ||
Störkel S, Eble JN, Adlakha K, et al. Classification of renal cell carcinoma: Workgroup No. 1. Union Internationale Contre le Cancer (UICC) and the American Joint Committee on Cancer (AJCC). Cancer. 1997;80(5):987–989. | ||
Renshaw AA. Subclassification of renal cell neoplasms: an update for the practising pathologist. Histopathology. 2002;41(4):283–300. | ||
Eastham JA, Kattan MW, Scardino PT. Nomograms as predictive models. Semin Urol Oncol. 2002;20(2):108–115. | ||
Cao J, Yuan P, Wang L, et al. Clinical Nomogram for Predicting Survival of Esophageal Cancer Patients after Esophagectomy. Sci Rep. 2016;6:26684. | ||
Zhang ZY, Gao W, Luo QF, et al. A nomogram improves AJCC stages for colorectal cancers by introducing CEA, modified lymph node ratio and negative lymph node count. Sci Rep. 2016;6:39028. | ||
Zisman A, Pantuck AJ, Wieder J, et al. Risk group assessment and clinical outcome algorithm to predict the natural history of patients with surgically resected renal cell carcinoma. J Clin Oncol. 2002;20(23):4559–4566. | ||
Zini L, Perrotte P, Capitanio U, et al. Radical versus partial nephrectomy: effect on overall and noncancer mortality. Cancer. 2009;115(7):1465–1471. | ||
Huang WC, Elkin EB, Levey AS, Jang TL, Russo P. Partial nephrectomy versus radical nephrectomy in patients with small renal tumors – is there a difference in mortality and cardiovascular outcomes? J Urol. 2009;181(1):55 discussion 61–6252. | ||
Ljungberg B, Bensalah K, Canfield S, et al. EAU guidelines on renal cell carcinoma: 2014 update. Eur Urol. 2015;67(5):913–924. | ||
An JY, Ball MW, Gorin MA, et al. Partial vs Radical Nephrectomy for T1–T2 Renal Masses in the Elderly: Comparison of Complications, Renal Function, and Oncologic Outcomes. Urology. 2017;100:151–157. | ||
Kopp RP, Mehrazin R, Palazzi KL, et al. Survival outcomes after radical and partial nephrectomy for clinical T2 renal tumours categorised by R.E.N.A.L. nephrometry score. BJU Int. 2014;114(5):708–718. | ||
Mir MC, Derweesh I, Porpiglia F, Zargar H, Mottrie A, Autorino R. Partial Nephrectomy Versus Radical Nephrectomy for Clinical T1b and T2 Renal Tumors: A Systematic Review and Meta-analysis of Comparative Studies. Eur Urol. 2017;71(4):606–617. | ||
Karakiewicz PI, Briganti A, Chun FK, et al. Multi-institutional validation of a new renal cancer-specific survival nomogram. J Clin Oncol. 2007;25(11):1316–1322. | ||
Huang WC, Levey AS, Serio AM, et al. Chronic kidney disease after nephrectomy in patients with renal cortical tumours: a retrospective cohort study. Lancet Oncol. 2006;7(9):735–740. | ||
Kim SP, Thompson RH, Boorjian SA, et al. Comparative effectiveness for survival and renal function of partial and radical nephrectomy for localized renal tumors: a systematic review and meta-analysis. J Urol. 2012;188(1):51–57. | ||
Scosyrev E, Messing EM, Sylvester R, Campbell S, van Poppel H. Renal function after nephron-sparing surgery versus radical nephrectomy: results from EORTC randomized trial 30904. Eur Urol. 2014;65(2):372–377. | ||
Denzinger S, Otto W, Burger M, et al. Sporadic renal cell carcinoma in young and elderly patients: are there different clinicopathological features and disease specific survival rates? World J Surg Oncol. 2007;5:16. | ||
Gudbjartsson T, Hardarson S, Petursdottir V, Thoroddsen A, Magnusson J, Einarsson GV. Histological subtyping and nuclear grading of renal cell carcinoma and their implications for survival: a retrospective nation-wide study of 629 patients. Eur Urol. 2005;48(4):593–600. | ||
Ficarra V, Martignoni G, Maffei N, et al. Original and reviewed nuclear grading according to the Fuhrman system: a multivariate analysis of 388 patients with conventional renal cell carcinoma. Cancer. 2005;103(1):68–75. | ||
Tickoo SK, Gopalan A. Pathologic features of renal cortical tumors. Urol Clin North Am. 2008;35(4):551–561. | ||
Mancini V, Battaglia M, Ditonno P, et al. Current insights in renal cell cancer pathology. Urol Oncol. 2008;26(3):225–238. | ||
Cindolo L, Patard JJ, Chiodini P, et al. Comparison of predictive accuracy of four prognostic models for nonmetastatic renal cell carcinoma after nephrectomy: a multicenter European study. Cancer. 2005;104(7):1362–1371. | ||
Hupertan V, Roupret M, Poisson JF, et al. Low predictive accuracy of the Kattan postoperative nomogram for renal cell carcinoma recurrence in a population of French patients. Cancer. 2006;107(11):2604–2608. | ||
Patard JJ, Kim HL, Lam JS, et al. Use of the University of California Los Angeles integrated staging system to predict survival in renal cell carcinoma: an international multicenter study. J Clin Oncol. 2004;22(16):3316–3322. | ||
Fujii Y, Saito K, Iimura Y, et al. External validation of the Mayo Clinic cancer specific survival score in a Japanese series of clear cell renal cell carcinoma. J Urol. 2008;180(4):1290 discussion 1295–12961296. | ||
Zigeuner R, Hutterer G, Chromecki T, et al. External validation of the Mayo Clinic stage, size, grade, and necrosis (SSIGN) score for clear-cell renal cell carcinoma in a single European centre applying routine pathology. Eur Urol. 2010;57(1):102–111. | ||
Ficarra V, Martignoni G, Lohse C, et al. External validation of the Mayo Clinic Stage, Size, Grade and Necrosis (SSIGN) score to predict cancer specific survival using a European series of conventional renal cell carcinoma. J Urol. 2006;175(4):1235–1239. | ||
Lau WK, Cheville JC, Blute ML, Weaver AL, Zincke H. Prognostic features of pathologic stage T1 renal cell carcinoma after radical nephrectomy. Urology. 2002;59(4):532–537. | ||
Li J, Weir HK, Jim MA, King SM, Wilson R, Master VA. Kidney cancer incidence and mortality among American Indians and Alaska Natives in the United States, 1990–2009. Am J Public Health. 2014;104 Suppl 3(Suppl 3):S396–S403. | ||
Stafford HS, Saltzstein SL, Shimasaki S, Sanders C, Downs TM, Sadler GR. Racial/ethnic and gender disparities in renal cell carcinoma incidence and survival. J Urol. 2008;179(5):1704–1708. | ||
Haley WE. Family caregivers of elderly patients with cancer: understanding and minimizing the burden of care. J Support Oncol. 2003;1(4 Suppl 2):25–29. | ||
Li Y, Zhu MX, Qi SH, Sh Q. Marital status and survival in patients with renal cell carcinoma. Medicine. 2018;97(16):e0385. | ||
Ricketts CJ, Linehan WM. Gender Specific Mutation Incidence and Survival Associations in Clear Cell Renal Cell Carcinoma (CCRCC). PLoS One. 2015;10(10):e0140257. | ||
Rampersaud EN, Klatte T, Bass G, et al. The effect of gender and age on kidney cancer survival: younger age is an independent prognostic factor in women with renal cell carcinoma. Urol Oncol. 2014;32(1):30.e9–3030. | ||
May M, Aziz A, Zigeuner R, et al. Gender differences in clinicopathological features and survival in surgically treated patients with renal cell carcinoma: an analysis of the multicenter CORONA database. World J Urol. 2013;31(5):1073–1080. | ||
Aron M, Nguyen MM, Stein RJ, Gill IS. Impact of gender in renal cell carcinoma: an analysis of the SEER database. Eur Urol. 2008;54(1):133–142. | ||
Tsui KH, Shvarts O, Smith RB, Figlin R, de Kernion JB, Belldegrun A. Renal cell carcinoma: prognostic significance of incidentally detected tumors. J Urol. 2000;163(2):426–430. | ||
Beisland C, Medby PC, Beisland HO. Renal cell carcinoma: gender difference in incidental detection and cancer-specific survival. Scand J Urol Nephrol. 2002;36(6):414–418. | ||
Flanigan RC, Polcari AJ, Hugen CM. Prognostic variables and nomograms for renal cell carcinoma. Int J Urol. 2011;18(1):20–31. |
 © 2018 The Author(s). This work is published and licensed by Dove Medical Press Limited. The full terms of this license are available at https://www.dovepress.com/terms.php and incorporate the Creative Commons Attribution - Non Commercial (unported, v3.0) License.
By accessing the work you hereby accept the Terms. Non-commercial uses of the work are permitted without any further permission from Dove Medical Press Limited, provided the work is properly attributed. For permission for commercial use of this work, please see paragraphs 4.2 and 5 of our Terms.
© 2018 The Author(s). This work is published and licensed by Dove Medical Press Limited. The full terms of this license are available at https://www.dovepress.com/terms.php and incorporate the Creative Commons Attribution - Non Commercial (unported, v3.0) License.
By accessing the work you hereby accept the Terms. Non-commercial uses of the work are permitted without any further permission from Dove Medical Press Limited, provided the work is properly attributed. For permission for commercial use of this work, please see paragraphs 4.2 and 5 of our Terms.