Back to Journals » Cancer Management and Research » Volume 10
Nomogram predicts survival benefit for non-metastatic esophageal cancer patients who underwent preoperative radiotherapy
Received 10 February 2018
Accepted for publication 22 May 2018
Published 18 September 2018 Volume 2018:10 Pages 3657—3668
DOI https://doi.org/10.2147/CMAR.S165168
Checked for plagiarism Yes
Review by Single anonymous peer review
Peer reviewer comments 3
Editor who approved publication: Professor Lu-Zhe Sun
Kenan Xie,1,* Song Liu,2,* Jianjun Liu2
1Department of Cardiothoracic Surgery, Traditional Chinese Medicine Hospital of Taihe County, Taihe, China; 2Department of Head - Neck and Thoracic Surgery, The First Affiliated Hospital of University of Science and Technology of China, Anhui Provincial Cancer Hospital, Hefei, China
*These authors contributed equally to this work
Background: A prognostic model to predict the individual disease-specific survival (DSS) rates of non-metastatic esophageal cancer (nMEC) patients after preoperative radiotherapy (pRT) has not been established. In the current study, we aimed to establish a survival nomogram for nMEC patients after pRT.
Methods: We identified 2,424 nMEC patients who underwent pRT from the Surveillance, Epidemiology, and End Results database. Approximately, 80% (n=1,948) of the included patients were randomly selected and designated as training data set, and the remaining patients (n=476) were defined as external validation set. Nomogram was established by the training set and validated by the validation set.
Results: According to the results of the multivariate analysis, a nomogram combined with age at diagnosis, sex, tumor location, yp-T stage, yp metastatic lymph node ratio stage (yp-mLNRS), and grade was developed. The C-index of the model was significantly higher than that of yp-TNM staging system (0.62, 95% CI, 0.58 to 0.66 vs 0.55, 95% CI, 0.51 to 0.60; p<0.001). Calibration plots of the nomogram showed that the probability of DSS rates optimally corresponded to the survival rates were observed.
Conclusion: The proposed nomogram resulted in more reliable DSS prediction for nMEC patients in general population, regardless of the patient’s histological type. Upon validation, it will aid in individualized survival prediction and prove useful in clinical decision making in nMECs after pRT.
Keywords: esophageal cancer, preoperative radiotherapy, nomogram, SEER
Introduction
The incidence of esophageal cancer (EC) has been rapidly increasing in the United States.1 It was estimated that >16,910 new EC patients would be diagnosed in 2016; however, the survival of EC patients is still poor and the 5-year overall survival was <30%.2 Although most EC patients were diagnosed at an advanced stage, >50% of patients had potential opportunity to receive R0 resection after preoperative treatment.3 Due to the higher therapeutic efficacy, preoperative radiotherapy (pRT) had been widely applied in non-metastatic esophageal cancer (nMEC) patients over the last decade.4,5 However, the model which can predict survival benefit from pRT followed by resection in nMEC remains unclear.
Currently, the American Joint Committee on Cancer (AJCC) staging system has been widely used in the survival prediction of nMEC patients.6 However, the prognosis value of this conventional prognosis model in the era of multimodal therapy for nMEC patients is unclear.7 Recently, response to therapy has been regarded as a stable survival predictor for EC patients. Based on the status of response to pRT, the patients can be divided into pathological complete response (pCR) group and non-pCR group. However, only 25% patients could achieve pCR, and >75% of nMEC patients were pathologically confirmed with tumor residual after surgery.8,9 In addition, this classification oversimplifies the different prognostic categories for nMEC patients, and the variation of outcomes in intra-group patients cannot be accurately predicted by this prognostic model. In fact, this strategy solely depends on the final pathological stage for stratifying patients, but patients’ other characteristics, such as age, location, sex, and grade, which can also affect survival were ignored. Thus, we hypothesize a prognostic model which can incorporate more risk factors and provide more accurate survival prediction.
As a simple predictive tool, nomogram has been established in several types of carcinoma and proved to predict survival accurately and effectively under clinical conditions.10–14 However, the nomogram for nMEC patients after pRT has not been well established. In this study, based on multi-institution and multi-population data from Surveillance, Epidemiology, and End Results (SEER) database, we aimed to establish a nomogram to predict the survival of nMEC patients who underwent pRT followed by surgery.
Methods
Patients
The SEER program is one of the largest national collaboration programs by the National Cancer Institute. It collects and publishes ~26% of American population’s cancer incidence and survival information. In the current study, a retrospective review was performed between 1998 and 2013 of all nMEC patients who underwent pRT followed by surgery from SEER database. The study was limited to patients with non-distant organ metastasis disease. In order to evaluate the effect of lymph node status, patients with total examined lymph nodes (TLNs) >0 were included in the current study. Finally, a total of 2,424 nMEC patients who met all the inclusion criteria were selected as primary cohort. Approximately, 80% (n=1,948) of patients from the primary cohort were randomly selected and designated as training data set, and the remaining (n=476) patients were defined as external validation set.
Ethical approval
SEER data are de-identified before release and do not contain any personally identifying information. As the data is publicly available, no ethical approval is required.
Data collection
To determine which factors were associated with the survival of nMEC patients who underwent pRT, the information regarding patients’ clinicopathological characteristics, such as age at diagnosis, sex, race, treatment (surgery and radiotherapy), tumor location, histology, tumor size, grade, yp-T stage, the number of positive lymph nodes (PLNs), TLNs, and yp metastatic lymph node ratio (yp-mLNR), was collected. Yp-mLNR was defined as PLN divided by TLN. According to the seventh edition of AJCC staging system, the pathological tumor stage, yp-T stage, and yp-N stage were all restaged. The end point was disease-specific survival (DSS) rate, which was defined as the time form surgery to cancer-related death or the last follow-up. DSS estimation and survival curves were performed by Kaplan–Meier method and validated by the log-rank test.
Development of the prognostic nomogram
The nomogram was established as described previously in our study.11,13 Briefly, before the model was established, the linear relationships between continuous variables and the patients’ survival were evaluated by restricted cubic spline analysis. Before modeling, the variables were translated into adequate forms to fit the linearity assumption. The best cutoff points for continuous variables were identified by X-tile software (http://www.tissuearray.org/rimmlab/). By the forward stepwise selection, the variables which were independently associated with DSS were identified by the Cox proportional hazards (PH) regression analysis. Based on the results of multivariable Cox PH regression, the nomogram that can provide 1-year, 3-year, and 5-year individualized DSS for nMEC patients was constructed.
Validation and visualization of the nomogram
The nomogram was externally validated by the validation set. To test the prognostic accuracy, the nomogram validated both model discrimination and model calibration. First, the discrimination of nomogram was evaluated by Harrell’s C-index, which can estimate the probability coherence between the predicted and observed outcomes. Discrimination between the established nomogram and the AJCC staging system was compared by R software. Next, calibration was carried out first by grouping all the patients in validation set, and then comparing the relationship between the predicted and the observed outcomes in all the groups.
Statistical analysis
In the current study, p<0.05 is considered as statistically significant. All the statistical analyses were performed by the R software version 3.1.3 (http://www.r-project.org/) and the software Statistical Package for Social Sciences version 19.0 (SPSS, Chicago, IL, USA).
Results
Patients
Between 1998 and 2013, a total of 2,424 nMEC patients who underwent pRT were identified from SEER database. Overall, the mean age at diagnosis was 60.7±9.5 years. There were 2,058 (84.9%) male patients and 366 (15.1%) female patients. The majority of patients were white (91.6%). Tumors in 2,031 (83.8%) patients were located in the lower third of esophagus, while 1,524 (62.9%) patients were diagnosed as lymph node-negative by pathological confirmation. The mean TLN was 13.3+9.7 (range: 1 to 83). The median follow-up time was 33.7 months. The 1-year, 3-year, and 5-year DSS rates were 80.4%, 49.8%, and 40.6%, respectively. Of those, 1,948 patients were randomly grouped into training set, and the remaining patients (n=476) were assigned to external validation set. The clinicopathological characteristics of the patients included in the training set and validation set are listed in Table 1.
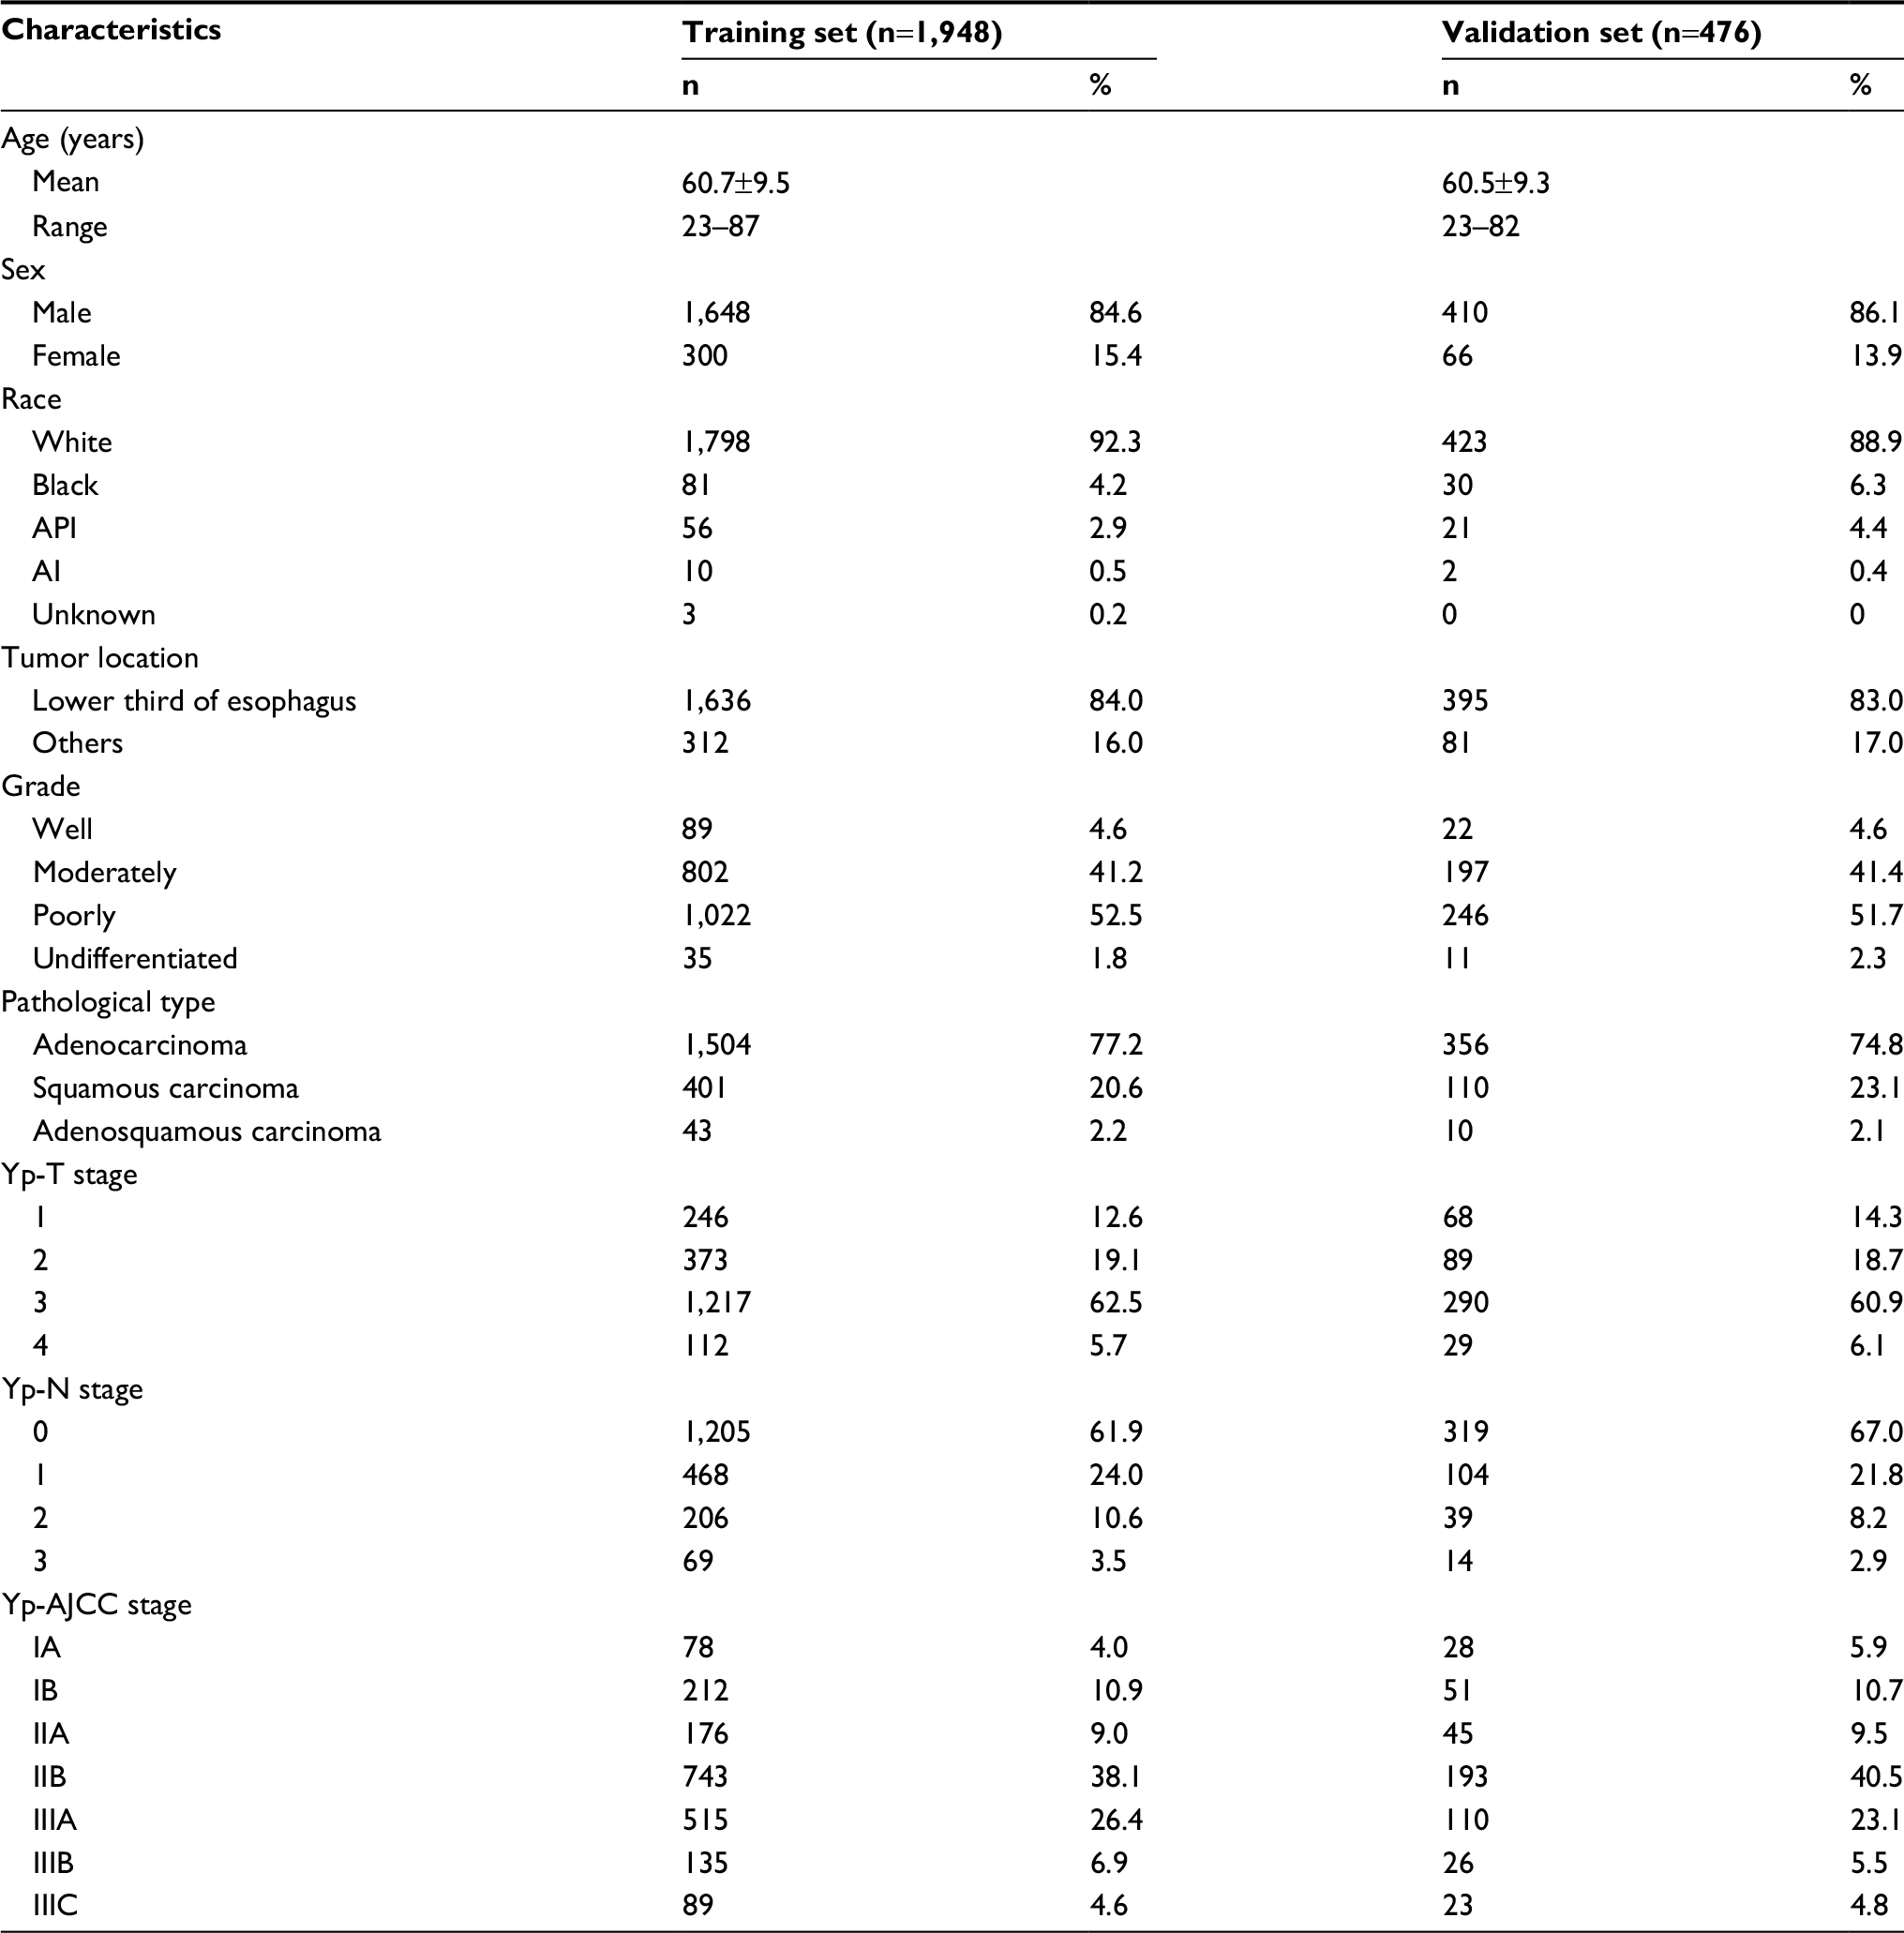 | Table 1 Characteristics of training set and validation set Abbreviations: API, Asian or Pacific Islander; AI, American Indian or Alaska Native; AJCC, American Joint Committee on Cancer. |
Factors
According to the Harrell’s theory, only those factors that fit into the PH and linearity assumptions can be included into the prognostic model. Thus, the continuous variables were transformed to adequate forms before modeling. The X-tile analysis showed that the best cutoff points of age at diagnosis were 54 and 72 years (Figure S1). For clinical use, the best cutoff points were defined as 50 and 70 years for age at diagnosis. The age at diagnosis was translated into three parts (50≤, 51–69, and ≥70 years). The best cutoff point for TLN was identified as 8 (Figure S2).
As shown in the Figure 1A, the nMEC patients with negative lymph node status had significantly better survival than those with positive lymph node status (p<0.001). In addition, according to the TLN of patients, patients with negative lymph node metastasis were divided into two groups. A unique yp-mLNRS 0 category was defined as yp-mLNR=0 and TLN >8, and yp-mLNRS 1 was defined as yp-mLNR=0 and TLN ≤8. By the X-tile analysis, the best cutoff point of yp-mLNR for lymph node-positive metastatic nMEC patients was 29% (Figure S3). For clinical use, the best cutoff point for nMEC patients with lymph node metastasis was 30%. Thus, as to following intervals, the yp-mLNRS was classified into four groups: the yp-mLNRS 0 was defined as yp-mLNR=0% and TLN >8; yp-mLNRS 1 as yp-mLNR=0% and TLN ≤8; yp-mLNRS 2 as 0% < yp-mLNR ≤30.0%; and yp-mLNRS 3 as 30.0% < yp-mLNR < 100% (Figure 1B). The 5-year DSS rates for the four-level yp-mLNRS categories were 57.5%, 45.0%, 26.9%, and 11.3%, respectively.
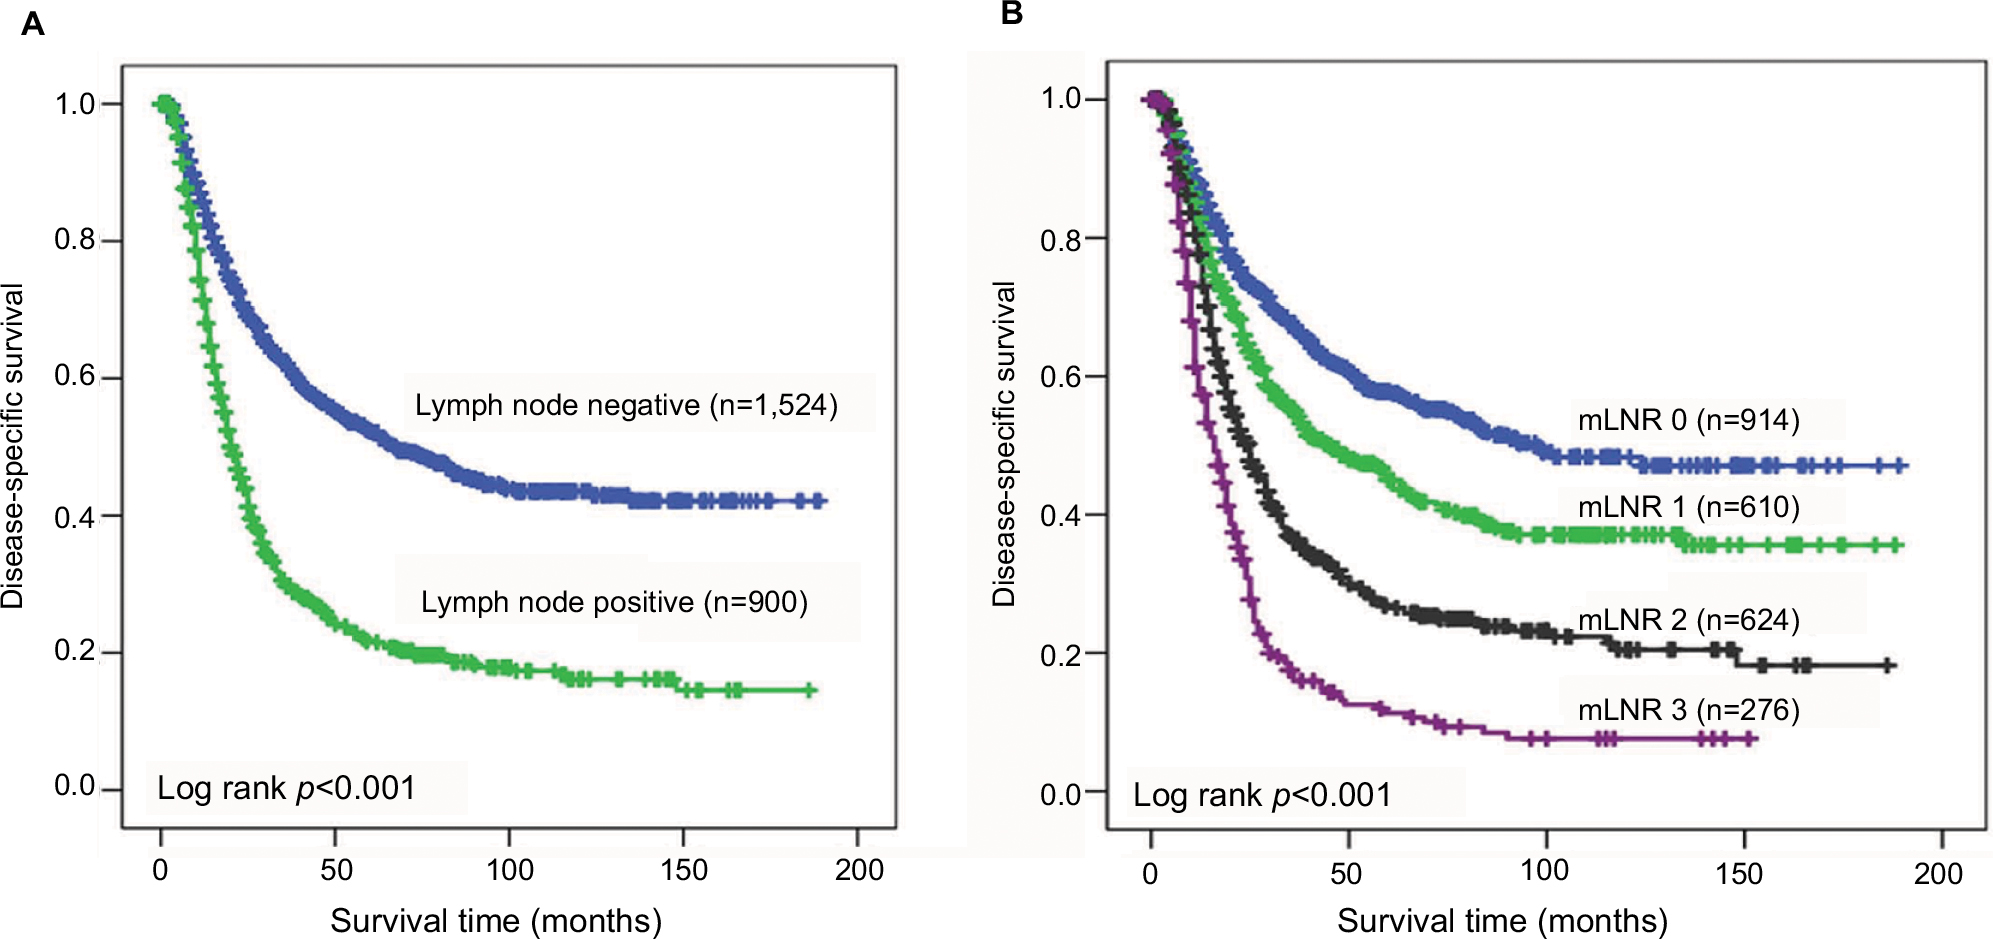 | Figure 1 (A) Disease-specific survival stratified by the lymph node status. (B) Disease-specific survival according to mLNR, stratified into four groups and validated by Kaplan–Meier curve. Abbreviation: mLNR, metastatic lymph node ratio. |
Development of nomogram for esophageal cancer patients
In the multivariable Cox analysis, the patients’ age at diagnosis, sex, tumor location, tumor grade, yp-T stage, and yp-mLNRS can independently predict patients’ DSS (Table 2). Therefore, all the independent risk factors which were statistically associated with DSS were incorporated into the prognostic nomogram (Figure 2), and the C-index value was 0.67 by bootstrap validation.
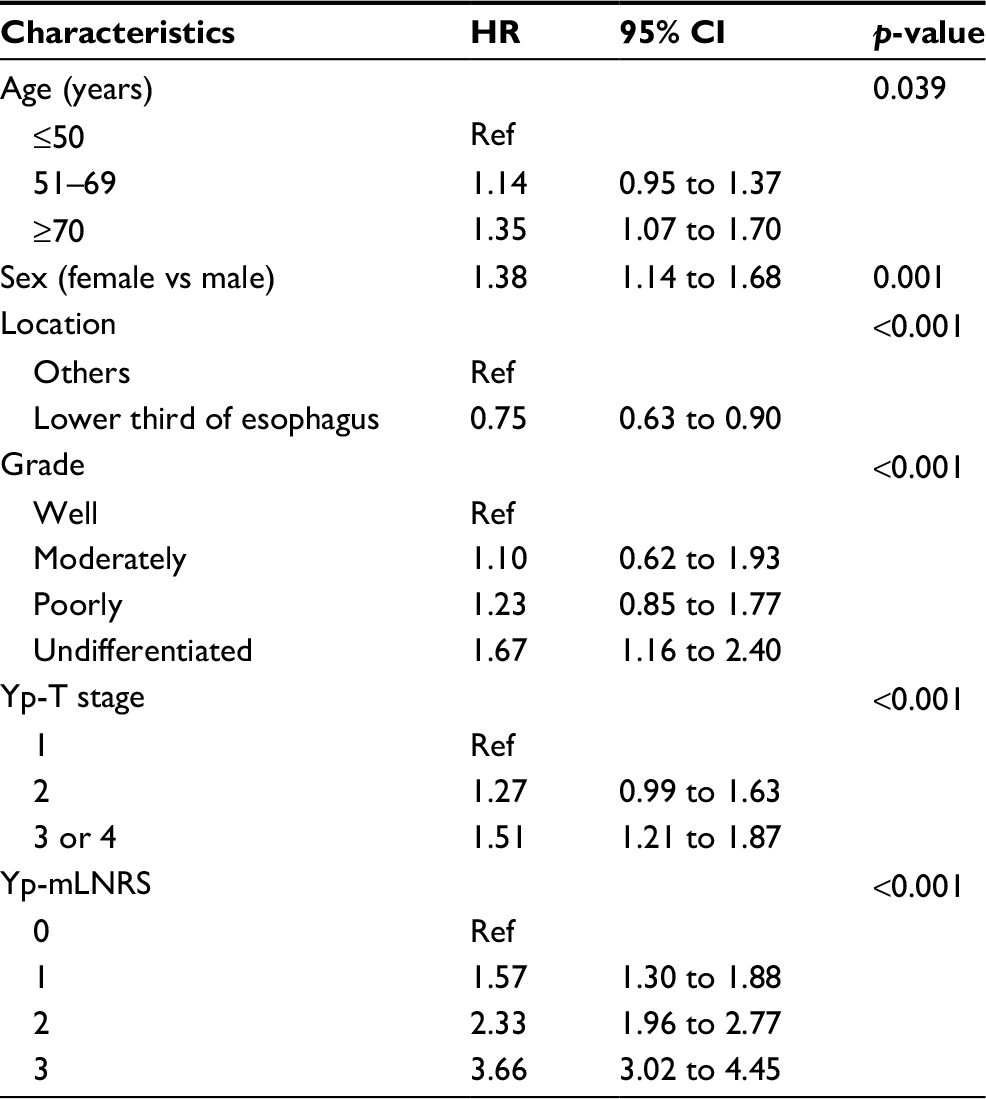 | Table 2 Selected results of multivariate analysis in the training set Abbreviations: HR, hazard ratio; Ref, reference; mLNRS, metastatic lymph node ratio stage. |
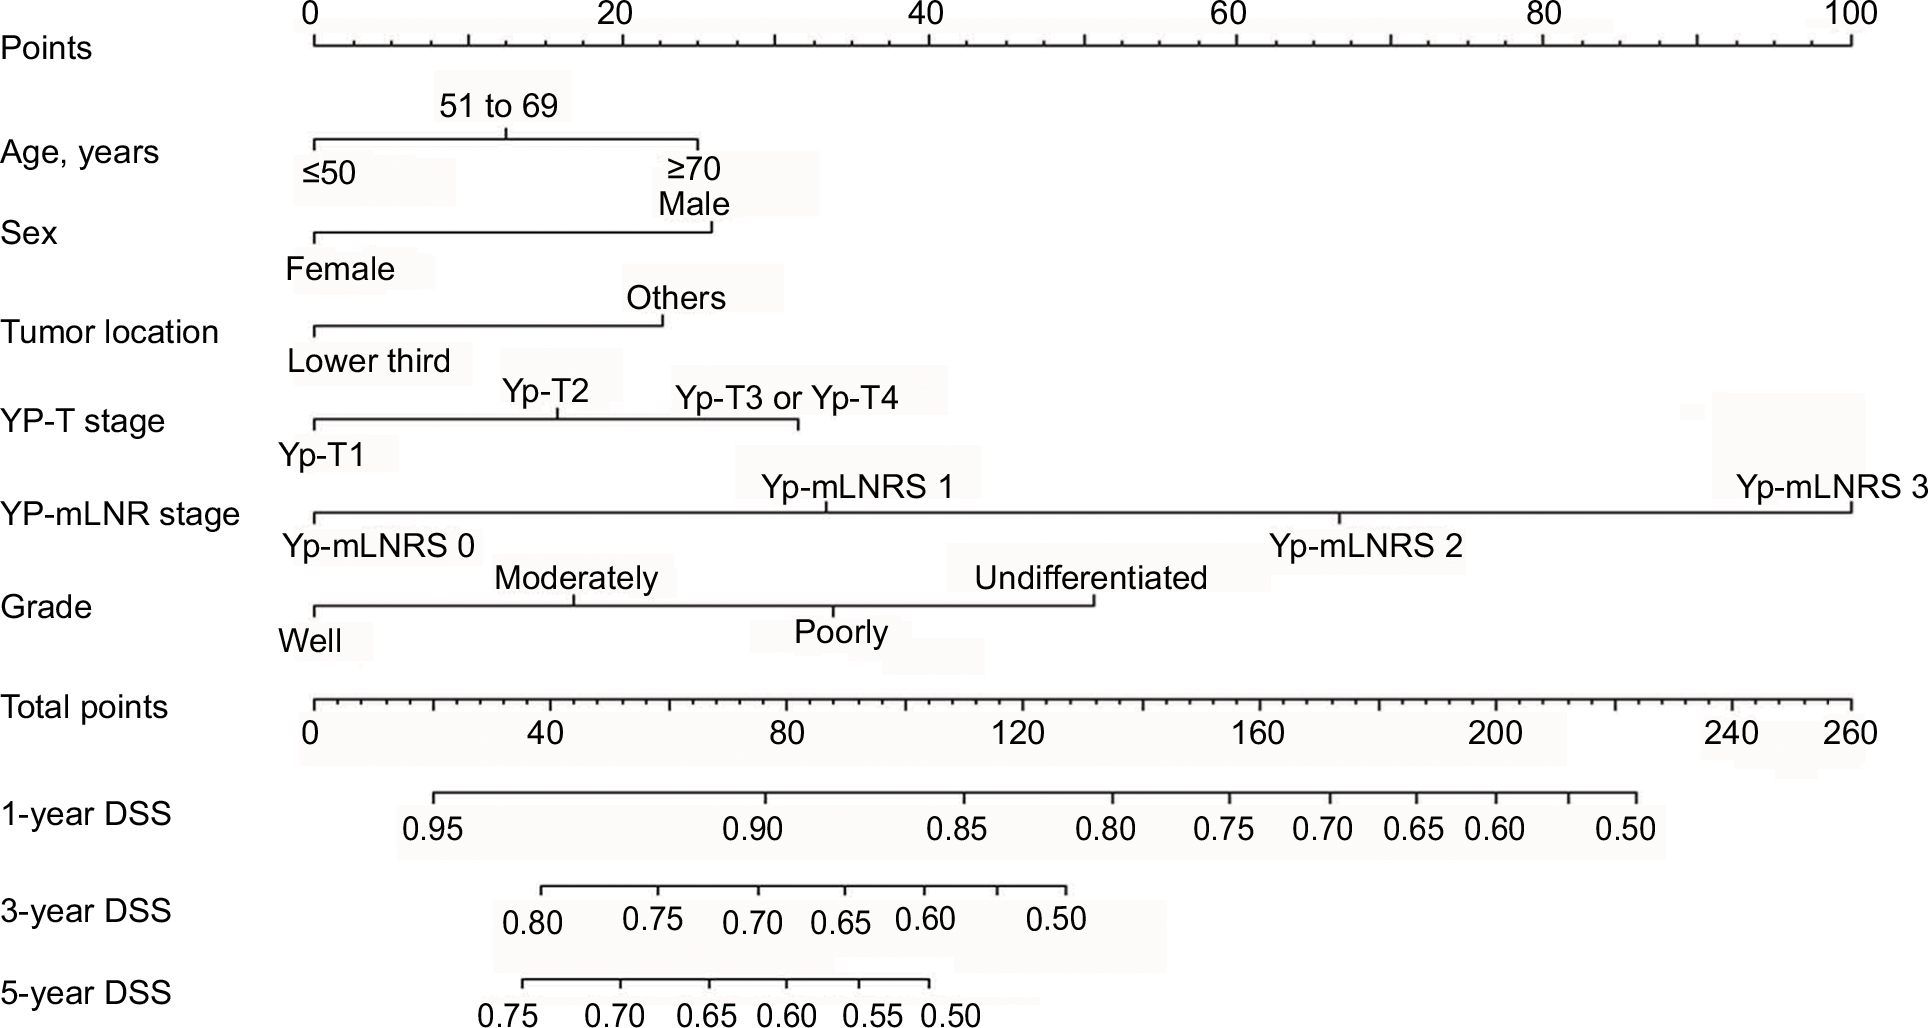 | Figure 2 Nomogram predicting 1-year, 3-year, and 5-year disease-specific survival for nMEC patients after pRT following surgery. Abbreviations: nMEC, non-metastatic esophageal cancer; pRT, preoperative radiotherapy; mLNR, metastatic lymph node ratio; mLNRS, metastatic lymph node ratio stage; DSS, disease-specific survival. |
Validation of the proposed nomogram
The external validation of the proposed nomogram was performed in validation set. The predictive ability of the proposed nomogram was compared with the seventh edition of AJCC staging system for EC. The validation of the proposed nomogram was performed in two directions. First, the C-index of the proposed nomogram was 0.62 (95% CI, 0.58 to 0.66), which was obviously better than that of the seventh AJCC staging system (0.55, 95% CI, 0.51 to 0.60; p<0.001). Second, as shown in Figure 3, the probabilities of 1-year, 3-year, and 5-year DSS rates in the proposed nomogram were optimally close between the survival predictions and observations.
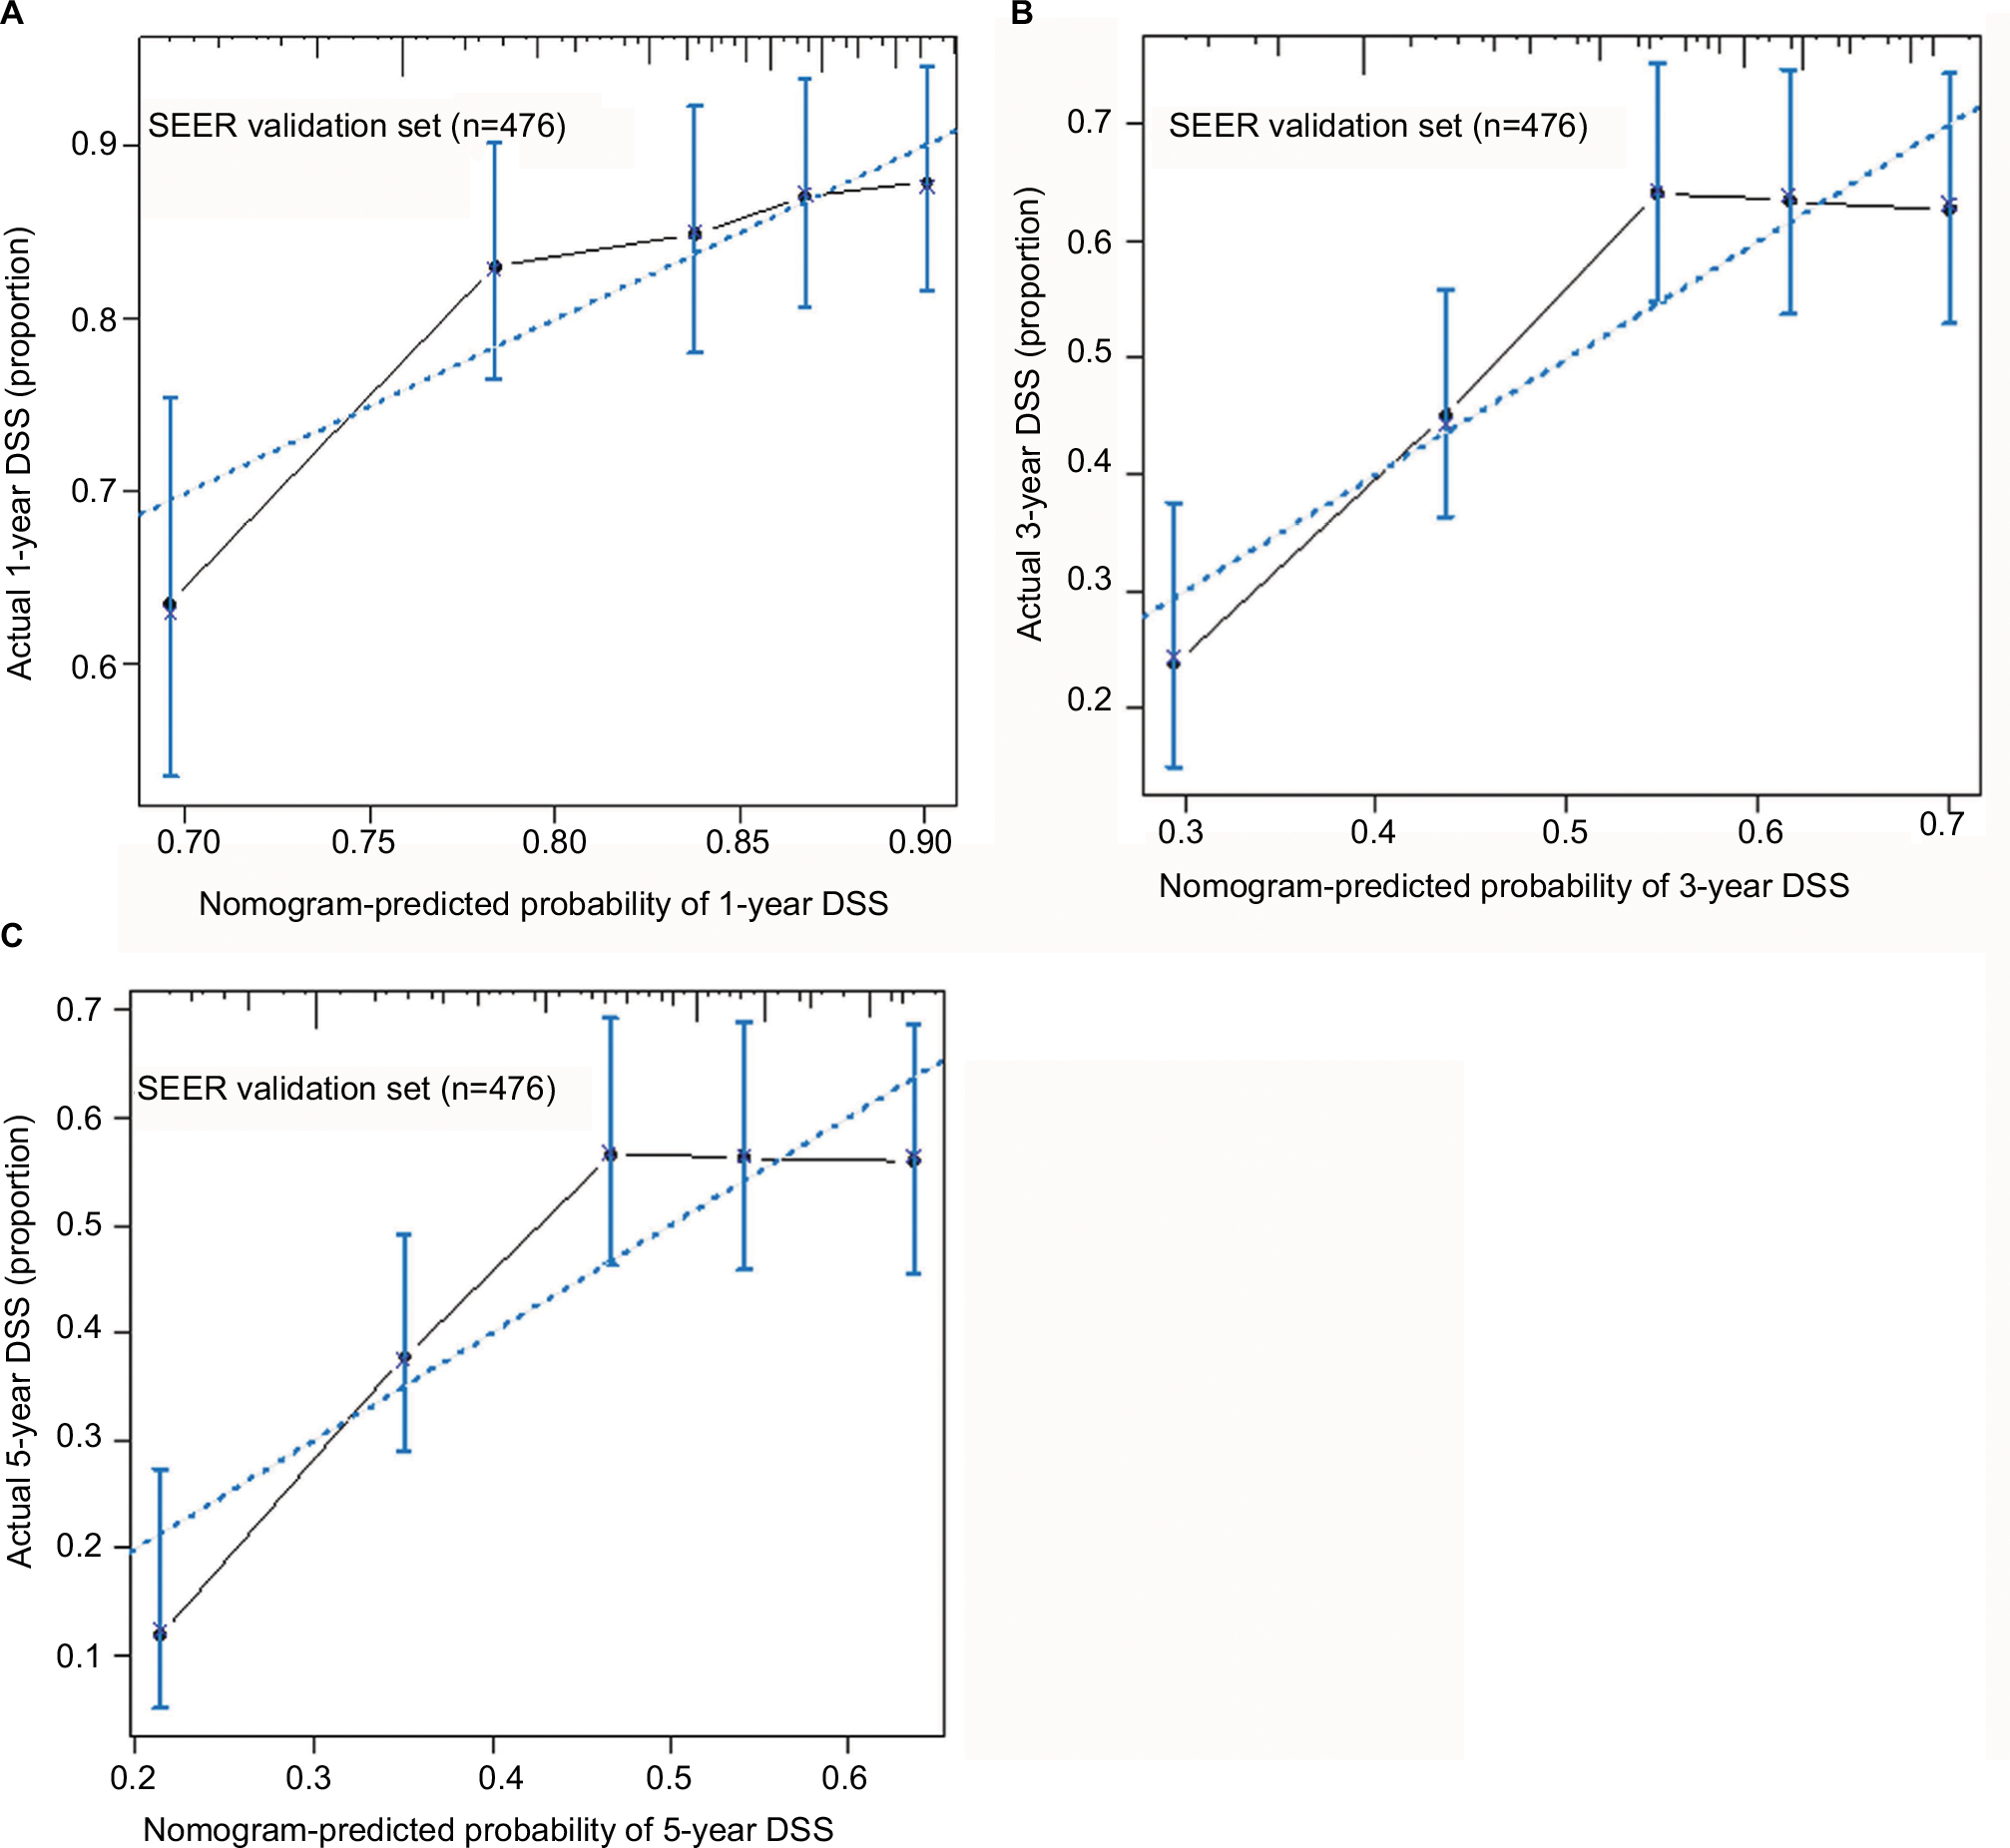 | Figure 3 Calibration plot for predicting patients’ DSS at 1 year (A), 3 years (B), and 5 years (C) in the validation set. Notes: The X-axis represents the predicted survival of nomogram, and on the Y-axis is plotted actual survival. The dotted line represents the ideal correlationship between predicted and actual survival. Abbreviations: DSS, disease-specific survival; SEER, Surveillance, Epidemiology, and End Results. |
Subset analysis
Given the fact that esophageal adenocarcinoma patients and esophageal squamous cell carcinoma patients respond differently to the pRT, we made a subset analysis by the histological type. Based on the histological type of patients, the primary cohort was divided into two validation cohorts. Patients with adenocarcinoma type were designed as adenocarcinoma validation set, and the patients with squamous cell carcinoma were defined as squamous cell carcinoma validation set. In adenocarcinoma validation set, the C-index of proposed nomogram was 0.65 (95% CI, 0.62 to 0.67), which was significantly higher than that proposed by the AJCC staging system (0.61, 95% CI, 0.60 to 0.63; p<0.001). Additionally, the results were similar in the squamous cell carcinoma validation set. Compared with the AJCC staging system, the proposed nomogram exhibited a more accurate survival prediction in the squamous cell carcinoma validation set (0.63 vs 0.52, p<0.001). As shown in Figure 4, the predicted DSS rate was within a 10% margin of actual outcomes in adenocarcinoma validation set and squamous cell carcinoma validation set.
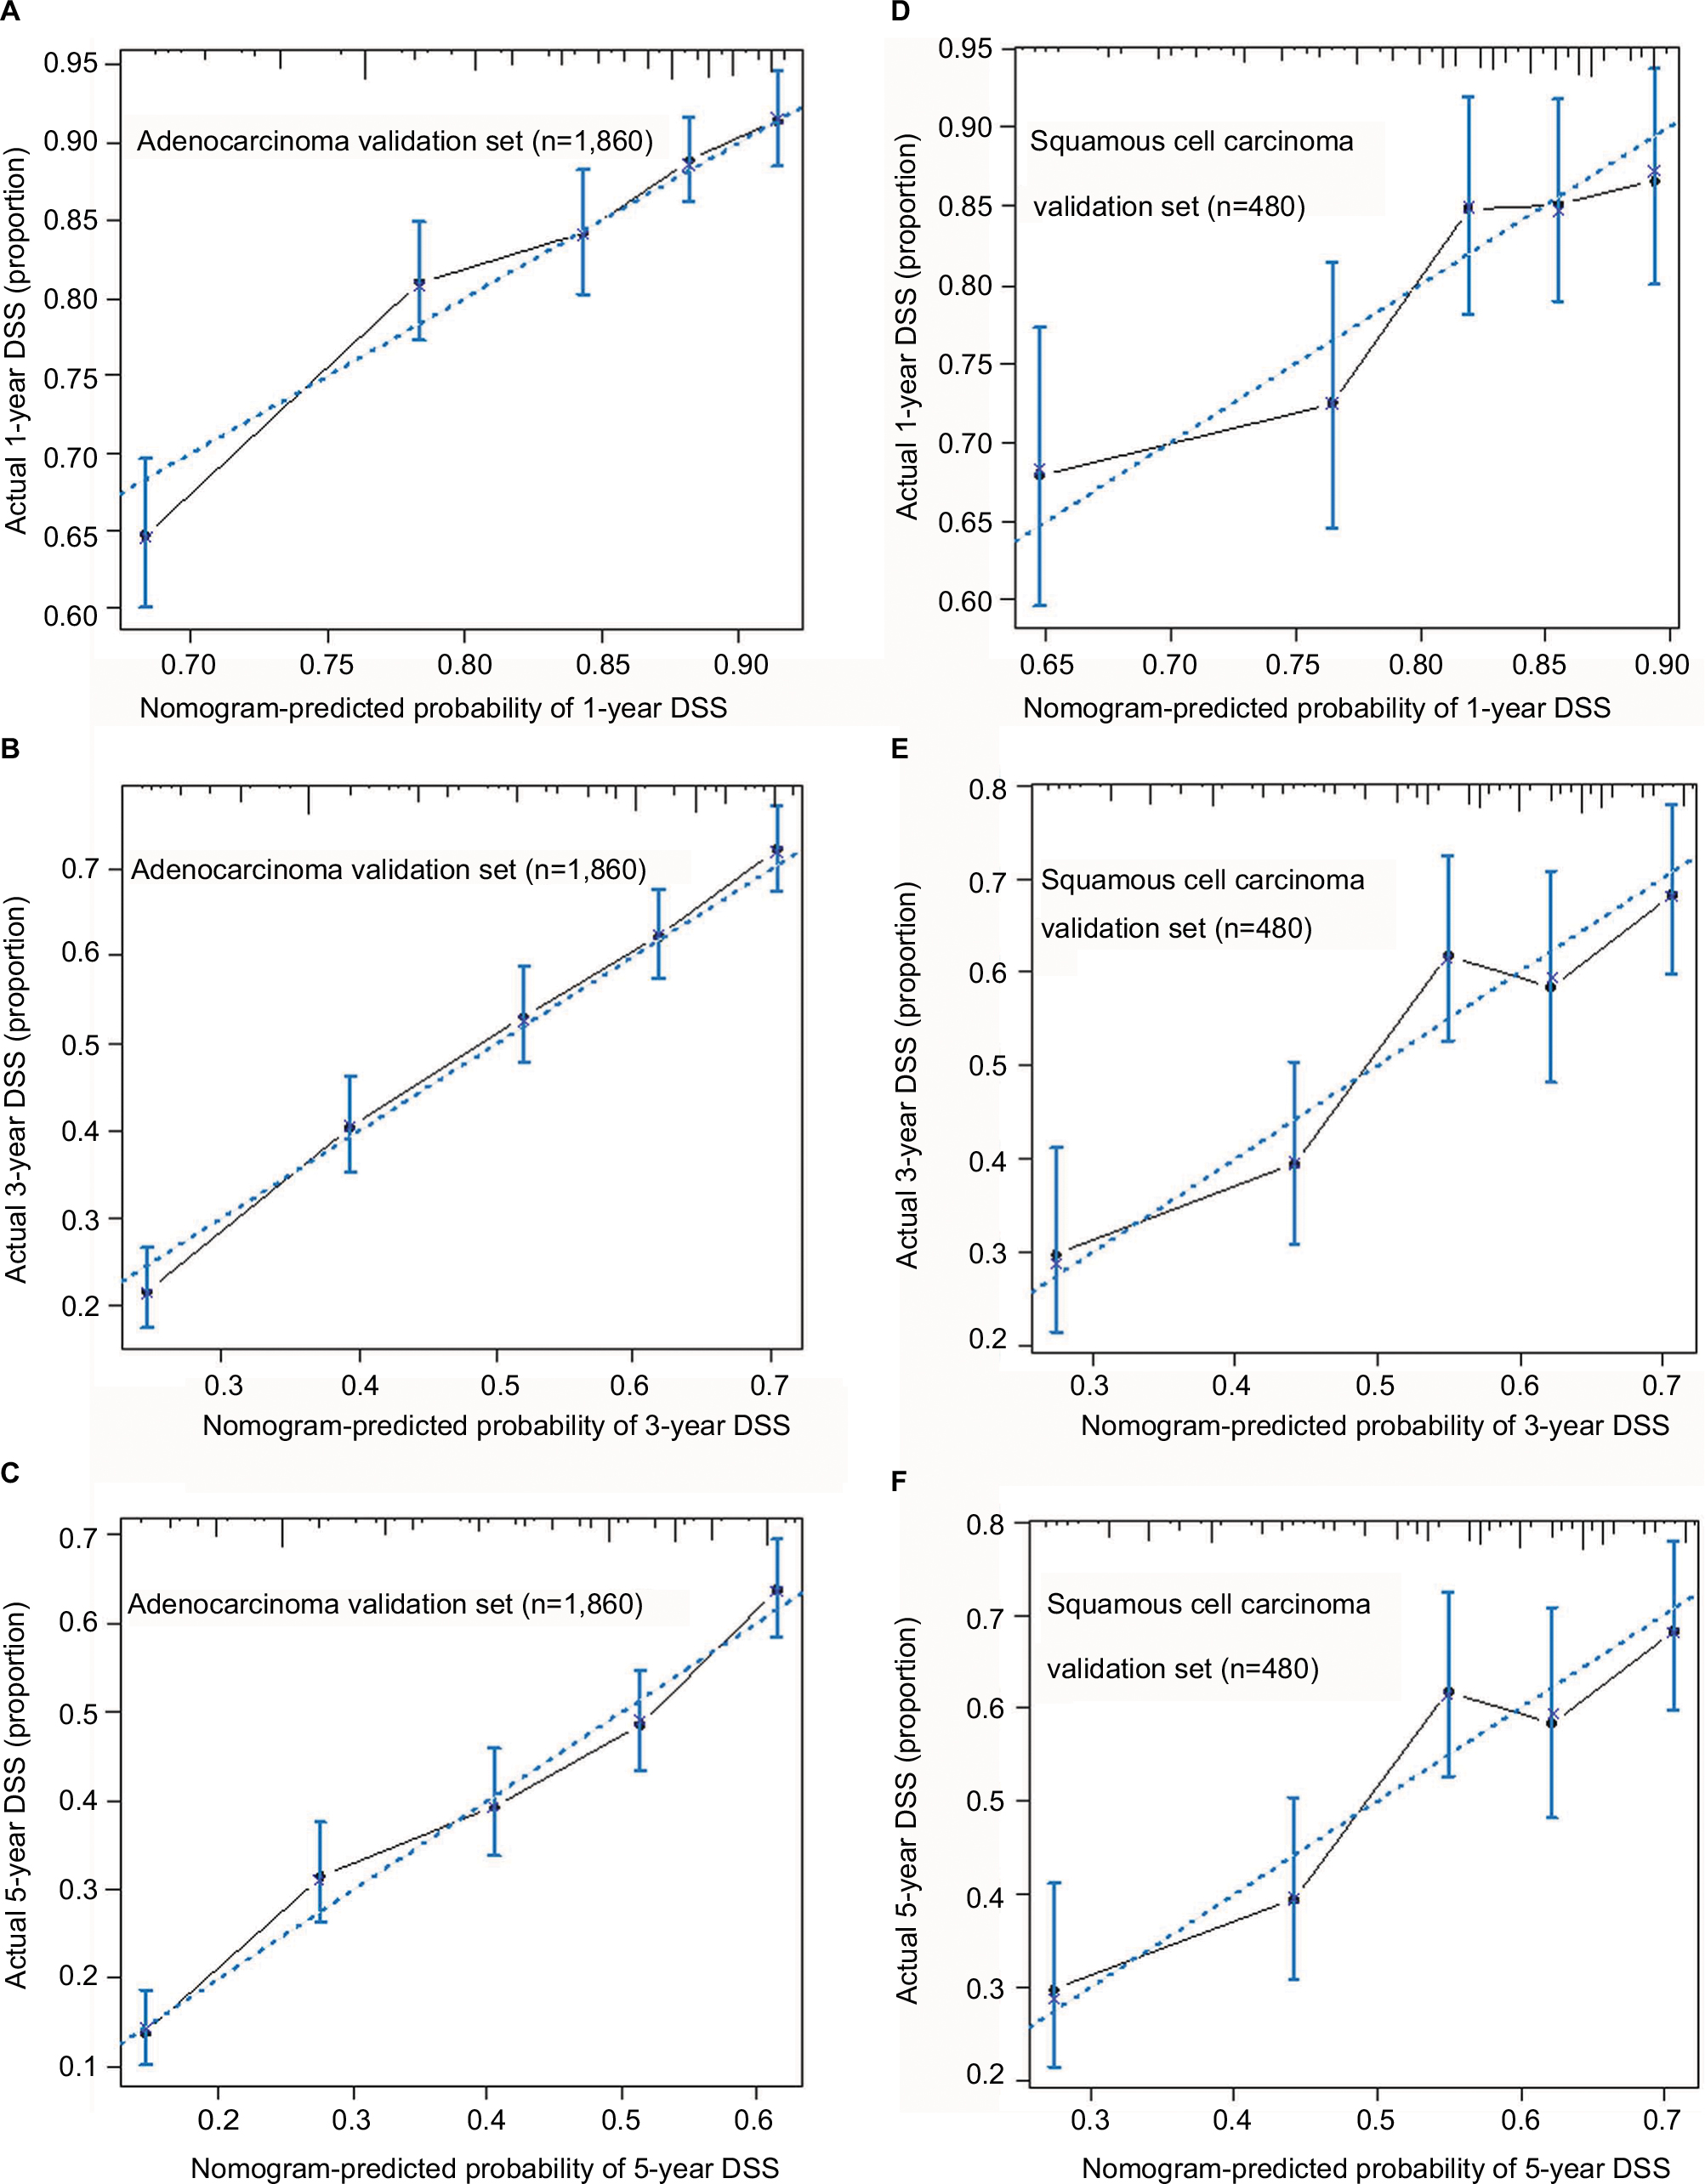 | Figure 4 Calibration plots for predicting patients’ DSS at 1 year (A), 3 years (B), and 5 years (C) in the adenocarcinoma validation set. Calibration plots for and predicting DSS at 1 year (D), 3 years (E), and 5 years (F) in the squamous cell carcinoma validation set. Notes: The X-axis represents the predicted survival of nomogram, and on Y-axis is plotted actual survival. The dotted line represents the ideal correlationship between predicted and actual survival. Abbreviation: DSS, disease-specific survival. |
Discussion
In the current study, we first established and validated a prognostic nomogram to predict DSS for nMEC patients who underwent pRT. On comparison with the seventh edition of AJCC staging system, we found the proposed nomogram exhibited more accuracy in DSS prediction of nMEC patients who underwent pRT (C-index: 0.62 vs 0.55, p<0.001), regardless of the patient’s histological type.
The use of prognostic model for predicting the survival of nMEC patients who underwent preoperative treatment is still controversial. In 2014, based on the SEER-Medical database, Eil et al established a nomogram for nMEC patients who received neoadjuvant chemoradiotherapy followed by surgery or surgery only.15 The prognostic model included patients’ age at diagnosis, sex, histology, yp-T stage, yp-N stage, TLN, and treatment. It exhibited a wonderful survival prediction for those patients (C-index: 0.72). However, the primary cohort of this nomogram included 562 (68%) patients who received esophagectomy only (the remaining patients underwent neoadjuvant chemoradiotherapy). Given the tumor downstaging of neoadjuvant chemoradiotherapy, the survival of patients undergoing esophagectomy may differ from the patients with neoadjuvant therapy even if they had the same pathological stage. It may underestimate the survival benefit for the patients without neoadjuvant chemoradiotherapy. A nomogram only for the patients receiving neoadjuvant therapy may provide more accuracy in survival prediction. In 2016, based on the 626 patients who had received neoadjuvant chemoradiotherapy from CROSS-I and CROSS-II trails, Shapiro et al established a nomogram to predict survival for the nMEC patients who underwent neoadjuvant chemoradiotherapy.16 This nomogram included clinical lymph node stage, yp-T stage, and yp-N stage and exhibited a more accurate survival prediction (C-index: 0.63). This study provided a novel model that can estimate individual survival for nMEC patients after preoperative chemoradiotherapy. However, both the training set and validation set were from tertiary care institutions that gave special treatments in nMECs, so selection bias cannot be ignored. In fact, the performance of this nomogram in predicting survival of nMEC patients in a general population was unclear. Moreover, several other important factors, such as mLNR, had not been analyzed.
mLNR, as a prognostic factor, has been analyzed and demonstrated as an independent survival predictor for EC patients in several studies. Those studies have found that mLNR may better stratify nMEC patients’ survival than AJCC N staging system.17,18 However, the prognostic role of mLNR in nMEC patients after pRT has not been carefully evaluated. In the current study, based on a multi-institution and multi-population database, we first demonstrated that mLNR is associated with the survival of nMEC patients who underwent pRT followed by surgery. Furthermore, compared with lymph node stage, the mLNR stage can dramatically reduce the stage migration than the yp-N stage, regardless of the TLN. Interestingly, the proposed nomogram incorporating mLNR exhibited a more accurate survival prediction than the nomogram incooperating the number of metastatic lymph nodes (data not shown).
Although adenocarcinoma and squamous cell carcinoma respond differently to pRT,19,20 our study found that the pathological type was not associated with survival in nMEC patients treated with pRT followed by surgery. Thus, the proposed nomogram was derived from a cohort which included both adenocarcinoma and squamous cell carcinoma. Indeed, in the subset analysis, the proposed nomogram was found more accurate than AJCC staging system both in adenocarcinoma validation set and squamous cell validation set. Therefore, the proposed nomogram had a wider application for histological differences observed in nMEC patients.
Limitations
There are some limitations that should be acknowledged. First, since only those patients who had complete information were included in the current study, selection bias may exist. Second, as this nomogram was based on SEER database, analysis was intrinsically limited by the SEER database, which included the lack of information regarding other important survival predictors. Several predictors such as surgical margins, genetic differences, protein expression differences, and postoperative treatments had not been analyzed in the current study.
Conclusion
We first developed and validated a prognostic nomogram to provide an individual survival prediction for EC patients who underwent pRT. Compared with the seventh edition of AJCC staging system, the proposed nomogram exhibits a better prognostic discrimination and survival prediction. It can be used to calculate individualized survival prediction and provide better treatment allocation for EC patients.
Acknowledgment
The authors thank their colleagues at the Department of Head – Neck and Thoracic Surgery for their kind help.
Author contributions
Conception and design: SL and KX; development of methodology: SL and KX; collection and assembly of data: JL; data analysis and interpretation: JL; writing, review, and/or revision of the manuscript: all authors; administrative, technical, or material support: KX; study supervision: KX. All authors contributed toward data analysis, drafting and revising the paper and agree to be accountable for all aspects of the work.
Disclosure
The authors report no conflicts of interest in this work.
References
Devesa SS, Blot WJ, Fraumeni JF, Jr. Changing patterns in the incidence of esophageal and gastric carcinoma in the United States. Cancer. 1998;83:2049–2053. | ||
Siegel RL, Miller KD, Jemal A. Cancer statistics, 2016. CA Cancer J Clin. 2016;66:7–30. | ||
Rice TW, Rusch VW, Apperson-Hansen C, et al. Worldwide esophageal cancer collaboration. Dis Esophagus. 2009;22:1–8. | ||
Allum WH, Stenning SP, Bancewicz J, et al. Long-term results of a randomized trial of surgery with or without preoperative chemotherapy in esophageal cancer. J Clin Oncol. 2009;27:5062–5067. | ||
Geh JI, Crellin AM, Glynne-Jones R. Preoperative (neoadjuvant) chemoradiotherapy in oesophageal cancer. Br J Surg. 2001;88:338–356. | ||
Edge SBBD, Compton CC, Fritz AG, Greene FL, Trotti A. AJCC Cancer Staging Manual. 7th ed. Springer: New York; 2010 | ||
Rizk NP, Venkatraman E, Bains MS, et al. American Joint Committee on Cancer staging system does not accurately predict survival in patients receiving multimodality therapy for esophageal adenocarcinoma. J Clin Oncol. 2007;25:507–512. | ||
Chirieac LR, Swisher SG, Ajani JA, et al. Posttherapy pathologic stage predicts survival in patients with esophageal carcinoma receiving preoperative chemoradiation. Cancer. 2005;103:1347–1355. | ||
Berger AC, Farma J, Scott WJ, et al. Complete response to neoadjuvant chemoradiotherapy in esophageal carcinoma is associated with significantly improved survival. J Clin Oncol. 2005;23:4330–4337. | ||
Hirabayashi S, Kosugi S, Isobe Y, et al. Development and external validation of a nomogram for overall survival after curative resection in serosa-negative, locally advanced gastric cancer. Ann Oncol. 2014;25:1179–1184. | ||
Liu J, Geng Q, Liu Z, et al. Development and external validation of a prognostic nomogram for gastric cancer using the national cancer registry. Oncotarget. 2016;7:35853–35864. | ||
Liang W, Zhang L, Jiang G, et al. Development and validation of a nomogram for predicting survival in patients with resected non-small-cell lung cancer. J Clin Oncol. 2015;33:861–869. | ||
Liu J, Geng Q, Chen S, et al. Nomogram based on systemic inflammatory response markers predicting the survival of patients with resectable gastric cancer after D2 gastrectomy. Oncotarget. 2016;7:37556–37565. | ||
Han DS, Suh YS, Kong SH, et al. Nomogram predicting long-term survival after d2 gastrectomy for gastric cancer. J Clin Oncol. 2012;30:3834–3840. | ||
Eil R, Diggs BS, Wang SJ, et al. Nomogram for predicting the benefit of neoadjuvant chemoradiotherapy for patients with esophageal cancer: a SEER-Medicare analysis. Cancer. 2014;120:492–498. | ||
Shapiro J, van Klaveren D, Lagarde SM, et al. Prediction of survival in patients with oesophageal or junctional cancer receiving neoadjuvant chemoradiotherapy and surgery. Br J Surg. 2016;103:1039–1047. | ||
Mariette C, Piessen G, Briez N, et al. The number of metastatic lymph nodes and the ratio between metastatic and examined lymph nodes are independent prognostic factors in esophageal cancer regardless of neoadjuvant chemoradiation or lymphadenectomy extent. Ann Surg. 2008;247:365–371. | ||
Greenstein AJ, Litle VR, Swanson SJ, et al. Prognostic significance of the number of lymph node metastases in esophageal cancer. J Am Coll Surg. 2008;206:239–246. | ||
Seydel HG, Leichman L, Byhardt R, et al. Preoperative radiation and chemotherapy for localized squamous cell carcinoma of the esophagus: a RTOG Study. Int J Radiat Oncol Biol Phys. 1988;14:33–35. | ||
Keller SM, Ryan LM, Coia LR, et al. High dose chemoradiotherapy followed by esophagectomy for adenocarcinoma of the esophagus and gastroesophageal junction: results of a phase II study of the Eastern Cooperative Oncology Group. Cancer. 1998;83:1908–1916. |
Supplementary materials
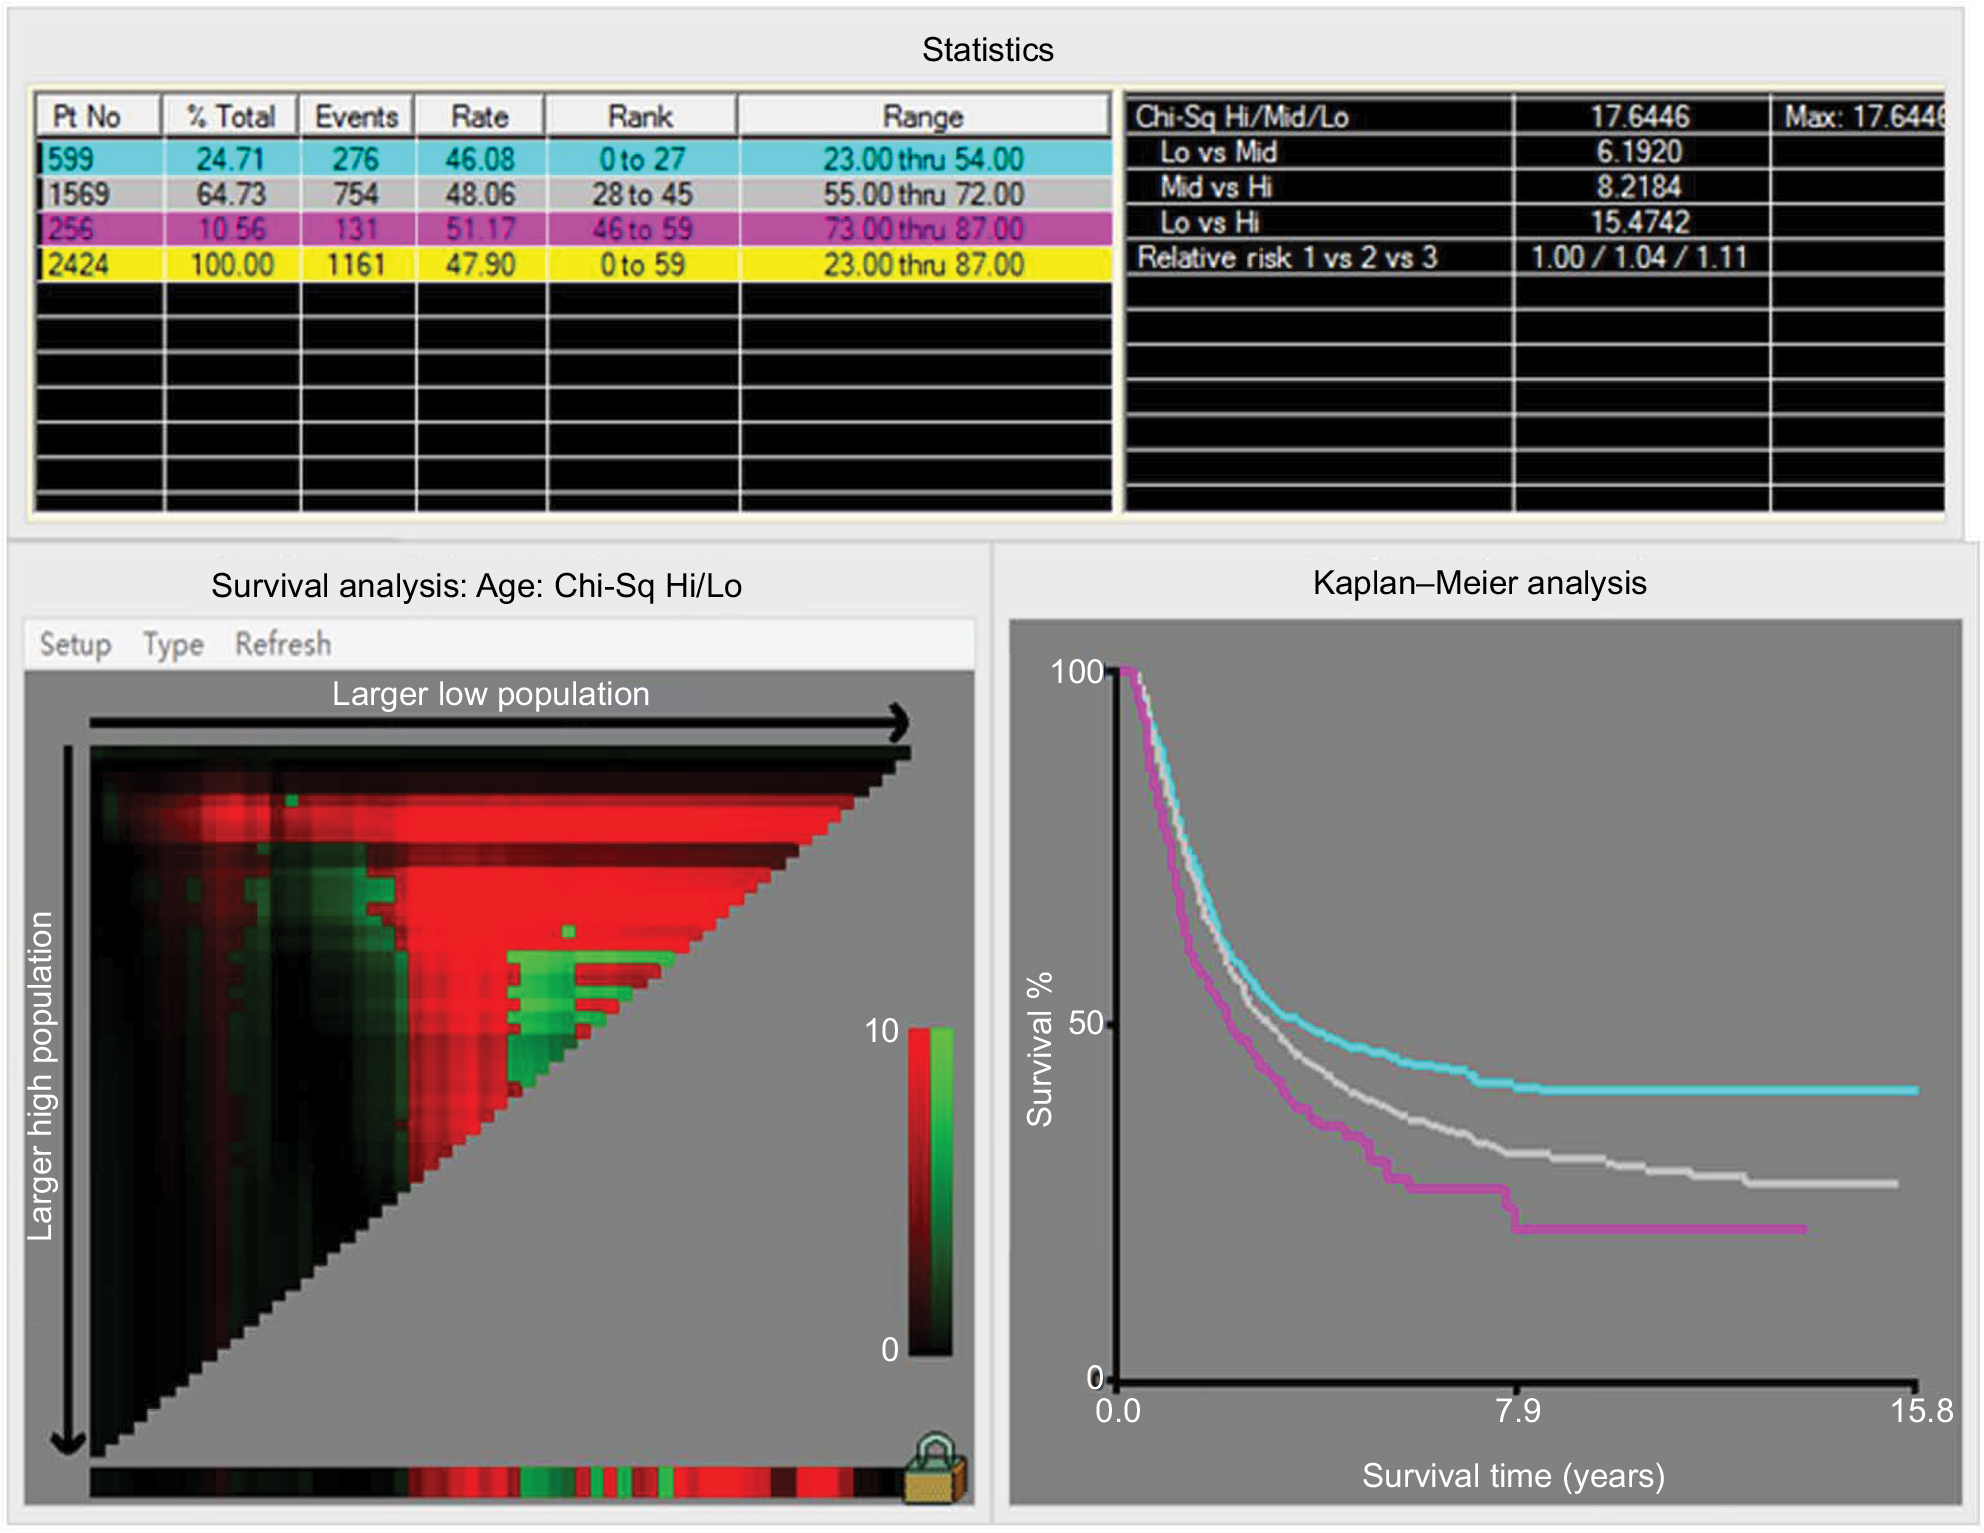 | Figure S1 X-tile analysis identified the best cutoff points for age at diagnosis. Notes: The X-tile program divided the data of age at diagnosis into three groups. Statistical significance is assessed by using the cutoff point derived from a training set to parse a separate validation set. p-values were obtained from a standard log-rank test and plotted at the lookup table. Abbreviations: Chi-Sq, chi square; Hi, high; Lo, low, Mid, median; Max, maximum; Pt No, patient number. |
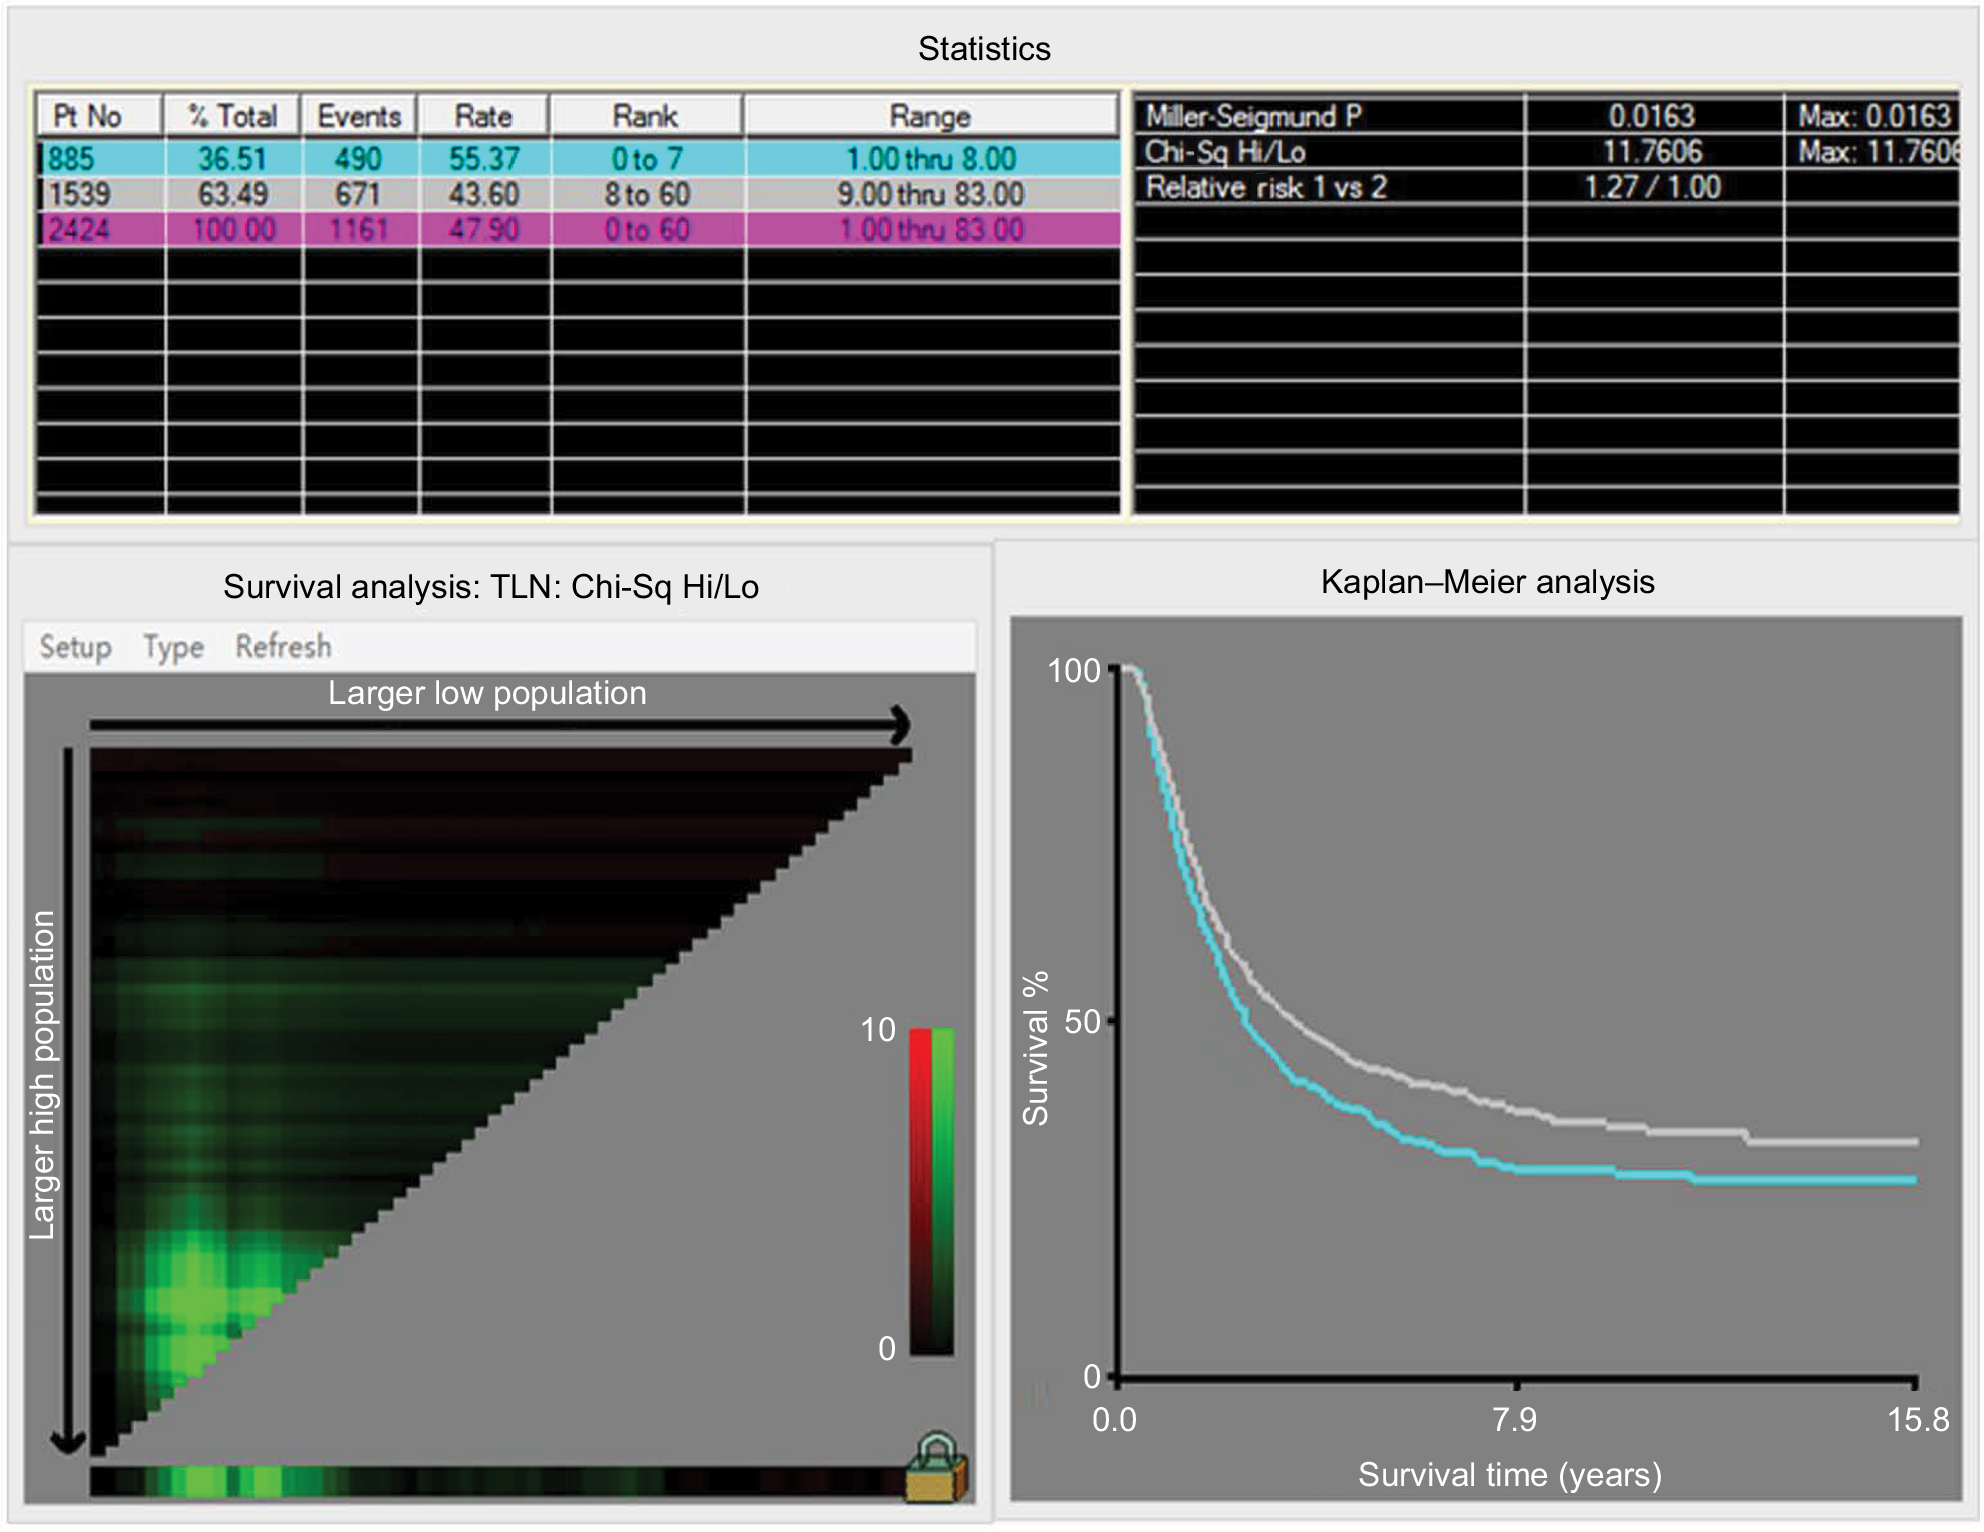 | Figure S2 X-tile analysis identified the best cutoff points for total number of examined lymph nodes. Notes: The X-tile program divided the data of total number of examined lymph nodes into two groups. Statistical significance was assessed by using the cutoff point derived from a training set to parse a separate validation set. p-values were obtained from a standard log-rank test and plotted at the lookup table. Abbreviations: TLN, total examined lymph node; Chi-Sq, chi square; Hi, high; Lo, low; Max, maximum; Pt No, patient number. |
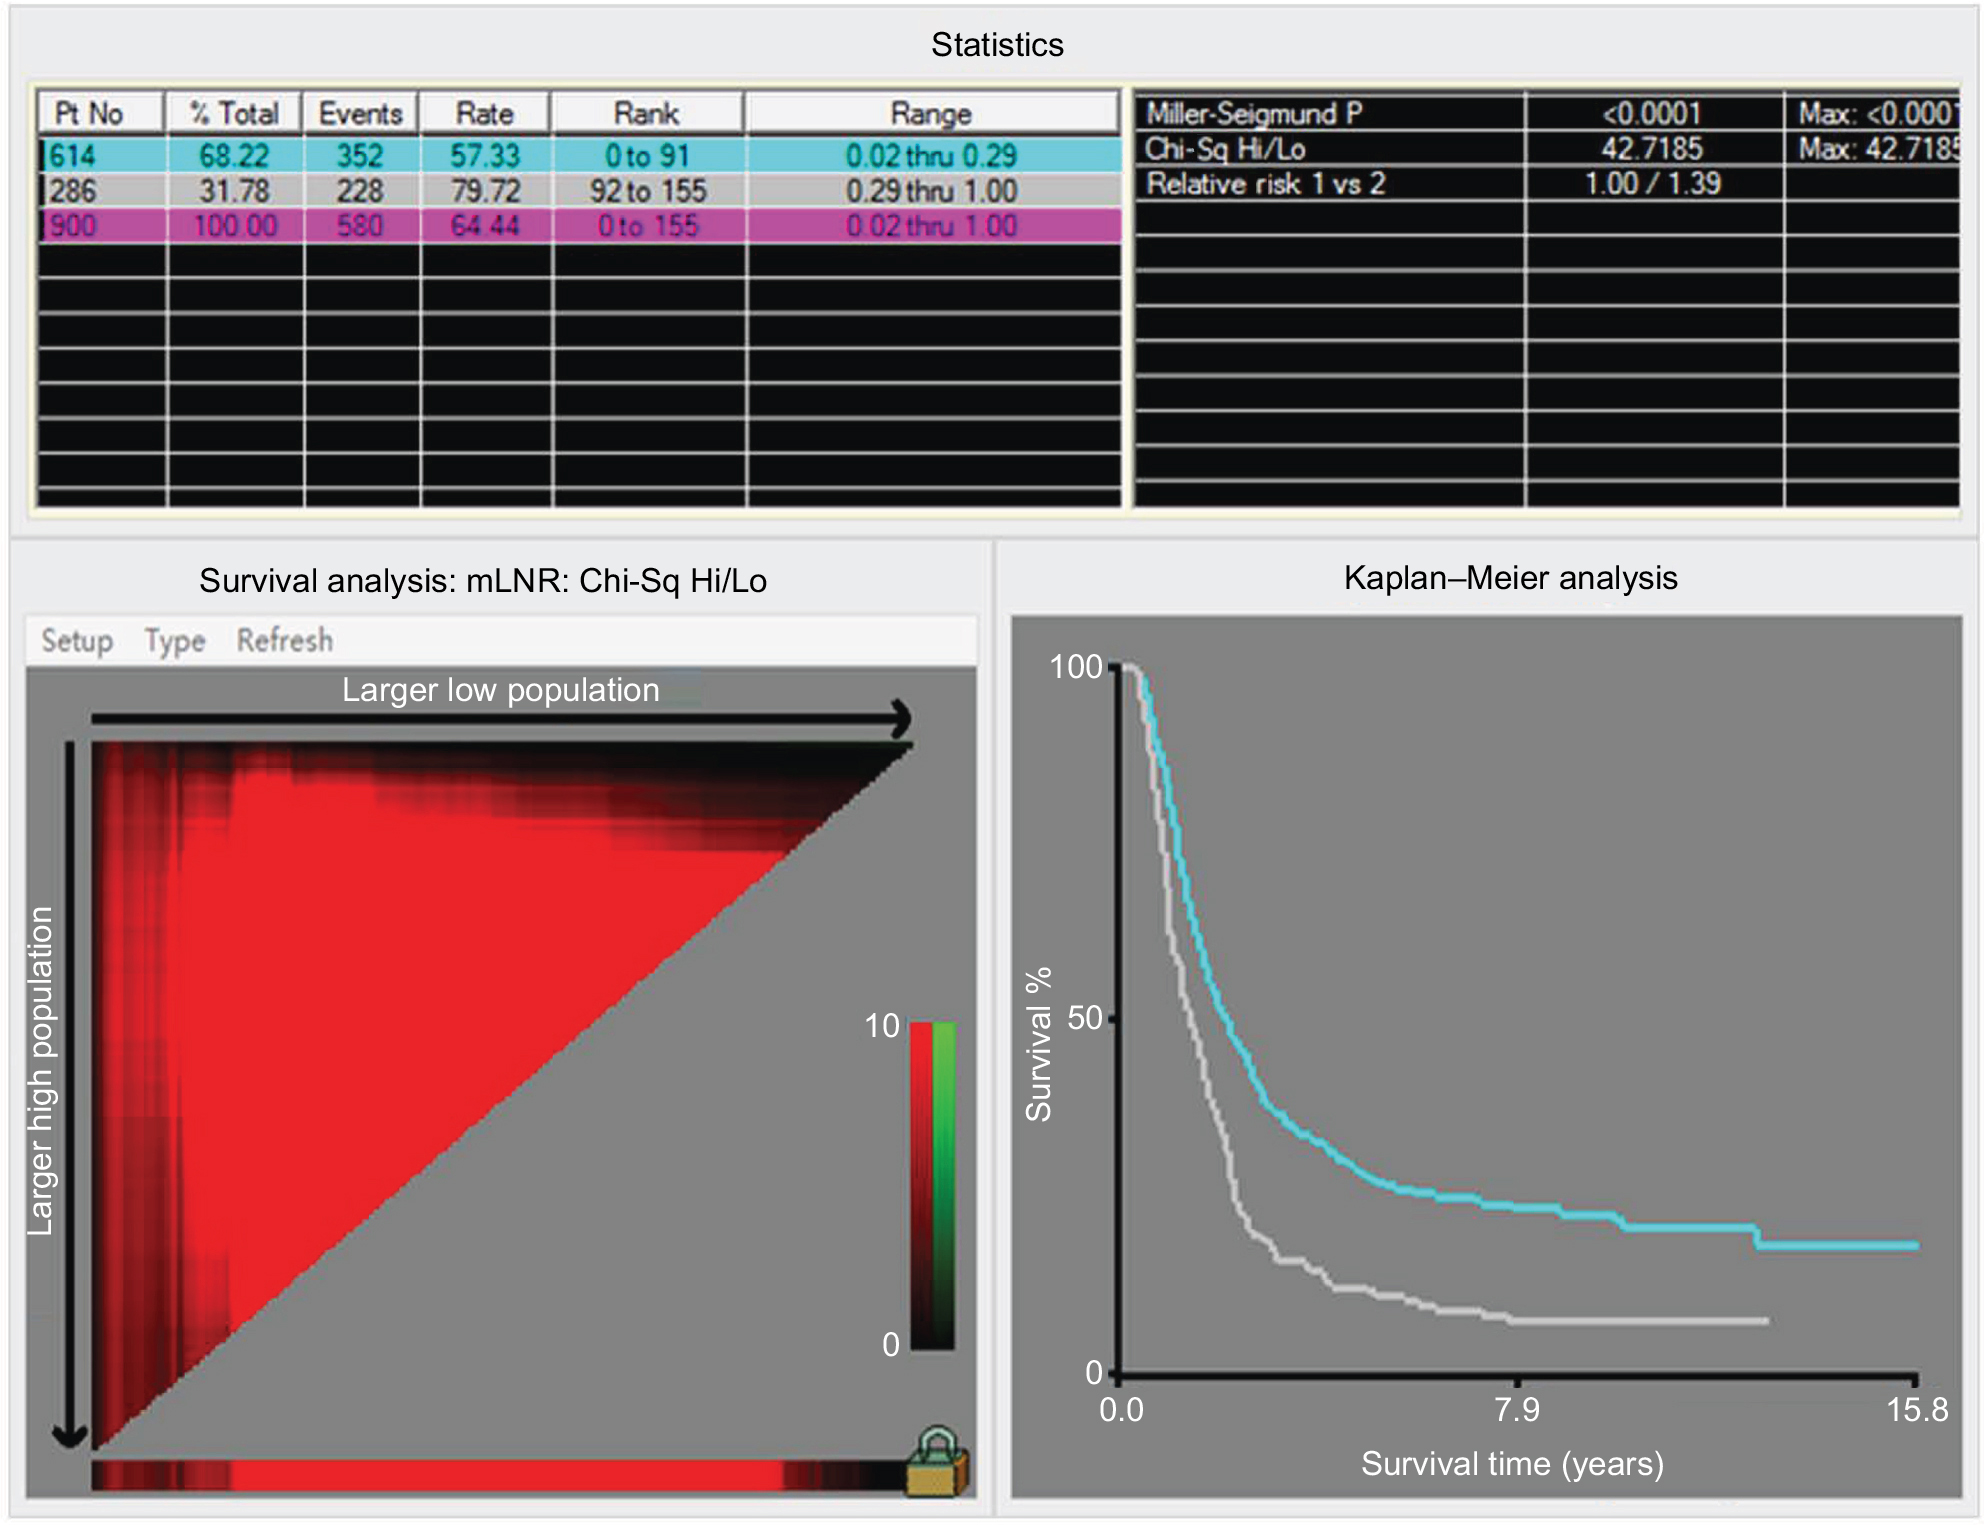 | Figure S3 X-tile analysis identified the best cutoff points for the yp-mLNR in the patients with lymph node metastasis. Notes: The X-tile program divided the data of yp-mLNR into two groups. Statistical significance was assessed by using the cutoff point derived from a training set to parse a separate validation set. p-values were obtained from a standard log-rank test and plotted at the lookup table. Abbreviations: mLNR, metastatic lymph node ratio; Chi-Sq, chi square; Hi, high; Lo, low, Mid, median; Max, maximum; Pt No, patient number. |
 © 2018 The Author(s). This work is published and licensed by Dove Medical Press Limited. The
full terms of this license are available at https://www.dovepress.com/terms
and incorporate the Creative Commons Attribution
- Non Commercial (unported, 3.0) License.
By accessing the work you hereby accept the Terms. Non-commercial uses of the work are permitted
without any further permission from Dove Medical Press Limited, provided the work is properly
attributed. For permission for commercial use of this work, please see paragraphs 4.2 and 5 of our Terms.
© 2018 The Author(s). This work is published and licensed by Dove Medical Press Limited. The
full terms of this license are available at https://www.dovepress.com/terms
and incorporate the Creative Commons Attribution
- Non Commercial (unported, 3.0) License.
By accessing the work you hereby accept the Terms. Non-commercial uses of the work are permitted
without any further permission from Dove Medical Press Limited, provided the work is properly
attributed. For permission for commercial use of this work, please see paragraphs 4.2 and 5 of our Terms.