")
Back to Journals » International Journal of General Medicine » Volume 14
Nomogram Prediction of Short-Term Outcome After Intracerebral Hemorrhage
Authors Kang H, Cai Q, Gong L, Wang Y
Received 23 July 2021
Accepted for publication 25 August 2021
Published 7 September 2021 Volume 2021:14 Pages 5333—5343
DOI https://doi.org/10.2147/IJGM.S330742
Checked for plagiarism Yes
Review by Single anonymous peer review
Peer reviewer comments 2
Editor who approved publication: Dr Scott Fraser
Huili Kang,1,* Qiuqiong Cai,1,* Liang Gong,2 Ying Wang1
1Department of Ultrasound, Shanghai Punan Hospital of Pudong New District, Shanghai, People’s Republic of China; 2Department of Neurosurgery, Shanghai Punan Hospital of Pudong New District, Shanghai, People’s Republic of China
*These authors contributed equally to this work
Correspondence: Ying Wang
Department of Ultrasound, Shanghai Punan Hospital of Pudong New District, No. 519, South Pier Road, Pudong New District, Shanghai, 200125, People’s Republic of China
Tel +86-13918901577
Email [email protected]
Background: The early symptoms of patients with elevated intracranial pressure (ICP) after intracerebral hemorrhage (ICH) are easily overlooked, which will result in missing the optimal opportunity for clinical intervention. However, it is difficult for ICH patients admitted to the neurology department to receive invasive ICP monitoring, although it is crucial for the early identification of neurologic deterioration (ND).
Objective: The aim of this study is to investigate the association between the changes of transcranial Doppler (TCD) variables and ND after onset and establish a nomogram for predicting the short-term outcome of ICH.
Methods: A total of 297 patients were recruited and their clinical characteristics and the changes of TCD variables were recorded. The independent prognostic factors for the ND after onset in the ICH patients were screened from multivariate Logistic regression analysis, which were served as inputs for the nomogram construction. Discrimination and calibration validations were performed to assess the performance of the nomogram [concordance index (C-index) for discrimination and Hosmer–Lemeshow (HL) test for calibration] and the decision curve analysis was applied to assess the clinical suitability.
Results: ΔaPI [defined as the change of pulsatility index (PI) between the 1st and 3rd day after onset for affected hemisphere] was independently associated with the ND after onset. Moreover, hematoma volume, presence of intraventricular hemorrhage, and Glasgow coma scale were also the independent prognostic factors of ND. The developed nomogram incorporating ΔaPI showed good discrimination (C-index: 0.916 after 1000 bootstrapping) and calibration (P=0.412, HL test) and yielded net benefits.
Conclusion: The nomogram incorporating ΔaPI might be useful in predicting the risk of ND within 14 days after onset, which might help identify patients in the neurology department in need of further care.
Keywords: nomogram, intracerebral hemorrhage, transcranial Doppler, intracranial pressure, neurologic deterioration, pulsatility index
Introduction
Spontaneous intracerebral hemorrhage (ICH) is one of the leading causes of death and most of the survivors are left with different degrees of disabilities.1,2 Possible complications including hematoma growth, edema development, and intraventricular hemorrhage (IVH) after ICH is attributable to elevated intracranial pressure (ICP) and reduced cerebral perfusion pressure, which causes herniation syndrome and death.3–5 Mannitol is administered to reduce ICP currently, but prophylactic application is not recommended according to the American Academy of Neurology due to the potential side effects such as renal damage and electrolyte imbalance.6,7 Because the symptoms of patients with elevated ICP in the early stage are easily overlooked, which will result in missing the optimal opportunity for clinical intervention.8 ICP monitoring is crucial for the identification of high-risk patients with neurologic deterioration (ND) and the rational application of mannitol.9
Reliable and accurate ICP monitoring can be obtained by various invasive detection techniques, but it is difficult to non-invasively monitor ICP changes in the neurology department.10 Repeated computed tomography (CT) scanning is not practical to monitor the radiologic features of ND due to the patients’ clinical state and the risk of radiation overexposure.11 Transcranial Doppler (TCD) provides a measurement of the cerebral blood flow velocities non-invasively and has become one of the most commonly utilized tools to estimate ICP changes and identify patients requiring invasive monitoring.12 Studies have confirmed that elevated ICP will lead to a decrease in end-diastolic flow velocity (Vd) and an increase in pulsatility index (PI).13,14 Despite TCD has become a regular instrument for indirect measurement of ICP, its prognostic value in ICH is yet to be established. Current quantitative analyses mainly focus on neurosurgery fields such as traumatic brain injury and severe ICH.15,16 However, in the neurology department, changes in the cerebral circulation after ICH are poorly understood due to the lack of effective follow-up measurements. Since ICH has a great extent of therapeutic and prognostic uncertainty, whether TCD can accurately predict ND after ICH is of great clinical significance.
Recent studies indicate that the variability of ICP is a better predictor of neurological outcome than mean ICP in patients with traumatic brain injury.17,18 We hypothesize that the changes of TCD variables, which are well correlated with ICP, may be able to predict the ND for ICH patients. In the present study, we sought to investigate the association between the changes of TCD parameters and ND after onset to establish a nomogram for predicting the short-term outcome of ICH, which was beneficial for improving the treatment and prognosis of ICH patients.
Materials and Methods
This prospective observational study was conducted following the declaration of Helsinki. Written informed consents were obtained from all participants. The local ethics committee approved the study.
Patients
Between January 2018 and March 2021, 391 consecutive adult patients admitted to the department of Neurology in our center with a first-time spontaneous ICH were enrolled in this study. Patients were included if (1) they are diagnosed with supratentorial ICH by CT within 24 hours after onset, (2) hematoma volume was ≤30mL, and midline shift was < l cm; (3) Glasgow Coma Scale (GCS) score on admission was ≥9 point; (4) a conservative treatment plan was adopted with the consent of the family under the premise of stable vital signs; and (5) patients and their families cooperated with the study. Patients were excluded if any of the following applied: (1) patients with primary IVH (n=17); (2) secondary ICH related to aneurysm rupture, arteriovenous malformation, cerebral neoplasm, and coagulopathy (confirmed by clinical history, laboratory tests, and imaging examinations at admission) (n=51); (3) patients with rapid ND within 3 days after onset (n=14); (4) inadequate temporal acoustic bone window for TCD examination (n=12).
Finally, 297 patients were recruited and the following clinical characteristics were collected at admission: 1) demographic data including age and gender; 2) medical history including hypertension, diabetes, and dyslipidemia; 3) blood pressure and blood glucose level; and 4) GCS score.
Cerebral CT Scan
Cerebral CT Scanning was routinely performed on the 1st (on admission), 3rd, 7th, and 14th day with SIEMENS Somatom Perspective CT scanner (Siemens Medical Systems Co. Ltd. Erlangen, Germany). The patients were scanned in a supine position using contiguous 5.0-mm slices, which were parallel to the orbitomeatal baseline. Hematoma volume was calculated according to the Coniglobus formula.19 Perilesional edema volume was obtained by subtracting hematoma volume from the total lesion volume. The total lesion volume was calculated by plotting the lesion area on each slice, then multiplying by the slice thickness (5 mm) to produce a single-plane lesion volume, and finally adding up all slices. Hematoma location was classified as within a lobe or deep hemorrhage. Presence of IVH was also recorded.
TCD Monitoring
TCD examinations were performed using the Delica EMS-9EB (Delica Medical Equipment Co., Ltd., Shenzhen, China) TCD device with a 2 MHz probe by a TCD investigator with more than 5 years of experience. The middle cerebral artery (MCA) was insonated bilaterally at a depth of 45–55 mm with the same sample volume, power, gain, and filter parameters. When a 6-second frame of a clearly readable waveform was obtained, the machine automatically calculated the following variables: systolic (Vs), diastolic (Vd), mean velocities (Vm), and PI from the affected (a) and unaffected (u) hemispheres (Figure 1).
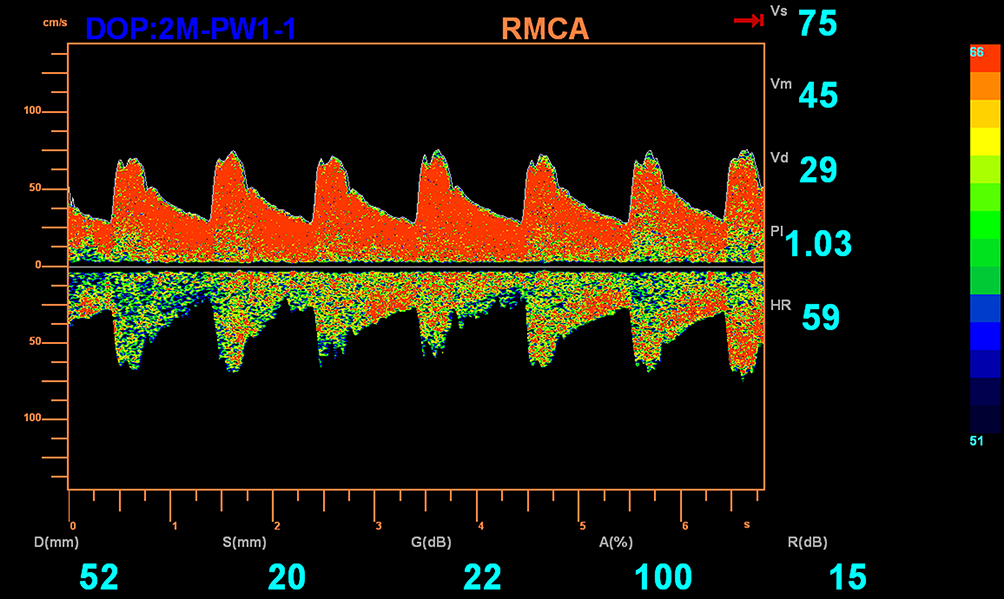 |
Figure 1 MCA hemodynamics evaluated by TCD. The changes of Doppler waveform and the parameters including Vs, Vm, Vd, and PI are recorded automatically when a 6-second frame of a clearly waveform is obtained. Abbreviations: MCA, middle cerebral artery; TCD, transcranial Doppler; Vs, systolic velocity; Vd, diastolic velocity; Vm, mean velocity; PI, pulsatility index. |
Changes in TCD Variables
TCD examinations were performed on the 1st (after the CT diagnosis) and the 3rd day after onset. The TCD variables at the 1st day were recorded as aVsDay1, aVdDay1, aVDay1, aPIDay1 for affected hemisphere and uVsDay1, uVdDay1, uVmDay1, uPIDay1 for unaffected hemisphere. The changes of TCD variables between the 1st and 3rd day were recorded as ΔaVs, ΔaVd, ΔaVm, ΔaPI for affected hemisphere and ΔuVs, ΔuVd, ΔuVm, ΔuPI for unaffected hemisphere. The change of TCD parameter was calculated by the following formula:

where X was the TCD parameter.
Treatment
All ICH patients underwent standardized treatment in accordance with the center protocol. Conservative treatment included hemostasis, strict blood pressure control, respiratory tract kept unobstructed, body temperature ≤38°C, glucose-lowering medications, antibiotic therapy, early rehabilitation exercise, and other supported treatments. Mannitol was administered to patients with ND caused by elevated ICP. A surgical evacuation was considered when repetitive CT (required when GCS decreased by ≥2 points) revealed increased hematoma or perilesional edema volume, obvious midline shift, and other surgical indications.
Short-Term Outcome of ICH Patients
GCS score was re-evaluated every 12 hours. Changes in the GCS score between admission and 14 days after admission were utilized to evaluate the short-term outcome of the ICH patients. Patients with improved outcome, which was defined as an increase in GCS by ≥1 point, were included in the improved group, and those with deteriorated outcome (defined as unchanged GCS score, a decrease of ≥1 point, or death) were included in the ND group.
Statistical Analysis
The numerical variables were presented as mean ± standard deviations for normally distributed data and median (interquartile range) for non-normally distributed data. Univariate and multivariate Logistic regression analyses were performed to investigate the independent prognostic factors of the ND after onset. The odds ratio (OR) and 95% confidence interval (CI) of each factor were estimated. A nomogram was developed based on the weighted sum of each independent variable to predict the short-term outcomes of ICH patients. Bootstrap resampling (1000 times) analysis was applied for the validation. Receiver operating characteristic (ROC) curve was utilized to analyze the discrimination of the nomogram. The area under the curve (AUC), which was also known as the concordance index (C-index), sensitivity, and specificity of the ROC curve were obtained. The calibration of the nomogram was evaluated with the calibration curve combined with the Hosmer–Lemeshow (HL) test. The decision curve analysis (DCA) was applied to assess the clinical suitability. The statistical analyses were performed with IBM SPSS Statistics 22.0 (IBM Corp., Armonk, NY, United States) and R package version 3.6.2.
Results
Clinical Characteristics and TCD Variables of ICH Patients
We included 297 ICH patients with a mean age of 58.16±13.62 years. Among them, 65 (21.9%, 65/297) patients developed ND within 14 days after onset. The clinical characteristics concerning ICH patients and bilateral TCD variables during the 1st and 3rd days are given in Tables 1 and 2, respectively. Hypertension was the most common risk factor (68.4%) in ICH patients. The alterations in PI and Vd from the affected hemisphere were more obvious than those from the unaffected hemisphere (P < 0.05).
 |
Table 1 Clinical Characteristics of ICH Patients |
 |
Table 2 Bilateral TCD Variables of ICH Patients During the 1st and 3rd Days |
Univariate and Multivariate Analyses for the Prognostic Factors of ND After Onset
The improved group included 232 patients and the ND group included 65 patients. Univariate analysis indicated that age, hematoma volume, presence of IVH, GCS, ΔaVd, and ΔaPI were significantly associated with the risk of ND (P < 0.05 for all). Multivariate analysis further revealed that hematoma volume, presence of IVH, GCS, and ΔaPI (P < 0.05 for all) were the independent prognostic factors of the ND after onset (Table 3).
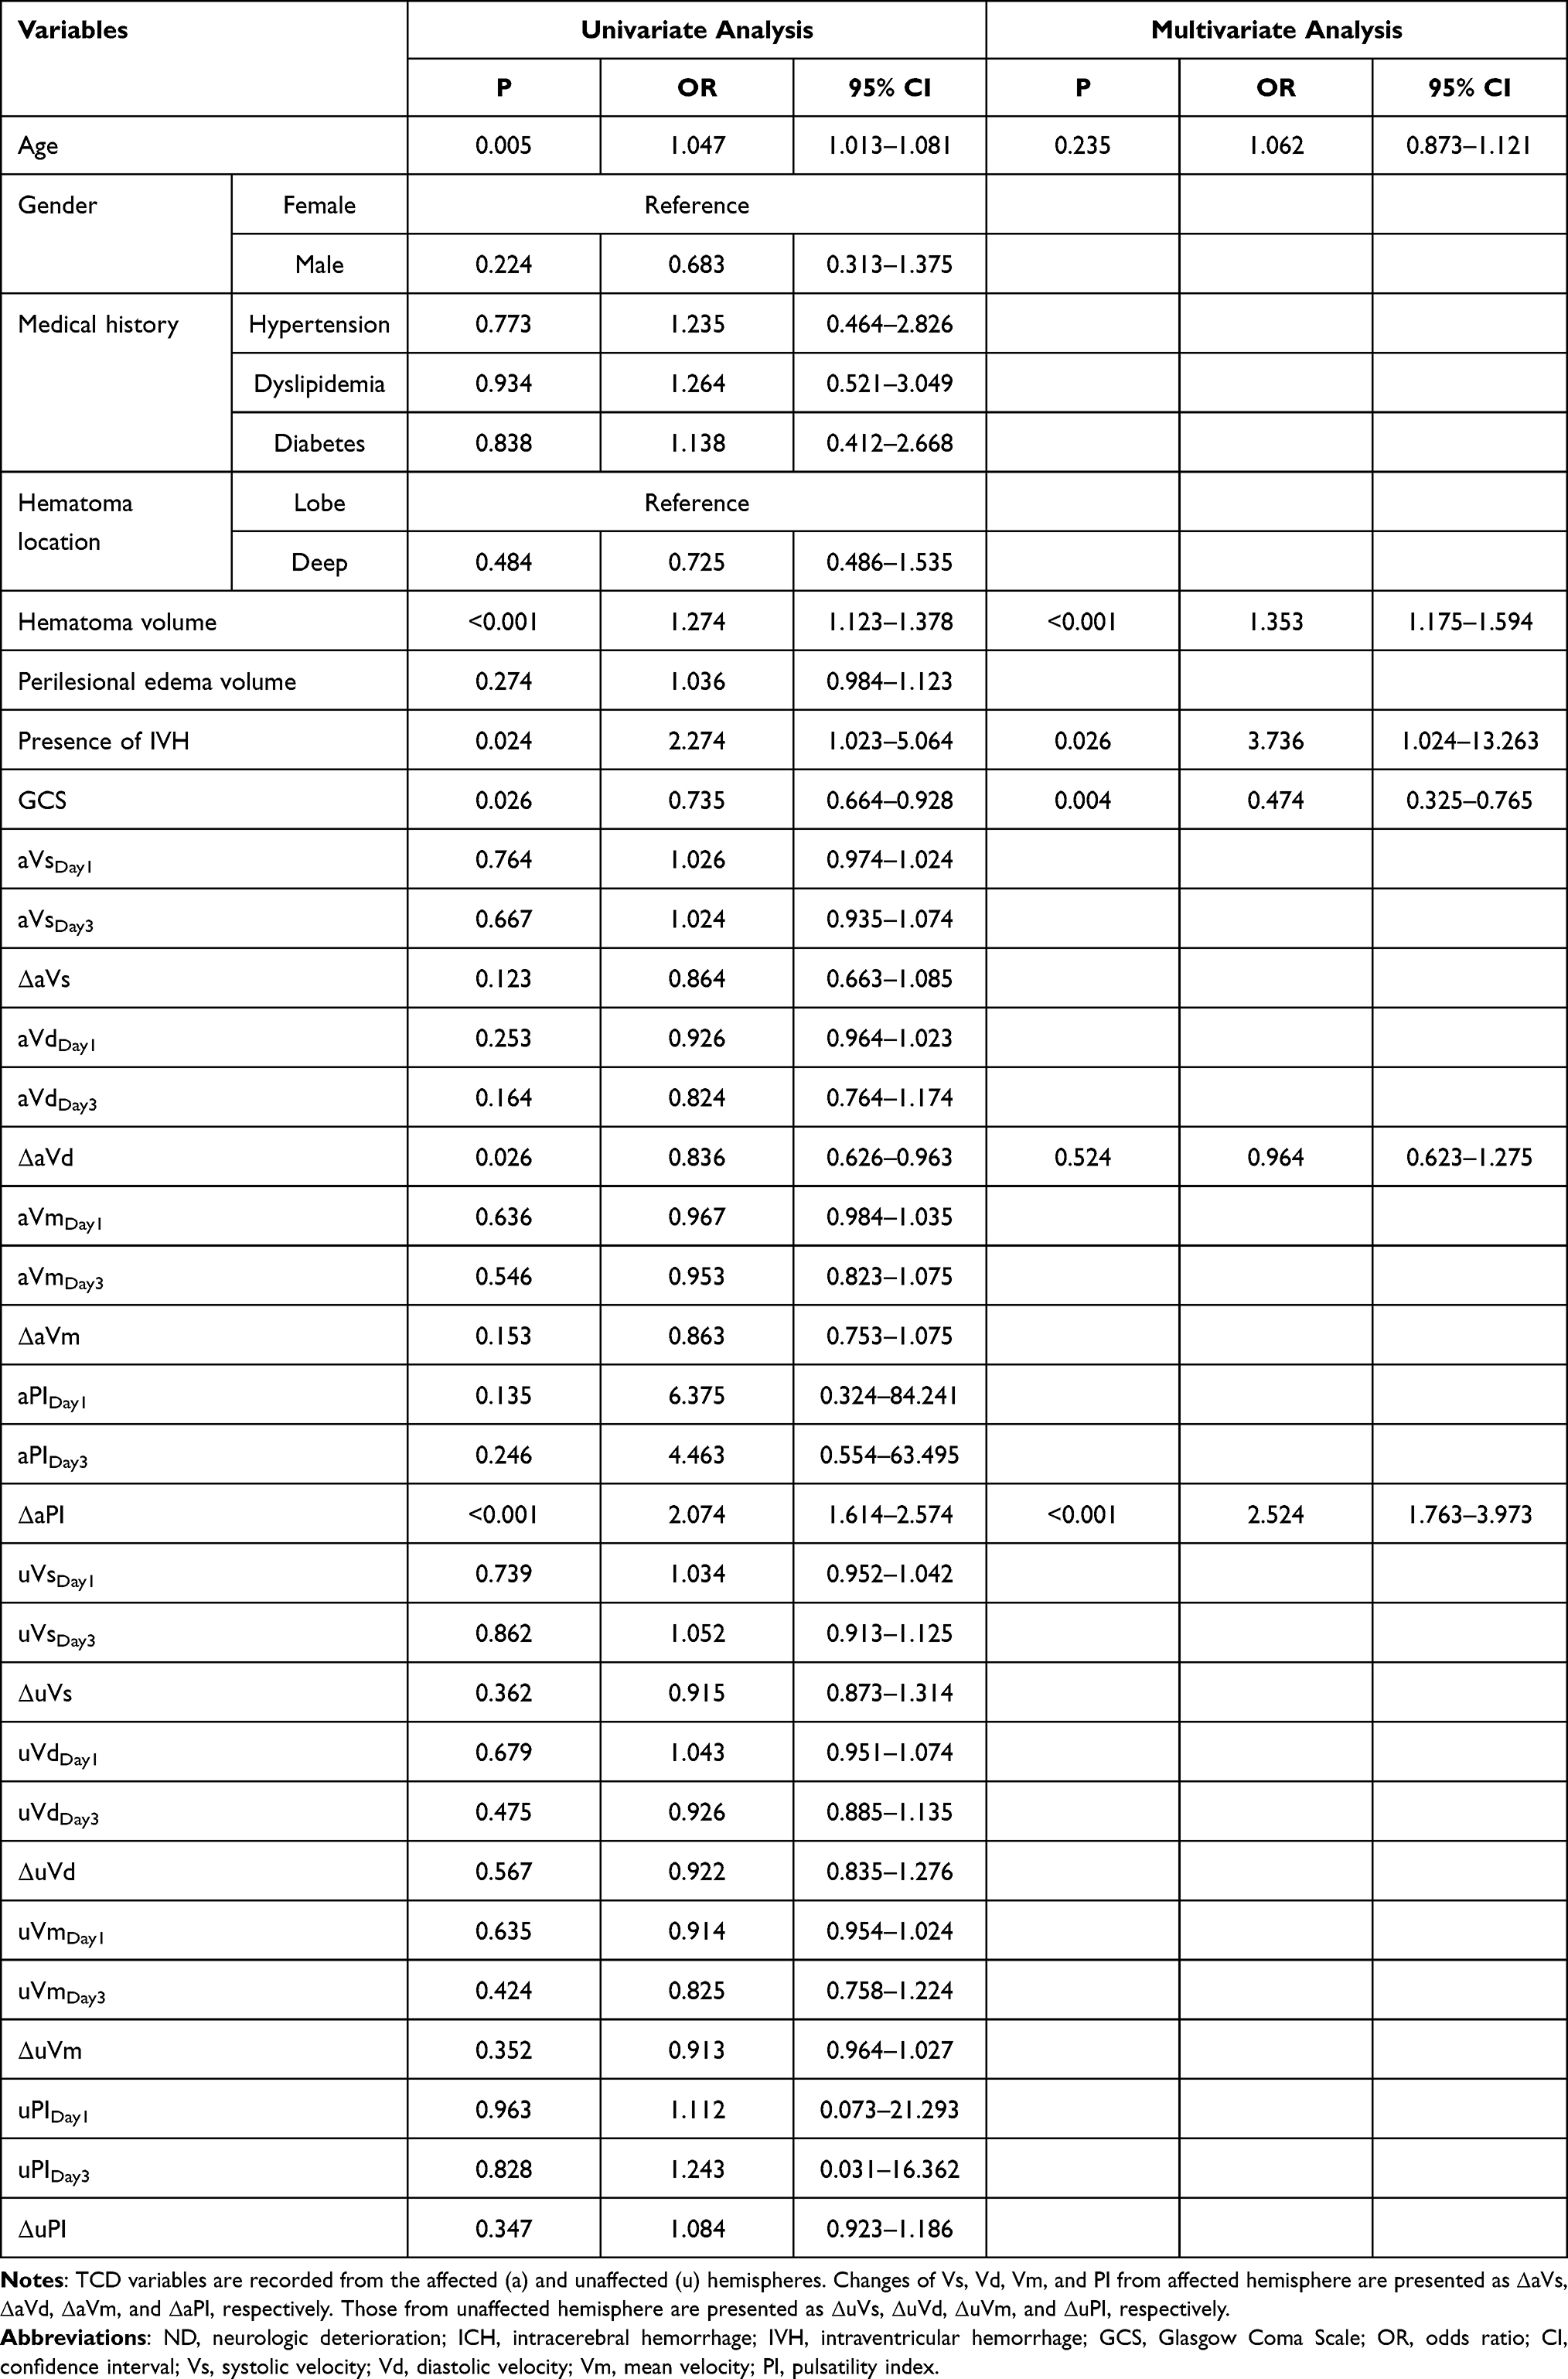 |
Table 3 Univariate and Multivariate Logistic Regressions for Investigating the Independent Prognostic Factors of ND After Onset in ICH Patients |
Nomogram for Predicting the Short-Term Outcome in ICH Patients
We constructed a nomogram with the 4 independent predictors to predict the short-term outcome of ICH (Figure 2). Each predictor was assigned a score proportionally based on its OR value in the multivariate Logistic regression, and the total score was used to determine the estimated risk of ND in ICH patients.
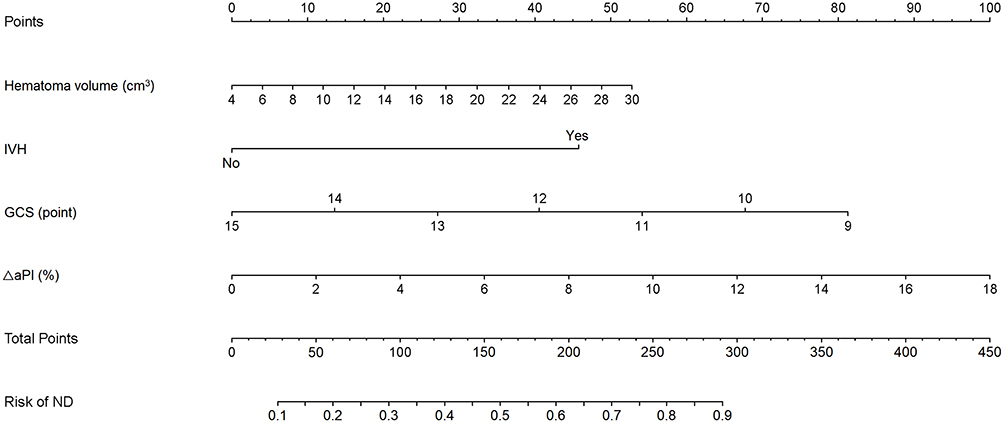 |
Figure 2 Nomogram for predicting the risk of ND after onset in ICH patients. The risk of ND is calculated by adding the points of the following variables (Hematoma volume, IVH, GCS, and ΔaPI). The individual risk is obtained by projecting the vertical line from the total points line to the bottom scale of the prediction probability. Changes of PI from affected hemisphere were presented as ΔaPI. Abbreviations: ND, neurologic deterioration; ICH, intracerebral hemorrhage; IVH, intraventricular hemorrhage; GCS, Glasgow Coma Scale; PI, pulsatility index. |
Nomogram Validation
A C-index of 0.931 (95% CI: 0.886 to 0.962) was achieved, and a similar C-index (0.916, 95% CI: 0.852 to 0.950) was acquired after 1000 bootstrapping, which indicated good discrimination (C-index >0.75). The ROC curve is presented in Figure 3A. The test of calibration indicated no significant lack of departure (χ2=7.824, P=0.482, HL test), which demonstrated good calibration of the nomogram (Figure 3B). The results of DCA showed that the nomogram yielded net benefits, indicating a good potential for clinical decision making (Figure 4).
 |
Figure 3 Validation of the established nomogram. The AUC of ROC is 0.931 (A), indicating good discrimination. The calibration plot (B) indicates that the nomogram-predicted ND compares very well with the actual outcome. Abbreviations: ROC, receiver operating characteristic curve; AUC, area under the curve; ND, neurologic deterioration. |
 |
Figure 4 DCA for the validation of the established nomogram. The abscissa is the threshold probability, and the ordinate is the net benefit rate. The horizontal black line indicates that all samples were negative and all are not treated, with a net benefit of zero. The oblique gray line indicates that all samples are positive. The net benefit is a backslash with a negative slope. The blue line is the model of nomogram. It indicates that the nomogram yields net benefits. Abbreviation: DCA, decision curve analysis. |
Performance Comparison of Different Prediction Models
The established nomogram was the most accurate prediction model (AUC: 0.931, Sensitivity: 88.46%, and Specificity: 88.37%) compared with the nomogram without CT scan (nomogram excluding hematoma volume) (AUC: 0.713, Sensitivity: 58.33%, and Specificity: 81.40%) or TCD (nomogram excluding ΔaPI) (AUC: 0.729, Sensitivity: 42.31%, and Specificity: 95.35%) (Figure 5). It indicated that the nomogram containing CT or TCD alone could not predict the short-term outcome of ICH accurately.
 |
Figure 5 ROC curves of different models predicting the risk of ND in ICH patients. The established nomogram including CT and TCD was the most accurate prediction model (AUC: 0.931, Sensitivity: 88.46%, and Specificity: 88.37%) compared with the nomogram without CT scan (AUC: 0.713, Sensitivity: 58.33%, and Specificity: 81.40%) and TCD (AUC: 0.729, Sensitivity: 42.31%, and Specificity: 95.35%). Abbreviations: ROC, receiver operating characteristic; AUC, area under the curve; ND, neurologic deterioration; ICH, intracerebral hemorrhage; TCD, transcranial Doppler. |
Discussion
Accurate prediction of the ND after onset is critical to the selection of the optimal treatment and improving the prognosis of ICH patients. The present study revealed that ΔaPI was associated with the ND after onset. Moreover, the multivariate Logistic regression demonstrated that hematoma volume, presence of IVH, GCS, and ΔaPI were the independent prognostic factors of ND. The developed nomogram incorporating ΔaPI showed good performance and yielded net benefits, which might contribute to the clinical outcome of ICH patients.
It is known that one of the intrinsic abilities of the brain is to maintain constant perfusion in the face of changes in blood pressure. Cerebral autoregulation will be diminished in severe head injury, stroke, or space-occupying brain lesions (tumor, hemorrhage), leaving the survived brain tissue unable to withstand the potentially harmful effects of blood pressure changes.20–22 Reinhard et al23 proved that the complications caused by ICH may damage cerebral autoregulation, suggesting worse clinical outcomes. Although cerebral autoregulation is routinely preserved during small to medium-sized ICH,24 the tolerance of each patient to ICP changes is different. The formation of perihemorrhagic edema after ICH is dynamic, may last up to 14 days,25 and may peak in the early as well as in the subacute phase.26 However, changes in the cerebral circulation of ICH patients observed in the neurology department are poorly understood due to a lack of effective follow-up measurements. It makes physicians difficult to accurately administer mannitol for elevated ICP since abuse of mannitol may be unhelpful and harmful. Hence, we predicted the risk of ND within 14 days after onset in our study by detecting the changes of TCD parameters between 1 and 3 days after ICH.
The influence of increased ICP on cerebral blood flow is most obvious in the MCA. MCA supplies about 80% of the blood flow required by the cerebral hemisphere, which basically reflects the supratentorial blood flow in the internal carotid artery. Therefore, bilateral MCAs were monitored in the present study. TCD has been proven by a number of studies to non-invasively assess increased ICP. The progressive increase in ICP affects the Doppler waveform. Typical changes include decreased Vd and increased PI,27–29 which is consistent with the results of this study. We found that on the affected hemisphere, alterations in PI and Vd between the 1st and 3rd day were associated with the ND after onset. However, the alterations in TCD parameters from the unaffected hemisphere were not obvious in ND patients. It revealed that only the alterations of TCD parameters on the affected hemisphere helped predict the occurrence of ND. This interhemispherial difference presumably reflected the ICP gradients associated with compartmentalized mass effect.30,31 It may be due to the sustained obstruction of the subarachnoid space, causing the subarachnoid space pressure to not be completely transmitted from one hemisphere to the other.32 Besides, our study demonstrated that the ΔaPI between 1 and 3 days after onset was a better predictor of ND than mean aPIDay3. It may be because the PI value is numerically too small to directly observe the difference from the 1st day, while the change expressed as a percentage is easier to reveal the difference.
Except for ΔaPI, the multivariate Logistic regression in the present study revealed that hematoma volume, presence of IVH, and GCS were independently associated with the risk of ND, which was consistent with the findings of previous reports.33–35 ICH patients with greater hematoma volume, larger GCS, and presence of IVH on admission were more likely to occur ND after onset. We here established a nomogram with high predictive accuracy for the identification of patients with ND after ICH. Good discrimination and calibration were verified and it yielded net benefits. Further performance comparisons of different prediction models found that only the established nomogram could predict the short-term outcome of ICH accurately while the nomogram including CT or TCD alone could not. It allows a customized decision on the treatment of ICH patients managed in the neurology department. The sum of the scores of each predictor in the nomogram was the estimated risk of ND within 14 days after onset. For example, the total point of a 60-year-old ICH patient, presented IVH (45 points), with hematoma volume equal to 24 cm3 (40 points), GCS equal to 10 points (70 points), and ΔaPI equal to 12% (68 points), is about 220 points, which indicates that the probability of ND within 14 days after onset is about 70%. The nomogram robustly identified patients with ND within 14 days after onset, thus facilitating routine management in latter by saving unnecessary surgical evacuation or repeated CT imaging.
Some limitations should be addressed in this study. First, the nomogram has not been externally validated in different hospitals since it is a single-center study with a limited sample size. Second, we only included mild-to-moderate ICH patients with a suitable temporal acoustic bony window, and excluded patients requiring surgery, which might yield a particular selection bias and affect the performance of the developed nomogram. Third, the interobserver variability was not assessed since all measurements were performed by the same investigator. Therefore, a well-designed multi-center study combined with TCD monitoring with a larger sample is needed in the future.
Conclusion
In conclusion, our study demonstrated that ΔaPI was independently associated with the ND after onset in ICH patients. The established nomogram incorporating ΔaPI might be useful in predicting the risk of ND within 14 days after onset. It delivered a pragmatic model, which might be able to identify patients in the neurology department in need of further care. In the future, it may hint toward a time- and cost-effective patient care in a clinical setting.
Data Sharing Statement
The data during the current study are available from the corresponding author on reasonable request.
Ethical Approval
Ethical approval for the study was obtained from the ethics committee of Shanghai Punan Hospital of Pudong New District.
Informed Consent
Written informed consents were obtained from all patients.
Author Contributions
Study design: Huili Kang, Qiuqiong Cai, and Ying Wang.
Data collection and analysis: Huili Kang, Qiuqiong Cai, and Liang Gong
Supervision: Liang Gong and Ying Wang
Statistics: Huili Kang, Qiuqiong Cai, and Liang Gong
Manuscript writing: Huili Kang, Qiuqiong Cai, Liang Gong, and Ying Wang
Manuscript revision: Huili Kang, Qiuqiong Cai, Liang Gong, and Ying Wang
Approval of the manuscript: all authors.
All authors made a significant contribution to the work reported, whether that is in the conception, study design, execution, acquisition of data, analysis and interpretation, or in all these areas; took part in drafting, revising or critically reviewing the article; gave final approval of the version to be published; have agreed on the journal to which the article has been submitted; and agree to be accountable for all aspects of the work. Huili Kang and Qiuqiong Cai are co-first authors.
Funding
The Outstanding Clinical Discipline Project of Shanghai Pudong (PWYgy2018-04); Construction of Shanghai key specialty in medicine (neurosurgery) (ZK2019C07).
Disclosure
The authors declare that they have no conflict of interest.
References
1. Veltkamp R, Purrucker J. Management of spontaneous intracerebral hemorrhage. Curr Neurol Neurosci Rep. 2017;17(10):80. doi:10.1007/s11910-017-0783-5
2. Liu L, Wang D, Wong KS, Wang Y. Stroke and stroke care in China: huge burden, significant workload, and a national priority. Stroke. 2011;42(12):3651–3654. doi:10.1161/strokeaha.111.635755
3. Delgado Almandoz JE, Yoo AJ, Stone MJ, et al. The spot sign score in primary intracerebral hemorrhage identifies patients at highest risk of in-hospital mortality and poor outcome among survivors. Stroke. 2010;41(1):54–60. doi:10.1161/strokeaha.109.565382
4. Dowlatshahi D, Demchuk AM, Flaherty ML, Ali M, Lyden PL, Smith EE. Defining hematoma expansion in intracerebral hemorrhage: relationship with patient outcomes. Neurology. 2011;76(14):1238–1244. doi:10.1212/WNL.0b013e3182143317
5. Cordonnier C, Demchuk A, Ziai W, Anderson CS. Intracerebral haemorrhage: current approaches to acute management. Lancet. 2018;392(10154):1257–1268. doi:10.1016/s0140-6736(18)31878-6
6. Fink ME. Osmotherapy for intracranial hypertension: mannitol versus hypertonic saline. Continuum (Minneap Minn). 2012;18(3):640–654. doi:10.1212/01.CON.0000415432.84147.1e
7. Witherspoon B, Ashby NE. The use of mannitol and hypertonic saline therapies in patients with elevated intracranial pressure: a review of the evidence. Nurs Clin North Am. 2017;52(2):249–260. doi:10.1016/j.cnur.2017.01.002
8. Ropper AE, Chi JH. Treatment of traumatic brain injury without direct intracranial pressure monitoring. Neurosurgery. 2013;72(4):N19–20. doi:10.1227/01.neu.0000428424.83867.87
9. Bellner J, Romner B, Reinstrup P, Kristiansson KA, Ryding E, Brandt L. Transcranial Doppler sonography pulsatility index (PI) reflects intracranial pressure (ICP). Surg Neurol. 2004;62(1):
10. Harary M, Dolmans RGF, Gormley WB. Intracranial pressure monitoring-review and avenues for development. Sensors (Basel). 2018;18(2):465. doi:10.3390/s18020465
11. Lietke S, Zausinger S, Patzig M, Holtmanspötter M, Kunz M. CT-based classification of acute cerebral edema: association with intracranial pressure and outcome. J Neuroimaging. 2020;30(5):640–647. doi:10.1111/jon.12736
12. Martí-Fàbregas J, Belvís R, Guàrdia E, Cocho D, Martí-Vilalta JL. Relationship between transcranial Doppler and CT data in acute intracerebral hemorrhage. AJNR Am J Neuroradiol. 2005;26(1):113–118.
13. Kiphuth IC, Huttner HB, Dörfler A, Schwab S, Köhrmann M. Doppler pulsatility index in spontaneous intracerebral hemorrhage. Eur Neurol. 2013;70(3–4):133–138. doi:10.1159/000350815
14. McDonnell MN, Berry NM, Cutting MA, Keage HA, Buckley JD, Howe PR. Transcranial Doppler ultrasound to assess cerebrovascular reactivity: reliability, reproducibility and effect of posture. PeerJ. 2013;1:e65. doi:10.7717/peerj.65
15. Robba C, Pozzebon S, Moro B, Vincent JL, Creteur J, Taccone FS. Multimodal non-invasive assessment of intracranial hypertension: an observational study. Crit Care. 2020;24(1):379. doi:10.1186/s13054-020-03105-z
16. Yu SX, Zhang QS, Yin Y, Liu Z, Wu JM, Yang MX. Continuous monitoring of intracranial pressure for prediction of postoperative complications of hypertensive intracerebral hemorrhage. Eur Rev Med Pharmacol Sci. 2016;20(22):4750–4755.
17. Kirkness CJ, Burr RL, Mitchell PH. Intracranial pressure variability and long-term outcome following traumatic brain injury. Acta Neurochir Suppl. 2008;102:105–108. doi:10.1007/978-3-211-85578-2_21
18. Burr RL, Kirkness CJ, Mitchell PH. Detrended fluctuation analysis of intracranial pressure predicts outcome following traumatic brain injury. IEEE Trans Biomed Eng. 2008;55(11):2509–2518. doi:10.1109/tbme.2008.2001286
19. Tada A, Hisada K, Suzuki T, Kadoya S. [Measurement volume of intracranial hematoma by computed tomography (author’s transl)]. No Shinkei Geka. 1981;9(3):251–256. Japanese.
20. Schramm P, Klein KU, Pape M, et al. Serial measurement of static and dynamic cerebrovascular autoregulation after brain injury. J Neurosurg Anesthesiol. 2011;23(1):41–44. doi:10.1097/ANA.0b013e3181f35854
21. Diedler J, Sykora M, Rupp A, et al. Impaired cerebral vasomotor activity in spontaneous intracerebral hemorrhage. Stroke. 2009;40(3):815–819. doi:10.1161/strokeaha.108.531020
22. Aries MJ, Elting JW, De Keyser J, Kremer BP, Vroomen PC. Cerebral autoregulation in stroke: a review of transcranial Doppler studies. Stroke. 2010;41(11):2697–2704. doi:10.1161/strokeaha.110.594168
23. Reinhard M, Neunhoeffer F, Gerds TA, et al. Secondary decline of cerebral autoregulation is associated with worse outcome after intracerebral hemorrhage. Intensive Care Med. 2010;36(2):264–271. doi:10.1007/s00134-009-1698-7
24. Powers WJ, Zazulia AR, Videen TO, et al. Autoregulation of cerebral blood flow surrounding acute (6 to 22 hours) intracerebral hemorrhage. Neurology. 2001;57(1):18–24. doi:10.1212/wnl.57.1.18
25. Butcher KS, Baird T, MacGregor L, Desmond P, Tress B, Davis S. Perihematomal edema in primary intracerebral hemorrhage is plasma derived. Stroke. 2004;35(8):1879–1885. doi:10.1161/01.STR.0000131807.54742.1a
26. Venkatasubramanian C, Mlynash M, Finley-Caulfield A, et al. Natural history of perihematomal edema after intracerebral hemorrhage measured by serial magnetic resonance imaging. Stroke. 2011;42(1):73–80. doi:10.1161/strokeaha.110.590646
27. Klingelhöfer J, Conrad B, Benecke R, Sander D, Markakis E. Evaluation of intracranial pressure from transcranial Doppler studies in cerebral disease. J Neurol. 1988;235(3):159–162. doi:10.1007/bf00314307
28. Fülesdi B, Réka Kovács K, Bereczki D, Bágyi P, Fekete I, Csiba L. Computed tomography and transcranial Doppler findings in acute and subacute phases of intracerebral hemorrhagic stroke. J Neuroimaging. 2014;24(2):124–130. doi:10.1111/j.1552-6569.2012.00776.x
29. Chen Y, Xu W, Wang L, et al. Transcranial Doppler combined with quantitative EEG brain function monitoring and outcome prediction in patients with severe acute intracerebral hemorrhage. Crit Care. 2018;22(1):36. doi:10.1186/s13054-018-1951-y
30. Cardoso ER, Kupchak JA. Evaluation of intracranial pressure gradients by means of transcranial Doppler sonography. Acta Neurochir Suppl (Wien). 1992;55:1–5. doi:10.1007/978-3-7091-9233-7_1
31. Wang W, Yang Z, Liu L, et al. Relationship between transcranial Doppler variables in acute stage and outcome of intracerebral hemorrhage. Neurol Res. 2011;33(5):487–493. doi:10.1179/016164111x13007856084089
32. Weaver DD, Winn HR, Jane JA. Differential intracranial pressure in patients with unilateral mass lesions. J Neurosurg. 1982;56(5):660–665. doi:10.3171/jns.1982.56.5.0660
33. Hårdemark HG, Wesslén N, Persson L. Influence of clinical factors, CT findings and early management on outcome in supratentorial intracerebral hemorrhage. Cerebrovasc Dis. 1999;9(1):10–21. doi:10.1159/000015890
34. Qureshi AI, Safdar K, Weil J, et al. Predictors of early deterioration and mortality in black Americans with spontaneous intracerebral hemorrhage. Stroke. 1995;26(10):1764–1767. doi:10.1161/01.str.26.10.1764
35. Daverat P, Castel JP, Dartigues JF, Orgogozo JM. Death and functional outcome after spontaneous intracerebral hemorrhage. A prospective study of 166 cases using multivariate analysis. Stroke. 1991;22(1):1–6. doi:10.1161/01.str.22.1.1
 © 2021 The Author(s). This work is published and licensed by Dove Medical Press Limited. The full terms of this license are available at https://www.dovepress.com/terms.php and incorporate the Creative Commons Attribution - Non Commercial (unported, v3.0) License.
By accessing the work you hereby accept the Terms. Non-commercial uses of the work are permitted without any further permission from Dove Medical Press Limited, provided the work is properly attributed. For permission for commercial use of this work, please see paragraphs 4.2 and 5 of our Terms.
© 2021 The Author(s). This work is published and licensed by Dove Medical Press Limited. The full terms of this license are available at https://www.dovepress.com/terms.php and incorporate the Creative Commons Attribution - Non Commercial (unported, v3.0) License.
By accessing the work you hereby accept the Terms. Non-commercial uses of the work are permitted without any further permission from Dove Medical Press Limited, provided the work is properly attributed. For permission for commercial use of this work, please see paragraphs 4.2 and 5 of our Terms.